Article

Changing Climatic Conditions in Czechia Require Adaptation Measures in Agriculture

1
Czech Hydrometeorological Institute, Department of Biometeorological Applications, Na Sabatce 17, 143 06 Prague, Czech Republic
2
Department of Agroecology and Crop Production, Czech University of Life Sciences Prague, Kamycka 129, 165 00 Prague, Czech Republic
3
Department of Physical Geography and Geoecology, Charles University, Albertov 6, 128 00 Prague, Czech Republic
*
Author to whom correspondence should be addressed.
Climate 2023, 11(10), 210; https://doi.org/10.3390/cli11100210
Submission received: 27 September 2023 / Revised: 16 October 2023 / Accepted: 17 October 2023 / Published: 20 October 2023

Abstract

:
Changes in climatic conditions increase risks associated with crop production in certain regions. Early detection of these changes enables the implementation of suitable adaptation measures in the local area, thereby stabilising agricultural production. Our analysis shows a significant shift in climatic conditions in Czechia between 1961 and 2020. We examined the changes in observed temperature conditions, precipitation distribution, drought occurrences, and frost incidents at a high resolution (0.5 × 0.5 km). The outputs show a significant increase in air temperatures and drought occurrence. Temperature totals above 5 °C in 1991–2020 were 15% higher than in 1961–1990. Furthermore, the relative change in totals above 10 °C was 26% after 1991. Over the last 30 years, drought incidence was four times more frequent than in 1961–1990, particularly in spring. In contrast, no significant changes in the distribution of precipitation occurred, and there was a slight decrease in the probability of frost during the growing season. Ongoing climate change brings warmer and drier conditions to higher-altitude regions in Czechia. Assessing climatic conditions on a global scale is less precise for relatively small and topographically diverse countries like Czechia due to coarse resolution. Therefore, a high-resolution analysis is more appropriate for these countries.

1. Introduction

Ongoing climate change is increasing year-to-year fluctuations in agricultural production. In addition, farms face rising energy and input prices and pressures to maintain sustainable production. Therefore, adaptation measures will serve to stabilise agricultural production under changing climatic conditions while maintaining sustainability. Thus, it is necessary to define certain agrometeorological parameters that indicate the consequences of climate change for crop production [1]. Scientific research is therefore seeking and presenting possible adaptation methods. The quest for solutions encompasses various disciplines, including climate science, agriculture, ecology, and social sciences [2,3,4,5,6].
One of the highly anticipated consequences of climate change regarding agriculture is the alteration of agroclimatic zones—regions characterised by their agroclimatic conditions, which are optimal for cultivating specific crops. Appropriate selection of a suitable growing zone can be one of the measures to stabilise crop yields while maintaining production sustainability. Agroclimatic zoning systematically categorises geographic areas into homogeneous zones based on their climatic conditions and soil characteristics. This categorisation assists agricultural planners, researchers, and policymakers, who are then able to make informed decisions regarding crop selection, land use, and sustainable farming practices. The climate-driven shift in agroclimatic zones has garnered global attention, but at the same time, it is a subject of widespread analysis and discourse [7,8,9,10,11,12,13,14,15,16]. The need to adapt agriculture to changing climatic conditions is evident and closely tied to the necessity of understanding how agroclimatic conditions change in specific regions.
In Europe, the observed and projected changes in agroclimatic conditions consist of many variables, such as an increase in air temperature during the vegetation season [17], an expanded area affected by heat stress [9,18], and an increased exposure to severe droughts [18]. Furthermore, an increased frequency of heavy precipitation extremes is also anticipated [19]. A decrease in the area affected by frost [9,20] and a decline in the number of days with snow cover, which may partly counteract the beneficial impact of reducing the frequency of frosts [20], represent other factors negatively contributing to agricultural stability not only in Europe. There is also an increase in pest pressure [20] and an extension of the growing season due to warmer temperatures [21], which, among other factors, increases vegetation exposure and vulnerability to frost, primarily during the spring season [22,23]. In Czechia, despite partial attempts, such as an assessment of changes in selected meteorological elements [24] and shifts in conditions for cultivating specific crops [15], a more detailed analysis of the changes in agroclimatic conditions during 1961–2020 is still lacking.
The main aims of this paper were as follows:
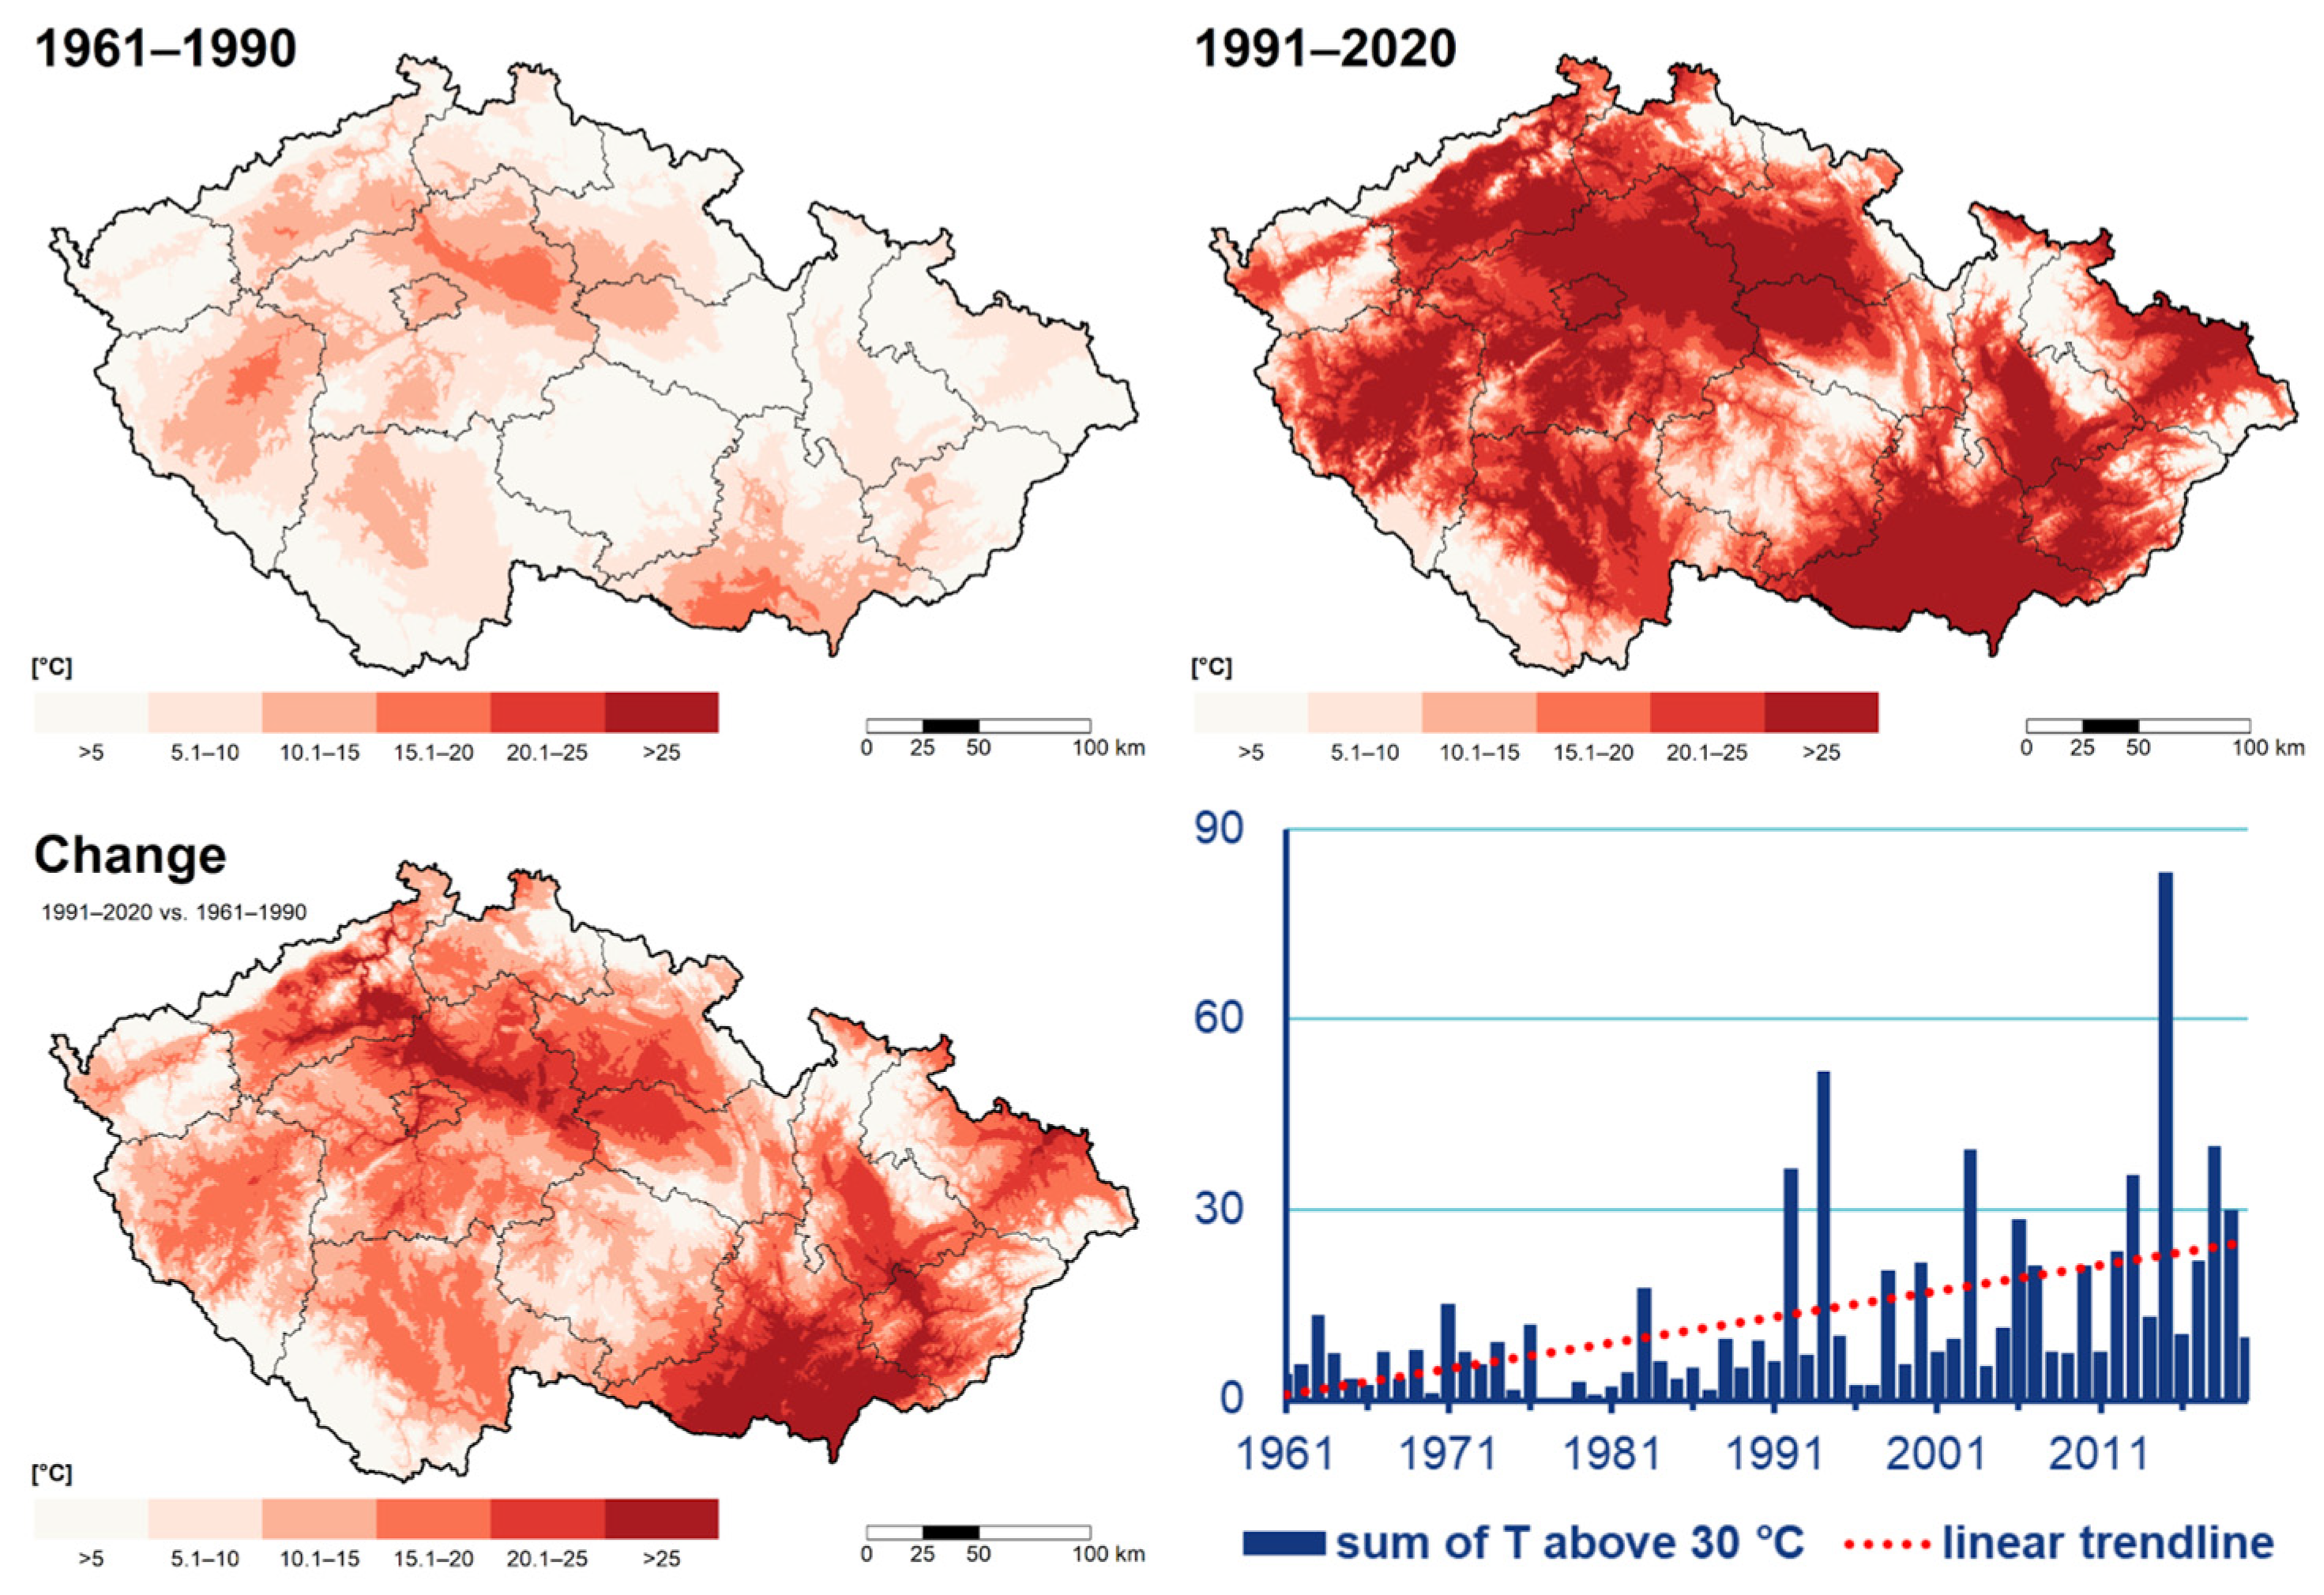
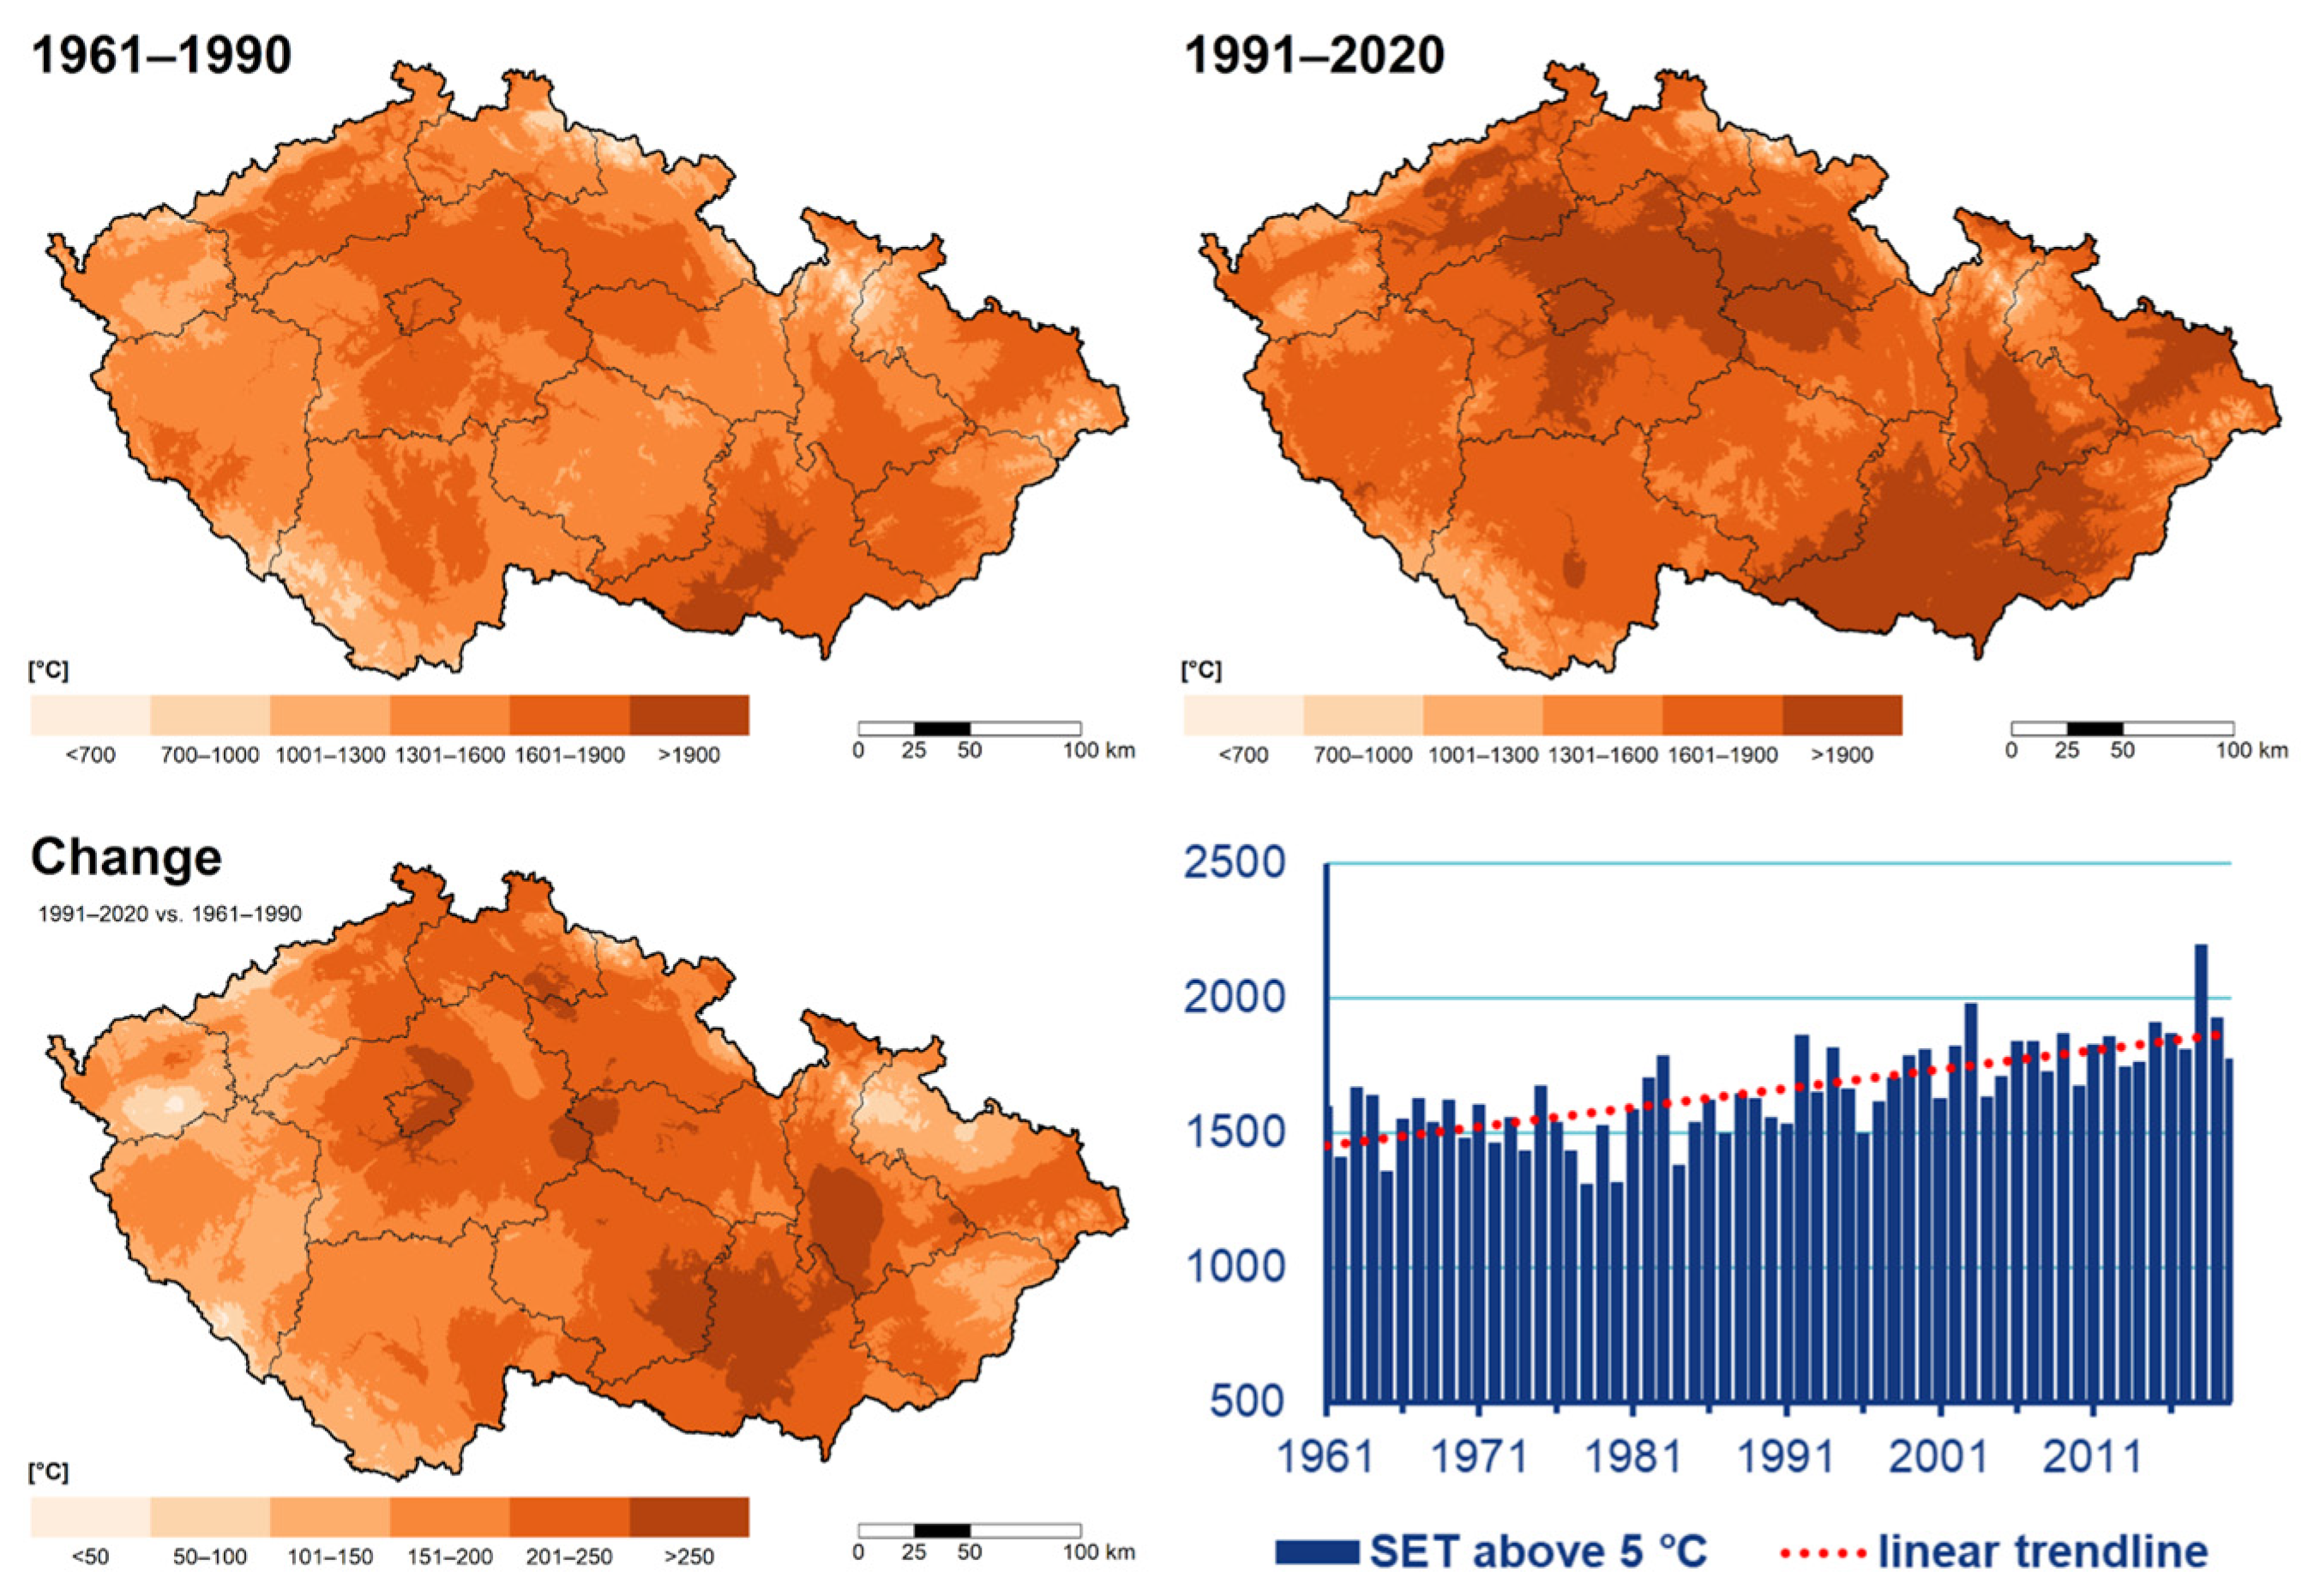
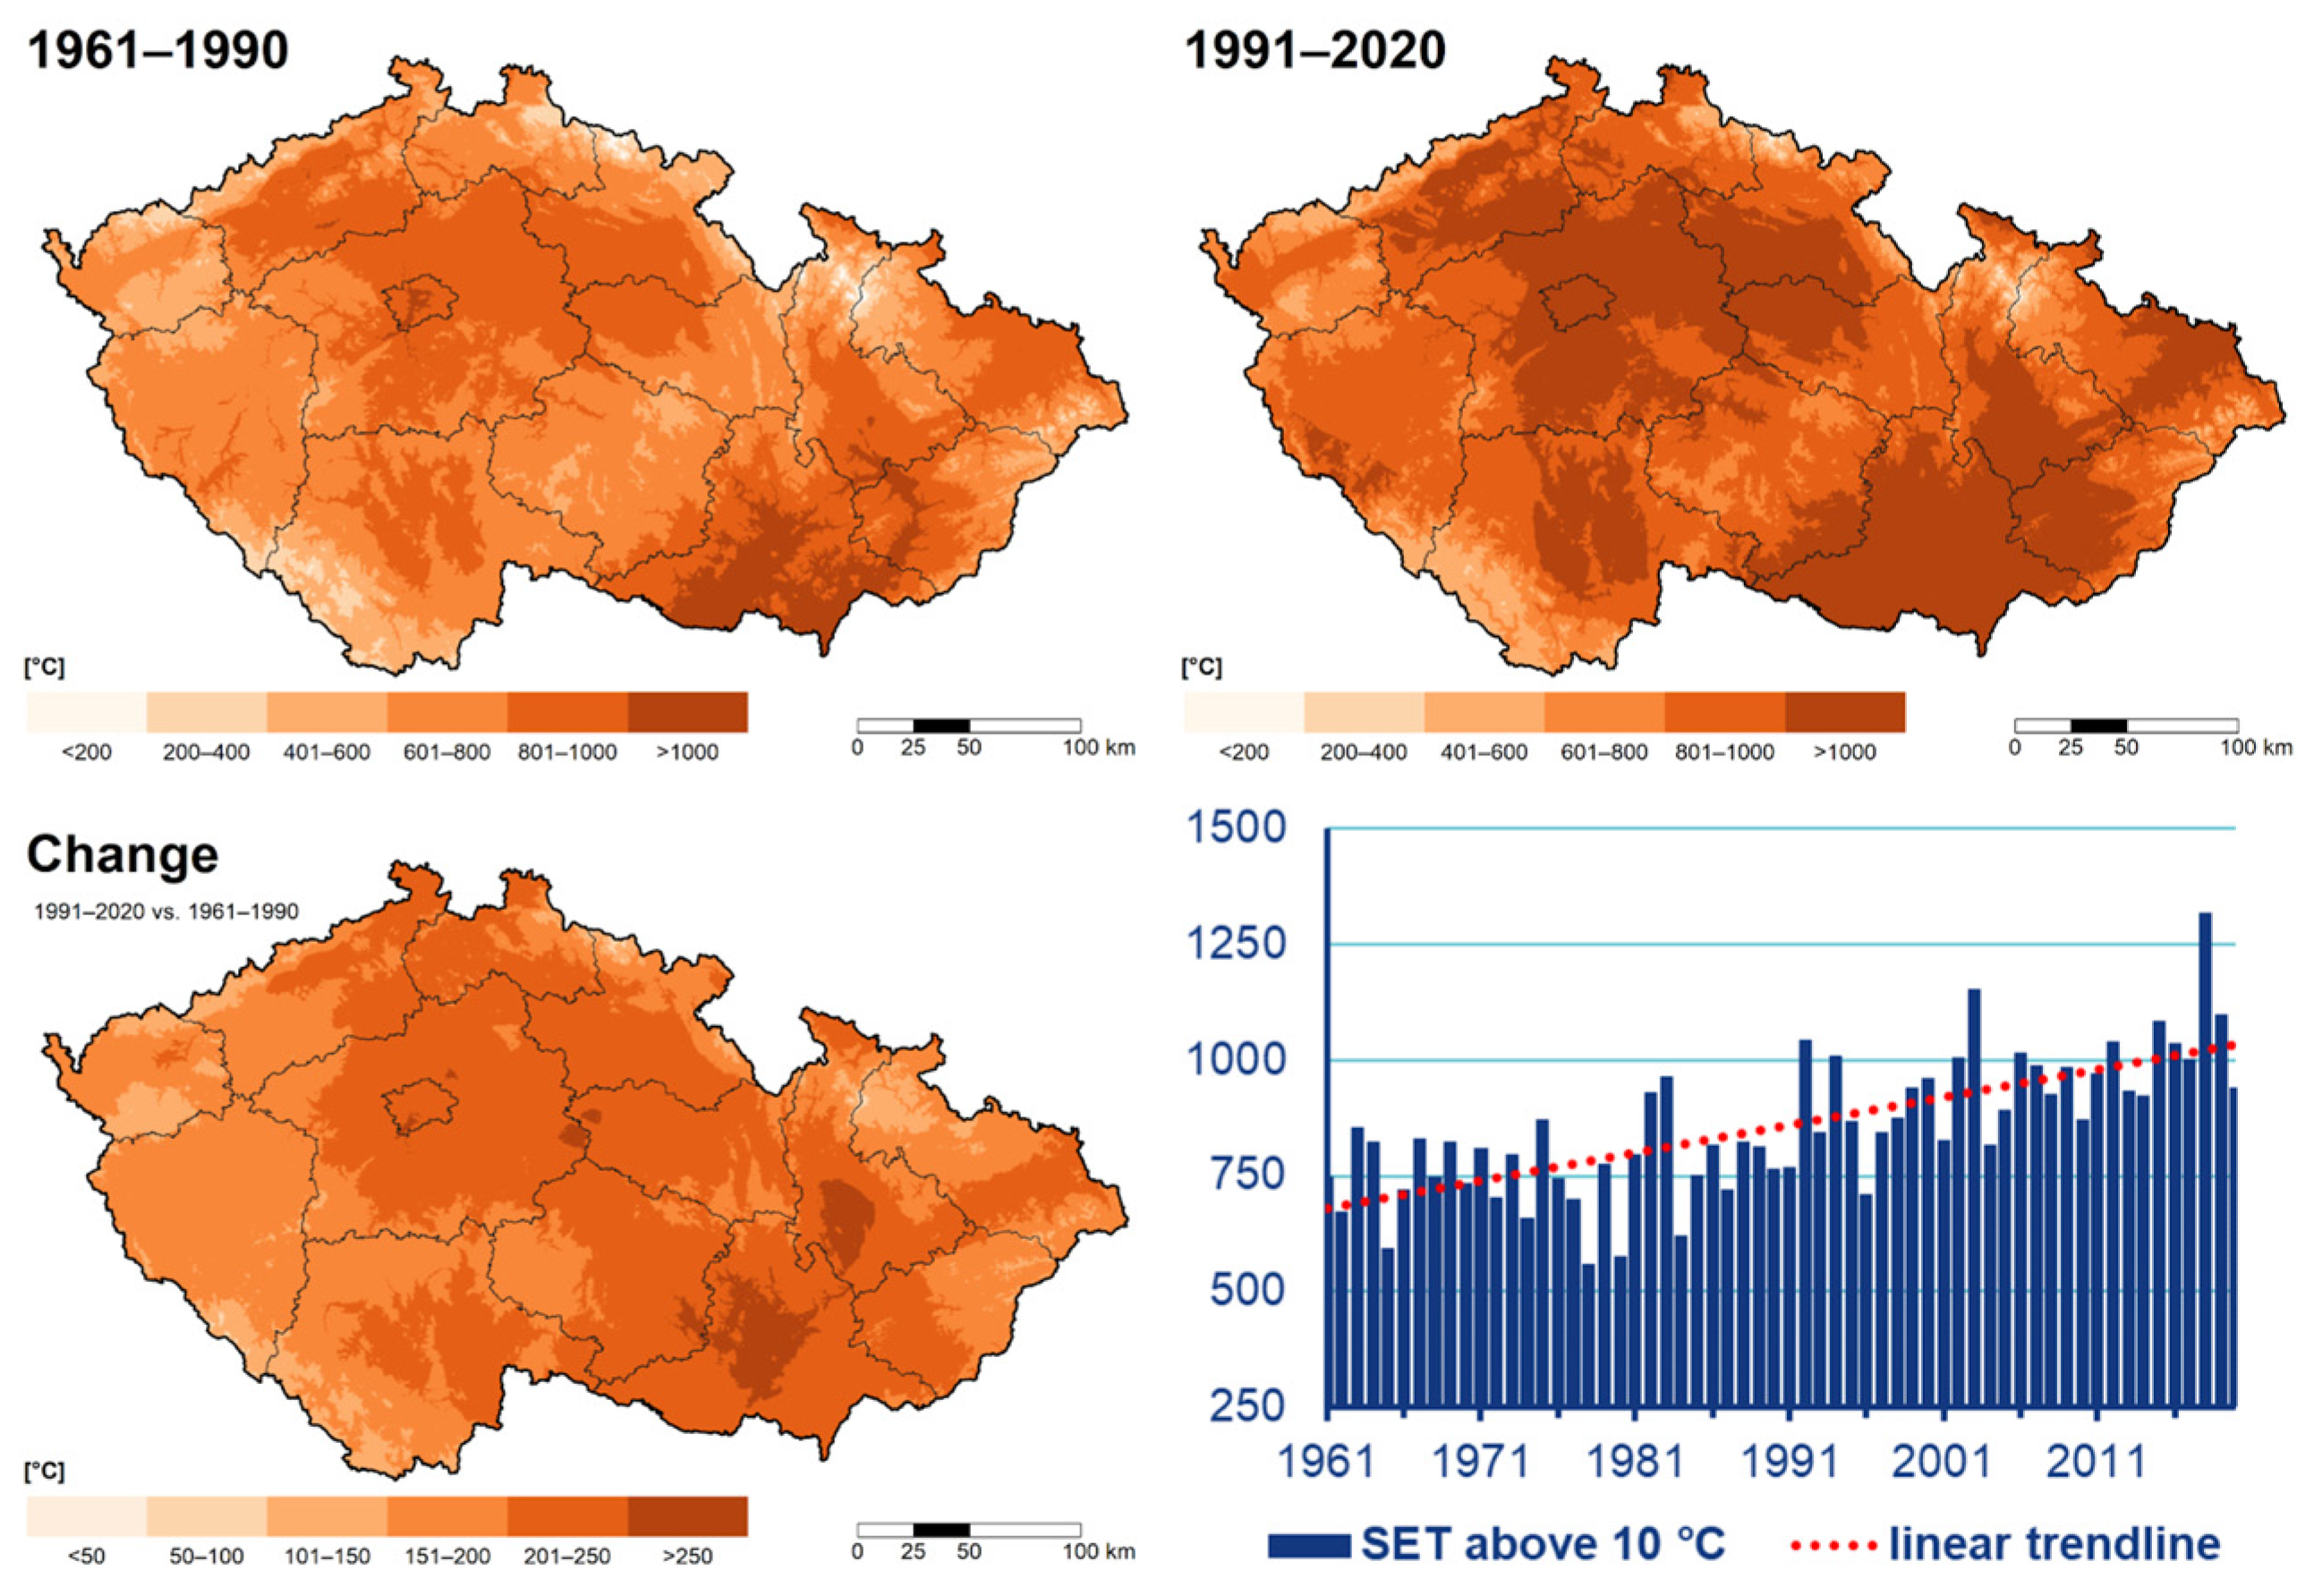
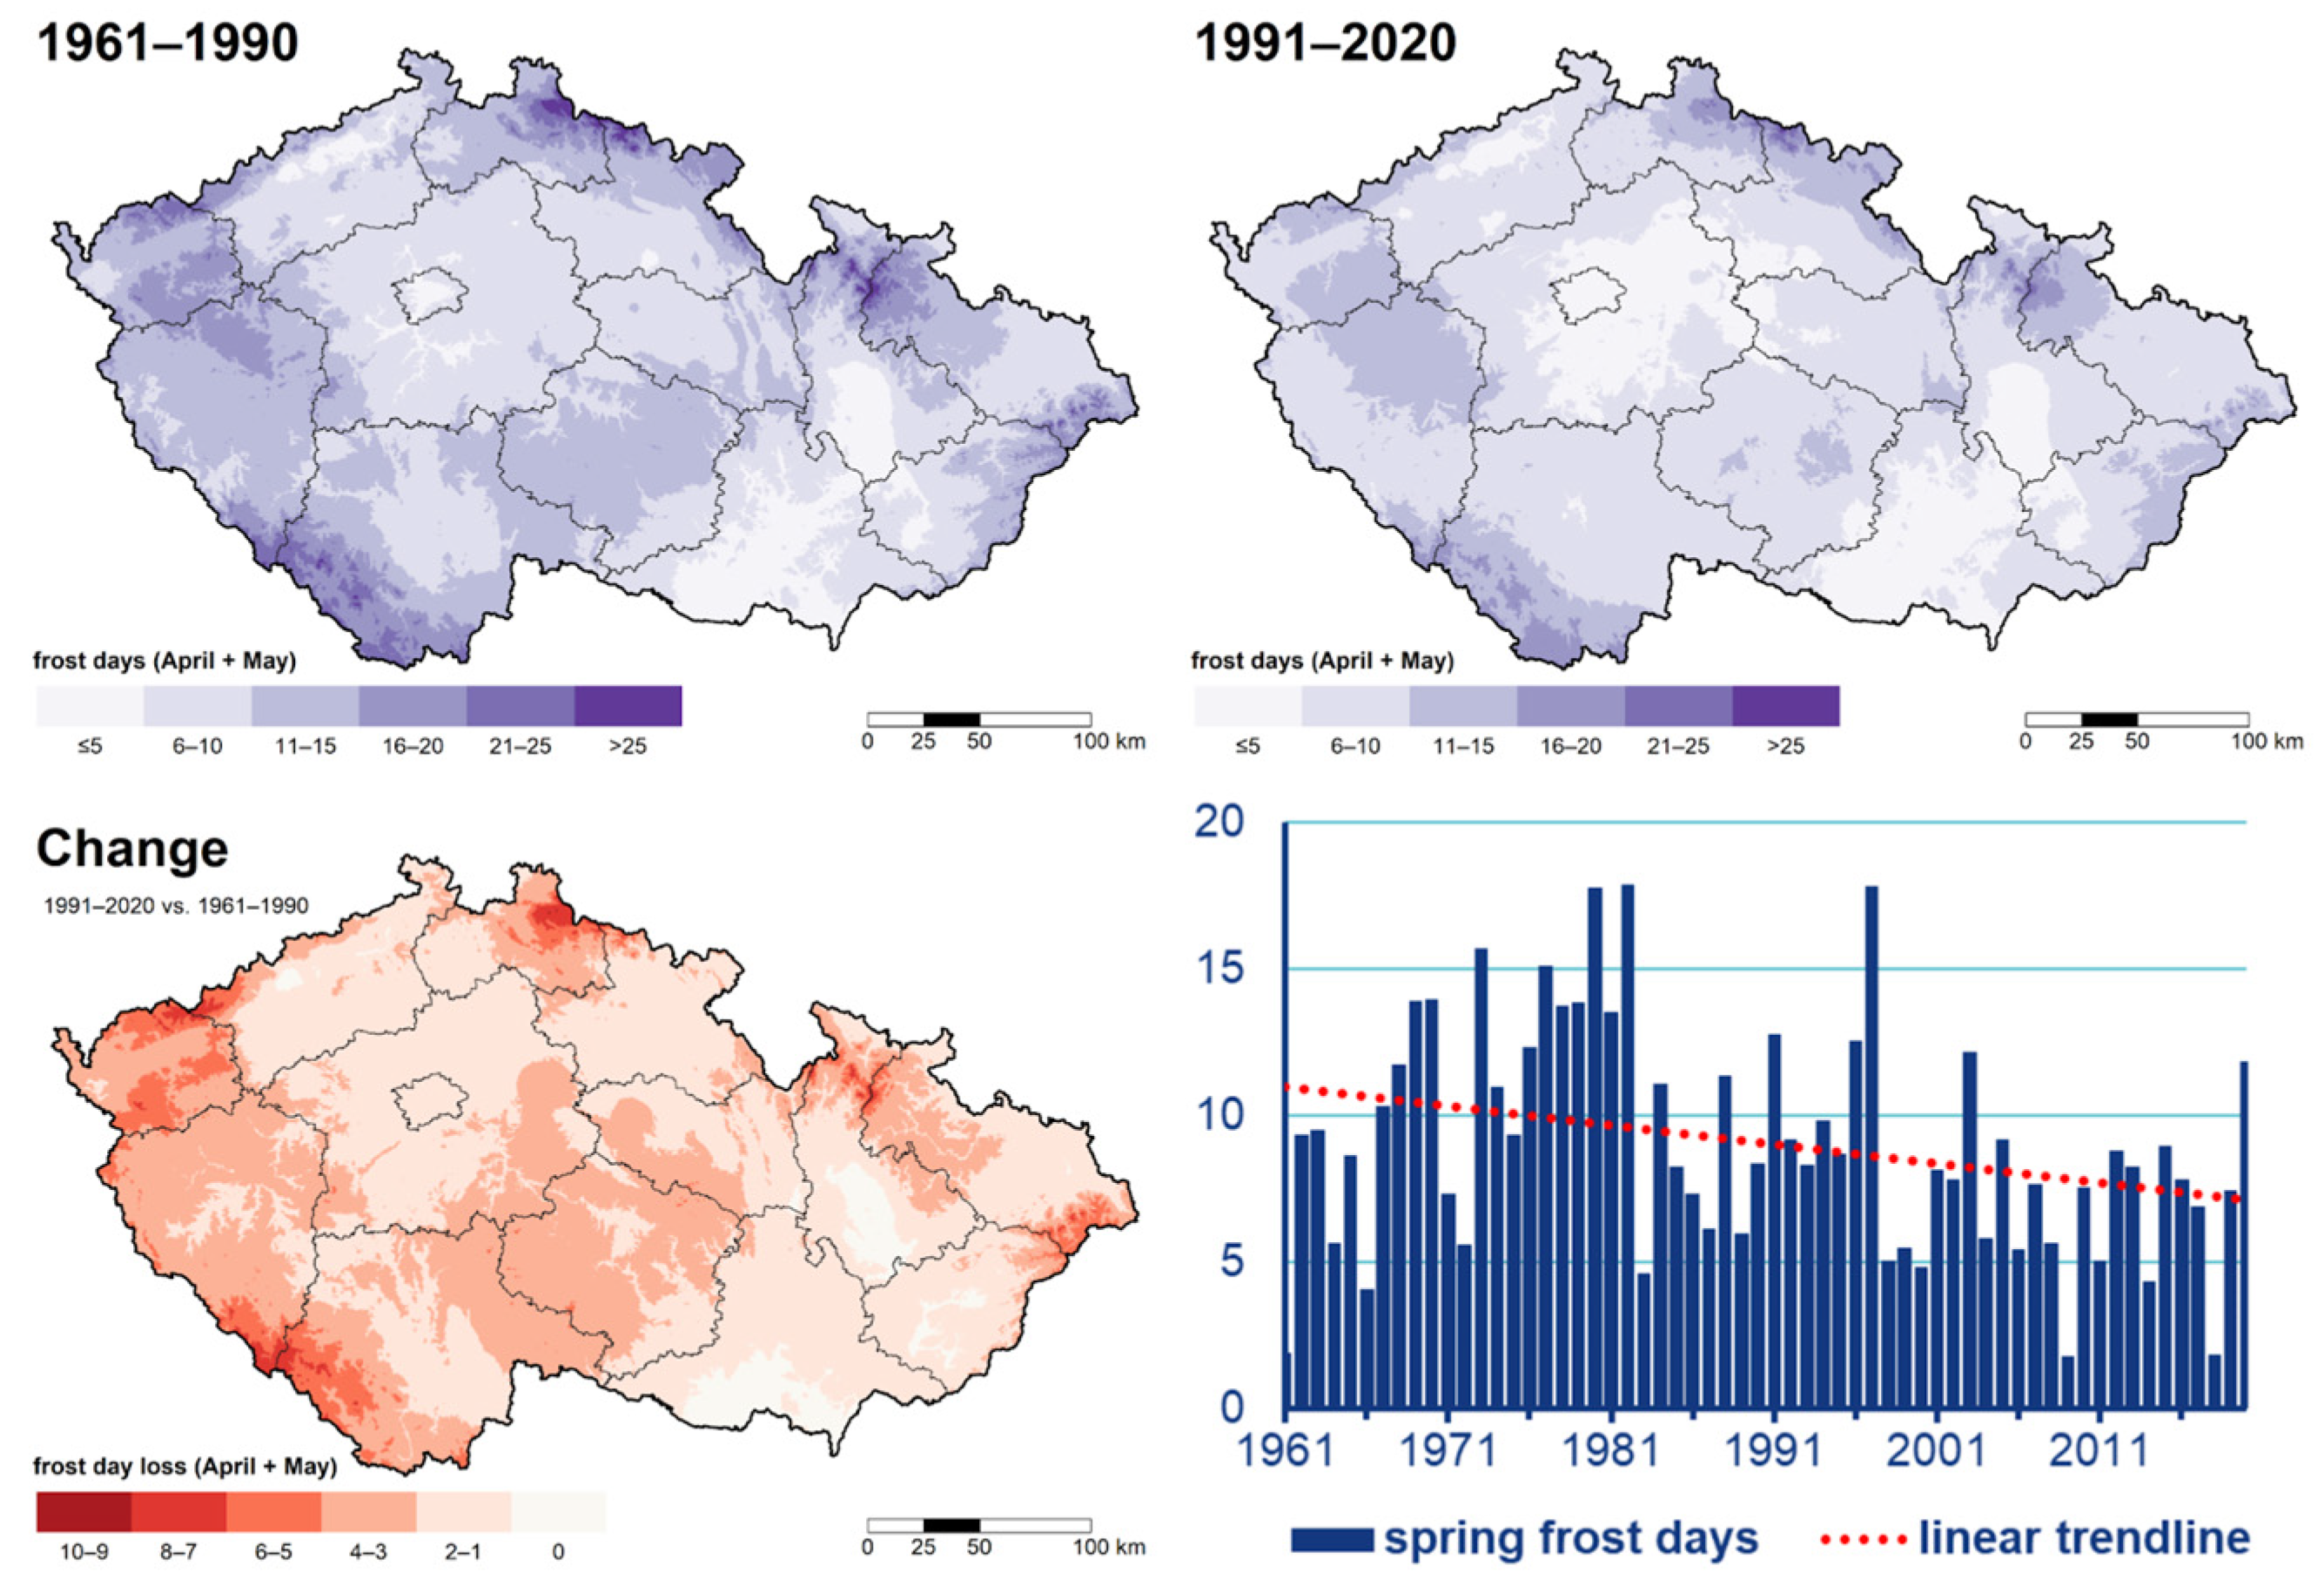
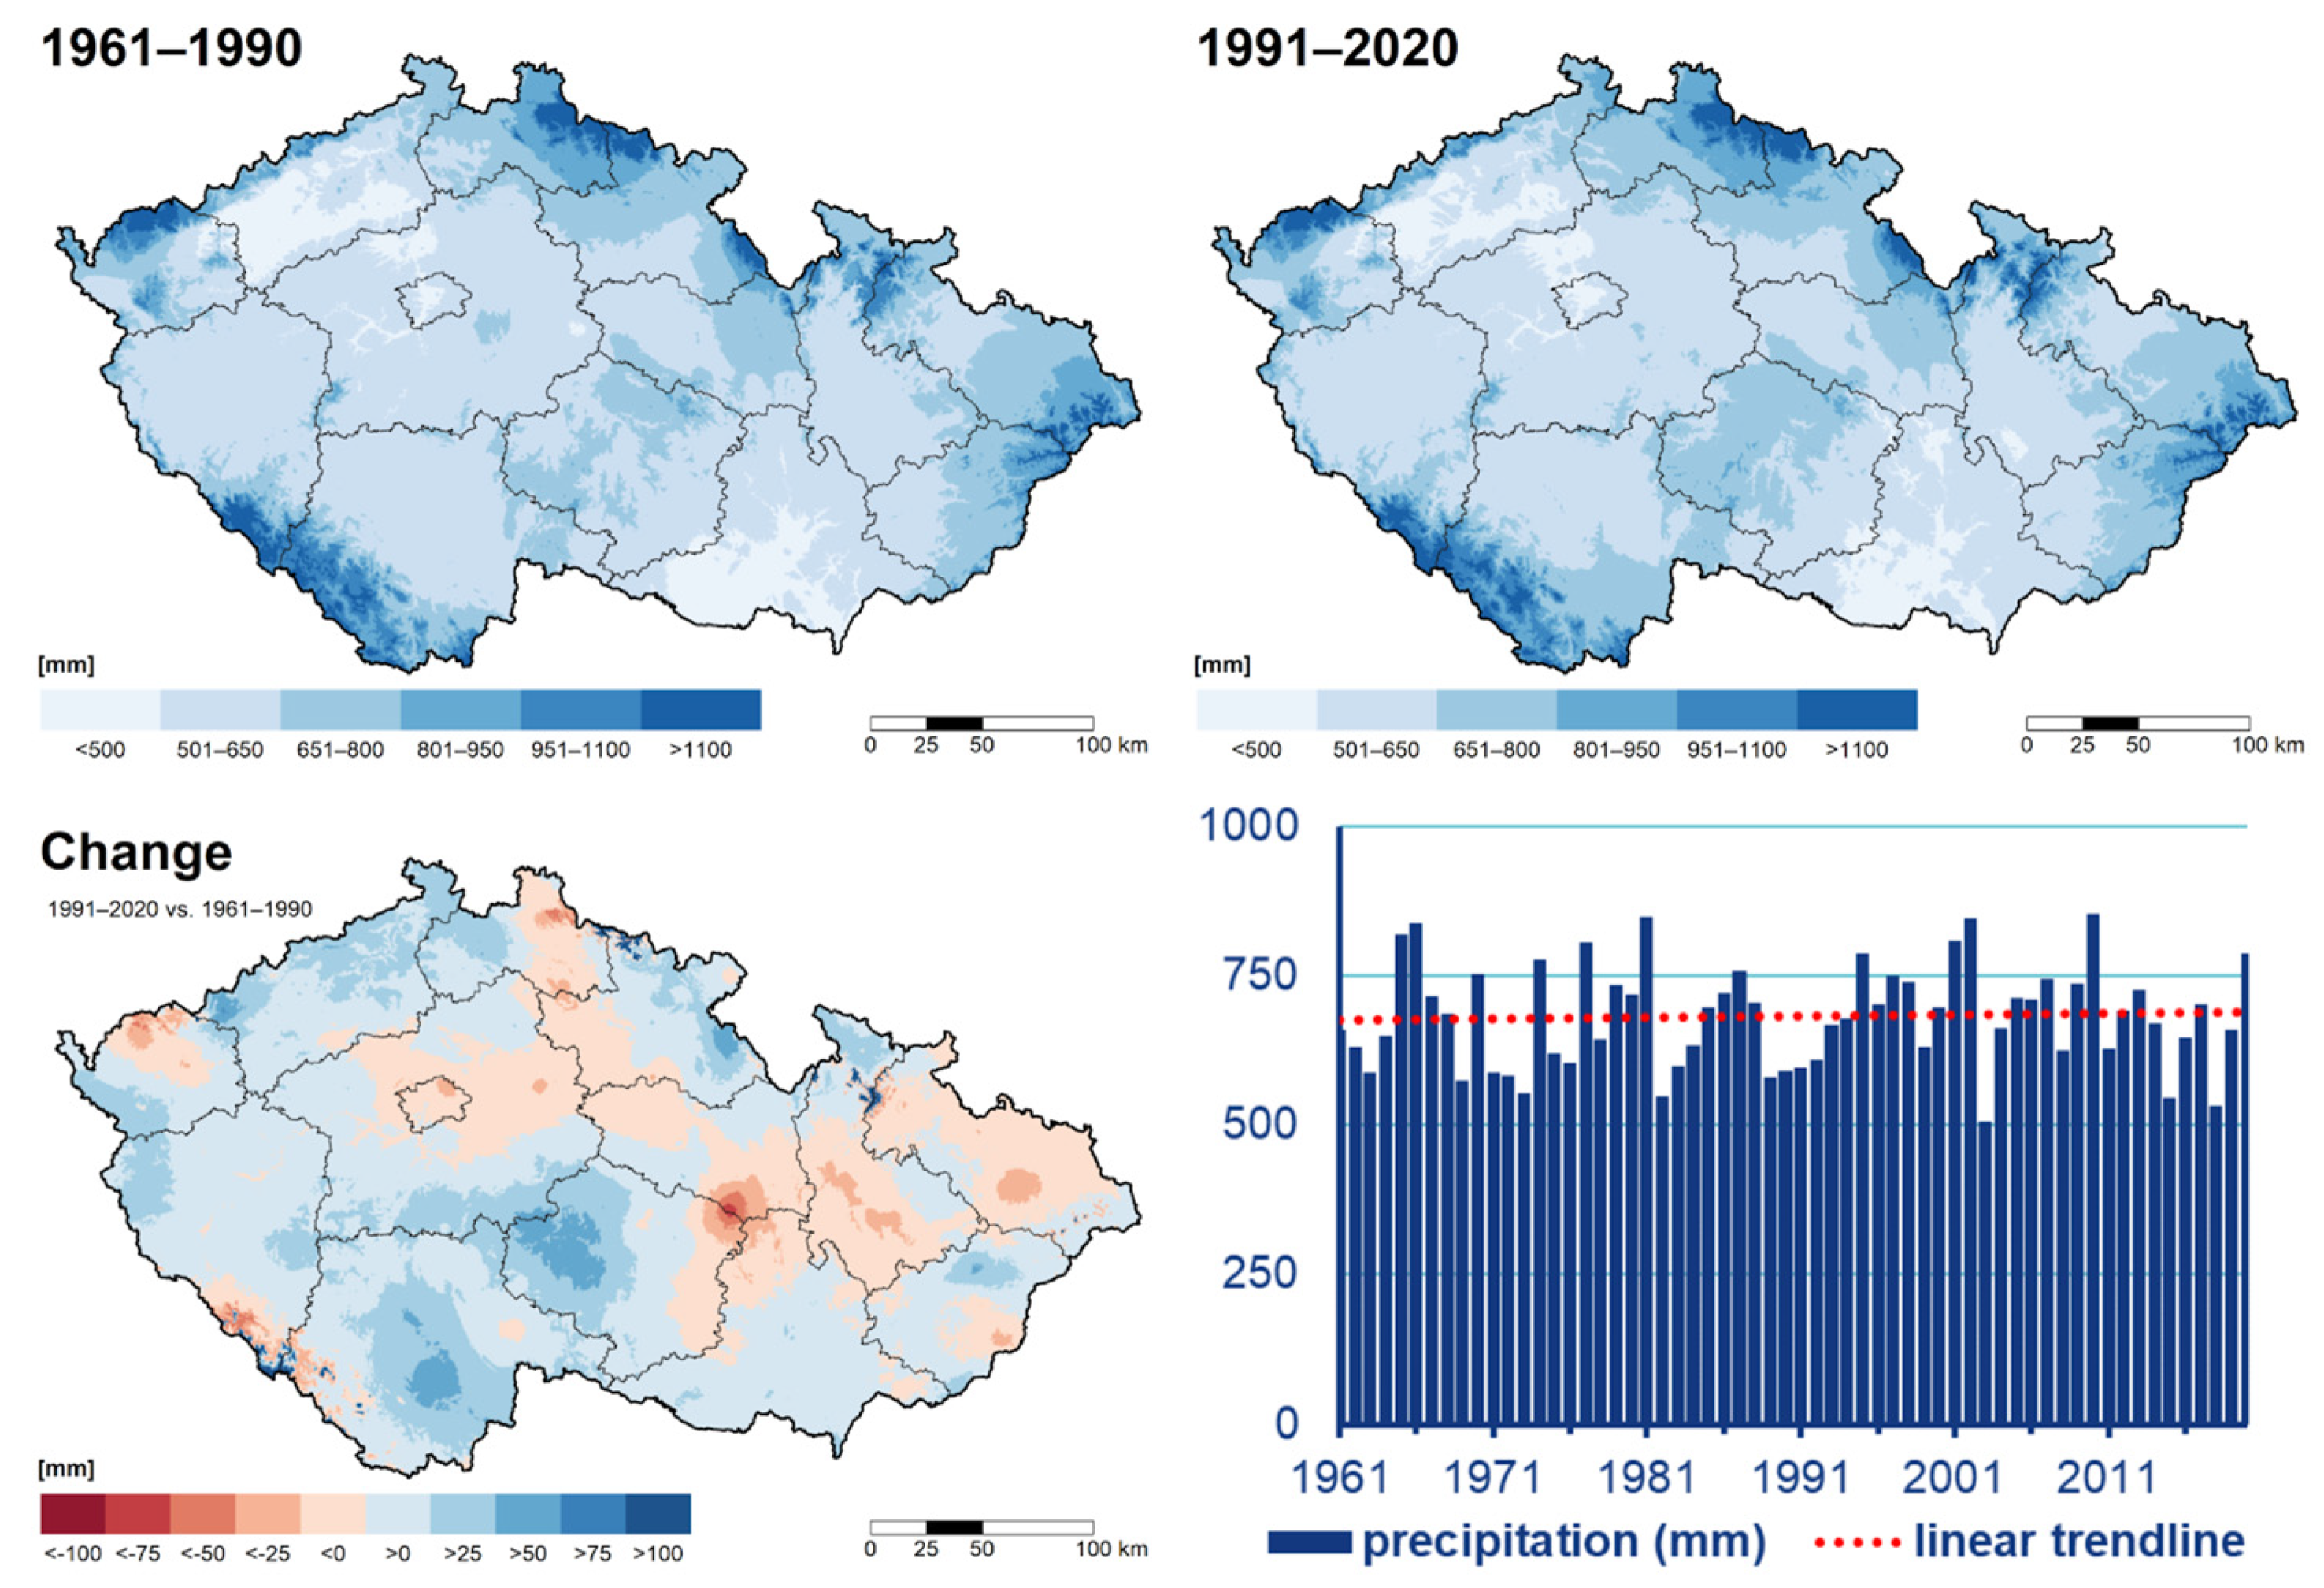
  • To evaluate the temporal variability of essential agroclimatic variables in the reference periods 1961–1990 and 1991–2020 and compare the differences between them.
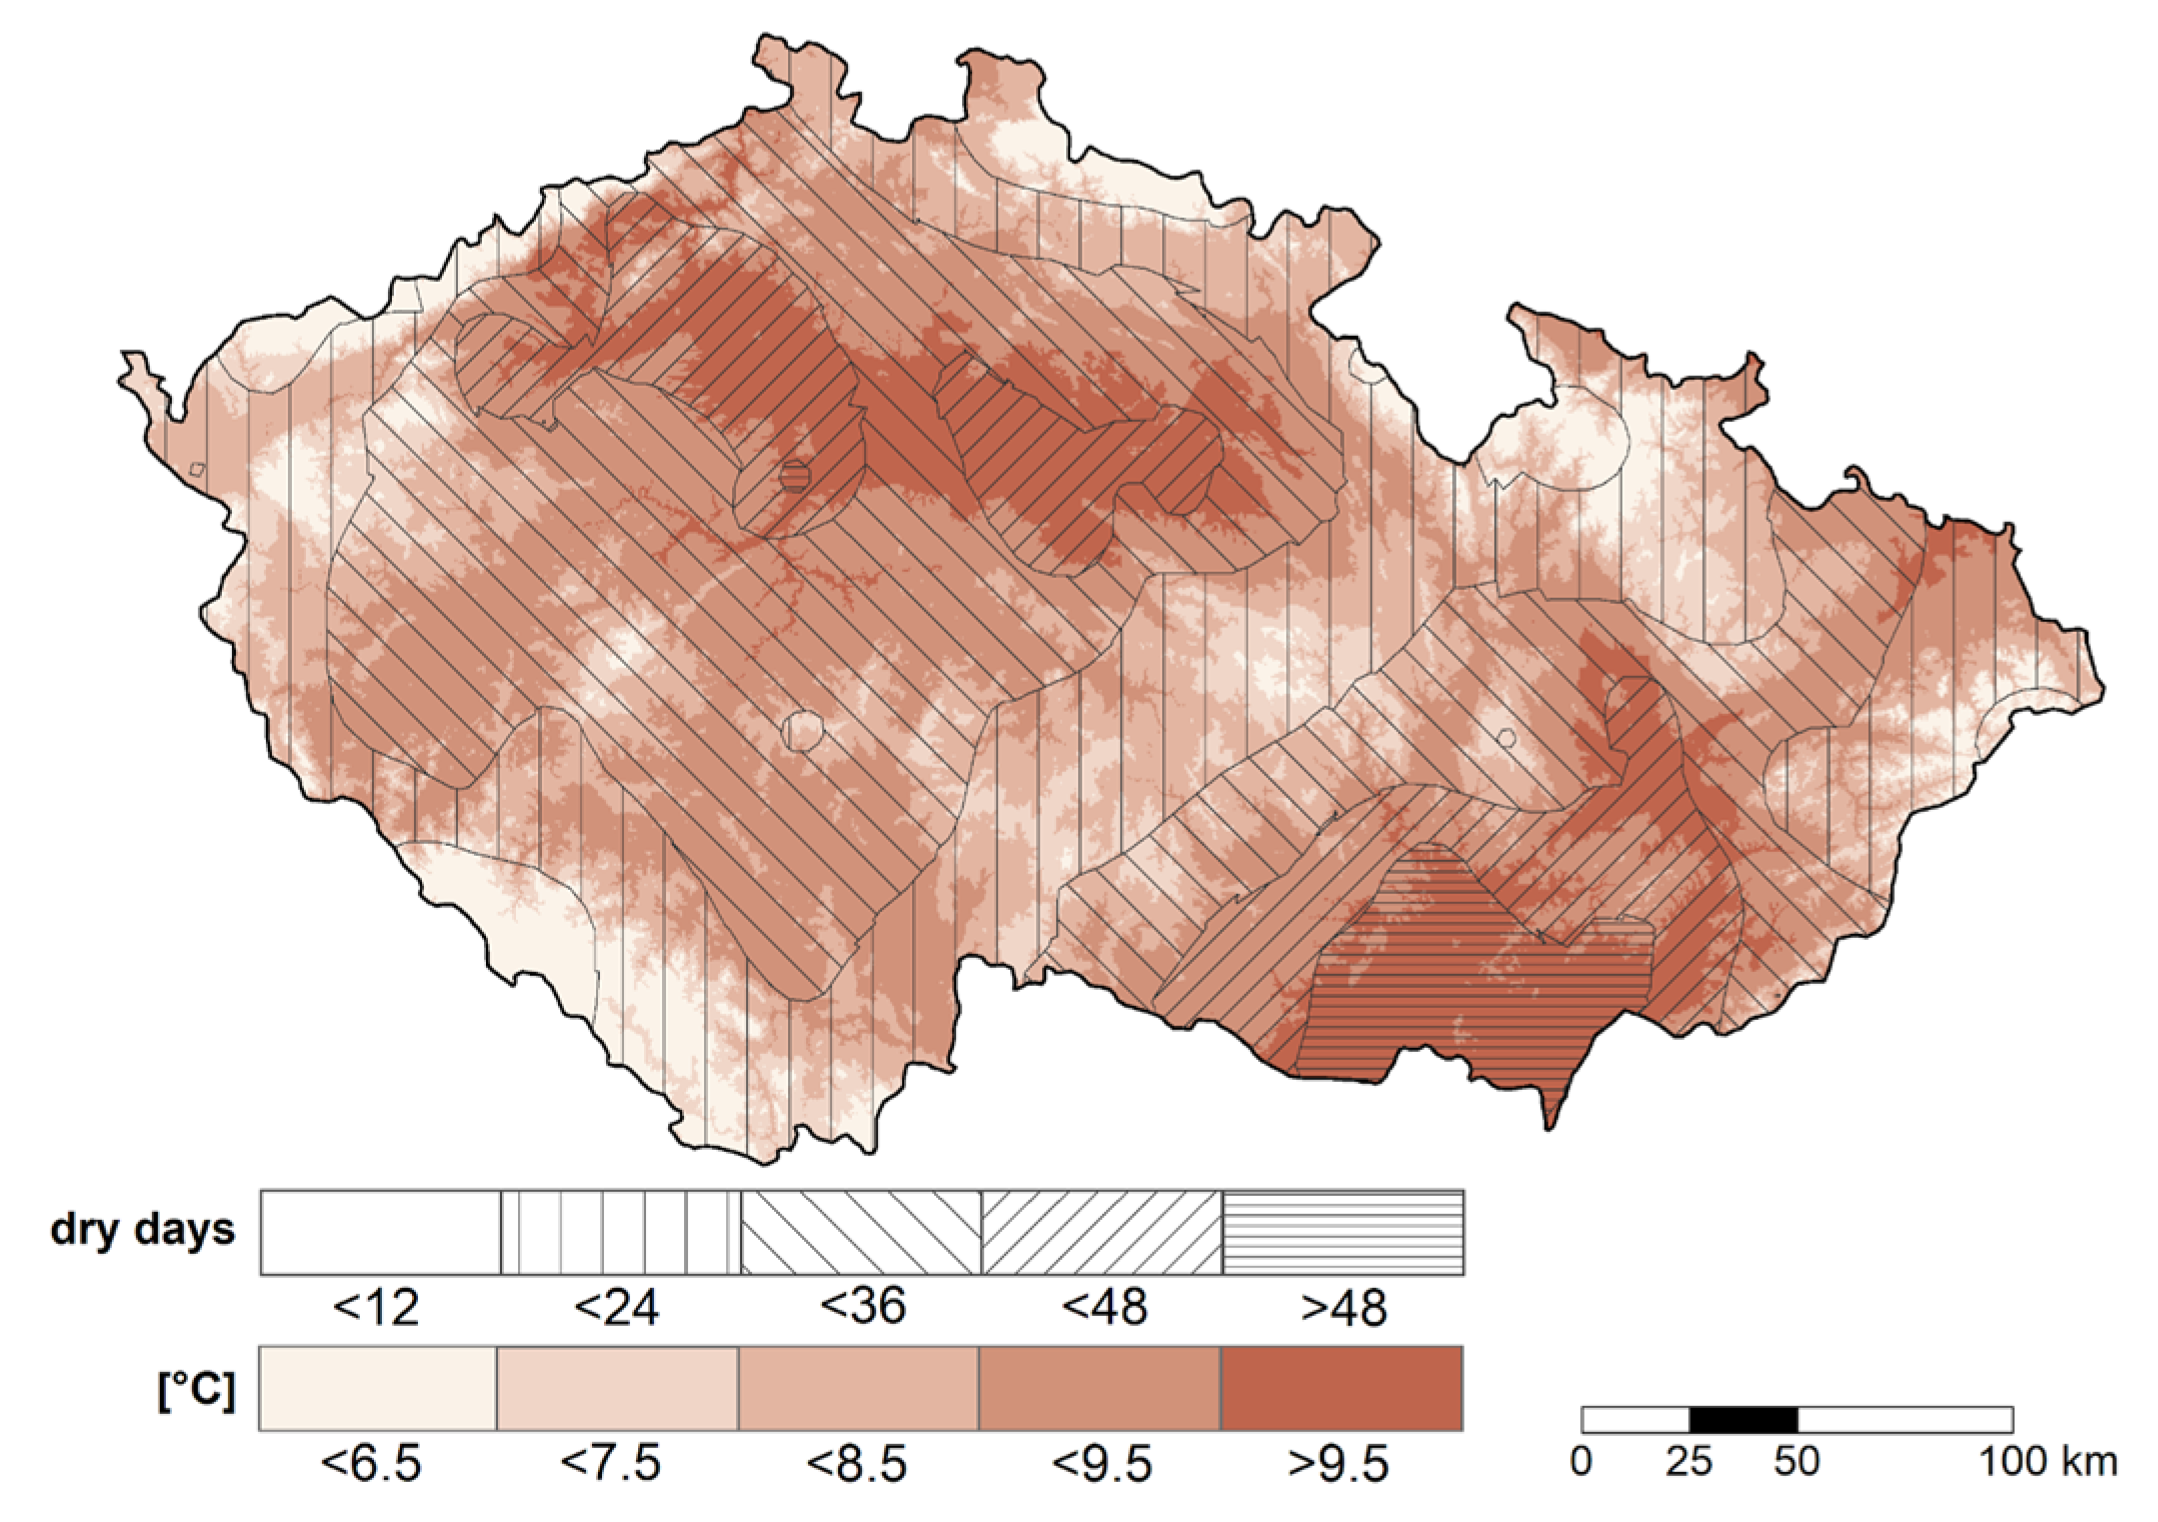
  • To find a simple combination of agroclimatic variables for a definition of agroclimatic zones in Czechia.

2. Materials and Methods
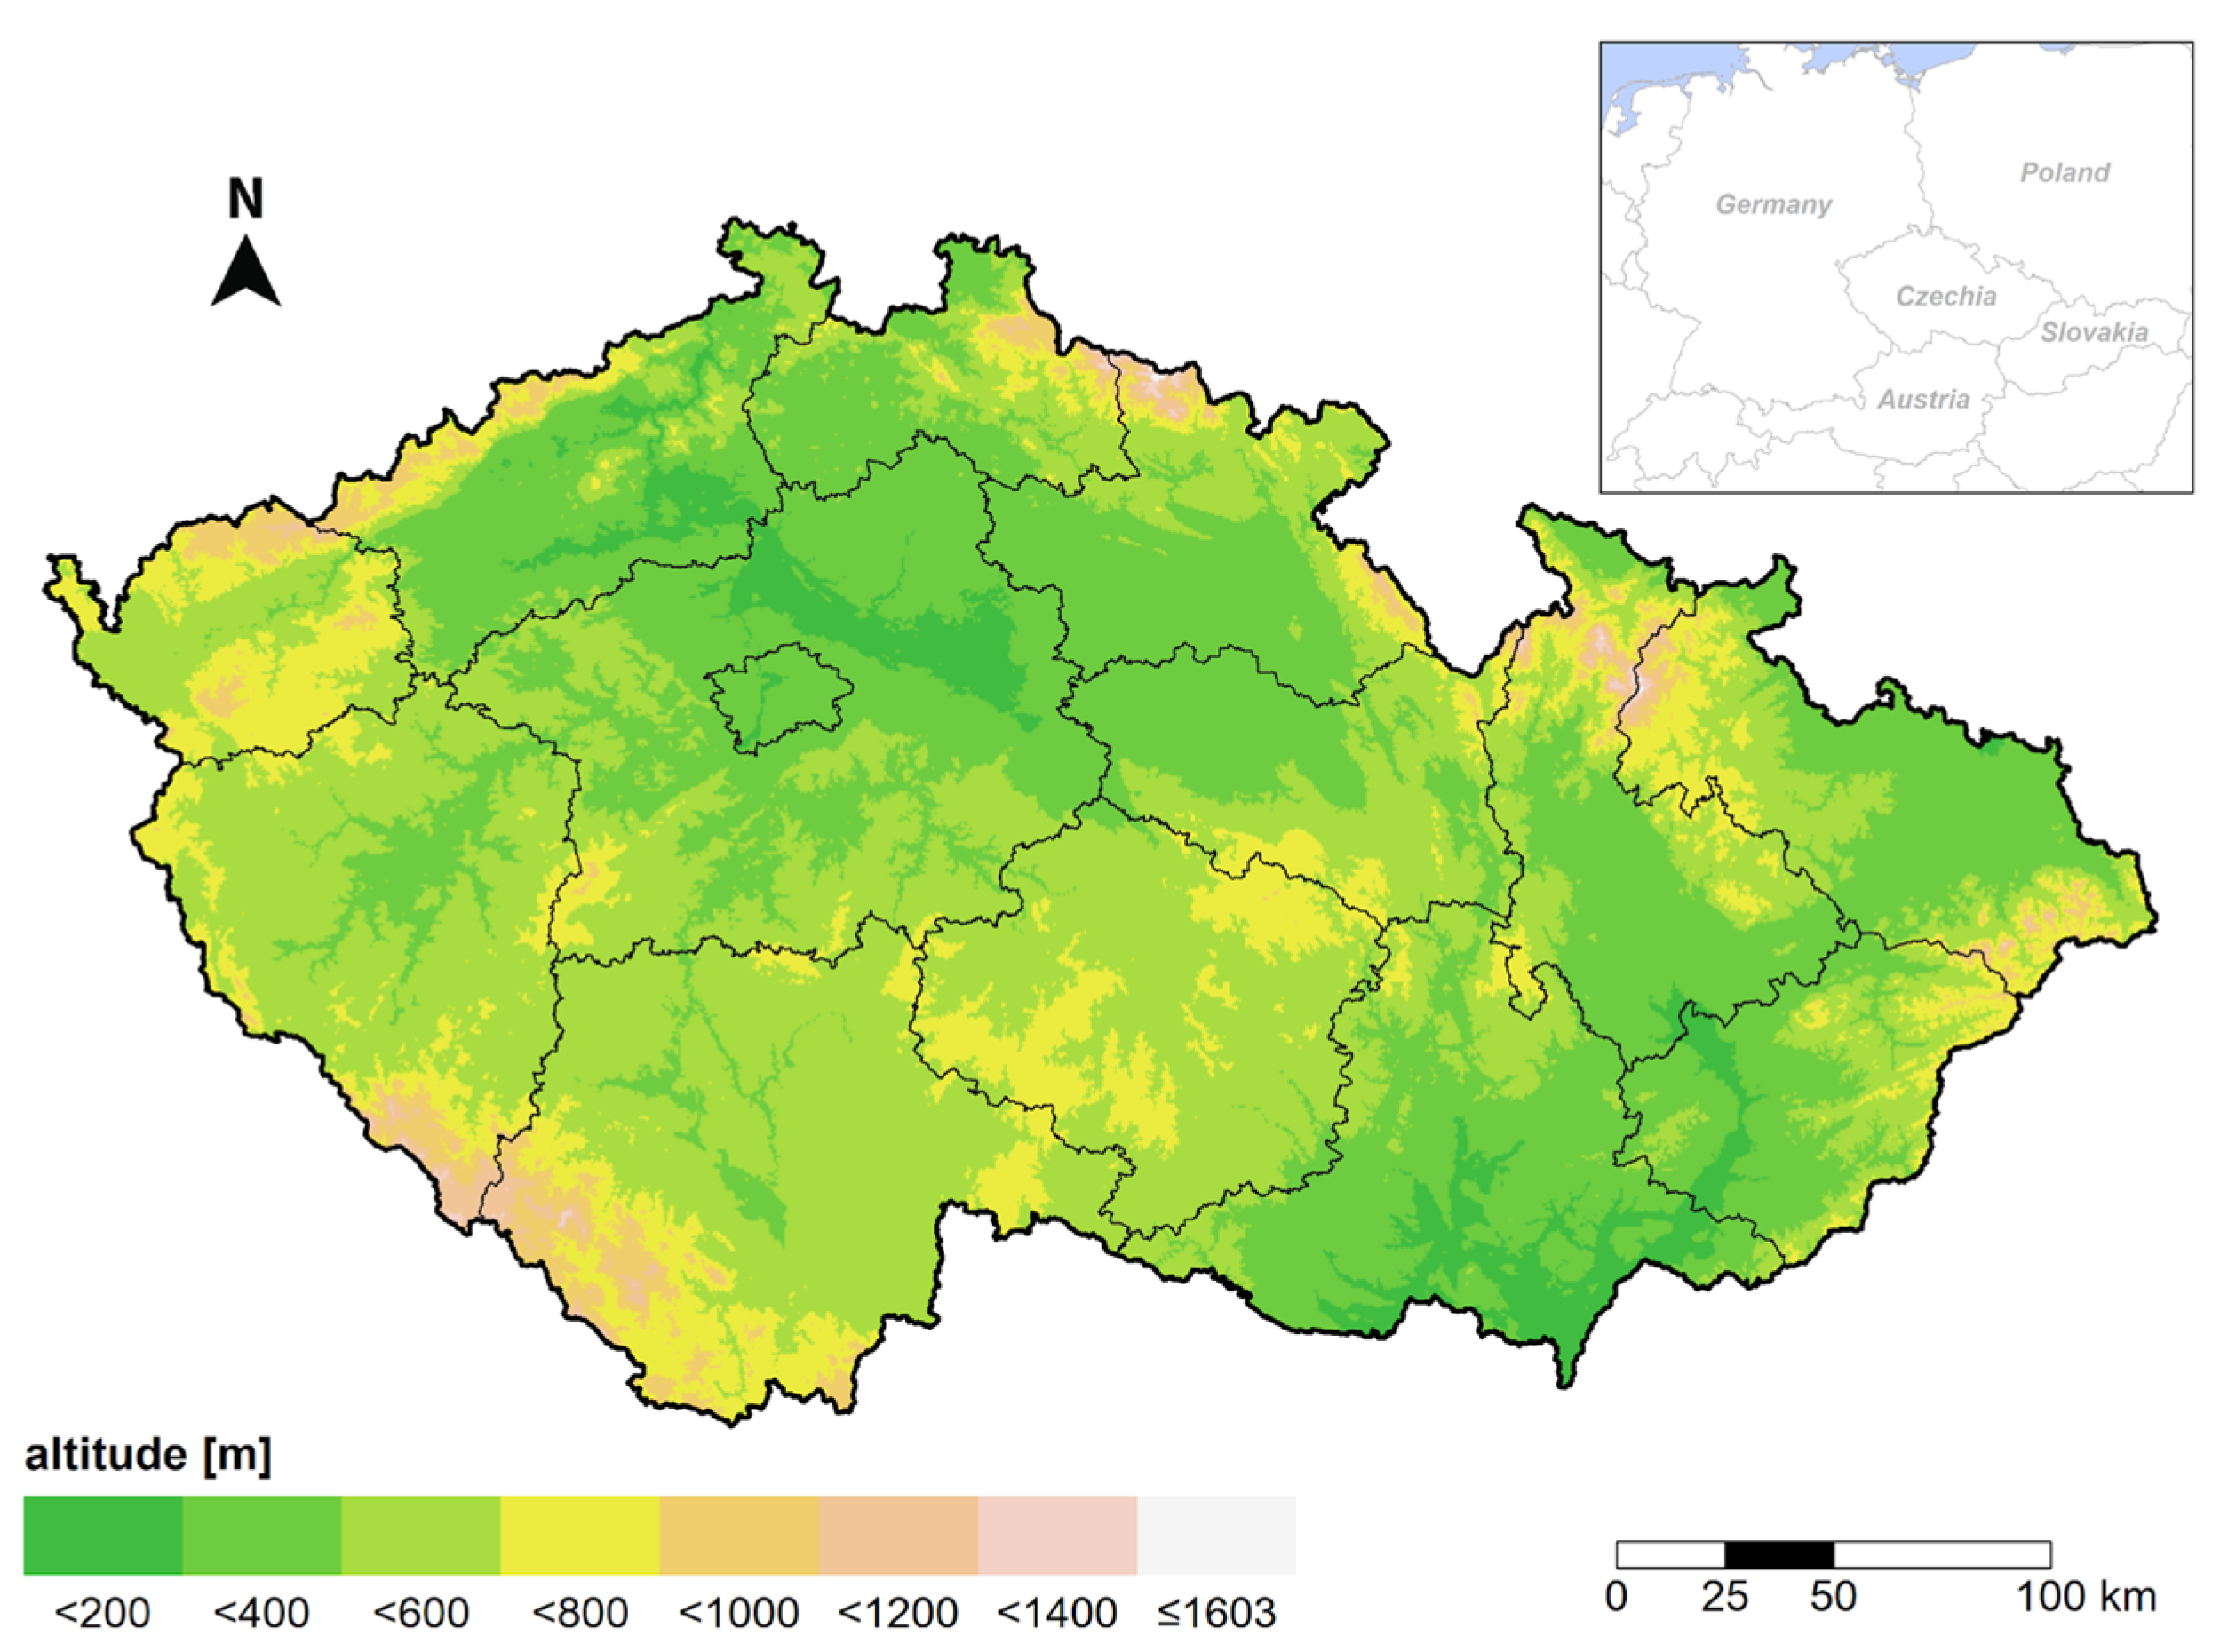
2.1. Study Area

This study deals with Czechia, a country located in Central Europe (Figure 1) bordering Germany to the west, Austria to the south, Slovakia to the east, and Poland to the north. Czechia has an area of 78,866 square kilometres and a wide range of topographical variations within its relatively compact landmass. The altitude varies from 115 to 1603 m above sea level, with the highest mountain ridges along the country’s borders. Although Czechia is not known for its distinct topographical diversity as are Alpine countries, its landscape is quite complex, containing either low-altitude flatlands or steep highlands.
The climatic conditions in Czechia are a result of a complex interplay of various atmospheric and geographical factors. These include latitude, inland location, topography, proximity to water, and altitude. According to the Köppen climate classification system, Czechia generally falls into the “Cfb” category. It is characterised by a mild climate with warm summers (average temperatures above 10 °C) and cold winters below 0 °C [25]. However, it is essential to note that there can be variations in local climate within Czechia due to the diverse topography. For example, montane areas above approx. 1000 m a. s. l. experience cooler temperatures and more snowfall in winter, which applies to the “Dfb” and “Dfc” categories. The most common soil type in Czechia is brown soil. At the agriculturally most important lowlands, chernozems and brown soil types prevail. Agricultural land covers over 50% of Czechia, and 34% of the country is covered by forests. Over 70% of the forest stands are coniferous (50% spruce; 16% pine). The rest of the forest areas are deciduous, mainly represented by beech (9%) and oak (7%).

2.2. Data, Methods, & Tools

Data from meteorological stations operated by the Czech Hydrometeorological Institute (CHMI) covering the territory of Czechia were used. This database includes a series of annual and seasonal measurements of specific climatic variables covering the period from 1961 to 2020. All the analyses are based on data from 110 meteorological stations operated by CHMI at altitudes ranging from 158 m above sea level (Doksany) to 1410 m above sea level (Luční bouda). The variables used in this study include daily mean, maximum and minimum air temperatures, and precipitation totals. Adequate air temperature and sufficient precipitation are essential for plant development, especially for crops. Therefore, key agroclimatological characteristics were chosen for in-depth analysis: mean air temperature, maximum air temperature, frost days, the sum of effective temperatures above 5 and 10 °C, precipitation totals, and soil moisture. The study period was divided into two climate normals (1961–1990 and 1991–2020). For each variable, a comparison was made between the two periods, and the change between the two periods was also determined.
Statistical analyses of time series for the given meteorological variables, geostatistical analyses, and the creation of maps were performed using R v4.1.3 [26]. For most of the work besides the base R packages, the gstat v2.0-9 [27], tmap v3.3-4 [28], and trend v1.1.5 [29] packages were used. The gstat package is an integral tool for spatial analysis in this paper. Using this tool, the point-based measurements were interpolated by residual kriging. As a result of the interpolation, the spatial outputs of this study are presented as 0.5 × 0.5 km grids. The Mann–Kendall nonparametric trend test was used for trend detection in annual time series and for examination of statistical significance [30]. The trend tests were performed at 0.05 and 0.01 significance levels.

3. Results and Discussion

For selected agroclimatic variables, we analysed their trend and compared the past average period 1961–1990 (PP) with the current period 1991–2020 (CP). Over the period 1961–2020, the average annual air temperature showed a statistically significant increasing trend of 0.04 °C/year (p < 0.01; Figure 2). The increase in mean annual air temperature in the CP compared to the PP period is clearly visible in Figure 2. The distribution of average air temperatures changed between the PP and the CP, with a marked increase in the proportion of temperatures in the 8–10 °C interval and above 10 °C from 25.8% of the whole country in the PP to 64.4% in the CP. Areas with an average temperature above 10 °C increased from 0.1% to 4.9% of Czechia. Rising air temperatures caused the total area with an average annual temperature above 8 °C to increase by 43.4% between the PP and the CP.
From 1961 to 2020, the sum of daily air temperatures above 30 °C increased, with a trend of about 0.23 °C/year (p < 0.01). The significant increase in the sum of daily air temperatures above 30 °C during the CP is presented in Figure 3. The ratio of the 15–20 °C area increased from 2.8% in the PP to 14.1% in the CP. The interval 20–25 °C rose from 0% during the PP to 22% of the total area in the CP. The strongest increase was detected in the interval above 25 °C—from 0% in the PP to 31.2% in the CP. The total area with a sum exceeding 15 °C increased by 58% in the CP compared with the PP.
An increase was also observed in the sum of effective temperatures above 5 °C during the vegetation period (April–September) from 1961 to 2020, as the trend analysis showed an increase of 6.62 °C/year (p < 0.01). Analogically, a marked increase in this variable was detected when comparing the PP and CP periods (Figure 4). The 1600–1900 °C area expanded from 35.2% in the PP to 50.5% in the CP. Moreover, the area above 1900 °C spread from 1.8% to 27%. The total area with a sum above 1600 °C rose by 40.5% between the PP and the CP.
The sums of effective temperatures above 10 °C also increased during the vegetation period from 1961 to 2020, with a trend of 5.66 °C/year (p < 0.01). A distinctive increase in this variable was observed as well when comparing the PP with the CP (Figure 5). The 800–1000 °C area expanded from 32.3% in the PP to 39.6% in the CP. The share of the area above 1000 °C grew from 5.3% in the PP to 38.1% in the CP. The total area with a sum above 800 °C increased by 40.1% in the CP compared with the PP.
In contrast, the number of days with frost in April–May decreased during the 1961–2020 period with a declining trend of −0.06 days/year (p < 0.05). Naturally, an obvious decrease in the number of days with frost in April–May was observed during the CP in comparison with the PP (Figure 6). The area of 15–20 days with frost decreased from 11.2% in the PP to 3.6% in the CP; as well, the area of 10–15 days shrunk from 37% to 20.2%. The total area with more than 15 frost days decreased by 27.4% when comparing the CP with the PP. Overall, the most pronounced loss of days with frost was detected in higher altitudes (over 800 m a. s. l.), where the effect of warming in the spring months was most apparent after 1990.
Between 1961 and 2020, the annual precipitation totals stagnated; thus, the trend was not significant. Minor and insignificant (both positive and negative) variances were noted between the CP and the PP (Figure 7). The area with an annual precipitation of less than 500 mm decreased from 6.6% in the PP to 5.5% in the CP. Areas with 500–650 mm per year shrunk from 50.1% in the PP to 46.9% in the CP, while on the other hand areas with 650–800 mm per year slightly expanded from 27.6% to 30.5%. The total area with an annual precipitation lower than 650 mm decreased by 4.3% in the CP compared to the PP. Generally, the changes and trends in the precipitation totals were of the least significance of all the analysed variables.
Regardless of the relatively stable amounts of rainfall, the number of days with soil drought increased between 1961 and 2020 (Figure 8), with an increasing trend (0.22 days/year; p < 0.05). The share of 20–30 dry days increased from 32% in the PP to 38.6% in the CP. Similarly, the area of 30–40 dry days increased from 7.6% in the PP to 21% in the CP. Ultimately, area with 50 and more dry days expanded from 4.3% to 10.9% of Czechia. The total area with soil drought in more than 15 days per year increased by 20% when comparing the CP to the PP. Regarding spatial and vertical variability, soil drought during the CP increased more in the eastern part of Czechia, spreading around almost all altitudes except the highest mountains above 1200 m a. s. l.
Agricultural production in Czechia has always been affected by air temperature and droughts, except for short periods in the past [31]. Therefore, we used the average annual air temperature and the number of days with soil drought to define agroclimatic regions (Figure 9). According to the average annual air temperature, we divided the regions into five categories: very warm (above 9.5 °C), warm (8.5–9.5 °C), moderately warm (7.5–8.5 °C), moderately cool (6.5–7.5 °C), and cool (below 6.5 °C). Based on the number of days with soil drought, we divided areas into the following categories: very dry (over 48 days), dry (36–48 days), slightly dry (24–36 days), slightly wet (12–24 days), and wet (fewer than 12 days). The choice of crops to be grown should take into account the respective zone/area. For example, crops that tolerate higher temperatures and drought should be grown in a very warm and dry area. Conversely, crops that tolerate cold and wet weather should be grown in a cool and wet area.
Our analysis of the 30-year periods of selected agroclimatic variables indicated significant changes (an increasing trend) in average air temperature, sums of effective temperatures (above 5 and 10 °C), and soil drought occurrence. By contrast, there is no significant trend in annual precipitation and there is also a decreasing trend in the number of frost days in April and May. The increase in the number of days with soil drought corresponds closely with the increase in evaporation due to rising temperatures [32]. Rising air temperatures and their effective sums are associated with rising air temperatures at different times in Czechia [31]. Increasing temperatures correspond with earlier onset of the phenological phases of plants in Czechia [33].
The proposed new definition of agroclimatic regions is shown in Table 1. The regions are defined according to the average annual air temperature: very warm, warm, moderately warm, moderately cool, and cool. At the same time, according to the average number of dry days, the subregions are: very dry (>48 dry days), dry (36 to 48), slightly dry (24 to 36), slightly wet (12 to 24), and wet (<12).
Significant changes in agroclimatic variables make it necessary to adapt the choice of crops to the current conditions. According to a recent study [15], it is necessary to adapt agroclimatic zones more frequently to the pace of ongoing climate change. Our proposed usage of the average annual air temperature and the number of days with soil drought can be a good guide for choosing a suitable crop. Due to its simplicity, the period can be adapted to the current climate change. The choice of crops and varieties must be adapted to the selected region and subregion. Temperatures and dry days are increasing, thus the suitable regions are changing. In some regions, there has been a shift of up to two regions and subregions compared to the PP.
The impact of climate change on agroclimatic conditions is indisputable in the region of Central Europe including Czechia. Nevertheless, the ratio between climate change’s beneficial and adverse effects on plant productivity resists simple generalisation. It depends on the unique responses of an individual plant species and is highly influenced by the specific geographical context. A recent study [34] summarised that climate change has varying impacts on agriculture in different European regions. Northern areas may see benefits like new crop species, increased production, and expanded cultivation areas, but also challenges like plant protection and soil issues.
In contrast, southern regions are likely to face disadvantages, including water scarcity, extreme weather, lower yields, and reduced suitable areas for crops. This could lead to increased agricultural intensity in Northern and Western Europe and extensification in Mediterranean and Southeastern Europe. Furthermore, a study from 2014 [35] confirms that the trend toward more frequent occurrence of adverse conditions in Europe’s primary wheat-growing regions is expected to lead to a higher frequency of crop failures across Europe. There is greater potential for increased cereal yields in wetter and cooler regions (such as uplands) compared to drier and warmer lowlands. Consequently, the regions where rain-fed crop cultivation is most productive, such as those dedicated to sugar beet production, have experienced a transition toward warmer and drier climates. This shift has led to a diminishing capacity for rain-fed farming and a reduced potential for crop production. Conversely, regions situated at higher elevations that previously had temperatures below the optimal range have seen favourable shifts in their temperature patterns. Nevertheless, when assessing the rate of change between 2000 and 2019, this positive trend is temporary. It is probable that, given the ongoing rate of change, even these high-altitude areas will encounter conditions that are drier and warmer than the optimum in the 2030s and 2040s. Furthermore, the capacity for production in higher elevations is often constrained by additional factors, including soil quality and accessibility of the terrain [36]. In addition, the authors proposed to reconsider the earlier concept of agroclimatic zones and enhance the flexibility of the concept, allowing more frequent updates, whether over decades or even shorter intervals [15].
As agricultural zones shift northward or upward due to climate change, a natural heterogeneity of soil types can pose challenges, as these shifts will result in new combinations of agroclimatic zones and soil types. This is potentially problematic, as different soil types interact with species in distinct ways according to the climate. This highlights the critical importance of comprehending the interplay between climate and soil for the successful adaptation of agriculture, whether it involves introducing new species or expanding the cultivation of existing ones into new regions [37]. Our results are consistent with results [9] showing a gradual shift in existing agroclimatic zones in Central and Eastern Europe further north. An increased incidence of summer heat accompanies the shift.

4. Conclusions

Our analysis showed a significant shift in agroclimatic conditions in Czechia between 1961 and 2020. Changes in observed temperature conditions, precipitation distribution, occurrence of soil drought, and vegetation frosts were analysed at high resolution (0.5 × 0.5 km). The observed changes show a significant increase in air temperatures and occurrence of soil drought. In contrast, no significant changes in the distribution of precipitation were observed, and only a minor decrease in the occurrence of frost in the growing season. For smaller but topographically variable countries such as Czechia, choosing a more detailed scale for assessing agroclimatic zones is appropriate. We proposed usage of a combination of mean annual air temperature and number of days with soil drought to specify these zones.

Author Contributions

Conceptualization, M.M. and L.H.; methodology, V.V. and A.M.; formal analysis, M.M. and V.V.; writing—original draft preparation, M.M., V.O., L.H. and A.M.; visualization, V.V. and V.O. All authors have read and agreed to the published version of the manuscript.

Funding

This study was supported by the Technology Agency of the Czech Republic Project No. SS02030018 (DivLand) and Project No. SS02030040 (PERUN).

Data Availability Statement

Data used in this study are available from the corresponding author.

Conflicts of Interest

The authors declare no conflict of interest.

References

  1. Moonen, A.C.; Ercoli, L.; Mariotti, M.; Masoni, A. Climate change in Italy indicated by agrometeorological indices over 122 years. Agric. For. Meteorol. 2002, 111, 13–27. [Google Scholar] [CrossRef]
  2. Fan, X.; Fei, C.J.; McCarl, B.A. Adaptation: An Agricultural Challenge. Climate 2017, 5, 56. [Google Scholar] [CrossRef]
  3. Howden, S.M.; Soussana, J.F.; Tubiello, F.N.; Chhetri, N.; Dunlop, M.; Meinke, H. Adapting Agriculture to Climate Change. Proc. Natl. Acad. Sci. USA 2007, 104, 19691–19696. [Google Scholar] [CrossRef]
  4. Lipper, L.; Thornton, P.; Campbell, B.; Baedeker, T.; Braimoh, A.; Bwalya, M.; Caron, P.; Cattaneo, A.; Garrity, D.; Henry, K.; et al. Climate-smart agriculture for food security. Nat. Clim. Chang. 2014, 4, 1068–1072. [Google Scholar] [CrossRef]
  5. Mueller, N.D.; Gerber, J.S.; Johnston, M.; Ray, D.K.; Ramankutty, N.; Foley, J.A. Closing yield gaps through nutrient and water management. Nature 2012, 490, 254–257. [Google Scholar] [CrossRef]
  6. Zhao, J.; Bindi, M.; Eitzinger, J.; Ferrise, R.; Gaile, Z.; Gobin, A.; Holzkämper, A.; Kersebaum, K.-C.; Kozyra, J.; Kriaučiūnienė, Z.; et al. Priority for climate adaptation measures in European crop production systems. Eur. J. Agron. 2022, 138, 126516. [Google Scholar] [CrossRef]
  7. Akritidis, D.; Georgoulias, A.K.; Lorilla, R.S.; Kontoes, C.; Ceglar, A.; Toreti, A.; Kalisoras, A.; Zanis, P. On the Northward Shift of Agro-Climatic Zones in Europe under Different Climate Change Scenarios. Environ. Sci. Proc. 2023, 26, 20. [Google Scholar] [CrossRef]
  8. Cao, J.; Leng, G.; Yang, P.; Zhou, Q.; Wu, W. Variability in Crop Response to Spatiotemporal Variation in Climate in China, 1980–2014. Land 2022, 11, 1152. [Google Scholar] [CrossRef]
  9. Ceglar, A.; Zampieri, M.; Toreti, A.; Dentener, F. Observed northward migration of agro-climate zones in Europe will further accelerate under climate change. Earth’s Future 2019, 7, 1088–1101. [Google Scholar] [CrossRef]
  10. Cobon, D.H.; Kouadio, L.; Mushtaq, S.; Jarvis, C.; Carter, J.; Stone, G.; Davis, P. Evaluating the shifts in rainfall and pasture-growth variabilities across the pastoral zone of Australia during 1910–2010. Crop Pasture Sci. 2019, 70, 634–647. [Google Scholar] [CrossRef]
  11. Haider, S.; Ullah, K. Historical and projected shift in agro-climatic zones and associated variations of daily temperature and precipitation extremes using CORDEX-SA over pakistan. Asia Pac. J. Atmos. Sci. 2021, 7, 757–771. [Google Scholar] [CrossRef]
  12. King, M.; Altdorff, D.; Li, P.; Galagedara, L.; Holden, J.; Unc, A. Northward shift of the agricultural climate zone under 21st-century global climate change. Sci. Rep. 2018, 8, 7904. [Google Scholar] [CrossRef] [PubMed]
  13. Kurukulasuriya, P.; Mendelsohn, R.O. How Will Climate Change Shift Agro-Ecological Zones and Impact African Agriculture? World Bank Policy Research Working Paper. 2008, p. 4717. Available online: https://ssrn.com/abstract=1267078 (accessed on 22 September 2023).
  14. Lawrence, T.J.; Vilbig, J.M.; Kangogo, G.; Fèvre, E.M.; Deem, S.L.; Gluecks, I.; Shacham, E. Shifting climate zones and expanding tropical and arid climate regions across Kenya (1980–2020). Reg. Environ. Chang. 2023, 23, 59. [Google Scholar] [CrossRef]
  15. Trnka, M.; Balek, J.; Brázdil, R.; Dubrovský, M.; Eitzinger, J.; Hlavinka, P.; Chuchma, F.; Možný, M.; Prášil, I.; Růžek, P.; et al. Observed changes in the agroclimatic zones in the Czech Republic between 1961 and 2019. Plant Soil Environ. 2021, 67, 154–163. [Google Scholar] [CrossRef]
  16. Yamba, E.I.; Aryee, J.N.; Quansah, E.; Davies, P.; Wemegah, C.S.; Osei, M.A.; Amekudzi, L.K. Revisiting the agro-climatic zones of Ghana: A re-classification in conformity with climate change and variability. PLoS Clim. 2023, 2, e0000023. [Google Scholar] [CrossRef]
  17. Trnka, M.; Olesen, J.E.; Kersebaum, K.C.; Skjelvåg, A.O.; Eitzinger, J.; Seguin, B.; Žalud, Z. Agroclimatic conditions in Europe under climate change. Glob. Change Biol. 2011, 17, 2298–2318. [Google Scholar] [CrossRef]
  18. Trnka, M.; Hlavinka, P.; Semenov, M.A. Adaptation options for wheat in Europe will be limited by increased adverse weather events under climate change. J. R. Soc. Interface 2015, 12, 20150721. [Google Scholar] [CrossRef]
  19. Devot, A.; Royer, L.; Arvis, B.; Deryng, D.; Caron Giauffret, E.; Giraud, L.; Ayral, V.; Rouillard, J. Research for AGRI Committee—The Impact of Extreme Climate Events on Agriculture Production in the EU, European Parliament, Policy Department for Structural and Cohesion Policies, Brussels. Available online: https://www.europarl.europa.eu/thinktank/en/document/IPOL_STU(2023)733115 (accessed on 22 September 2023).
  20. Eitzinger, J.; Trnka, M.; Semerádová, D.; Thaler, S.; Svobodová, E.; Hlavinka, P.; Žalud, Z. Regional climate change impacts on agricultural crop production in Central and Eastern Europe–hotspots, regional differences and common trends. J. Agric. Sci. 2013, 151, 787–812. [Google Scholar] [CrossRef]
  21. Menzel, A.; Fabian, P. Growing season extended in Europe. Nature 1999, 397, 659. [Google Scholar] [CrossRef]
  22. Liu, Q.; Piao, S.; Janssens, I.A.; Fu, Y.; Peng, S.; Lian, X.U.; Ciais, P.; Myneni, R.B.; Peñuelas, J.; Wang, T. Extension of the growing season increases vegetation exposure to frost. Nat. Commun. 2018, 9, 426. [Google Scholar] [CrossRef]
  23. Ma, Q.; Huang, J.G.; Hänninen, H.; Berninger, F. Divergent trends in the risk of spring frost damage to trees in Europe with recent warming. Glob. Change Biol. 2018, 25, 351–360. [Google Scholar] [CrossRef] [PubMed]
  24. Brázdil, R.; Zahradníček, P.; Dobrovolný, P.; Řehoř, J.; Trnka, M.; Lhotka, O.; Štěpánek, P. Circulation and Climate Variability in the Czech Republic between 1961 and 2020: A Comparison of Changes for Two “Normal” Periods. Atmosphere 2022, 13, 137. [Google Scholar] [CrossRef]
  25. Tolasz, R.; Kveton, V. Climate Atlas of Czechia; Czech Hydrometeorological Institute: Prague, Czech Republic, 2007; 256p. [Google Scholar]
  26. R Core Team, R. A Language and Environment for Statistical Computing. Available online: https://www.r-project.org/ (accessed on 22 September 2023).
  27. Gräler, B.; Pebesma, E.J.; Heuvelink, G.B. Spatio-Temporal Interpolation Using Gstat. R J. 2016, 8, 204–218. Available online: https://journal.r-project.org/archive/2016/RJ-2016-014/index.html (accessed on 17 July 2023). [CrossRef]
  28. Tennekes, M. tmap: Thematic Maps in R. J. Stat. Softw. 2018, 84, 1–39. [Google Scholar] [CrossRef]
  29. Pohlert, T. Non-Parametric Trend Tests and Change-Point Detection. CC BY-ND, 4, 1-18. R Package Version 1.1.5. Available online: https://cran.r-project.org/web/packages/trend/index.html (accessed on 22 September 2023).
  30. Libiseller, C.; Grimvall, A. Performance of partial Mann-Kendalltests for trend detection in the presence of covariates. Environmetrics 2002, 13, 71–84. [Google Scholar] [CrossRef]
  31. Brázdil, R.; Možný, M.; Klír, T.; Řezníčková, L.; Trnka, M.; Dobrovolný, P.; Kotyza, O. Climate variability and changes in the agricultural cycle in the Czech Lands from the sixteenth century to the present. Theor. Appl. Climatol. 2019, 136, 553–573. [Google Scholar] [CrossRef]
  32. Mozny, M.; Trnka, M.; Vlach, V.; Vizina, A.; Potopova, V.; Zahradnicek, P.; Stepanek, P.; Hajkova, L.; Staponites, L.; Zalud, Z. Past (1971–2018) and future (2021–2100) pan evaporation rates in the Czech Republic. J. Hydrol. 2020, 590, 125390. [Google Scholar] [CrossRef]
  33. Hájková, L.; Kožnarová, V.; Možný, M.; Bartošová, L. Influence of climate change on flowering season of birch in the Czech Republic. Int. J. Biometeorol. 2020, 64, 791–801. [Google Scholar] [CrossRef]
  34. Olesen, J.E.; Bindi, M. Consequences of climate change for European agricultural productivity, land use and policy. Eur. J. Agron. 2002, 16, 239–262. [Google Scholar] [CrossRef]
  35. Trnka, M.; Rötter, R.P.; Ruiz-Ramos, M.; Kersebaum, K.C.; Olesen, J.E.; Žalud, Z.; Semenov, M.A. Adverse weather conditions for European wheat production will become more frequent with climate change. Nat. Clim. Change 2014, 4, 637–643. [Google Scholar] [CrossRef]
  36. Trnka, M.; Eitzinger, J.; Hlavinka, P.; Dubrovský, M.; Semerádová, D.; Štěpánek, P.; Formayer, H.; Thaler, S.; Žalud, Z.; Možný, M.; et al. Climate-driven changes of production regions in Central Europe. Plant Soil Environ. 2009, 55, 257–266. [Google Scholar] [CrossRef]
  37. Mäkinen, H.; Kaseva, J.; Virkajärvi, P.; Kahiluoto, H. Shifts in soil–climate combination deserve attention. Agric. For. Meteorol. 2017, 234–235, 236–246. [Google Scholar] [CrossRef]
Figure 1. Topographic map of Czechia and its position within central Europe.
Climate 11 00210 g001
Figure 2. Average annual air temperature in periods 1961–1990 (top left) and 1991–2020 (top right); difference between 1991–2020 and 1961–1990 (bottom left). Trend of annual mean air temperature in the period 1961–2020 in Czechia (bottom right).
Climate 11 00210 g002
Figure 3. Average sum of daily air temperatures above 30 °C in periods 1961–1990 (top left) and 1991–2020 (top right); difference between 1991–2020 and 1961–1990 (bottom left). Trend of sum of daily air temperatures above 30 °C in the 1961–2020 period in Czechia (bottom right).
Climate 11 00210 g003
Figure 4. Average effective air temperatures above 5 °C in the vegetation period 1961–1990 (top left) and 1991–2020 (top right); difference between 1991–2020 and 1961–1990 (bottom left). Trend of effective air temperatures above 5 °C in the vegetation period 1961–2020 in Czechia (bottom right).
Climate 11 00210 g004
Figure 5. Average effective air temperatures above 10 °C in the vegetation period 1961–1990 (top left) and 1991–2020 (top right); difference between 1991–2020 and 1961–1990 (bottom left). Trend of effective air temperatures above 10 °C in the vegetation period 1961–2020 in Czechia (bottom right).
Climate 11 00210 g005
Figure 6. Average number of days with frost in April–May in the period 1961–1990 (top left) and 1991–2020 (top right); difference between 1991–2020 and 1961–1990 (bottom left). Trend of days with frost in April–May during 1961–2020 in Czechia (bottom right).
Climate 11 00210 g006
Figure 7. Average annual precipitation totals in the period 1961–1990 (top left) and 1991–2020 (top right); difference between 1991–2020 and 1961–1990 (bottom left). Trend of annual precipitation totals in the period 1961–2020 in Czechia (bottom right).
Climate 11 00210 g007
Figure 8. Average number of days with soil drought in the period 1961–1990 (top left) and 1991–2020 (top right); difference between 1991–2020 and 1961–1990 (bottom left). Trend of the number of days with soil drought in the period 1961–2020 in Czechia (bottom right).
Climate 11 00210 g008
Figure 9. Soil drought occurrence in comparison with annual average air temperature in Czechia in the period 1991–2020.
Climate 11 00210 g009
Table 1. A new definition of agroclimatic regions according to average annual air temperature and average number of dry days into subregions.
Agro-Climatic RegionSubregionTavg (°C)Dry Days
Very warmvery dry, dry, slightly dry, slightly wet>9.5 >12, <24, <36, <48, >48
Warmdry, slightly dry, slightly wet<9.5>12, <24, <36, <48
Moderately warmdry, slightly dry, slightly wet<8.5>12, <24, <36, <48
Moderately coolslightly dry, slightly wet, wet<7.5<12, <24, <36
Coolslightly wet, wet<6.5<12, <24
Disclaimer/Publisher’s Note: The statements, opinions and data contained in all publications are solely those of the individual author(s) and contributor(s) and not of MDPI and/or the editor(s). MDPI and/or the editor(s) disclaim responsibility for any injury to people or property resulting from any ideas, methods, instructions or products referred to in the content.

