1. Introduction
Floods belong to the group of the biggest natural disasters, with about 60 thousand deaths and more than USD 115 billion in economic losses between 1970 and 2019 [
1]. Extreme flood events have a particular magnitude [
2] and their characteristics are highly associated with site specification. Some countries have developed ways to improve their resilience, such as the FLOODIS project (2013–2015), a European platform available to professionals and citizens to alert the population about forecasts of natural disasters, providing updates, mitigation protocols, and geographic information [
3]. In Asia, the Pakistan Strategic Flood Alert and Management Capacity Building—Phases 1 and 2 was developed in 2015. The aim was to improve technical capacity in flood management, forecasting, flood hazard analysis, and warning [
3].
Günter, et al. [
4] states that most watersheds worldwide do not have flow meters, so they are classified as ungauged. Therefore, hydrological studies in some areas prone to flooding require reconstructing the sequence of hydrological elements through non-conventional sources [
5,
6]. In 2013, the International Association of Hydrological Sciences (IAHS) released a summary of the main achievements of Prediction in Ungauged Basins (PUB) over the decade of 2003–2013 [
7] and the remaining challenges in scientific hydrology. Since then, hydrology has continued to advance with many works assessing floods in ungauged basins worldwide.
The lack of monitoring in some basins is a challenge that can often be overcome through hydrological and hydrodynamic modeling associated with field research. Several works around the world used this combination for ungauged basins. In Italy, Grimaldi, et al. [
8] proposed and tested a fully continuous hydrological-hydraulic modeling framework for flood mapping to reduce the uncertainties of analysis of small and uncalibrated watersheds. P. C, et al. [
9] used a Grid Subsurface Hydrological Analysis model to study a heavy rain flood event in a small uncalibrated mountain basin in Japan. In Cambodia, van Emmerik, Mulder, Eilander, Piet and Savenije [
5] discussed the importance of calibrating and validating a hydrological model developed for PUB cases beyond modeling. Asgharinia, et al. [
10] evaluated the sensitivity in terms of simulated flood area and volume for different combinations of inputs using the EBA4SUB hydrological model (Event-Based Approach for Small and Ungauged Basins) and the HEC-RAS (Hydrologic Engineering Center’s River Analysis System) one-dimensional hydraulic model. Sarchani, et al. [
11] investigated the flooding caused by a severe rainfall event in a small uncalibrated basin in northwest Crete, analyzing the uncertainties in the combined 1D/2D HEC-RAS modeling concerning the Manning roughness coefficient in floodplains, with high-resolution elevation digital models.
Social perception is a powerful ally to overcome the limitations in obtaining appropriate data and analyzing floods in ungauged basins [
12], yet little explored. Sociohydrology frequently discusses this topic, corroborating the idea of sharing information between the scientific community and local knowledge holders to obtain alternative data [
13]. Local knowledge can add useful information to reduce uncertainty in the model configuration. Its application works as a complement to, but not a substitute for, scientific research [
4,
5,
14,
15,
16].
The Brazilian semi-arid region is characterized by shallow soils, a dense network of intermittent rivers [
17,
18], and a highly variable rainfall regime [
4,
19], leading to extreme runoff events, causing flash floods with great potential damage. Due to the high climate variability, drier decades can lead the population to disregard the risk of flooding, occupying the banks and sometimes even the bed of these rivers.
Floods are a severe disaster, especially when added to the rupture of dams. In the Brazilian semi-arid region, as a way of surviving the dry climate, small dams were and still are the most adopted solution by farmers and rural communities in small towns [
17,
18,
20]. In practice, these small dams are built without an integrated plan [
17] constituting a dense network of small randomly positioned reservoirs, leading to a chaotic system that is difficult to manage. In addition, the lack of measurement data in most rivers makes it difficult to analyze floods and hinders the adoption of a preventive posture by cities prone to this type of disaster, reinforcing the need for a method to assess floods in semi-arid regions, especially when little data are available.
This study aims to propose an alternative methodology to reconstruct flood events at ungagged basins through social perception. The proposed methodology can be used to evaluate the performance of hydraulic and hydrological models, and to analyze the causes of flooding events. The methodology combines the perception of those affected and the limited amount of available recorded data. We intend to advance hydrological studies of ungauged basins through a simple methodology applicable to semi-arid regions and to collaborate in mitigation plans.
The proposed methodology was applied to reconstruct a flood event in a city located in the Brazilian semi-arid region. This event was chosen because of its particularity, with intriguing hypotheses about its cause, since there are reports of the occurrence of extremely rare torrential rain with a simultaneous rupture of small dams in this region while the official rain data appointed to non-extreme precipitation.
2. Materials and Methods
The proposed methodology for analyzing flood events in watersheds in semi-arid regions with low data availability is divided into five steps.
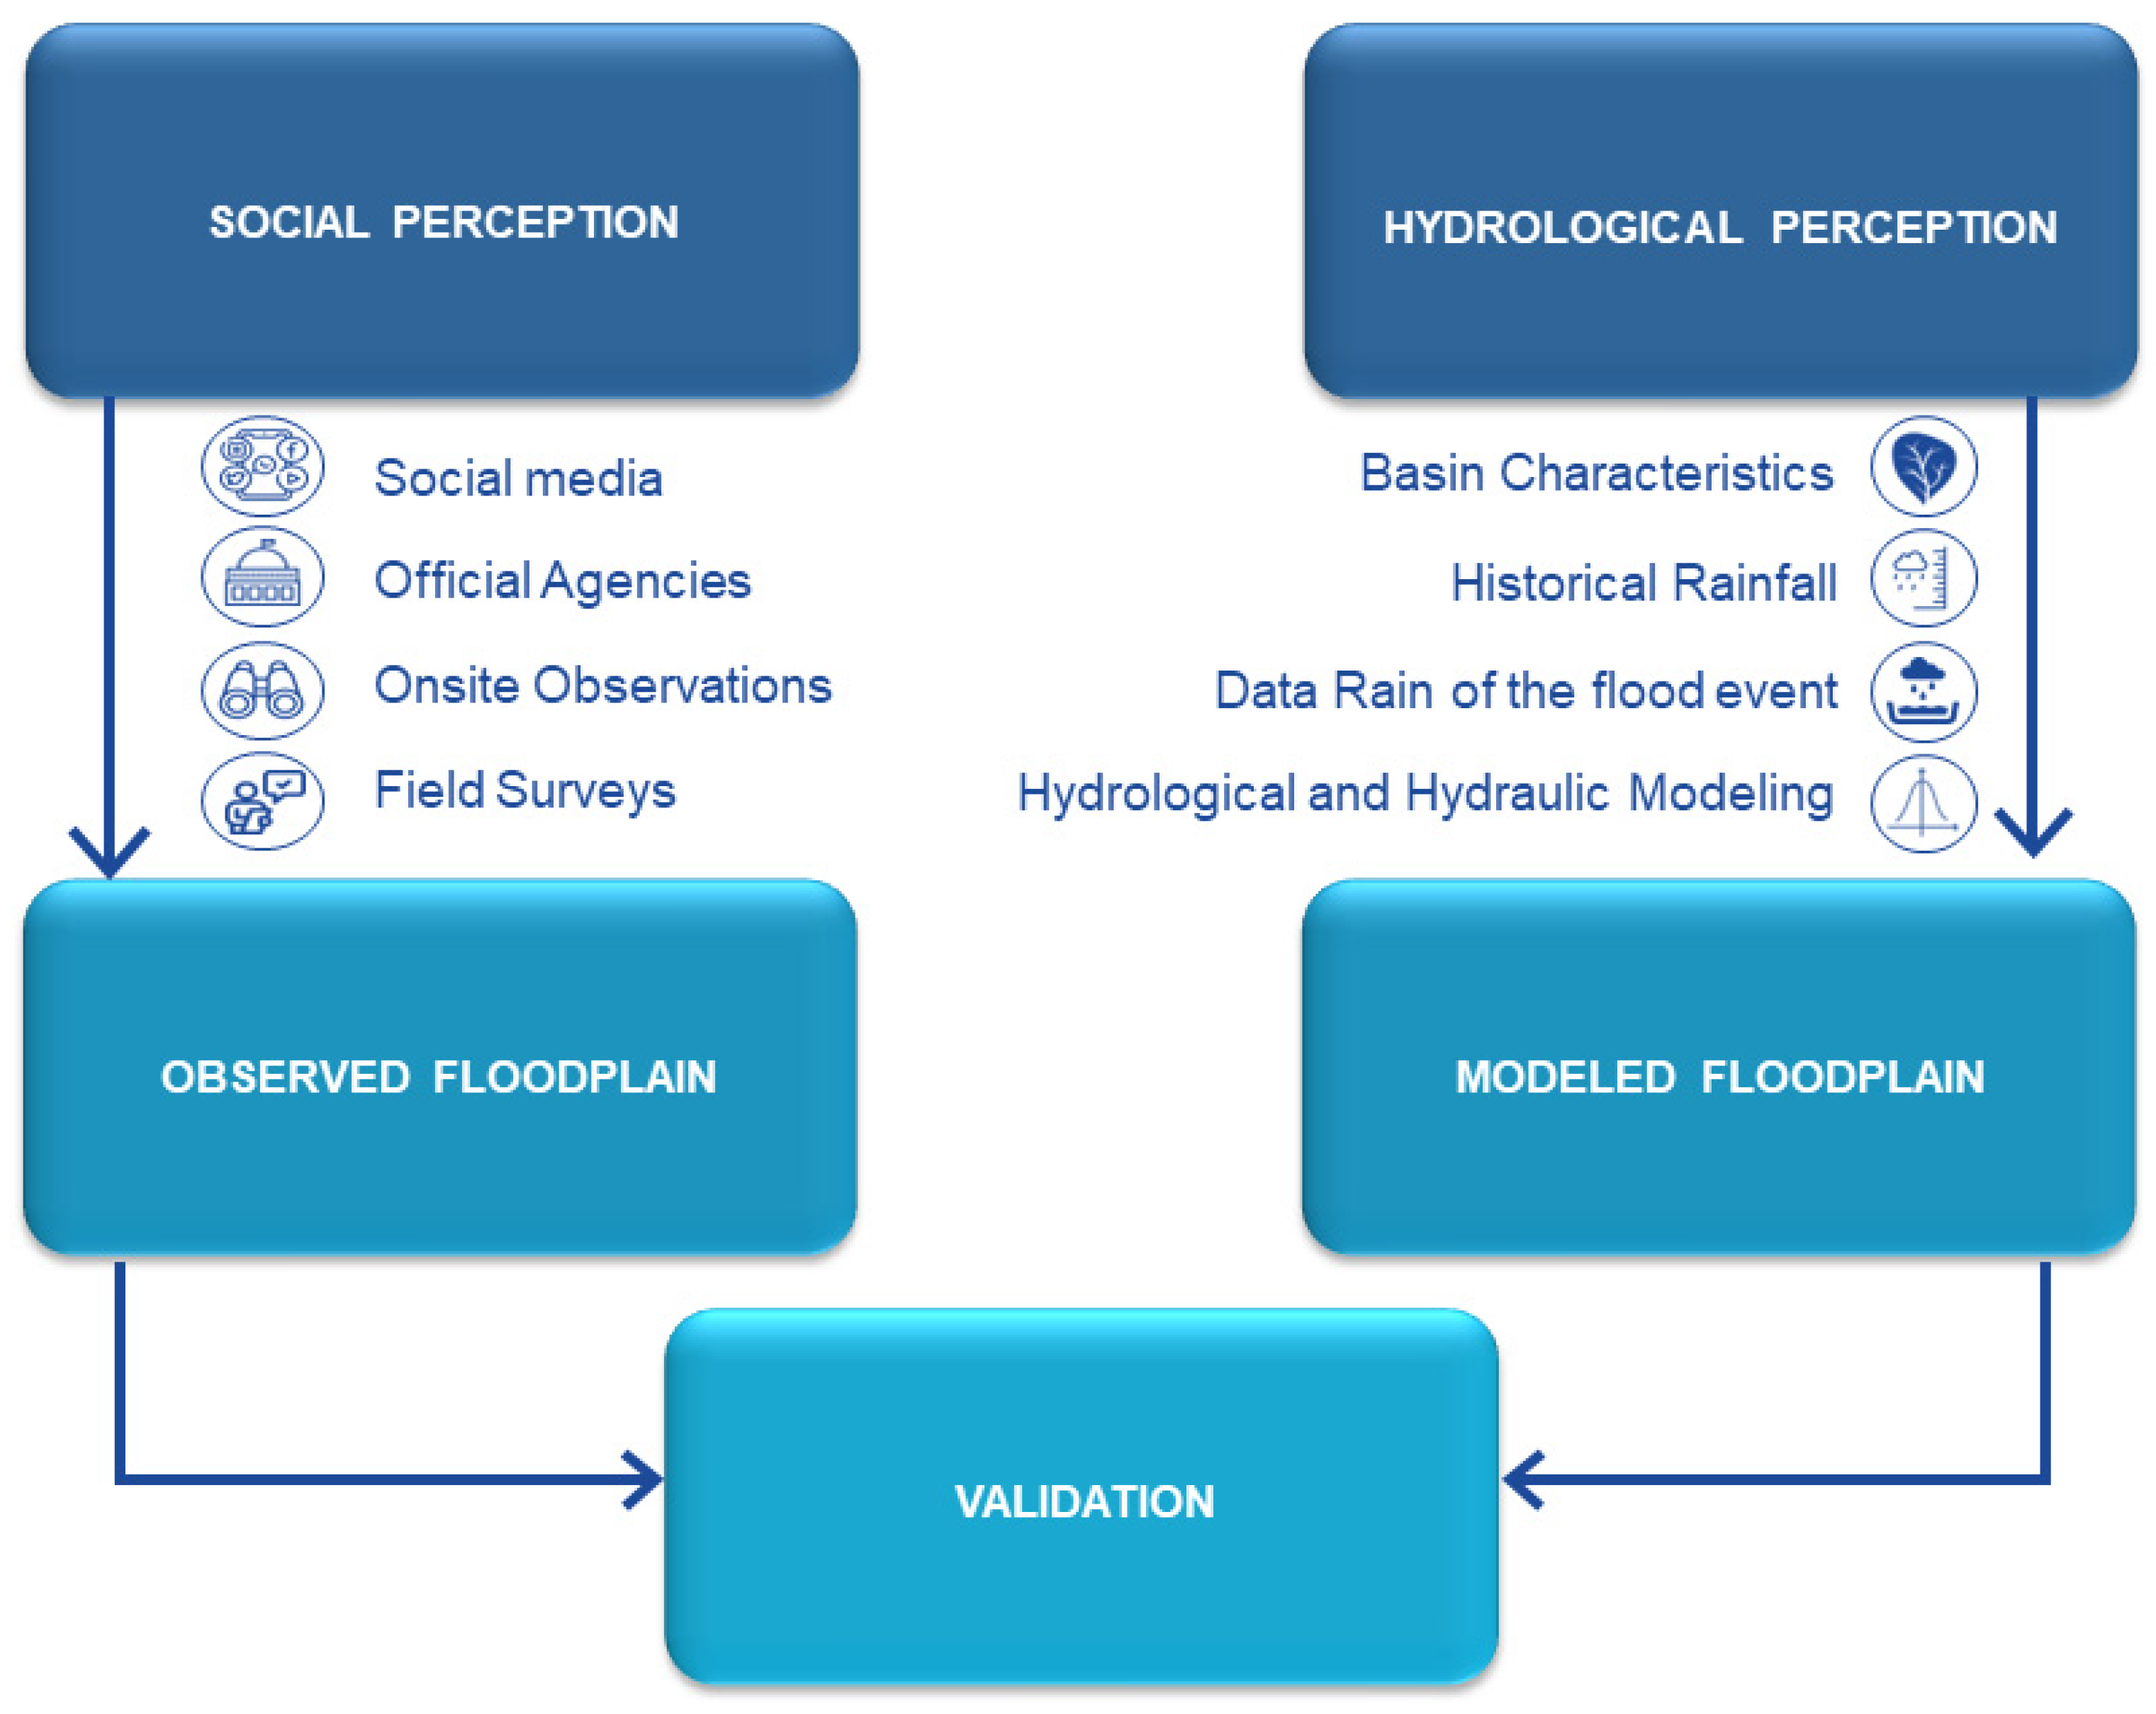
Figure 1 presents the flowchart of the methodology. First, investigative research is carried out to obtain social perception data about the flood event from four sources: (i) social media and news, (ii) official government agencies, (iii) onsite observations of flood impacts, and (iv) field surveys. Second, the observed floodplain map is generated according to the data obtained in the first step.
Third, existing meteorological and hydrological data for the watershed are acquired from official and geoprocessing sources. Fourth, the modeled floodplain map is generated through hydrological and hydraulic simulation with the official data obtained. Fifth, the modeled and observed flood hazard maps are compared, the comparison of both maps can lead to the validation or rejection of the flood modeling procedure. In case of rejection, some adjustments could be made, such as searching for other sources of social and/or hydrological information, reviewing the modeling methods, and recalibrating the parameters that fit the event conditions.
2.1. Social Perception
Post-flood hydrological studies of cities are challenging [
3,
7], particularly in ungauged watersheds. As there are no measurement mechanisms at the study site, thorough investigative work is required to obtain relevant input data.
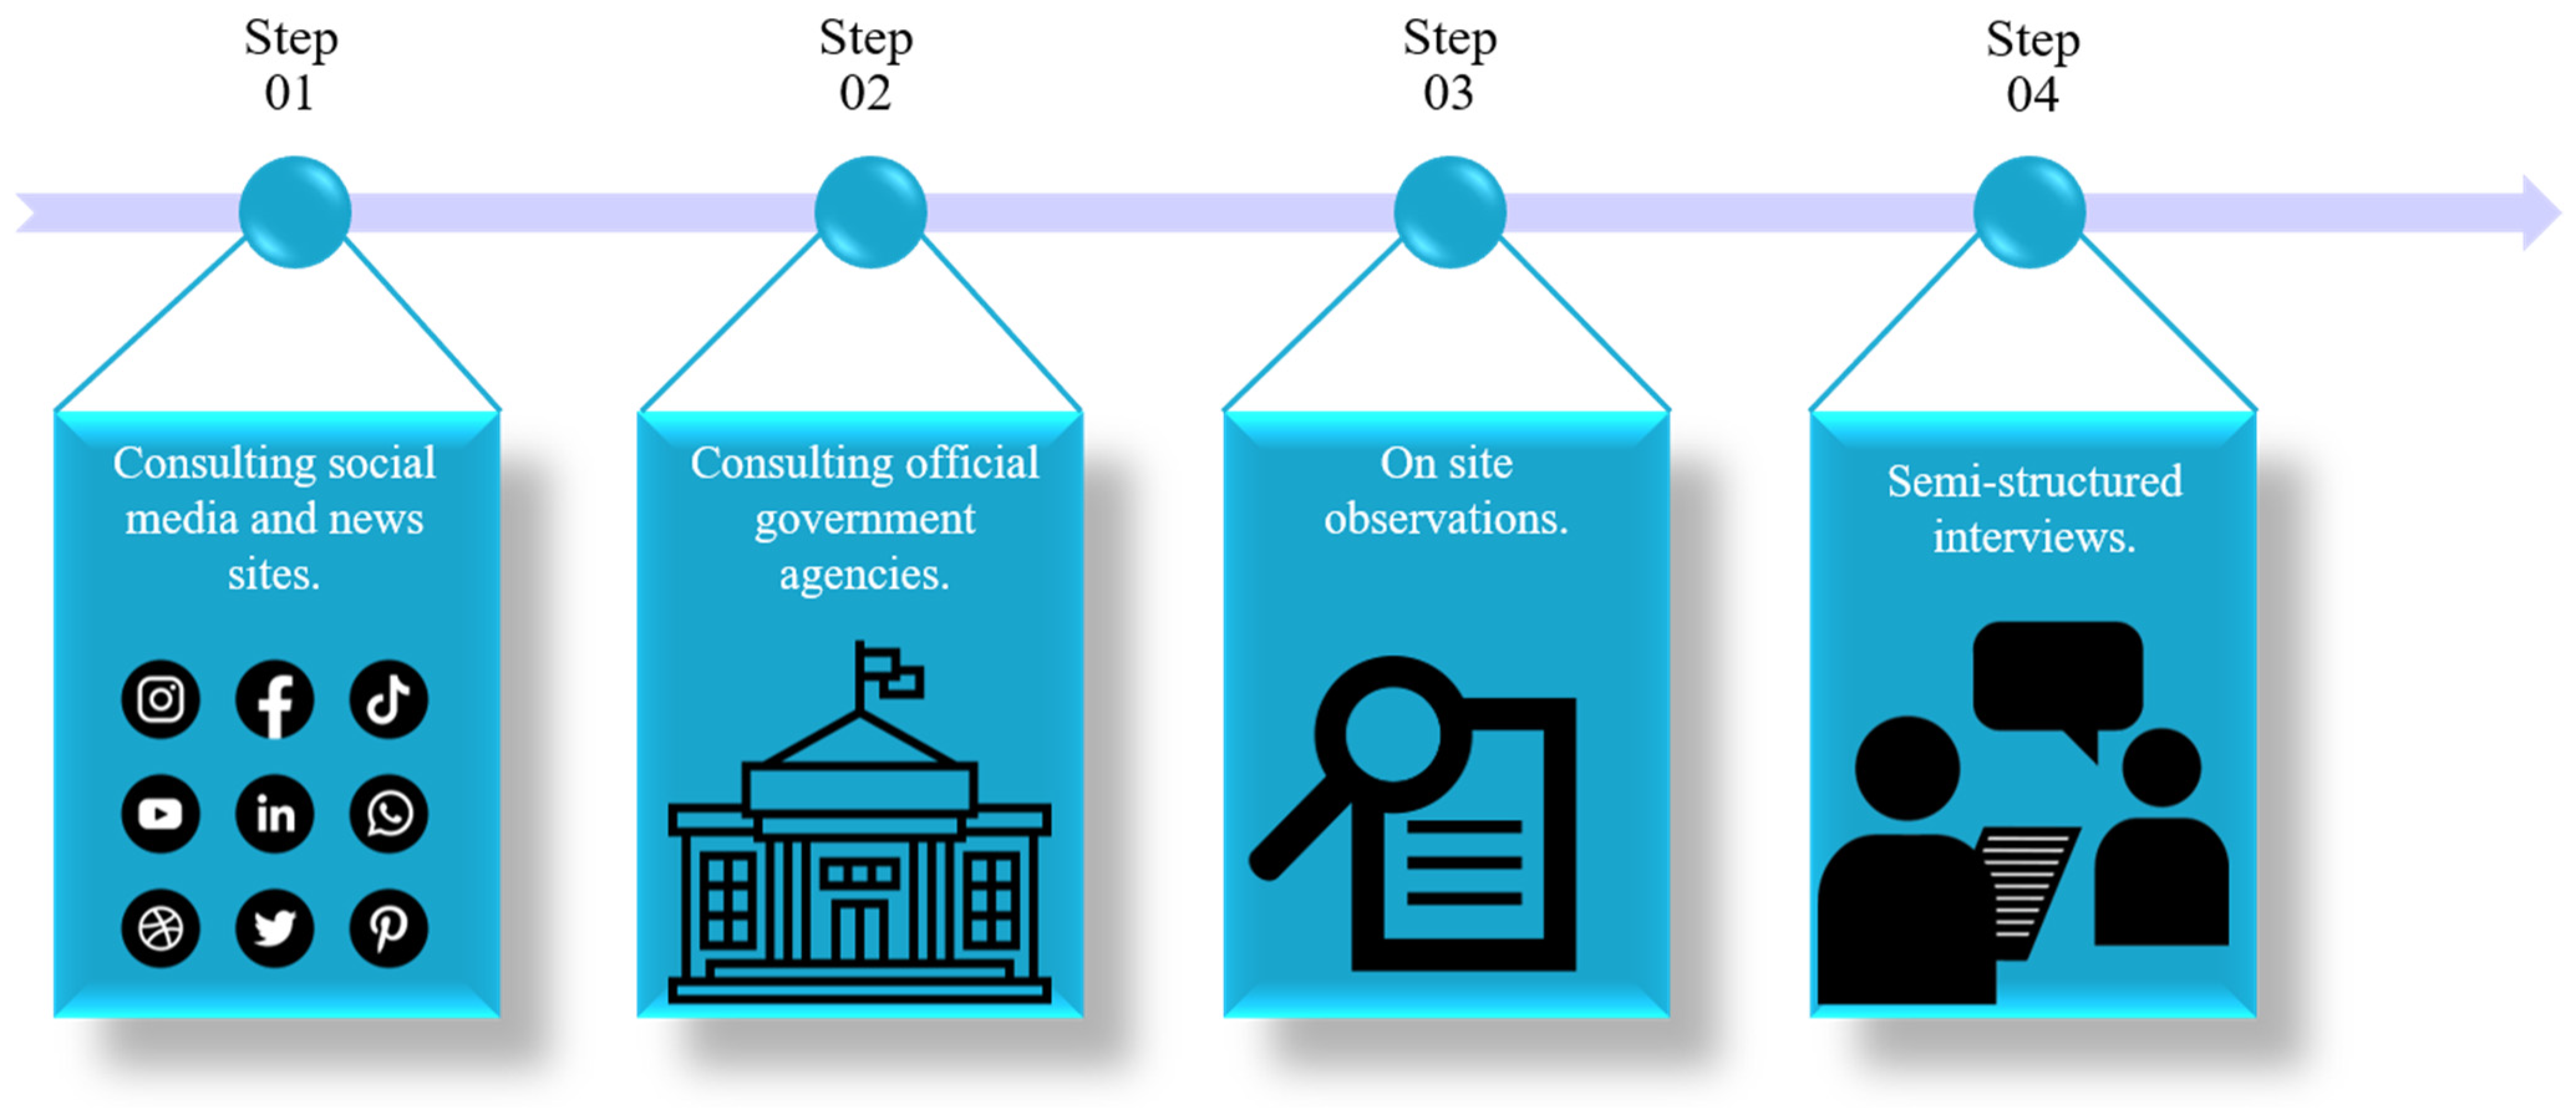
Figure 2 presents the proposed methodology for retrieving social perception data. The steps presented in
Figure 2 must be conducted sequentially as the information obtained in a previous step can help in the planning of the next step.
First, photos and news are collected from social media platforms (Instagram, Twitter, and WhatsApp), news websites, and blogs. These data serve as preliminary flood information. It allows an overview of the event and the observation of the impact of the flood wave.
The next step is to consult official government agencies—such as civil defense and the municipal government—to obtain documented information about the disaster, whether qualitative or quantitative. Useful information such as aerial photos during or recently post-disaster, documented damage data, river occupation data, and topography data, can be helpful to design the flood extent.
More detailed information about the floodplain is achieved during the next two steps: the depth and extent of the floodplain are surveyed by onsite observations, these observations seek clear flood signs such as damages and watermarks in buildings. Lastly, semi-structured interviews are conducted [
21,
22] with residents of the impacted neighborhoods. The interviews include questions such as: “How far did the water reach you?”, “At what approximate height did the water enter your property?”, “What is your perception of the cause of the event?”.
By combining the information from the field interview with the collection of images acquired of the day of the disaster and with the topography, it is possible to empirically estimate the height of the flood and the extent of the floodplain by producing georeferenced points with the height of the spot at each survey point. Then, a numerical terrain model can be created to spatialize the point data information through IDW interpolation, creating the observed flood patch. This “observed” floodplain can be used to validate the flood modeling results.
2.2. Hydrological Perception
The proposed methodology for retrieving hydrological and catchment data to model the critical rain and flood event (
Figure 3).
An inexpensive way to retrieve catchment characteristics data is by using geoprocessing. The Advanced Land Observing Satellite Digital Elevation Model (ALOS DEM) is an open topography data resource, with 12.5 m resolution, containing terrain information available worldwide [
23,
24]. With this terrain file, it is possible to delimit the watershed, extract information about the main river and generate contour lines to characterize the topography of the watershed. Daily rainfall data can be retrieved from official records or, if inexistent, from climate reanalysis data.
To model the critical rainfall, first, a frequency analysis is conducted on the rainfall historical series with the fitting of a probability distribution function to determine the return period of the rainfall on the day of the flood. This rainfall is disaggregated in lower durations through the intensity–duration–frequency curve to build the hyetograph. In case the IDF curve is inexistent, alternative methods do disaggregate the daily rain such as the Torrigo method that is commonly used in Brazil [
25].
According to Bartles, et al. [
26], the alternating block method is recommended to develop a hyetograph from a block that represents the incremental precipitation values. The maximum value is positioned in the middle of the analyzed rain duration. The other blocks are re-arranged around the peak in descending order until it fits the total precipitation duration. Chow, et al. [
27] claimed that is a straightforward way to obtain a hyetograph based on the IDF curve.
The rainfall hyetograph is used as the meteorological input to The Hydrologic Modeling System (HMS), a free software program developed by the Hydrologic Engineering Center (HEC) to simulate rainfall-runoff processes in watersheds [
26]. The software uses standard rainfall-runoff transformation methods such as the SCS to build the flood hydrograph.
In the final step of this process, the objective is to model the floodplain map to ascertain the extent of the water impact graphically and whether the causes discussed, based on the available data, are, in fact, consistent with the flood reported by the residents. An open software developed by the U.S. Army Corps of Engineers Hydrologic Engineering Center, called River Analysis System (HEC-RAS version 6.0), is used for this purpose. Two-dimensional modeling is recommended to simulate areas or events where the water flow is not completely known [
28]. The software requires the most accurate representation of terrain data and boundary conditions to reduce model uncertainties [
29].
Furthermore, roughness parameters must be estimated to obtain confidence in the model [
29]. In the flood event analyzed, according to the photo collection, the flood wave dragged much debris formed by sand, vegetation, remains of houses, and furniture, among others, as the water passed through obstacles such as bridges and wet passages in the riverbed, has caused a channel clogging effect and the software can only process this through the Manning number. Knowing this, the methodology for obtaining this parameter proposed by Arcement and Schneider [
30] was used, which, by crossing information, estimates the roughness in some parts of the impact caused by a natural disaster.
2.3. Validation
The proposed methodology is for ungauged basins, so the validation and calibration of the modelings cannot be traditionally performed. It is reinforced that field research is essential to conceptualize and understand the flood event and to validate the modeling procedures.
The validation occurs by comparing the floodplain generated by the hydrological/hydraulic modeling with the observed floodplain resulting from the social perception data. Furthermore, the survey points that we are most sure about the water heights can become checkpoints to compare the observed depth with the simulated one.
2.4. Case Study
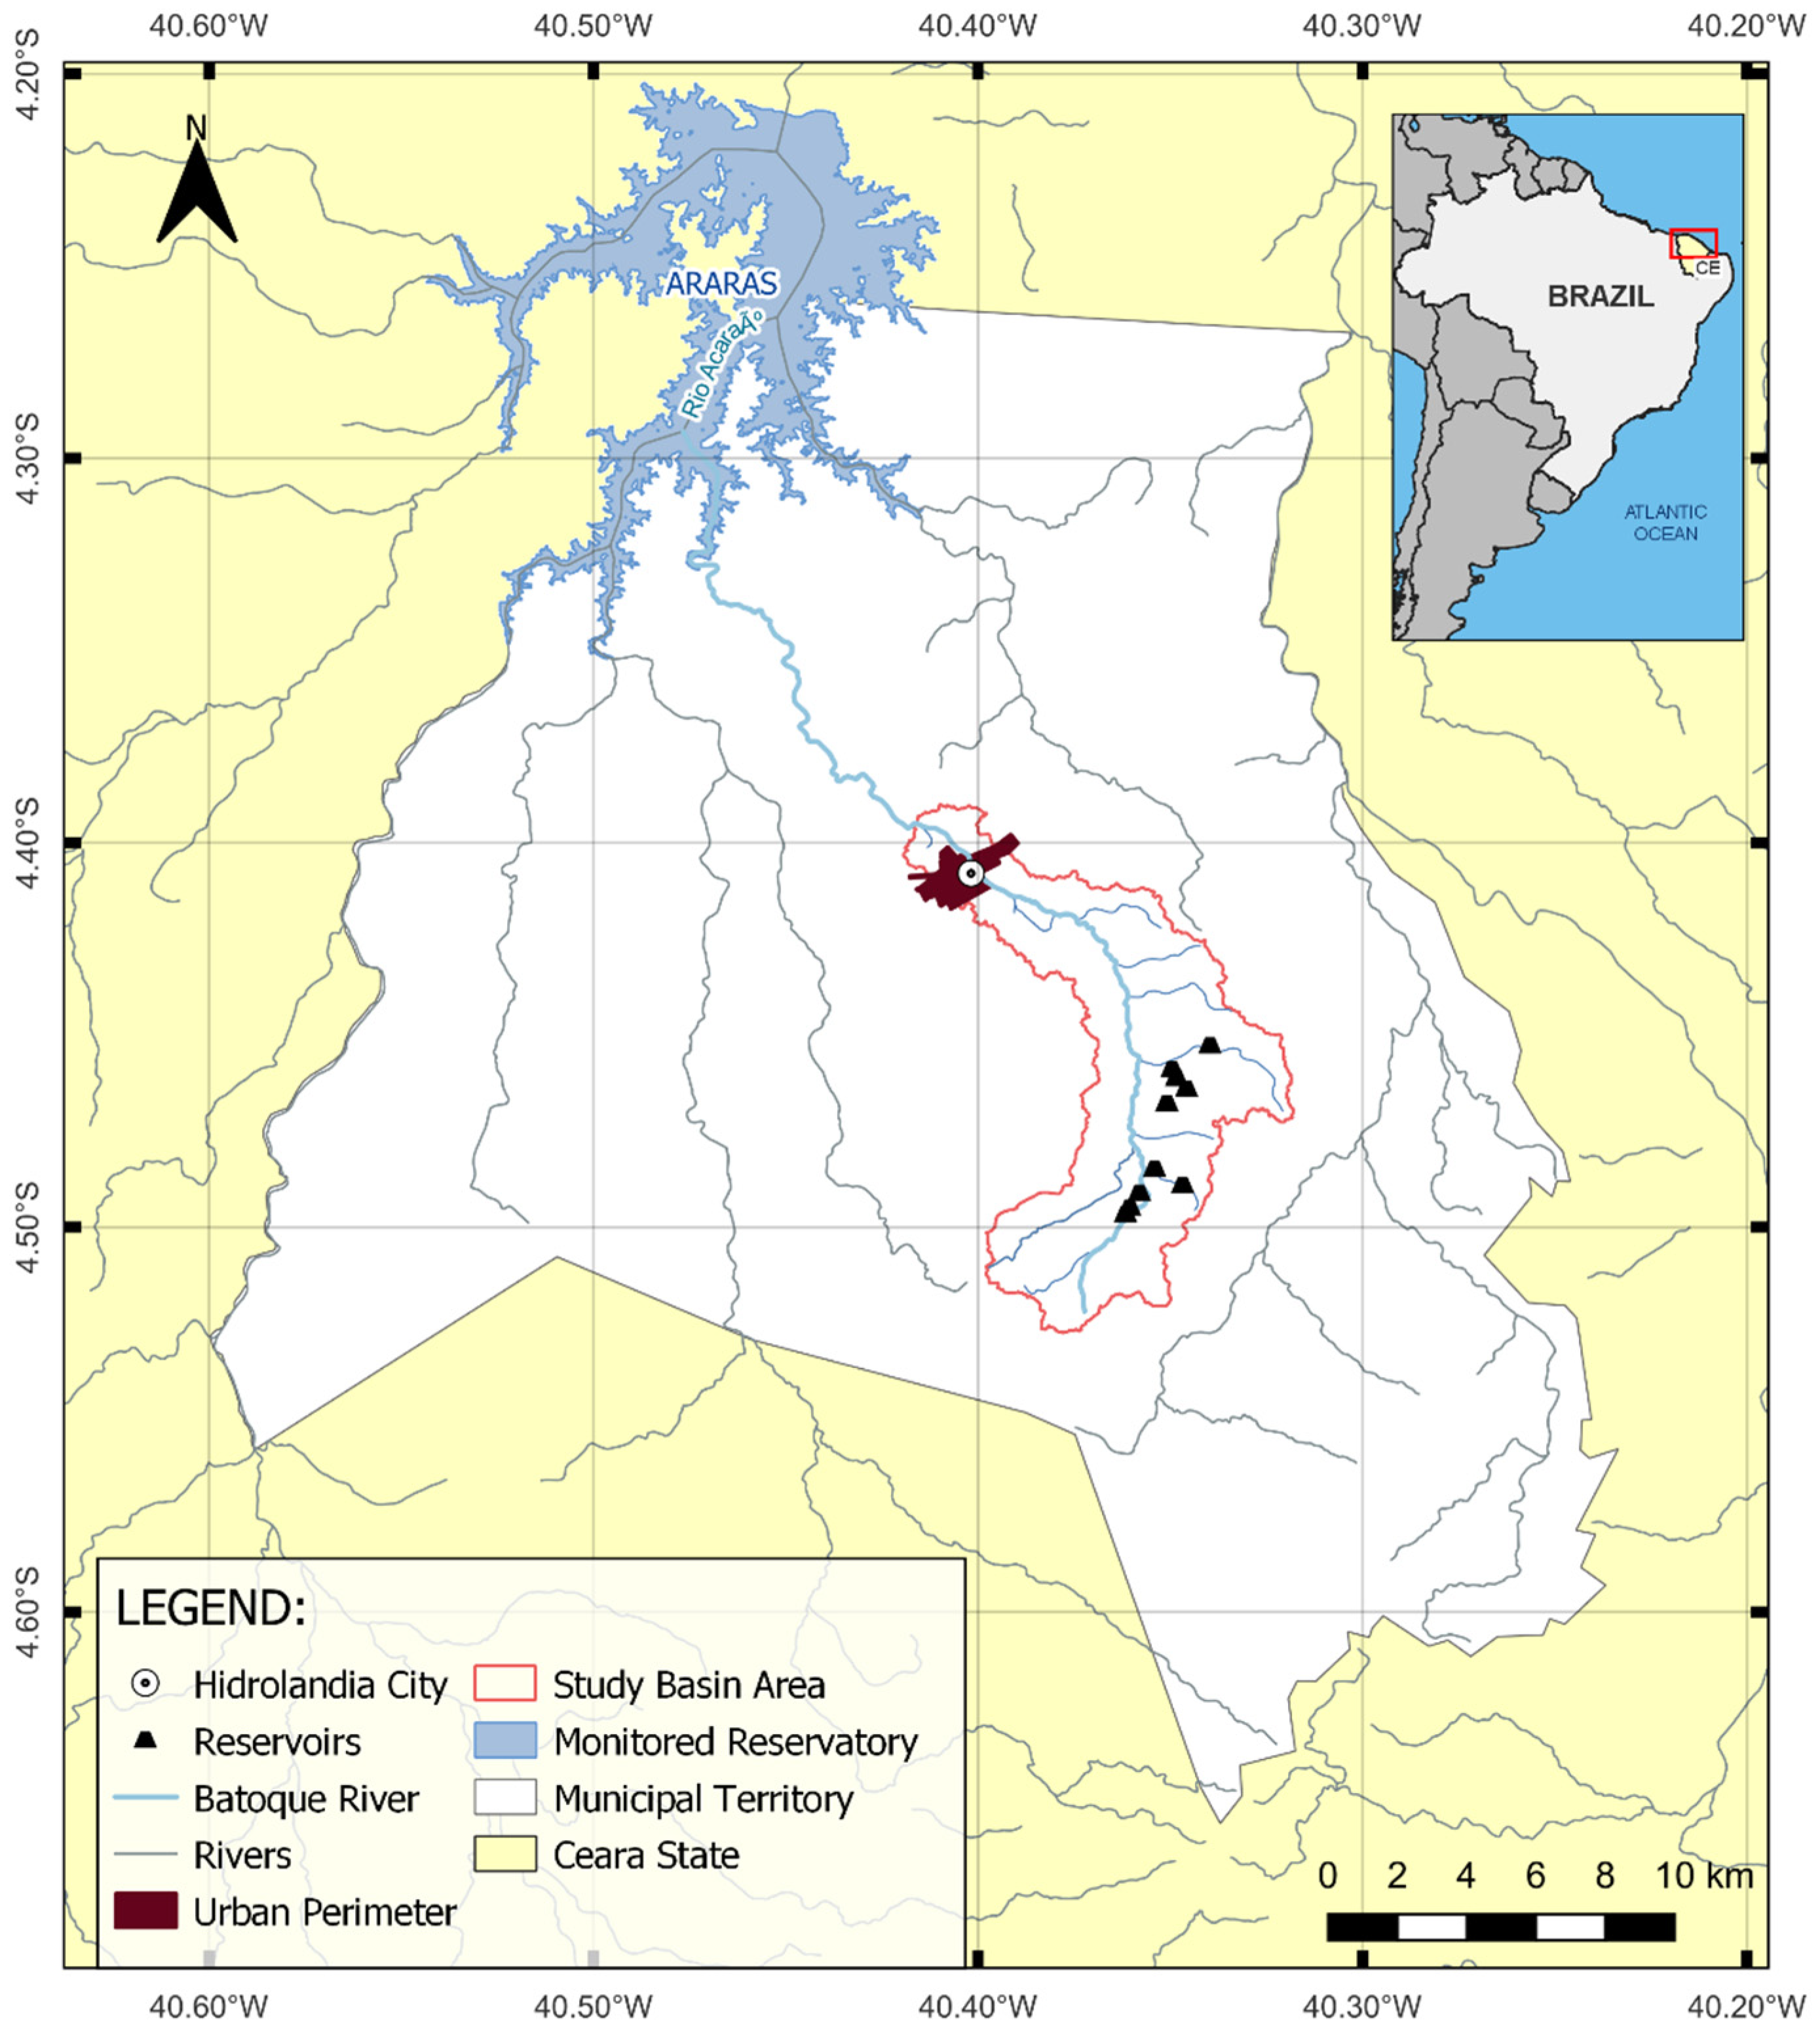
The territory of the state of Ceara is almost entirely inserted (about 90%) in the Brazilian semi-arid region, characterized by low precipitation but with high temporal and spatial variability, high evaporation, shallow soils, and intermittent rivers. The city of Hidrolândia is in the northern region of the state of Ceará (
Figure 4). The municipality has approximately 20,000 inhabitants, most of whom live in the urban area. The city is crossed by the Batoque River that flows into the strategic reservoir of the state government—Paulo Sarasate reservoir—for human supply and coexistence with droughts.
The climate of the study area is described as tropical, hot, and semi-arid, with average annual temperature variations from 26 °C to 28 °C [
31]. The rainy season, influenced by the Intertropical Convergence Zone (ITCZ) [
31,
32], is marked by seasonality and occurs between December and July, whose peak is concentrated between March and April.
For drought convivence, the inhabitants of the rural zone tend to build small dams both on the Batoque River and on its tributaries without the assistance of a technical team. They are used in livestock and irrigation to cultivate corn, grass, beans, and other farm activities. This scenario is quite characteristic of several cities that live within the drought perimeter in the northeast. At the same time, in the urban area, there is an uncontrolled occupation of the riverbanks, and due to its intermittent character, this movement is more accentuated towards the riverbed.
In March 2020, a flood of the Batoque River occurred. According to the data provided by the Integrated Disaster Information System (S2ID in Portuguese), about 450 people were displaced, 120 people became homeless, and approximately 8000 (about 40% of the population) were somehow impacted (loss of material goods, crops, animals, physical damage to houses, or inability to travel), not to mention the damage to public property. This flood is the object of study for the application of the proposed methodology.
3. Results
The methodology proposed in this study to reconstruct the event has resulted in some interesting questions about its cause. According to the active rainfall station in the city, the maximum daily rainfall was 93 mm, while according to unofficial measurements from upstream farmers, the event accumulated around 200 mm in private rain gauges.
3.1. Social Perception
A social media search resulted in a collection of amateur photos taken by the population showing the damage in their properties, also perceivable is the water stain on the residence’s walls indicating the water level in that site.
As the government agencies’ sources, we retrieved official information about the disaster from the city hall and the civil defense. The information obtained was the location of the residencies affected directly by the flood, aerial photos post-disaster, and the total losses registered in the S2ID national database (
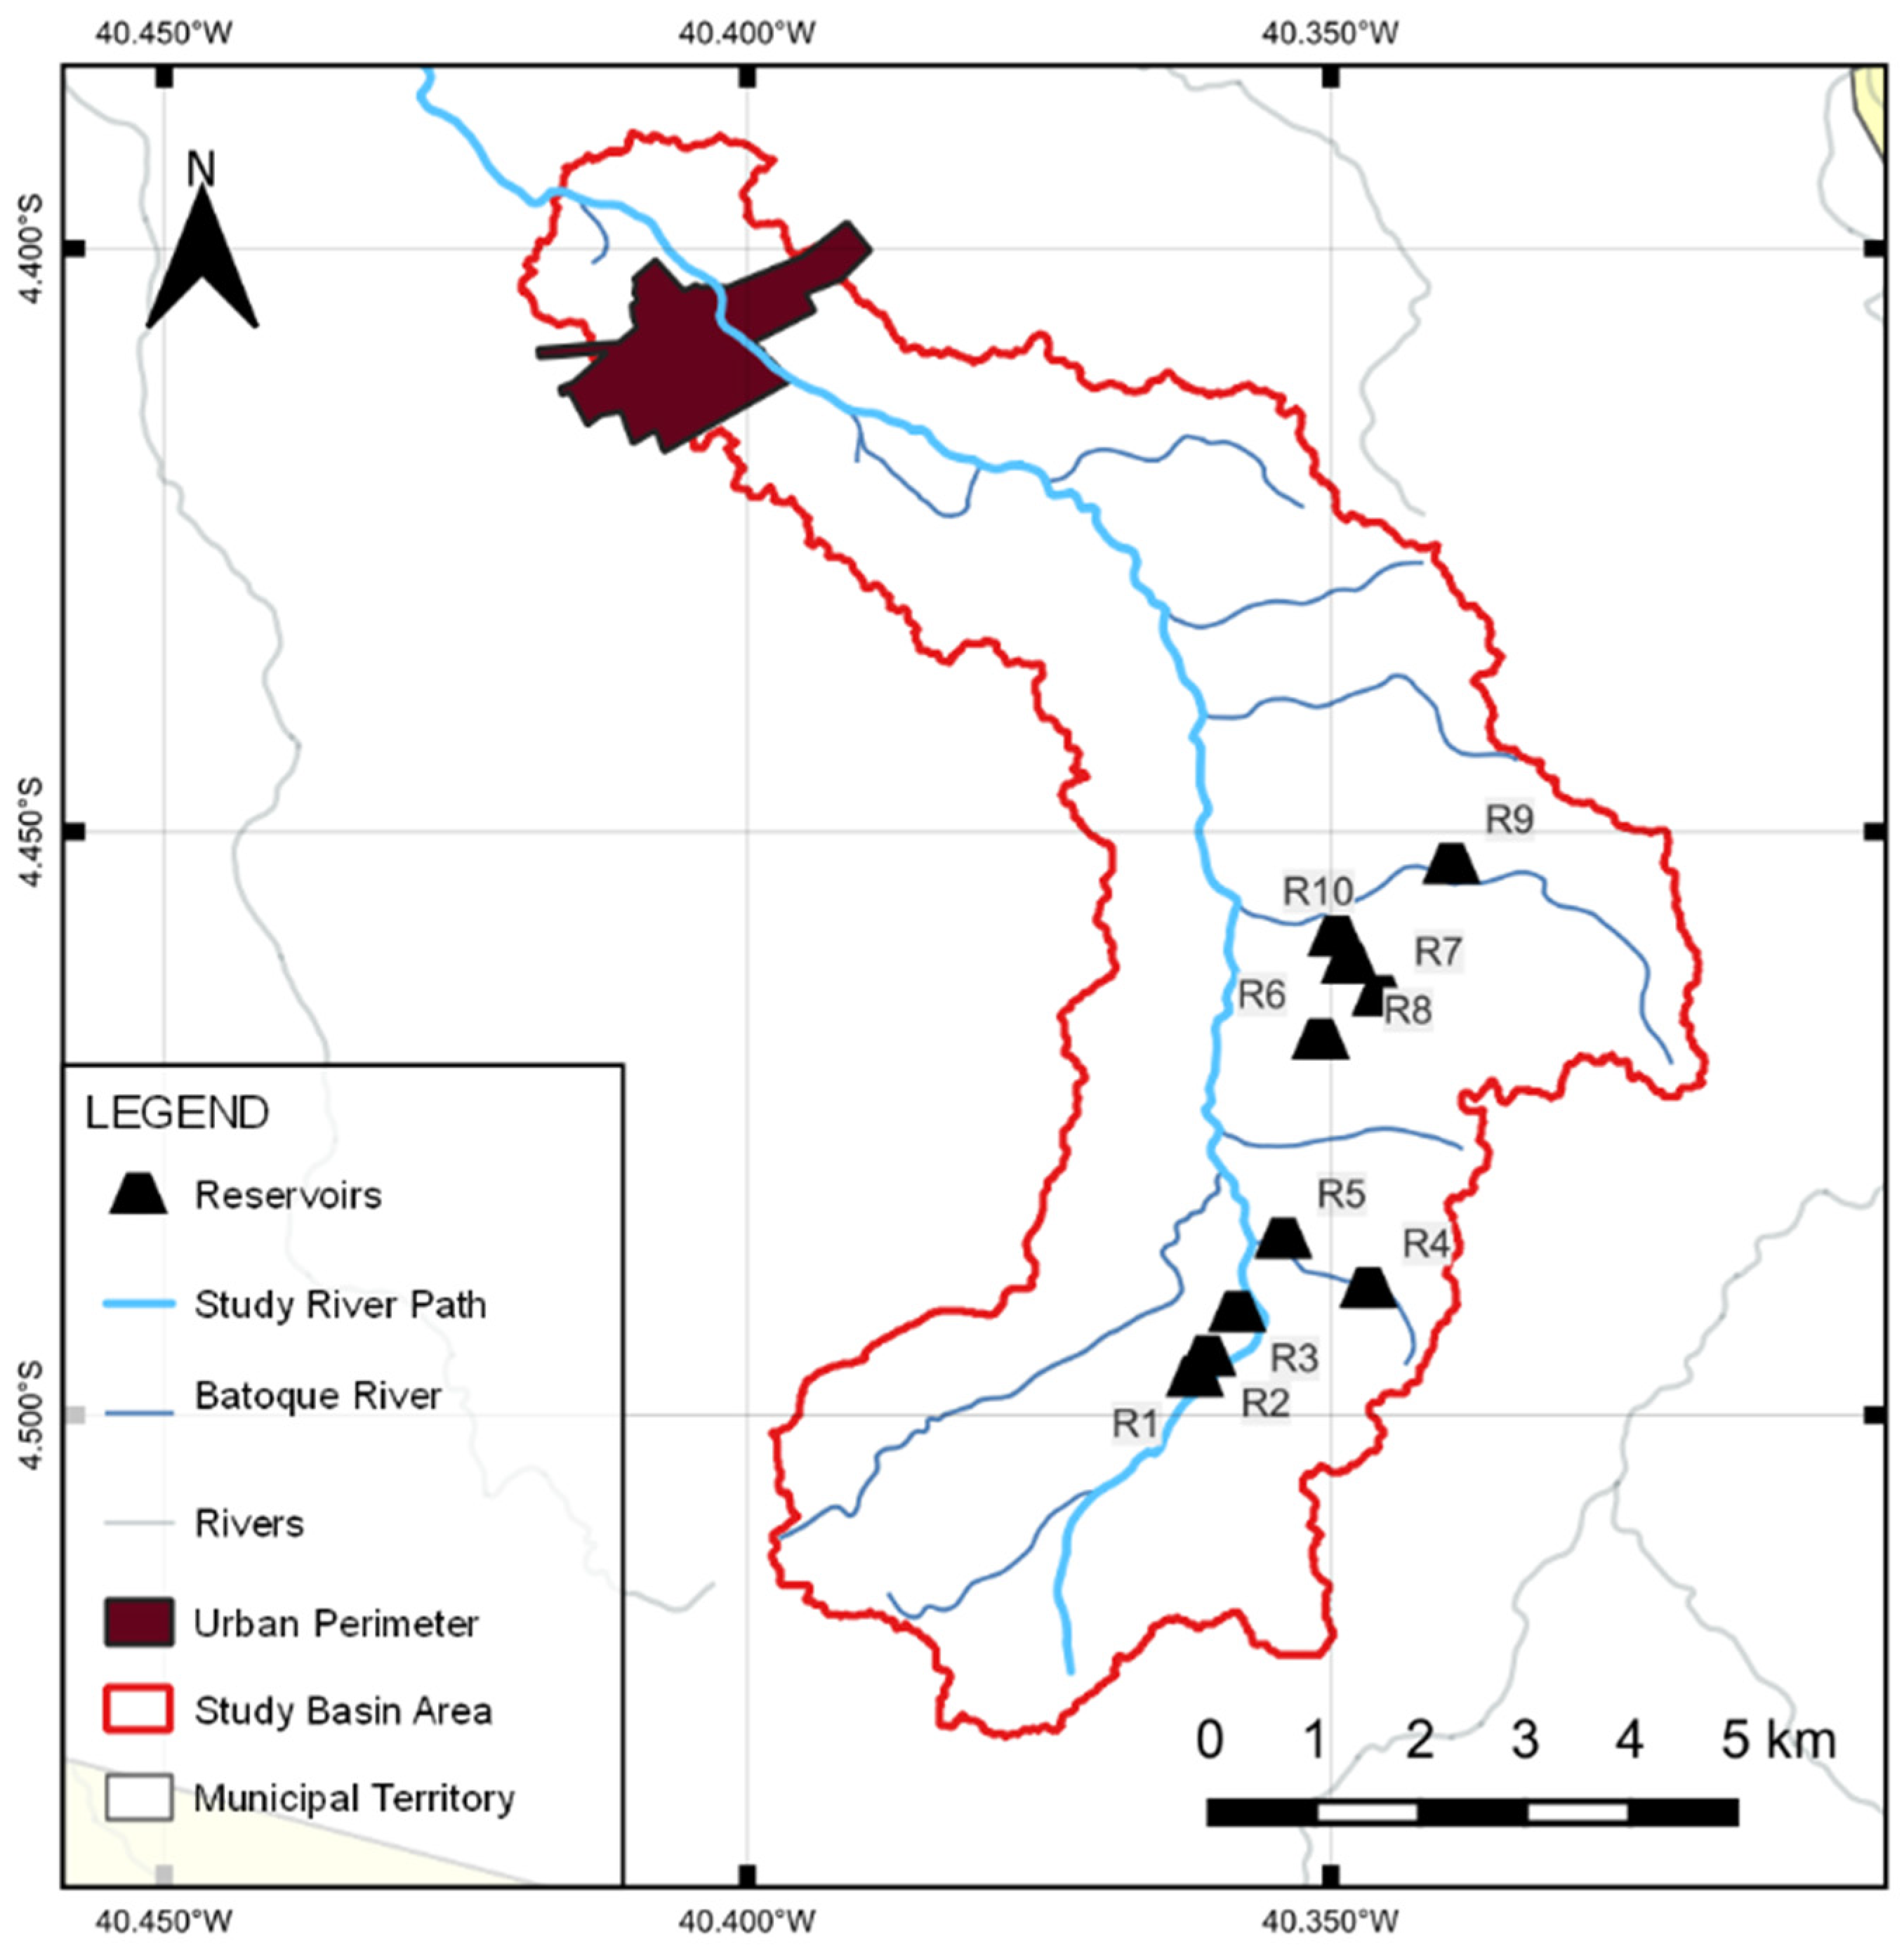
Figure 5). Furthermore, the civil defense and the city hall were notified of the simultaneous rupture of 36 small dams within the municipality’s territory, 10 of which were in the hydrographic basin of the study (
Figure 6). We hypothesized that these breachings could have an impact on the disaster floodplain, so we proposed the simulation of the dam breaks as an additional scenario in the hydraulic modeling of the flood for determining its impact. We also included these dams as additional observation points for the following field visits.
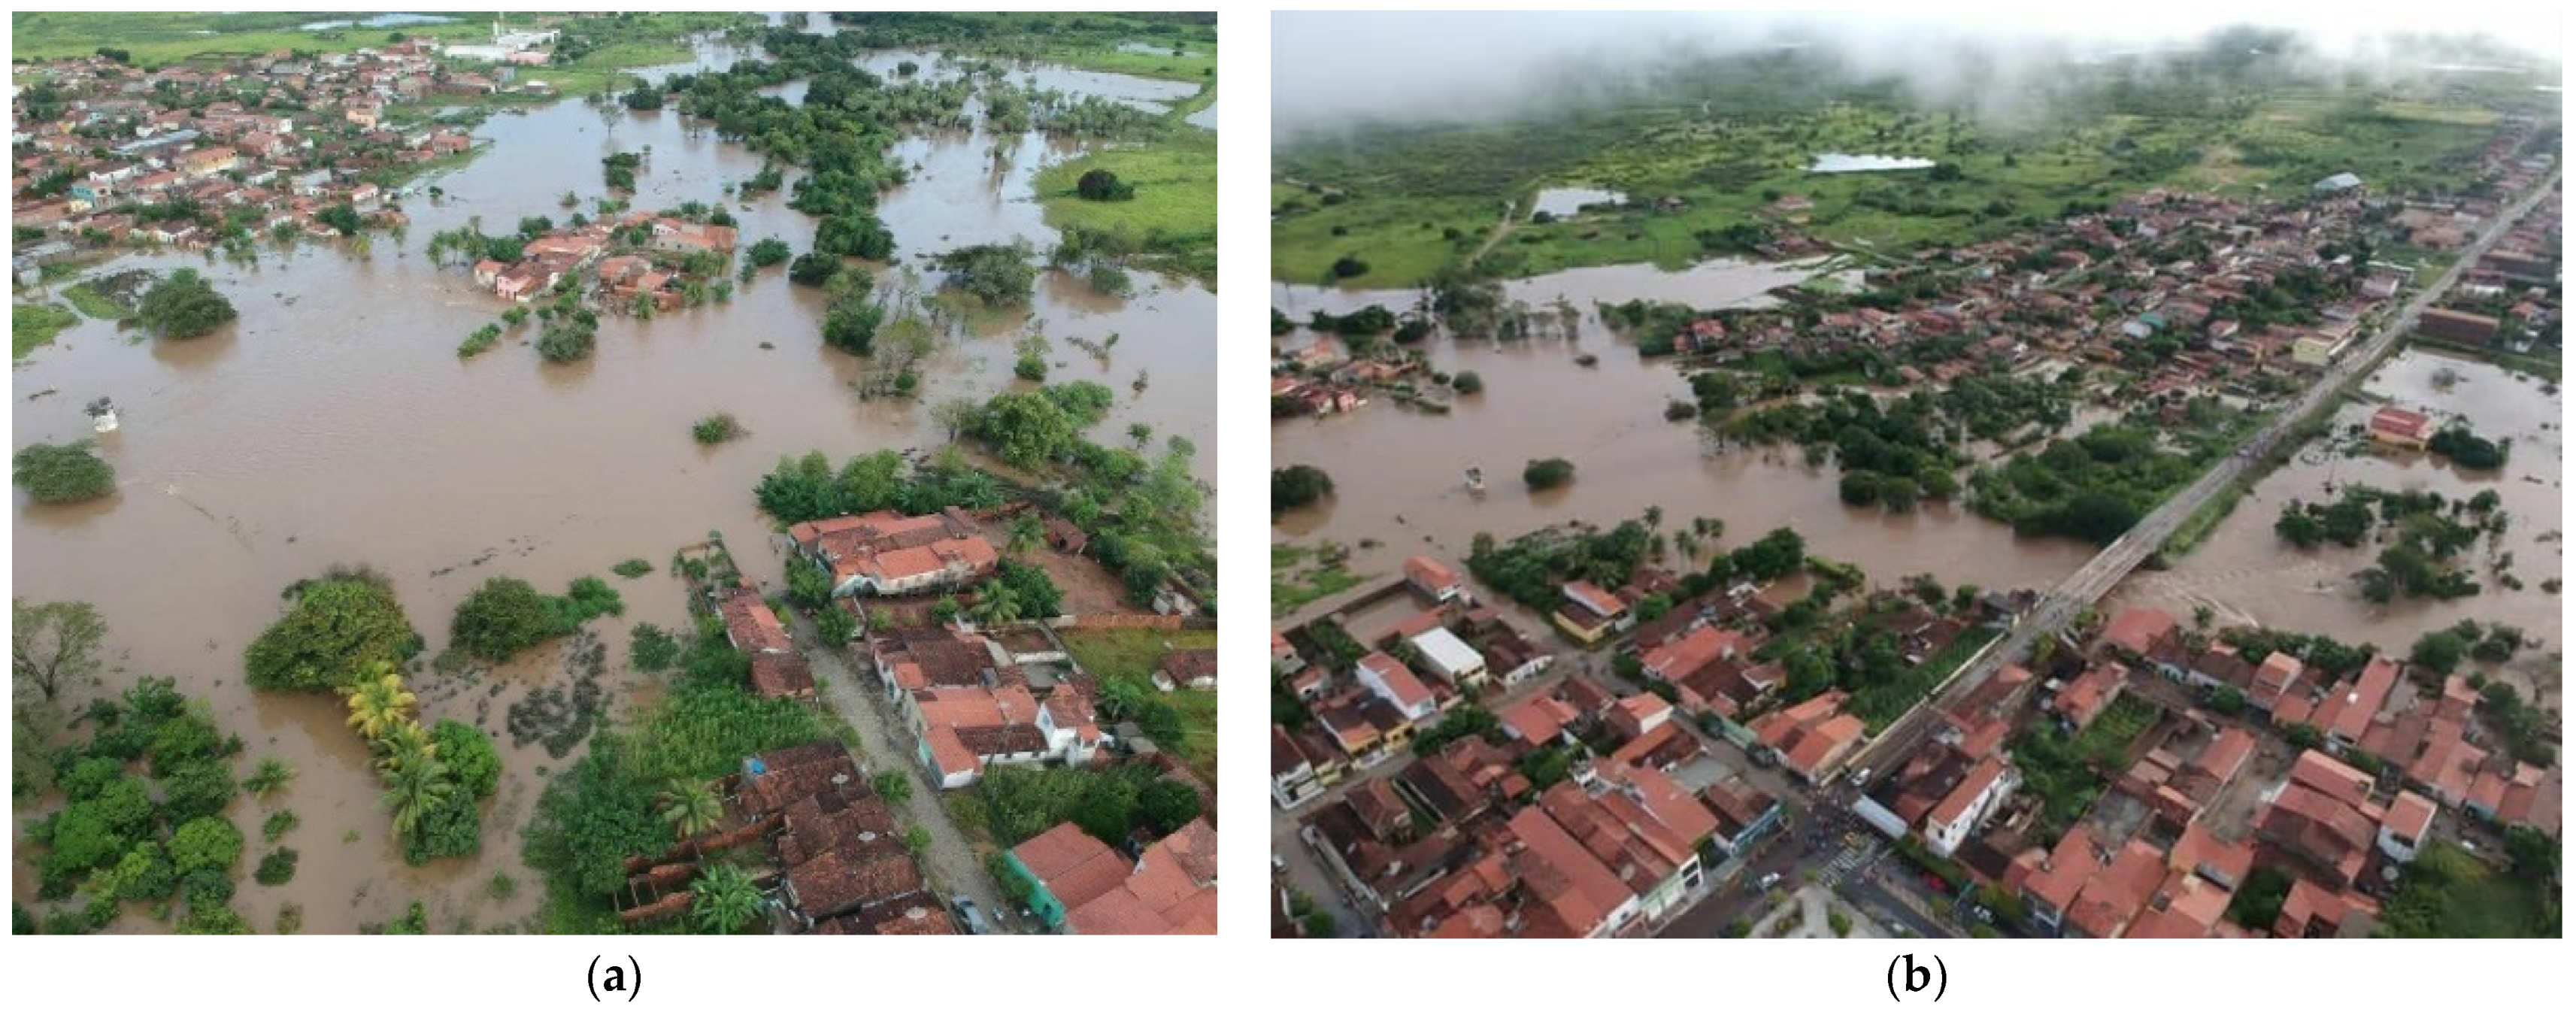
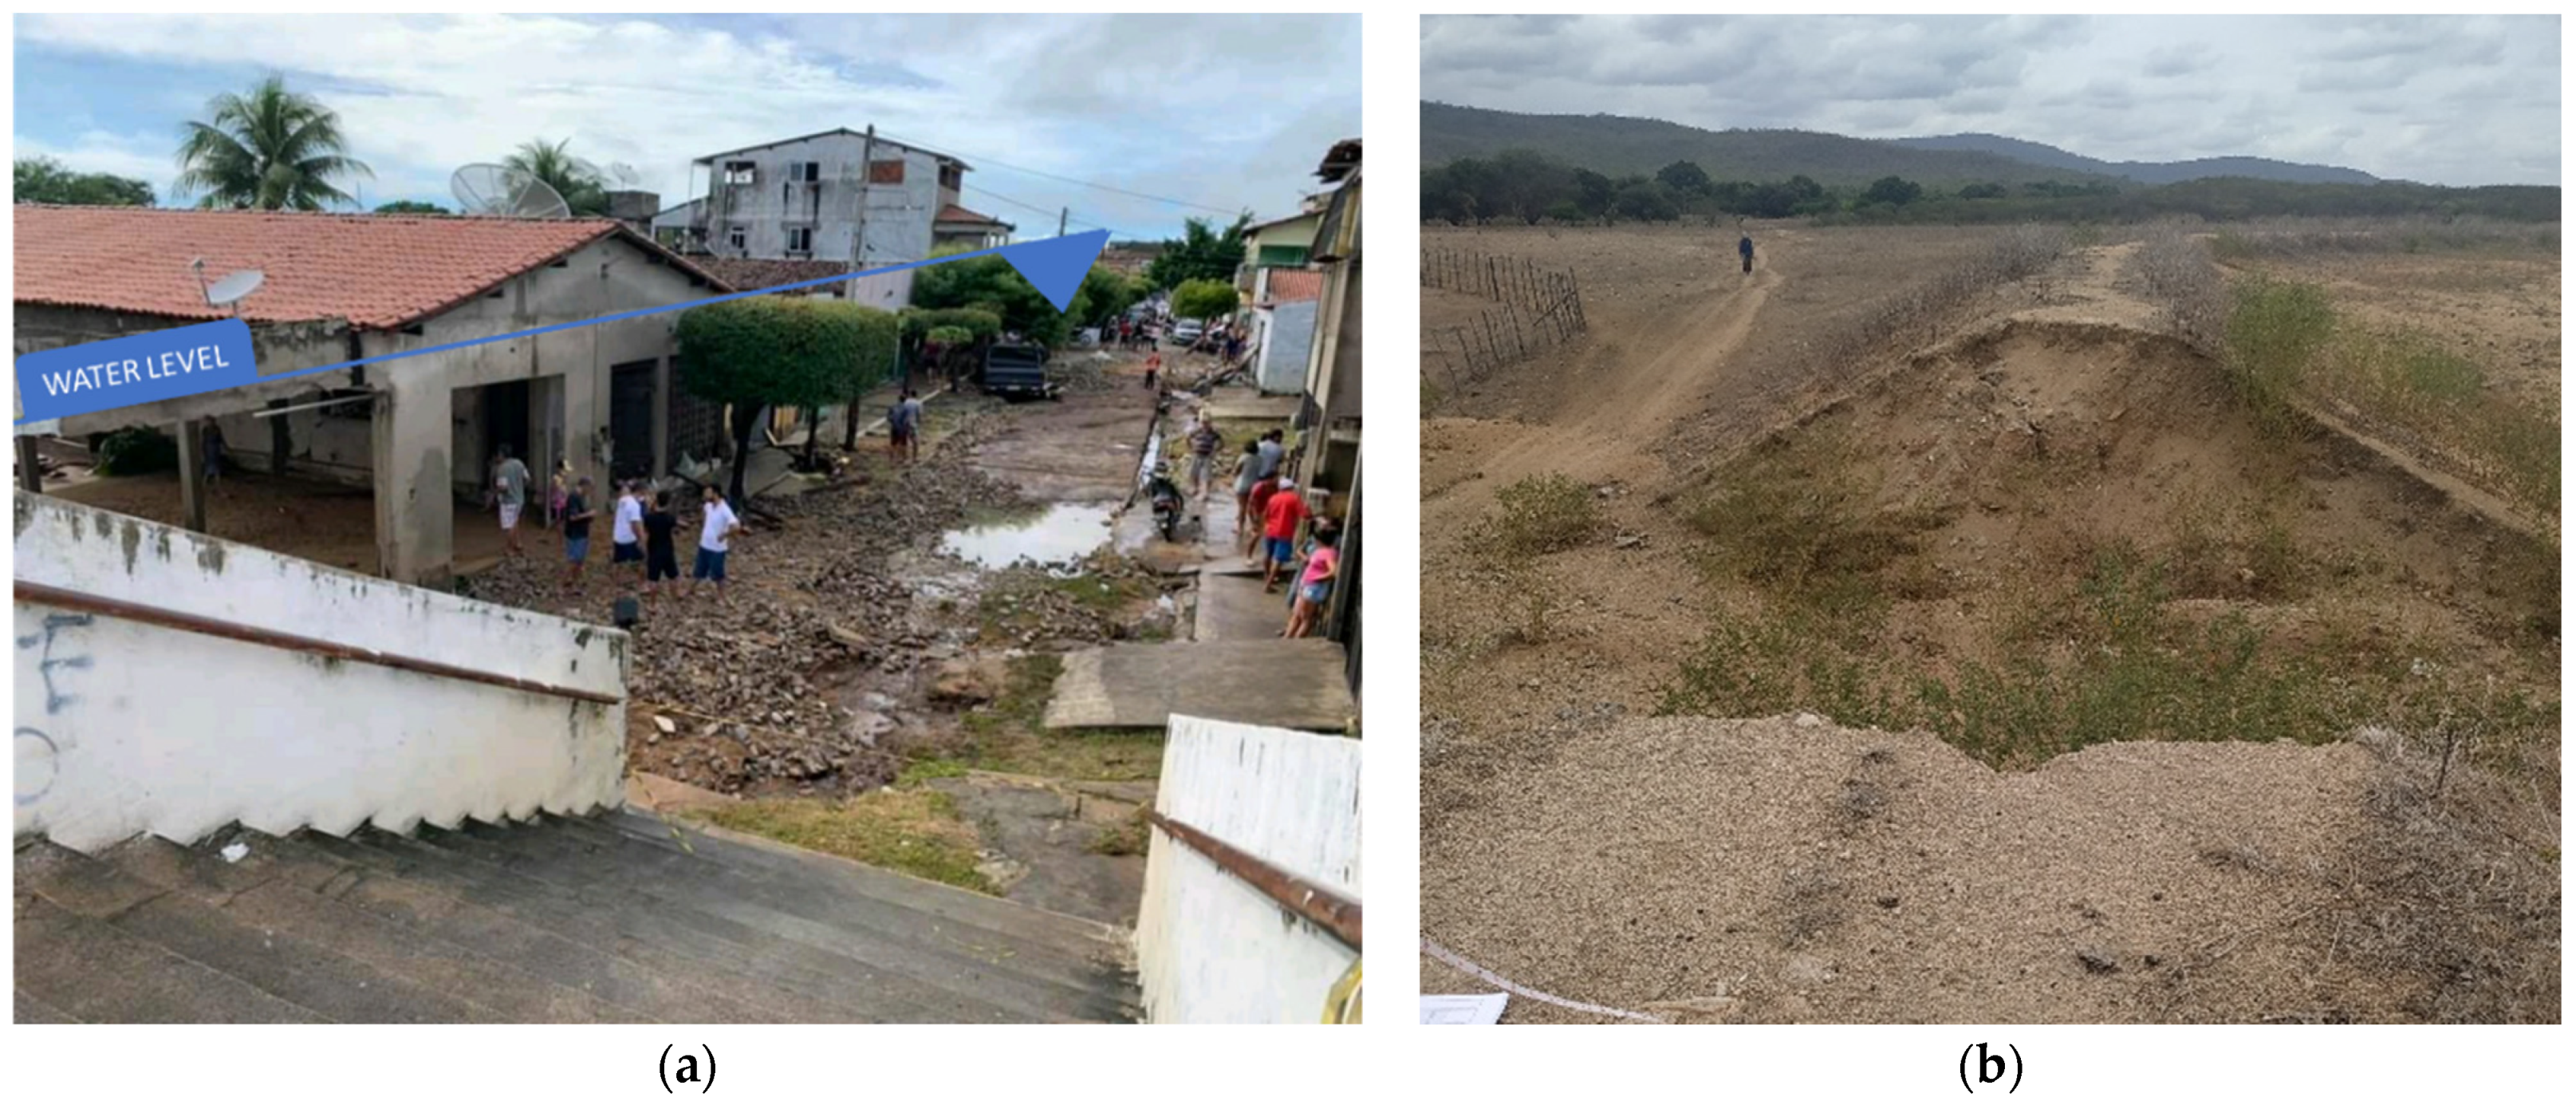
On a visit to the city on 26 March 2022, 01 day after the event, we could see some clear indicators of the water height such as watermarks on walls (
Figure 7a), such as buil-dings structurally affected, water stains on the walls, furniture losses seen outside the residences, sediments accumulated outside the river bed, these field observations motivated the questions in the interview with the affected population.
As mentioned, we asked questions to the affected about how far the water reached, the approximate height of the water in their properties, and their perception of the cause of the event. This resulted in answers such as: “I lost my couch”, “The water covered my fridge”, “The water reached the roof”, “The water was up to my waist”, and “The water was not more than knee height”. That information was essential to design the observed flood extent with the estimated water level.
The visit to the breached dams, on the same day, showed that they were built from earth and clay compaction (
Figure 7b) and that there were irregularities in the spillways—they were not sized correctly. This problem may have contributed to the simultaneous disruptions. Spillway data are mandatory for the latter simulation of the dam breaks in the HEC-HMS system, so due to the lack of records of the spillway dimensions prior to the rupture, we verified that adopting the dimension of 1 m high by 1 m wide for all dams is reasonable.
We also asked if alternative measuring of hydrological data occurs. According to Pennesi [
25], in the Brazilian semi-arid, it is a common practice for local people to observe weather and climate due to their history of convivence with droughts. We found out that several farmers had non-official pluviometers installed on their properties. The differences between their recordings and the official ones on the day of the disaster will be discussed in the next sections.
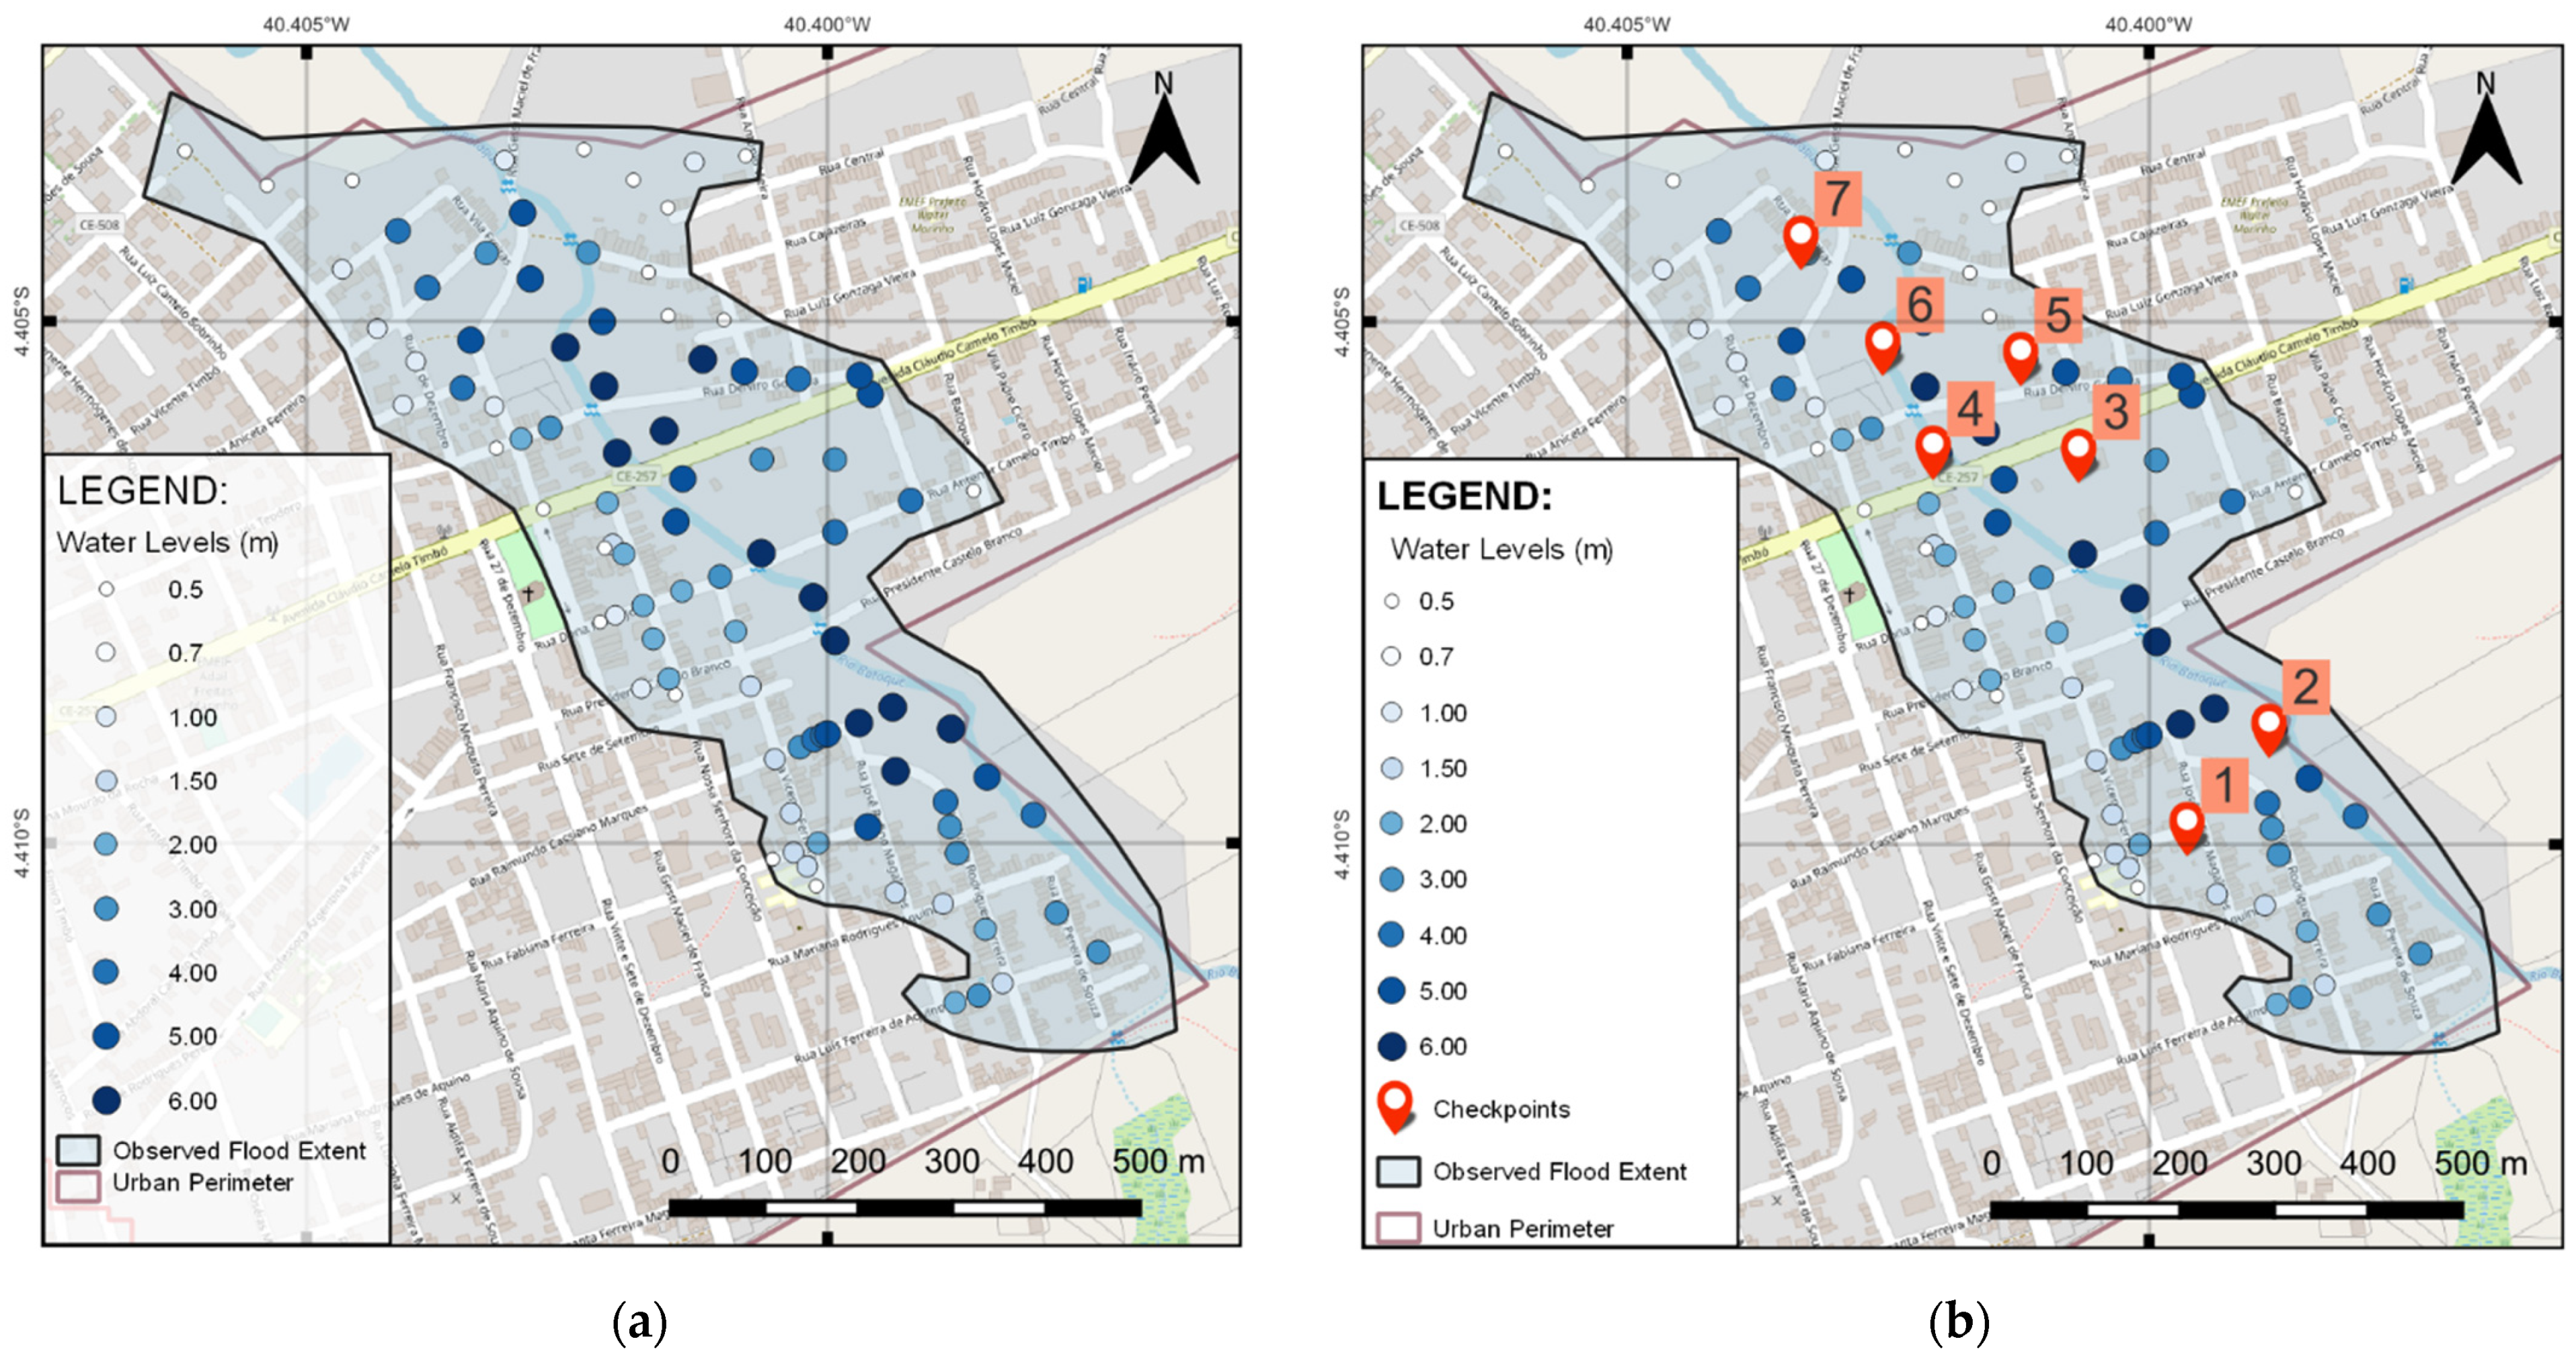
Finally, by combining and mapping all the social perception information we could build the observed floodplain (
Figure 8a). The flood patch of the observed data reached an area of about 0.42 km
2 with depths ranging from 0.50 m to 8 m, as reported by the local population. Furthermore, in the points that we had that we are most sure about the water heights such as the points where the watermarks in buildings were visible or the points where the social information from different people/sources converged were considered as checkpoints for the latter validation procedure (
Figure 8b).
3.2. Hydrological Perception
3.2.1. Catchment Data
The watershed of the Batoque River according to the metadata catalog from the National Water Agency has a total area of 112.5 km2, but for this study, we defined an outlet downstream of the city generating a sub-basin with an area of 65 km2. The main thalweg is the Batoque River, characterized as an intermittent river. The analyzed section is approximately 23 km long and has a slope of 0.0295 m/m, starting at 233 m to 163 m.
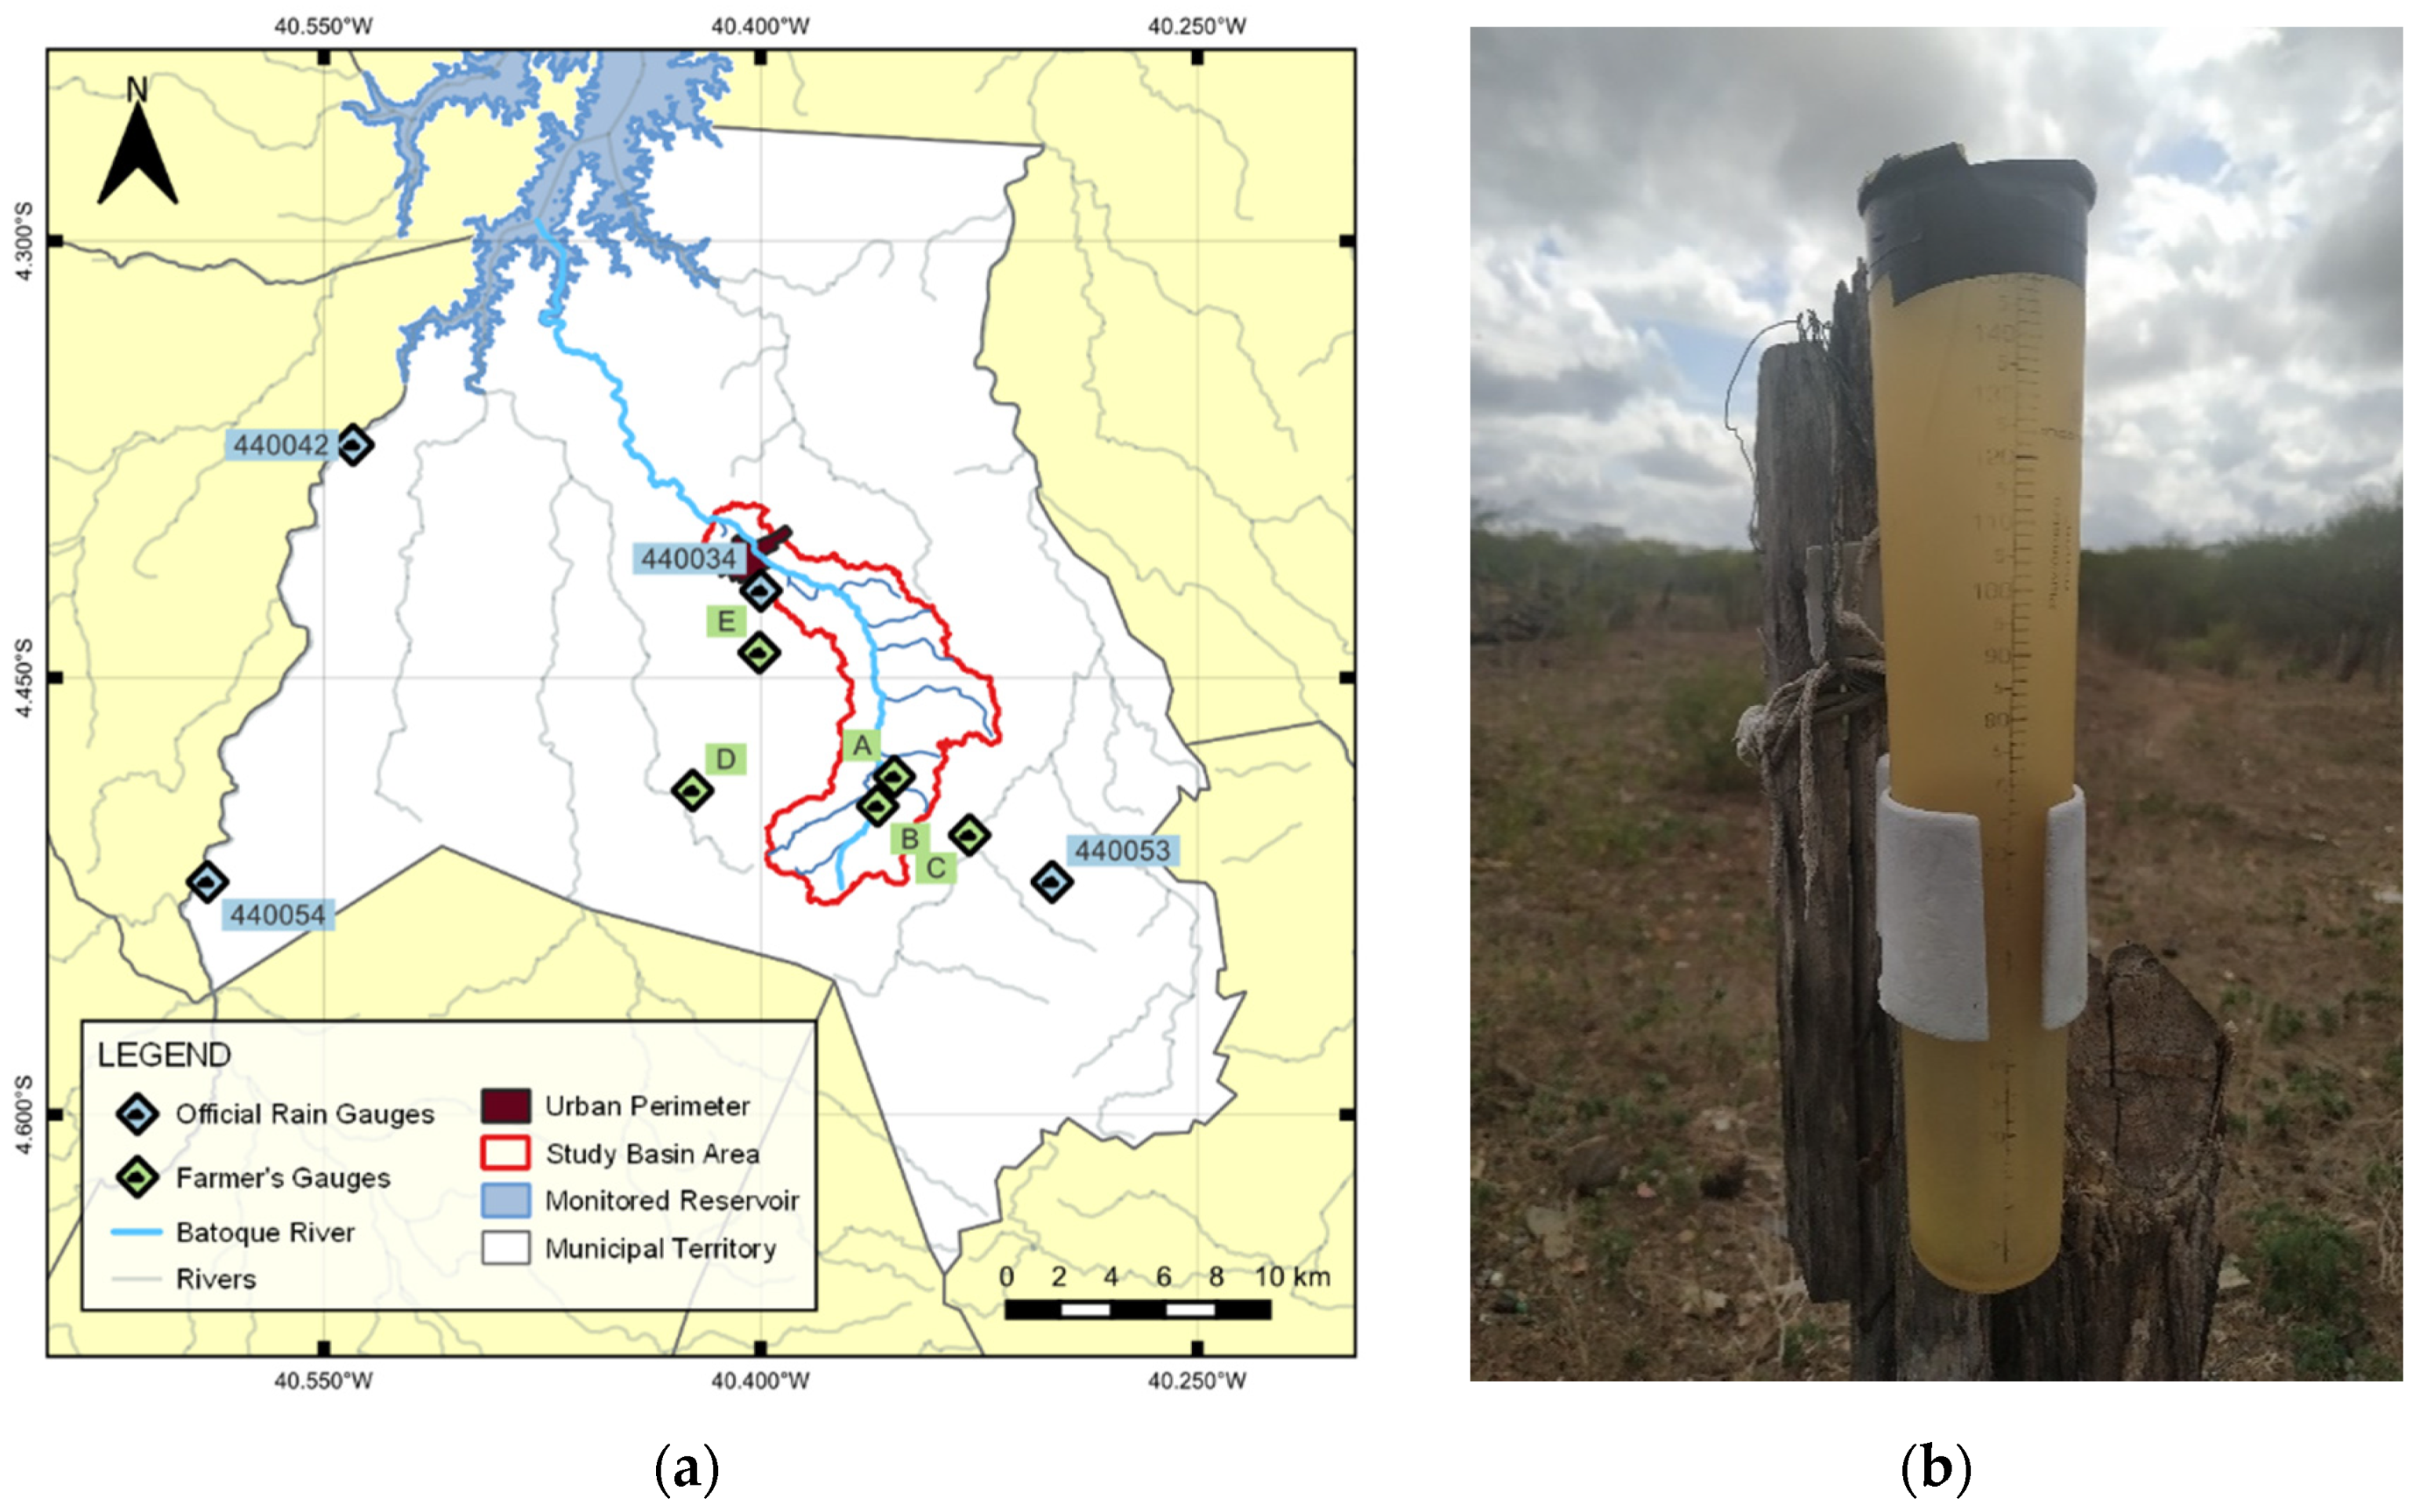
The Batoque River is not strategic for the Ceara water system, despite flowing into a state government dam. Therefore, the monitoring network in the basin is limited, consisting of five official rain gauges, four of which are active (
Figure 9a).
Rainfall data were used from the official rain gauges in the National Water Agency system (
http://www.snirh.gov.br/hidroweb/ accessed on 5 January 2021). We compared it to the farmers’ rainfall records identified during field interviews (
Figure 9b). These devices are located on rural properties upstream of the city (
Figure 9a).
Table 1 presents the summary of these stations.
The government’s rainfall stations are under the responsibility of the Ceara State Foundation for Meteorology and Water Resources (FUNCEME-CE in Portuguese), the National Department of Works Against Droughts (DNOCS in Portuguese), and the National Water Agency (ANA in Portuguese), spatialized in the territory of the municipality.
The farmer’s rain gauge is used only for individual and immediate consultation. Therefore, there is no custom for storing these data, and historical series are built using only data from official rain gauges. As shown in
Table 1, the official and the farmers’ recordings diverge on the day of the disaster.
In the analysis of field data, a careful look by the hydrologist is necessary to filter out exaggerated information and stick to plausible data [
4,
7]. The 300 mm measurement of precipitation was discarded because it does not represent the region’s reality and does not fit the average farmer’s measurements.
The rain that occurred at dawn on 25 March 2020—the day of the disaster, was officially recorded with a maximum amount of precipitation of 93 mm by rain gauge 440034 inside the city. However, during the field interviews, most persons stated that the rain was extremely unusual, reaching around 200 mm on their private rain gauges. It was noted that there is no active meter near the farmers’ rain gauges, so we decided to analyze the official 93 mm record and the alternative 200 mm record. The simulation of the floodplain by the two different rain data allows the investigation of their impact on the watershed and the discussion of which of the records is more plausible with the event.
3.2.2. Dam Break Data
An internal survey carried out by the municipal government on the impacts caused by the event revealed the occurrence of a simultaneous rupture of ten small reservoirs. To investigate the hypothesis above, the output is to simulate the dam break in the HEC-HMS software to obtain the rupture hydrographs of the dams and add them as input data in the HEC-RAS software to generate the flooded spot. For this, the HEC-HMS system requires data from each dam: elevation-area-volume curve, data from the dam massif, the spillway, and the breach and trigger time.
Small dams on farms in the rural areas of northeastern Brazil are generally built without technical projects. The ideal way to obtain the elevation–area curve (EAC) would be to conduct a field study with topography equipment, but due to the lack of such a study, we decided to estimate these variables by combining the contours generated by ALOS DEM with satellite images from Google Earth. In the field interviews, all the farmers claimed that their dams had the maximum storage volume before they burst, so the Google Timelapse application was used to obtain a satellite image of the water spot in each dam and superimpose them on the curves, thus extracting the EAC. In addition, with the help of contour lines, general information about the breach, such as the top elevation and bottom elevation, was obtained. The bottom width and the breach time were determined by the simplified method of Froehlich regression equations for failures by overtopping [
33].
3.2.3. Critical Rain Modeling
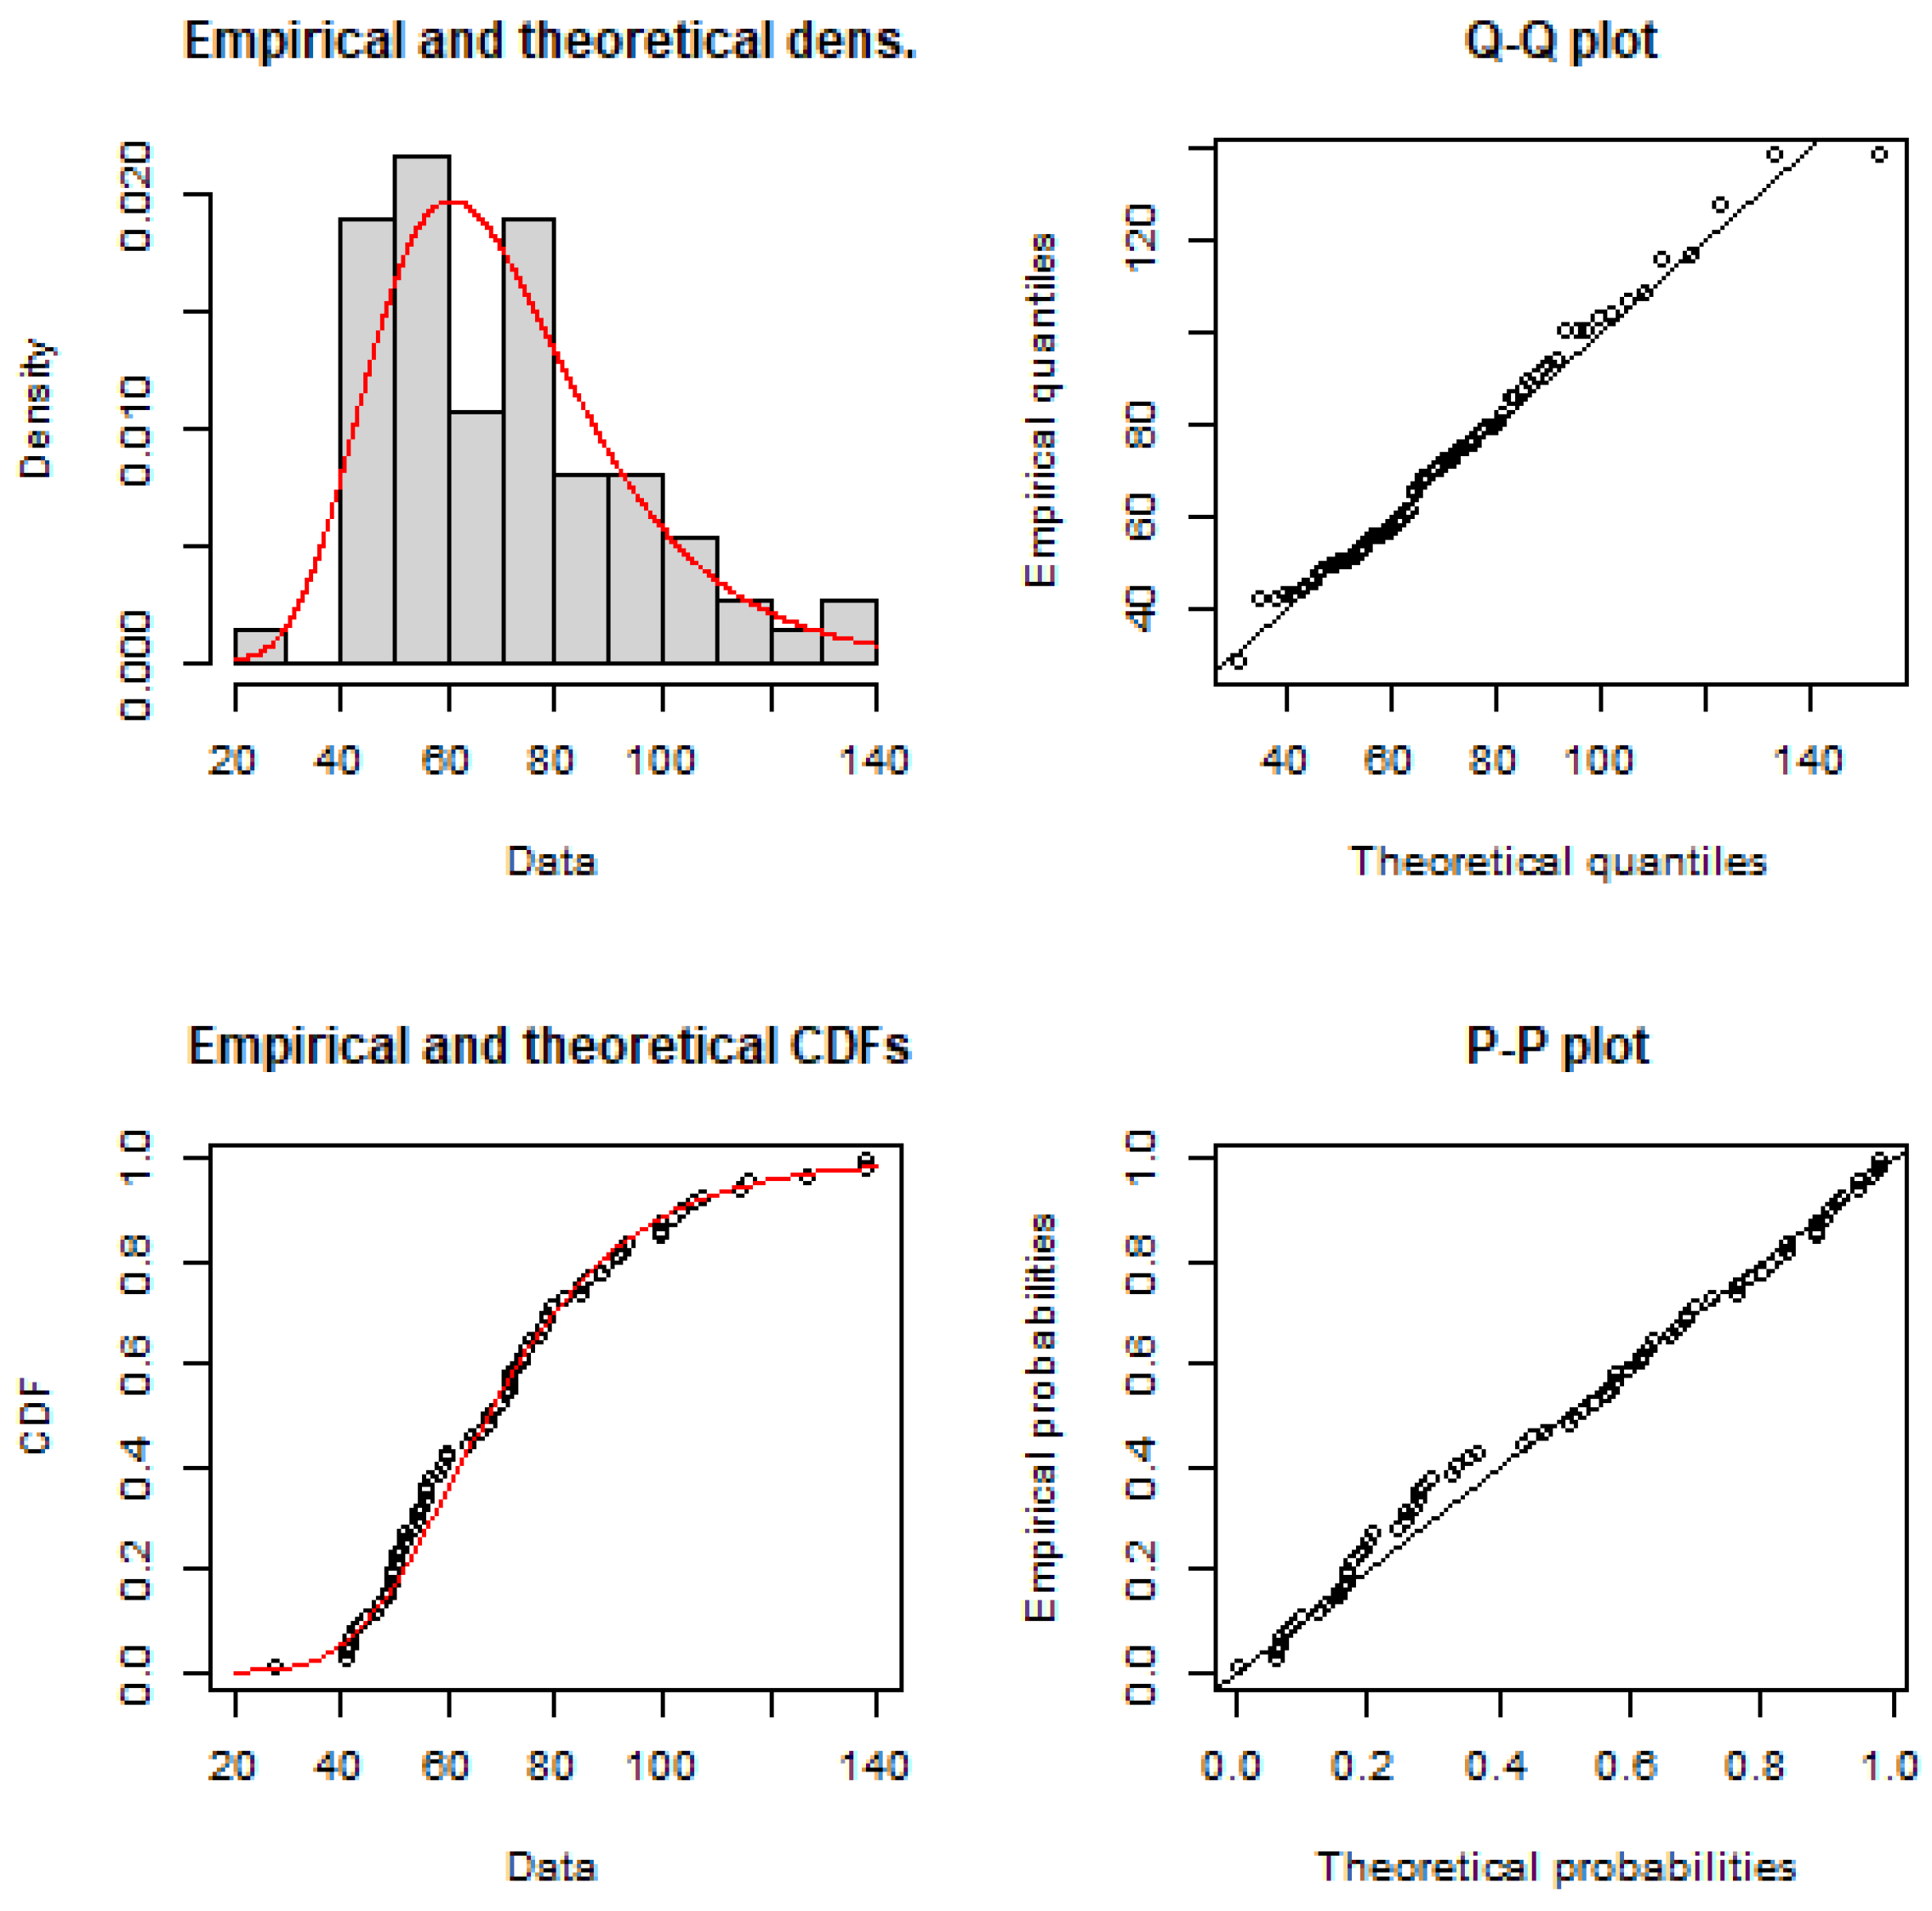
First, a frequency analysis was carried out with the historical series of the rain gauge 440002, which, despite being deactivated since 2008, has 75 years of daily rainfall records, constituting the most representative rainfall sampling. Thus, the maximum daily rainfall of each year was extracted and applied to the Normal, Gumbel, Log-Normal, Gamma Weibull, and Logistic.
Table 2 shows the performance of each distribution according to the goodness-of-fit tests. The statistical tests used were Chi-squared (X2), Kolmogorov Sminorv, and Anderson Darling. The Gumbel distribution was chosen to represent the series as it presented the best X2 and KS statistics and a low AD value.
Figure 10 shows the distribution fitted against some of the data properties. It allows the visualization of the adequacy of the fit.
3.2.4. Design Storm
The maximum total precipitation on the day of the flood was 93 mm, according to the rain gauge of official agencies; meanwhile, according to the rain gauge of the farmers, the rainfall was about 200 mm. The return time of these records was obtained by applying the Gumbel distribution based on the rain gauge with the largest historical series and the results are shown in
Table 3.
Then, the design hyetograph for the two analyzed precipitation was calculated according to the intensity–duration–frequency equation of the city extracted from the BATISTA [
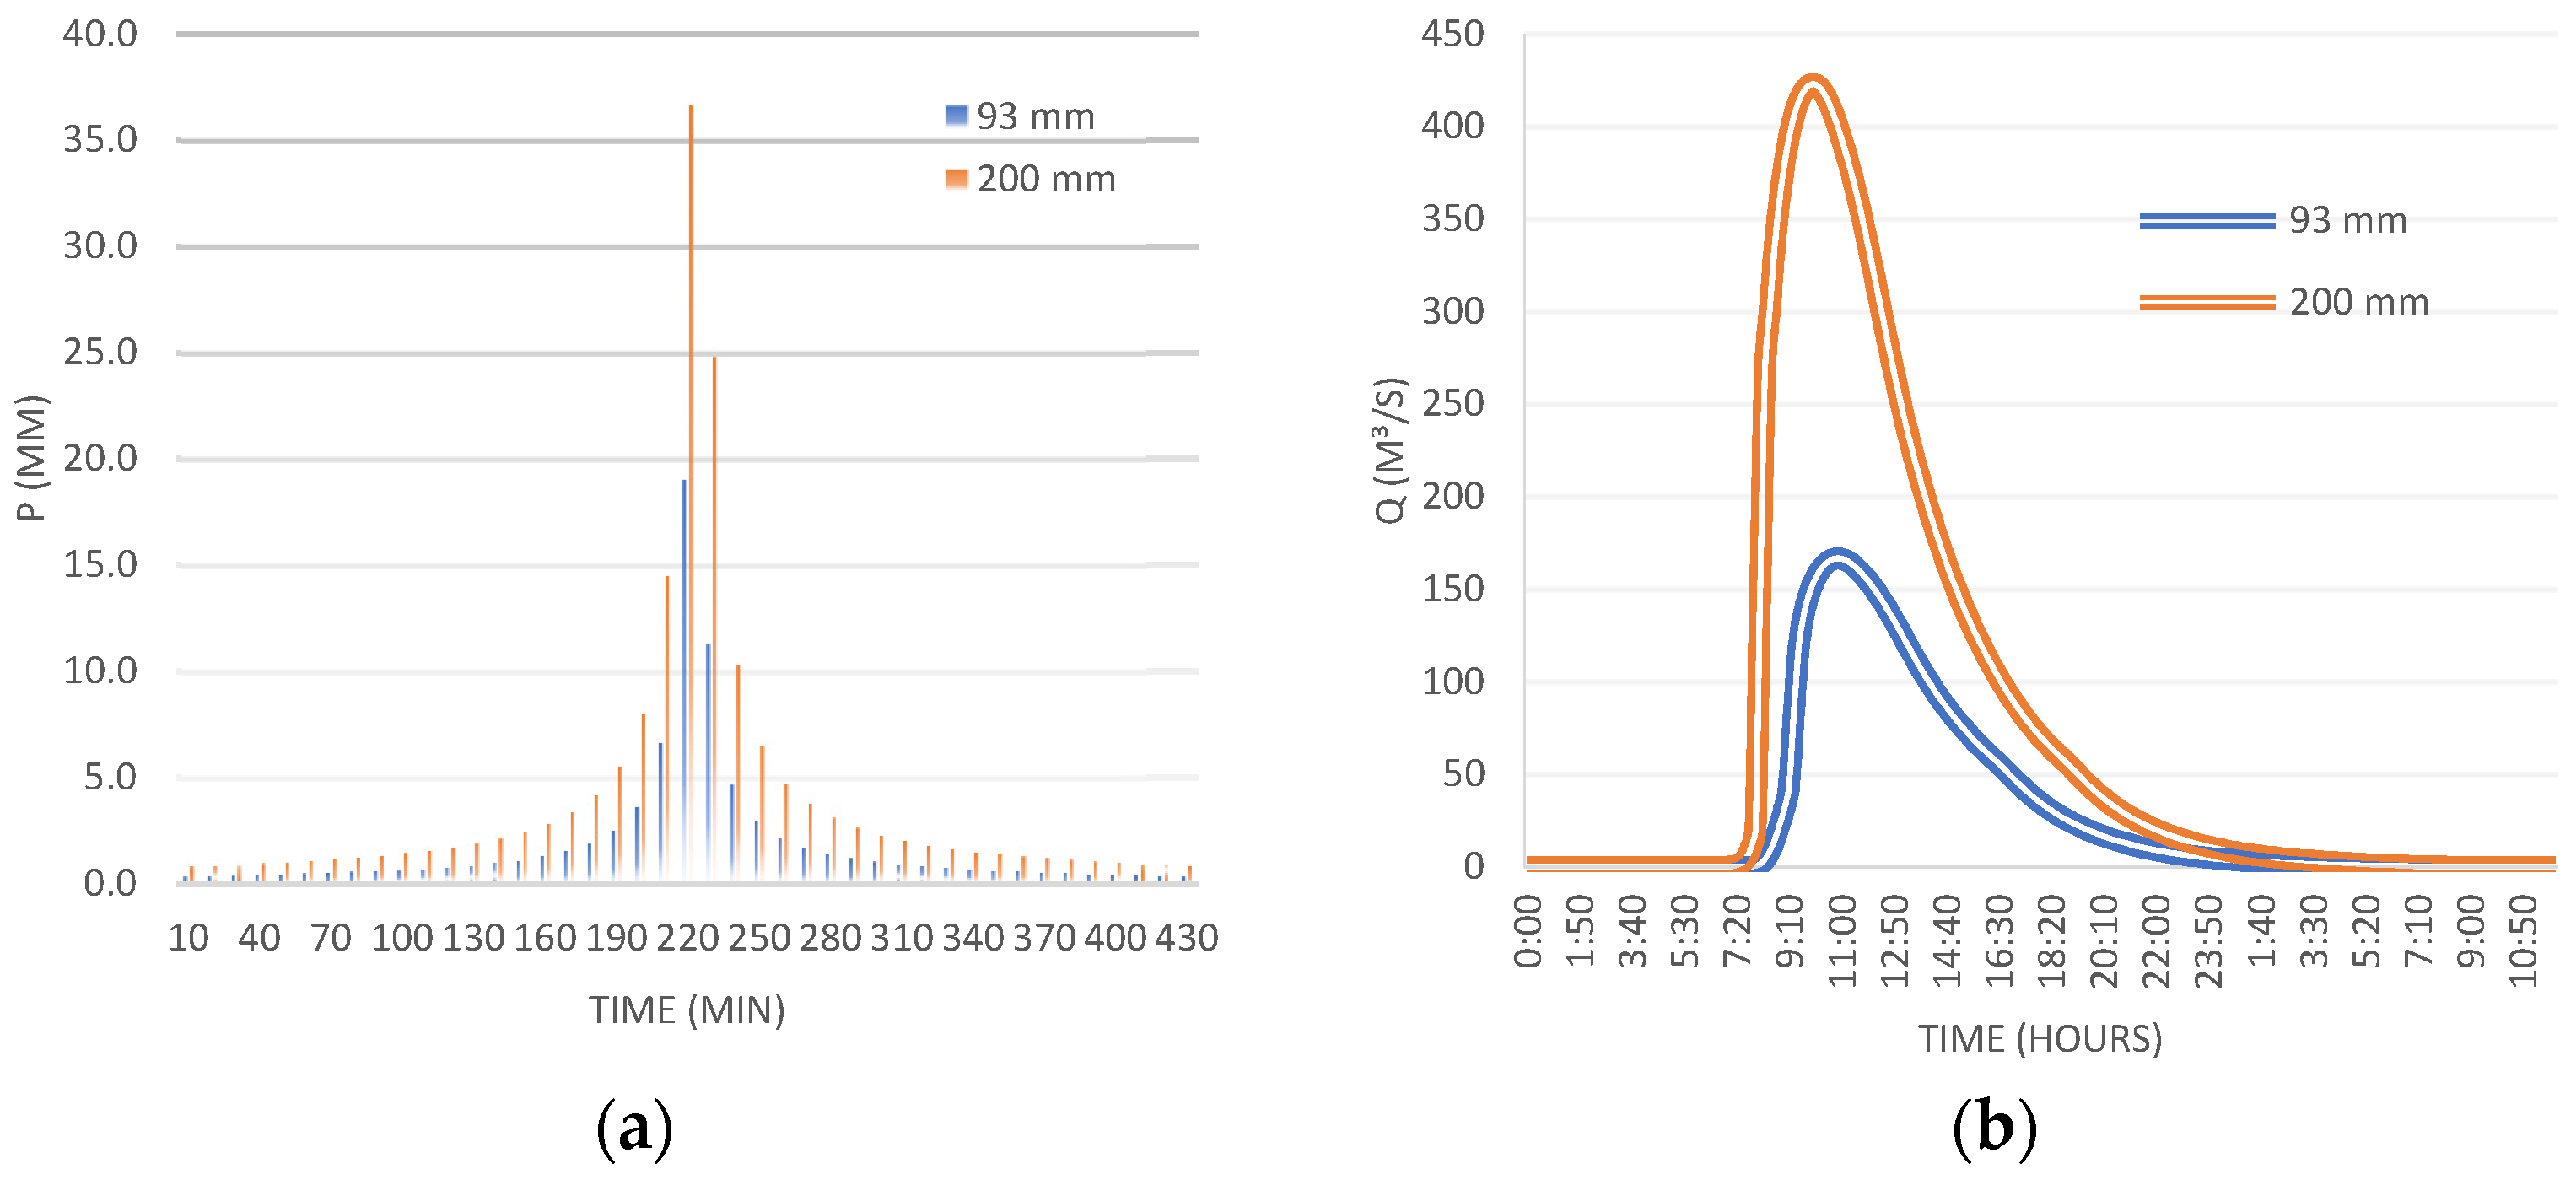
34] study. The alternating blocks method was applied for a rainfall duration of 7 h, corresponding to the basin concentration time, as shown in
Figure 11. The maximum volume for 93 mm and 200 mm rain was 19.02 mm and 36.68 mm, respectively, implying a difference of almost 52% between the scenarios.
3.2.5. Hydrologic Modeling
We fed the HMS model with the hyetograph of maximum daily rainfalls of 93 mm and 200 mm (
Figure 11a). In general, when adding a sub-basin, the program requires the following input data: the basin area (km
2), a loss method—in this case, the SCS Curve Number was adopted, which resulted in the value of 91 given the humidity conditions reported by those affected—and a transformation method—in this case, the SCS Unit Hydrograph model was used with a lag time of 60% of the basin concentration time. The baseflow method was disregarded due to the shallow soil in the region, as explained above. When adding the “river” element, it is necessary to choose a propagation method. The Muskingum-Cunge method was chosen due to the simplicity of application and parameters. After defining the input parameters, a meteorological model was created and inserted in the hyetogram of each of the precipitations.
The resulting hydrograph for both rains is presented in
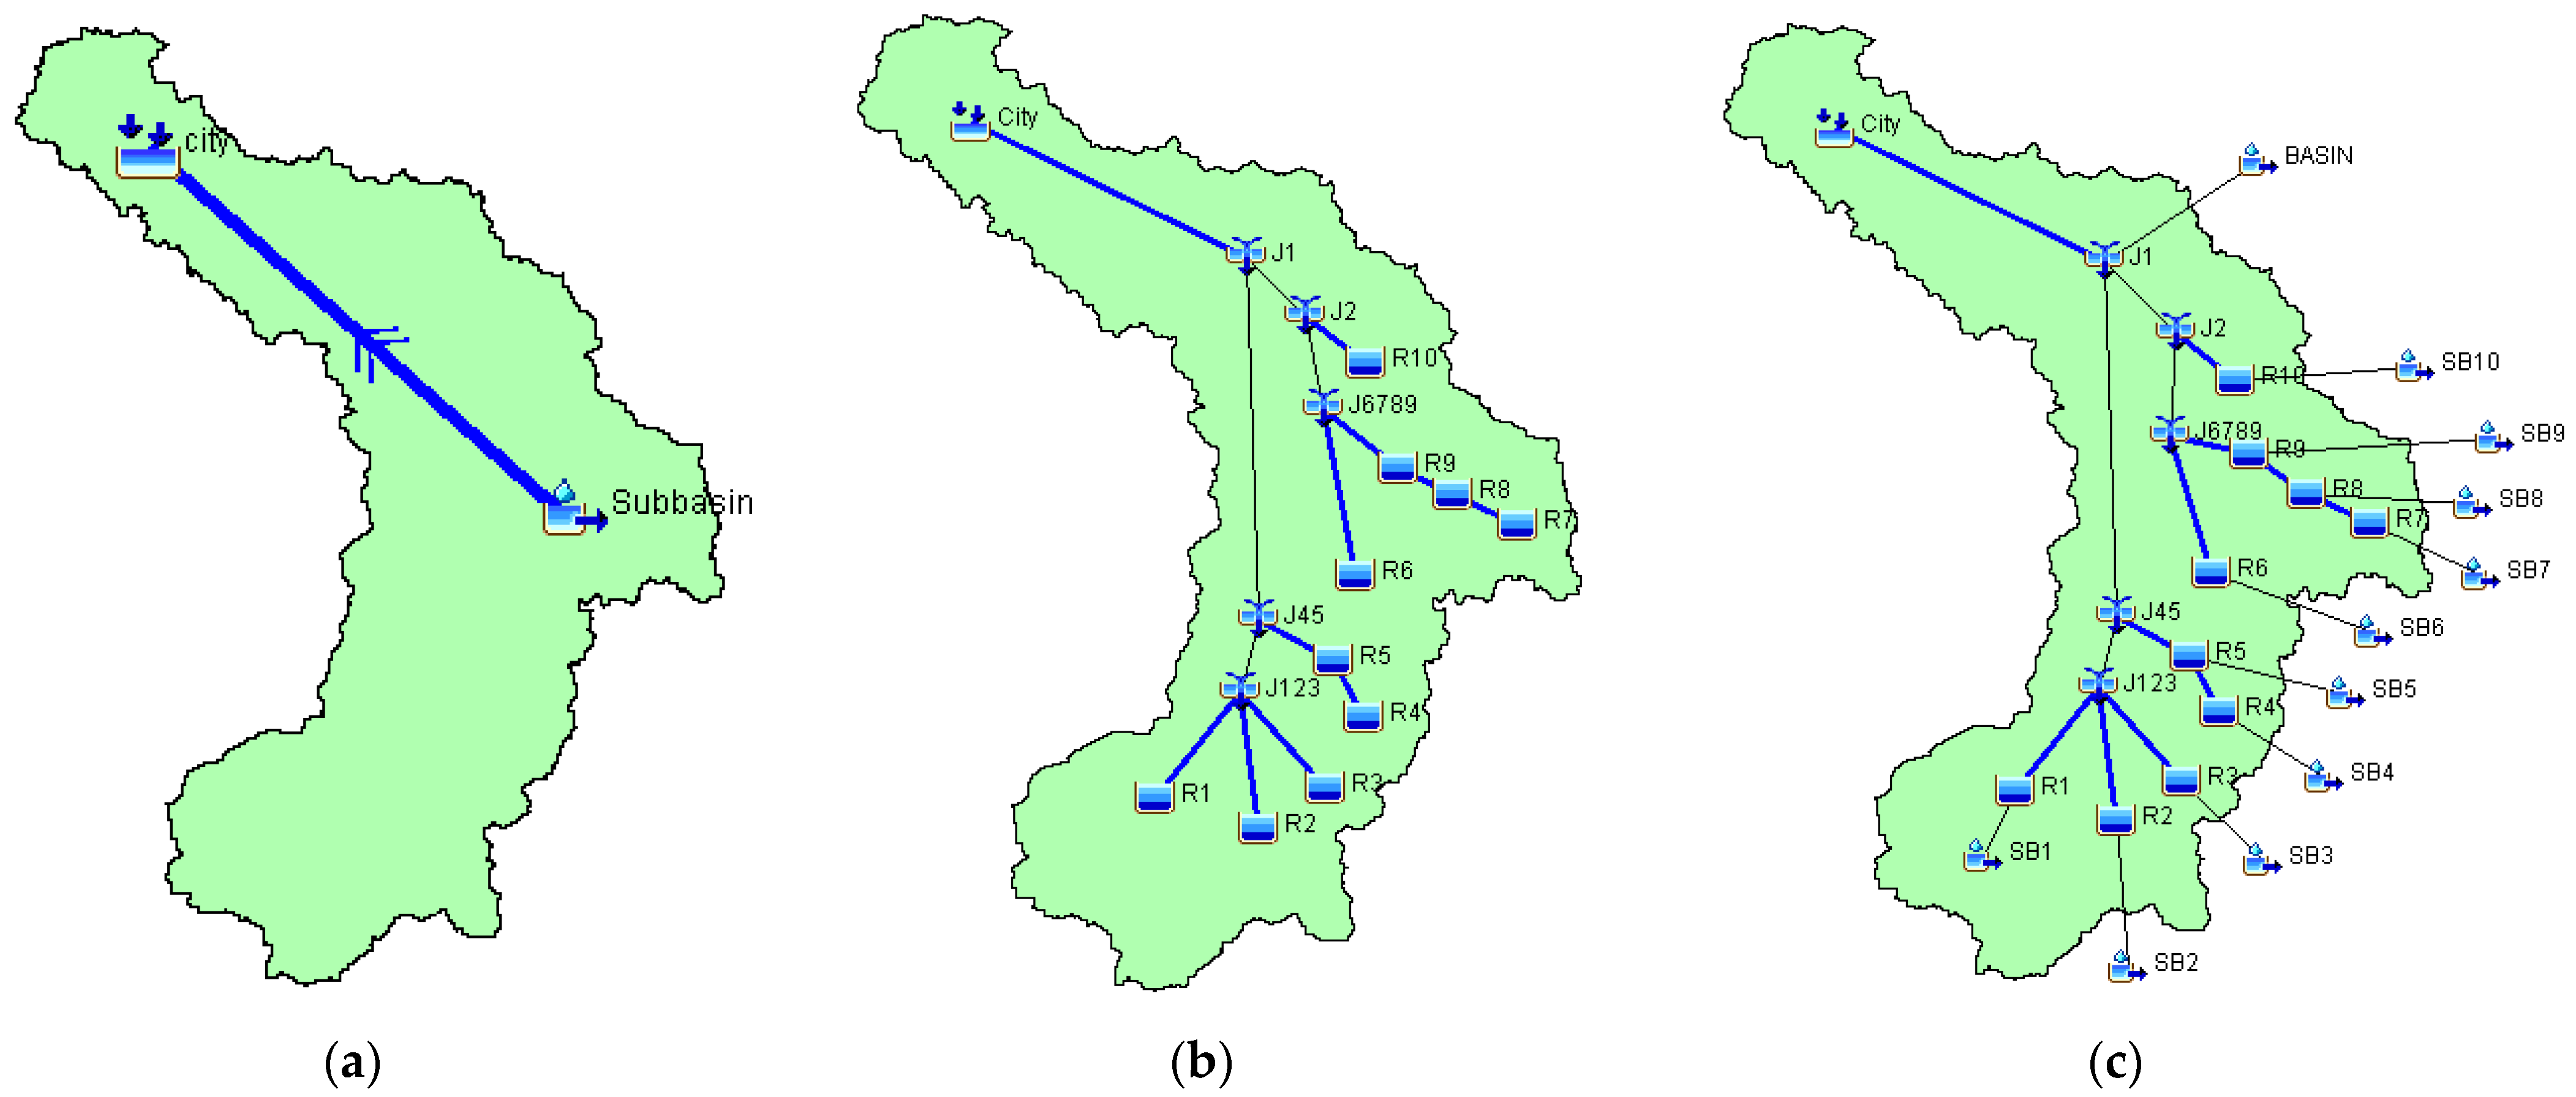
Figure 11b. The post-flood analysis is very characteristic of each event. In this one, there was the simultaneous rupture of ten dams and divergences between the precipitation records. Therefore, to diversify the post-flood analysis, simulation scenarios were adopted in the HEC-HMS that address the isolated effect of each rainfall measurement, dam failure, and even the impact of these agents combined (
Figure 12).
The summary of scenarios is presented in
Table 4. Scenario 01 (S01) is the simplest scenario to obtain the rain hydrograph of 93 mm in isolation without the influence of the dam rupture. Scenario 02 (S02) follows the same reasoning but with 200 mm of rain. In scenario 03 (S03), the objective is to simulate the effect of the simultaneous rupture of 10 small dams, without the action of rain, to obtain the rupture hydrograph of each one and to determine the flow that reached the city. For this, the element “Reservoir” was inserted in the basin. The reservoirs were located on the tributaries of the Batoque River, so information on the streams downstream of these structures was obtained through geoprocessing. For all the small dams, the level–area curve of each one was first inserted, and then the “Outflow Structures” method was applied, which allows the dam break function [
35]. Scenarios 04 (S04) and 05 (S05) are more complex as they combine the rupture of dams and, concomitantly, precipitation as reported in the flood event. The purpose of this simulation was to verify the flow that arrived in the city (outlet).
The rainfall of 93 mm (S01) reached a peak flow of 166.8 m3/s at 10:50 am on 25 March 2020, with a volume of 56.80 mm. The maximum rainfall of 200 mm (S02) measured by the farmers resulted in a peak flow of 423.0 m3/s at 10:00 am on the same day, reaching a volume of 144.63 mm. The two hypotheses presented effects and, despite reaching the apex at close times, the flow measurement between the pluviometers diverged by almost 40%.
As a triggering strategy for S03, we determined a simultaneous collapse—the most critical situation (ten reservoirs collapsing 1 h after the simulation’s beginning), and all converged to the main river until reaching the city. The simultaneous rupture of the dams, without the influence of rain, resulted in a flow of 0.1 m3/s at the outlet.
The presence of torrential rain and the rupture of dams were incorporated into S04. The flow that reached the city based on a 93 mm rain input was 169.4 m
3/s. On the other hand, a flow of 428.9 m
3/s was obtained using a 200 mm input (the rainfall reported by the farmers).
Table 3 summarizes the values found in the three scenarios.
3.2.6. Hydraulic Modeling
The next step was to perform hydrological and hydrodynamic modeling of the event to obtain the flooded spot based on the data acquired in the previous steps. We chose to use the HEC-HMS and HEC-RAS software because they are free, easy to access, and widely used in hydrological studies [
6,
9,
10,
11,
36,
37,
38,
39].
The input data of the HEC-HMS model are the temporal distribution of rainfall, the characteristics of the watershed (area, land use and occupation, and delay time), information about the main river (length, width, and roughness), and dam break data (level–area curve, breach dimensions, and breach time) [
35]. The results of this modeling serve as input data for the HEC-RAS model, which requires a region’s digital elevation model (DEM) [
29].
Furthermore, roughness parameters must be estimated to obtain confidence in the model [
29]. In the flood event analyzed, according to the photo collection, the flood wave dragged much debris formed by sand, vegetation, remains of houses, and furniture, among others, as the water passed through obstacles such as bridges and wet passages in the riverbed, has caused a channel clogging effect and the software can only process this through the Manning number. Knowing this, the methodology for obtaining this parameter proposed by Arcement and Schneider [
30] was used, which, by crossing information, estimates the roughness in some parts of the impact caused by a natural disaster.
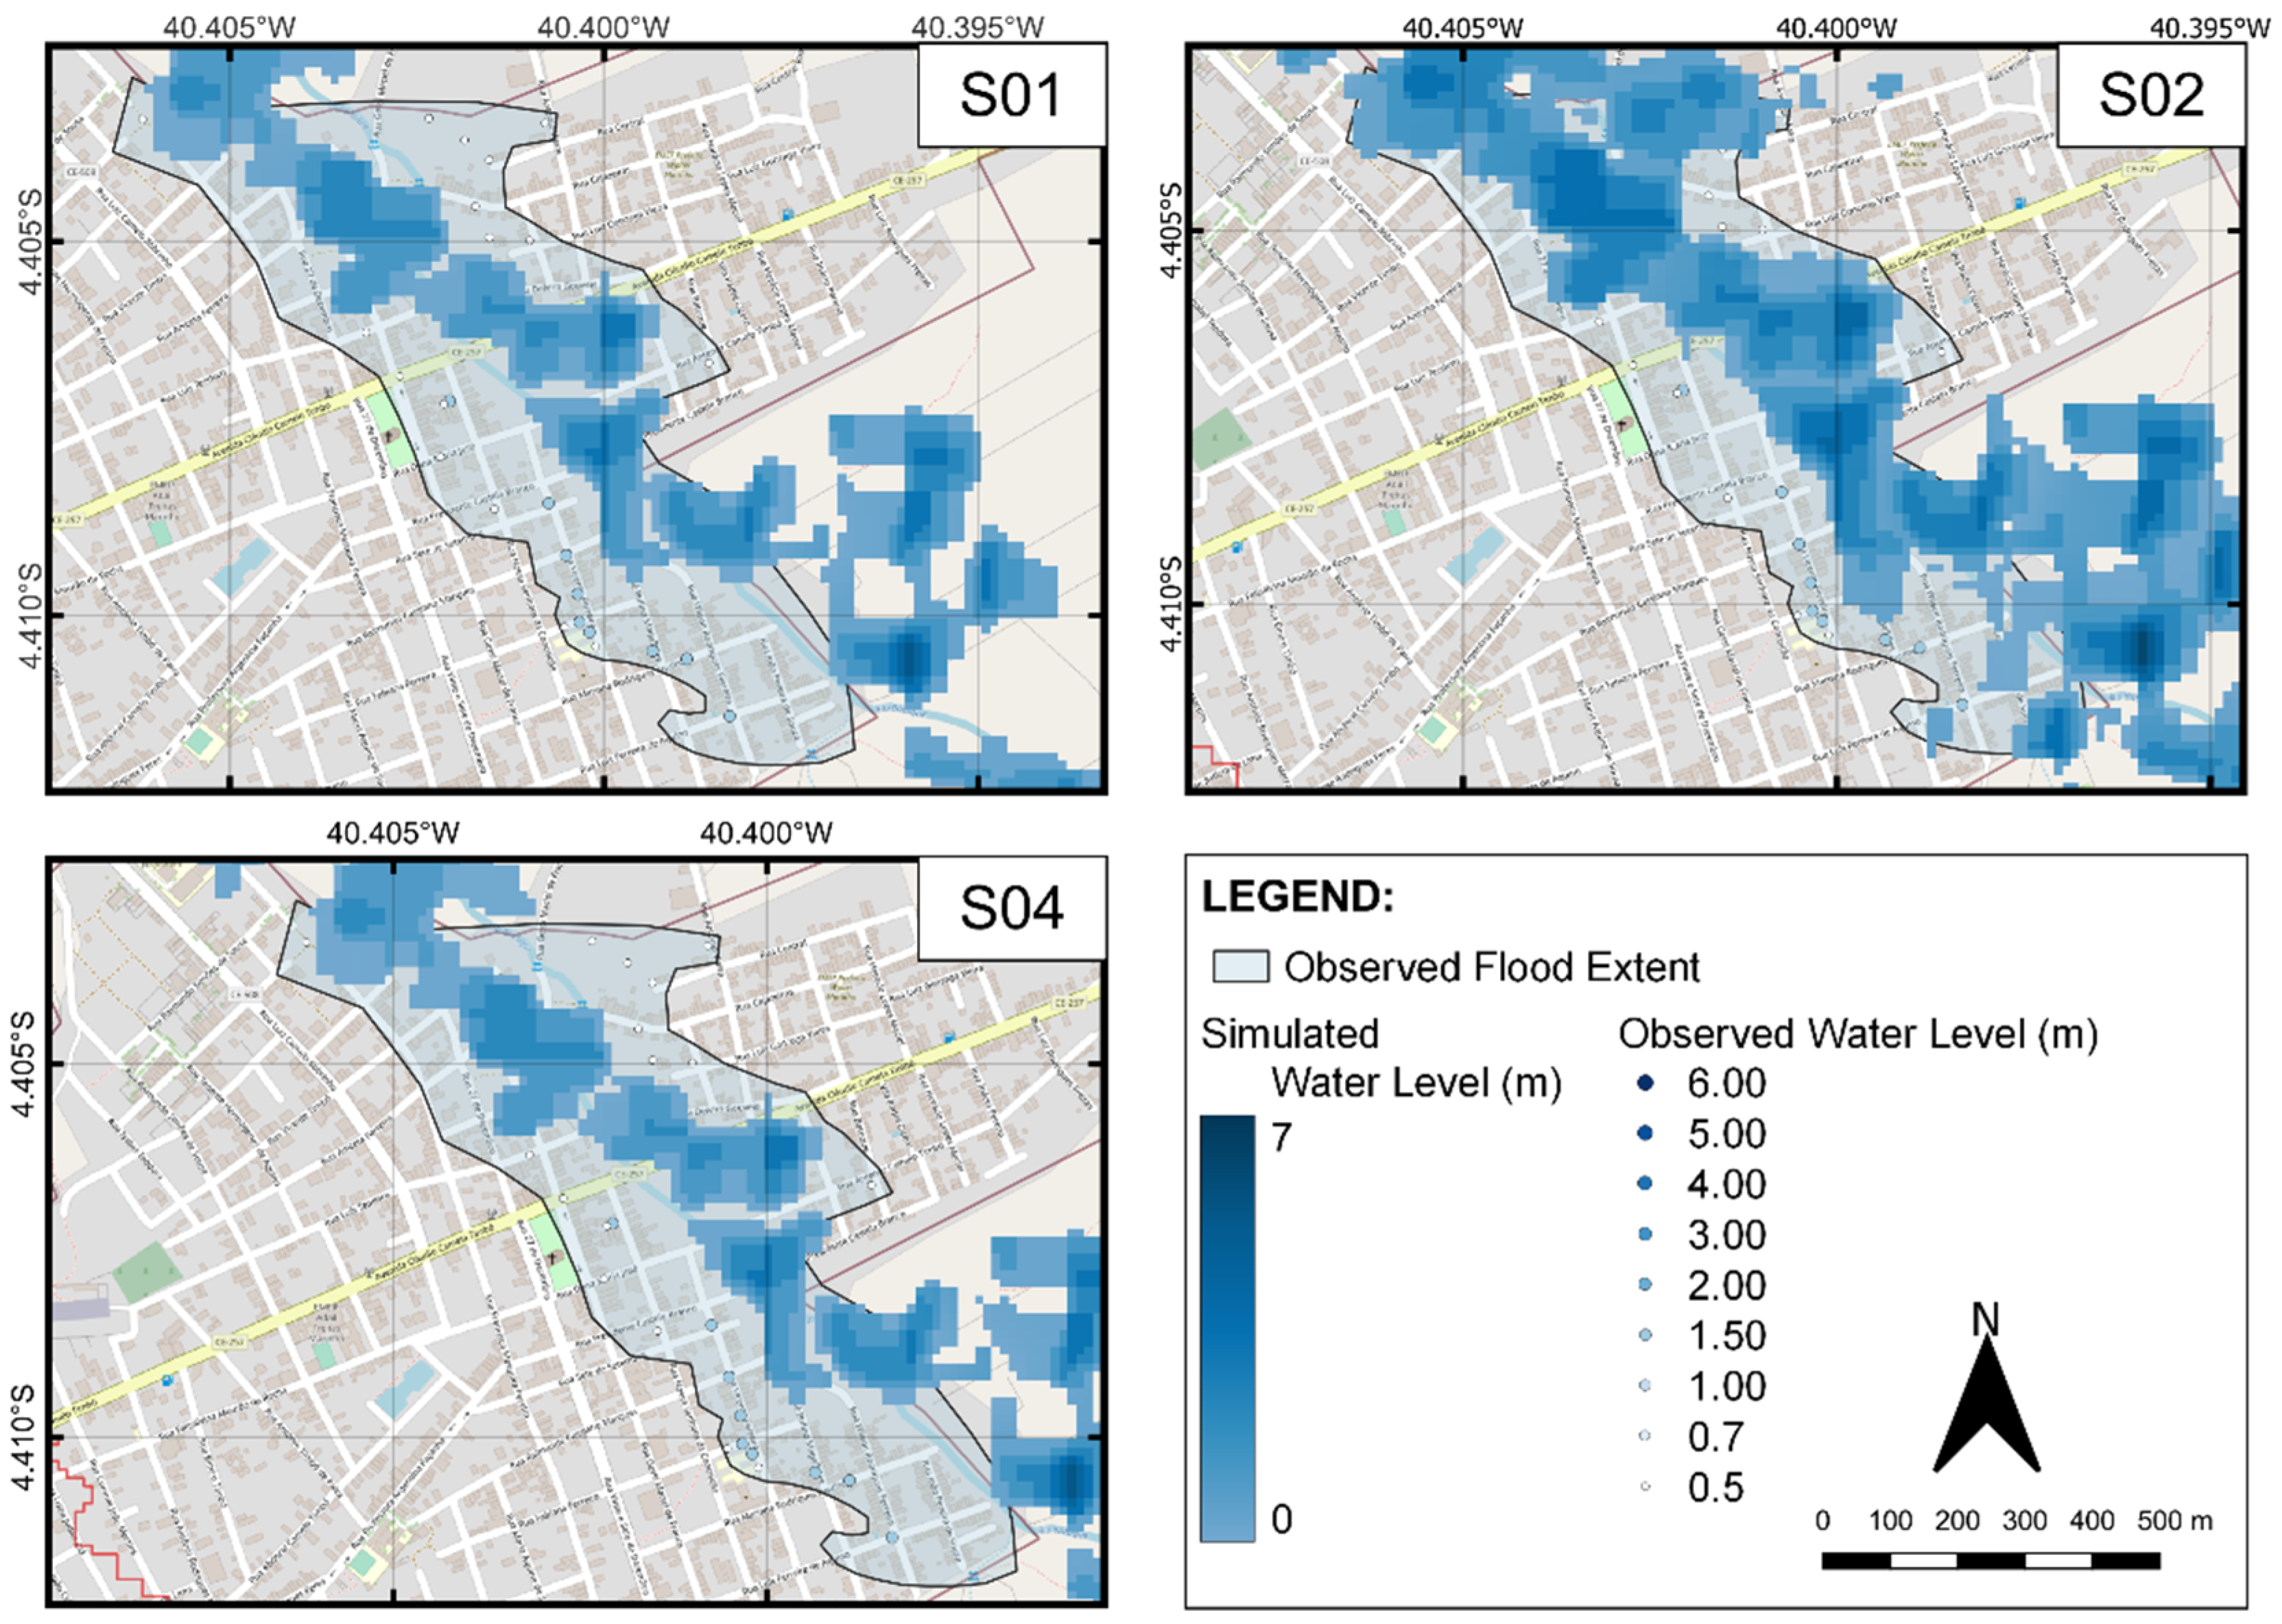
The flood and rupture hydrograph were used as boundary conditions as indicated in the software manual for the event in the Batoque River basin to analyze the influence of the following isolated scenarios: effect of the maximum daily rainfall of 93 mm recorded in the official rain gauges; 200 mm rainfall analysis, based on the farmers’ perceptions; and the impact of the simultaneous failure of ten dams upstream of the city. The hydrodynamic modeling resulted in the simulated floodplains for all the scenarios as presented in
Figure 13.
Figure 13 also compares the observed with the simulated floodplains.
The result of the flooded patch generated by the isolated action of 93 mm rain (S01) over an area of 0.142 km2. Compared with the extent of the observed spot, this simulation scenario only overlaps about 34% of the observed area, reducing the event’s impact. The next scenario to be analyzed is the effect of rain reported by farmers according to their rain gauges. Scenario S02—the 200 mm rain—resulted in a floodplain area of 0.240 km2, about 57.1% of the observed area
The next scenario, S03, is the simultaneous rupture of ten small reservoirs located upstream of the city and close to the river’s source shows the effect caused by applying the rupture hydrograph in 2D modeling. According to the simulation result, the flood wave caused by these buses did not have enough energy to reach the city.
The next hypothesis (S04) is the sum of the effects of the dams with a 93 mm rainfall because, according to local reports, the rupture occurred during the precipitation. This assessment also analyzes the relevance of the reservoirs to the event, as the isolated effect of the rupture does not reach the city but can potentiate the flooded spot when combined with rain. The flood patch in this scenario has an area of 0.143 km
2. Occupying about 34.9% of the observed flood area. The last scenario (S05), considering the 200 mm and the dam breaks resulted in 58.1% of the observed flood area.
Table 5 summarizes the flood areas simulated and shows the percentage of overlaying between each scenario with the observed flood area.
3.3. Validation
The results generated by the HEC-HMS system were satisfactory. However, there is still uncertainty about the representation of these values in terms of the flooded spot, that is, what is the perception of the impact that these numbers, obtained through simulation, generate in terms of depth, expansion, and plausibility to explain the causes of the event (even with the low availability of input data). As seen, both in the HEC-HMS and HEC-RAS simulations run to identify the event’s causes, the ruptured dams do not appear to influence the flood, nor to potentiate the rain effect.
The graph in
Figure 14 facilitates the visualization of the water levels observed at the checkpoints, the x-axis represents the scenarios meanwhile the y-axis shows the water level. Note that S02 continues to be more representative among the other hypotheses, i.e., is closest and more plausible with the observed water level.
4. Discussion
The field interviews collected in this study revealed discrepancies between the local population’s perceptions of the cause of the incident and the rainfall records. The 93 mm rainfall recorded by the rainfall station has a return time of 6.23 years, indicating a high probability of occurrence during the rainy season. However, the residents said that the rain that morning was an exceptional event, never seen by the elders. When calculating the return period of 200 mm rain, a value of 470 years was found. In addition, ten small dams upstream of the city in the hydrographic basin were reported to break simultaneously. Thus, due to the lack of accurate and reliable data from measurement instruments in ungauged basins, it is recommended to consider all plausible evidence, whether conventional or not, to feed hydrological models confronting all hypotheses [
2,
4,
5,
6,
7,
8,
9,
10,
11,
19,
37].
The use of the HEC-HMS software aimed to generate the flood hydrographs of the following scenarios: 93 mm rainfall (S01), 200mm rainfall (S02), dam break of the ten reservoirs (S03), and the combination of rain and dam break for the two precipitation measurements (S04 and S05, respectively). The peaks of 166.23 m3/s for S01 and 423.00 m3/s for S02 at the outlet indicate that the latter may have caused more impactful flood waves than the former. In S03, the dams generated only by the runoff reached the city with a tiny flow of about 0.1 m3/s. In S04, it was noted that adding a dam break to the 93 mm rain did not generate a significant increase in the peak flow from the outlet compared to S01. The same analysis follows for S05.
The field interviews were essential to creating a flood map with the extent and depths perceived in the urban area. According to van Emmerik, Mulder, Eilander, Piet and Savenije [
5], it is a creative way to validate a model. Local knowledge is a good tool for flood analysis in ungauged basins. However, the bibliography emphasizes that the attribution of the necessary data is usually based on experts’ judgments [
4,
5,
7,
14,
21,
38,
40,
41,
42,
43].
The HEC-RAS software was used to generate the flooded spot based on the hydrographs generated by the HEC-HMS tool. This methodology is similar to those employed by Batista and Ribeiro Neto [
44], Oliveira, et al. [
45], and Kastridis et al. [
38], among others [
24,
36,
41,
46,
47]. The maps were superimposed and compared with the observed spots. It can be inferred that the isolated rain of 93 mm (S01), recorded in the rain gauge of official agencies, was not enough to cause the disaster because the spot generated by this precipitation overlapped less than half of the observed spot. In addition, the depth verified in the checkpoints was considerably smaller than the observed data. The isolated effect of the flood wave caused by the dams that broke simultaneously (S03) was not strong enough to reach the urban area. Furthermore, no changes in the depth of the flood patch were found when we created a map by joining the 93 mm rain with the dam break (S04). The flood map generated by the 200 mm rain (S02) was the most satisfactory result, as it overlapped about 57% of the area of the actual spot observed. Apparently, the reservoirs were not the main cause of the flood event. The 93 mm rain did not potentiate the effect, but probably the torrential rain reported by the population in the field interviews caused the greatest impact.
Wang et al. [
22] compared farmers’ perceptions of climate change with meteorological data and found a significant correlation between these two parameters. Zaki et al. [
14] state that local knowledge can increase communities’ resilience and allow the development of adaptation strategies.
Some important limitations may have impaired the accuracy of our model. For example, the model applied in the HEC-RAS generates simulations based only on the DEM, disregarding the dragging of debris, which in practice accounts for much of the increasing water depth in urban areas. Fatdillah et al. [
24] compared the flood simulation results for various resolutions (5 m, 12.5 m, and 30 m DEM) and concluded that the lower the resolution, the better the accuracy of the results, helping in the process of flood risk assessment. This is due to the lack of more detailed topographic information in the city, and the absence of measurement of sediments dragged along the channel. This information is more complex to obtain, mainly in semi-arid regions with inadequate equipment for this type of research.
Other flood analysis works also emphasize topographic data quality’s importance in modeling accuracy [
37,
38,
40,
41,
44,
48]. In Cameroon, a Central African country, satisfactory results were obtained using 2D modeling to define risk areas, and this success was due to the number of monitoring stations [
41]. Kastridis, Kirkenidis and Sapountzis [
38] applied a methodology very similar to ours to reconstruct a post-flood event in an ungauged basin in Greece, and the comparison with the estimated data was positive due to the use of a 5 m DEM.
This is an alternative to research for the development of flood mitigation plans because, according to Günter, Murugesu, Thorsten, Alberto and Hubert [
4], determining the extent of flooding from in situ observations and measurements on the ground is expensive and often impractical. The success of case studies in ungauged basins depends directly on the hydrologist’s creativity and understanding [
5]. Our study reinforces that there is a need to improve open data on precipitation and flow, which are essential for high-quality hydrological studies, expanding the discussion on new types of information such as ecology and sociology, which can help to increase knowledge about patterns of watersheds’ hydrological responses, as reported by Hrachowitz et al. [
7]. In addition to the mutual interest and support of local authorities in flood risk management, some works also call for the scientific language of this type of study to be accessible to decision makers in disaster management [
42,
43,
44].
5. Conclusions
This work proposed alternative techniques for post-flood analysis in ungauged basins with low data availability located in semi-arid regions. The influence of extreme rains and the rupture of dams were investigated through a case study. The methodology combined social perception to validate flood modeling.
The proposed methodology was applied to a flood event in semi-arid Brazil, obtaining satisfactory results given the available information, serving as an excellent source of information for a quick and low-cost diagnosis for regions with scarce data. We reinforce the importance of working with unconventional precipitation data sources and validating studies based on local observations. Despite their high representativeness, in situ topographic studies can be expensive and unfeasible in remote places, so we reiterate the need to improve information resolution and reduce the uncertainty of hydrological studies. In addition, satellite images can provide a satisfactory initial analysis without the information above.
Future works may analyze flooding events in ungauged basins for different climates and discuss alternative solutions for obtaining data. This work presents a pioneering methodology that analyzes flooding in ungauged basins in the semi-arid region. The discussion must continue to be deepened to generate works collaborating with mitigation plans and promoting useful information for decision makers to reduce risk areas for riverside populations.
