
Climate Change Related Catastrophic Rainfall Events and Non-Communicable Respiratory Disease: A Systematic Review of the Literature


Abstract
:1. Introduction
2. Materials and Methods
2.1. Inclusion and Exclusion Criteria
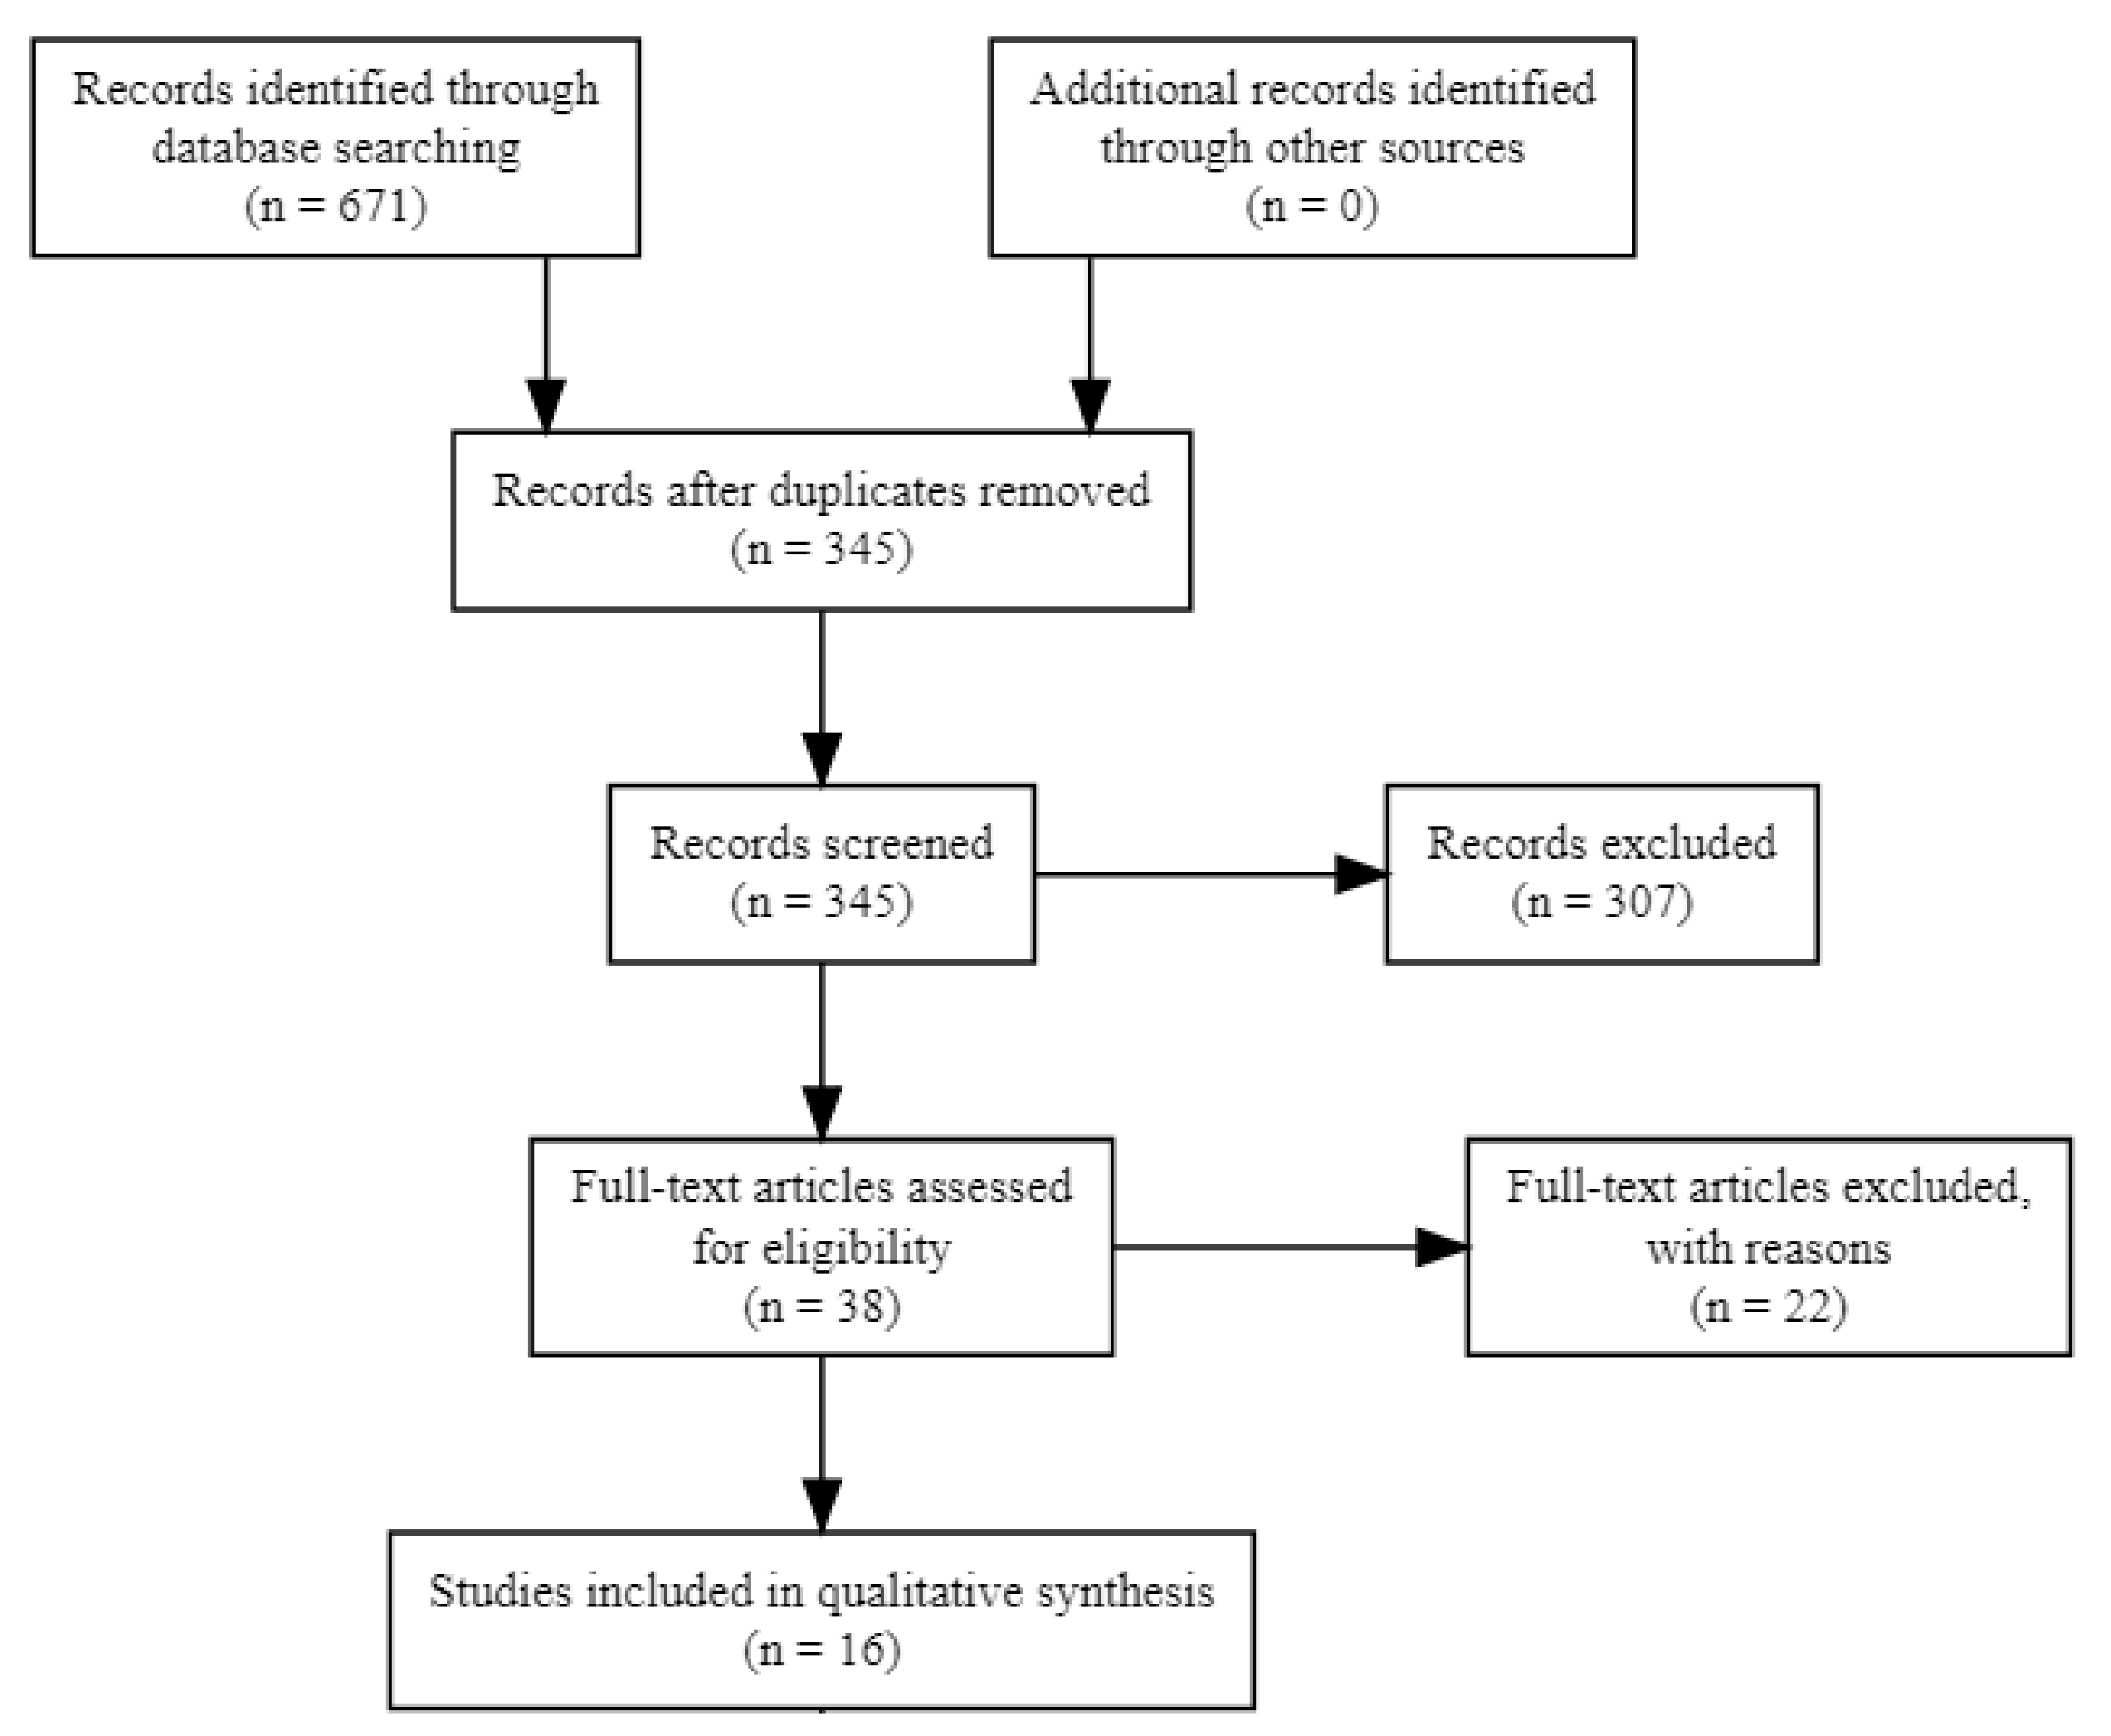
2.2. Selection Process
2.3. Data Collection Process
2.4. Study Risk of Bias Assessment
3. Results
3.1. Study Characteristics
3.2. Risk of Bias in Studies
3.3. Outcomes and Study Populations
3.4. Case Definitions
3.5. Study Design
3.6. Statistical Analysis
3.7. Exposure Assessment
3.8. Results of Individual Studies
4. Discussion
5. Conclusions
Author Contributions
Funding
Institutional Review Board Statement
Informed Consent Statement
Data Availability Statement
Acknowledgments
Conflicts of Interest
Abbreviations
| AR | allergic rhinitis |
| AXIS | Appraisal tool for Cross-Sectional Studies |
| CI | Confidence interval |
| COPD | chronic obstructive pulmonary disease |
| ED | Emergency department |
| HR | Hazard ratio |
| ICD | International Classification of Disease |
| NCRD | non-communicable respiratory disease |
| OR | Odds ratio |
| RR | Relative risk |
References
- Meehl, G.A. More Intense, More Frequent, and Longer Lasting Heat Waves in the 21st Century. Science 2004, 305, 994–997. [Google Scholar] [CrossRef] [PubMed] [Green Version]
- Haines, A.; Kovats, R.S.; Campbell-Lendrum, D.; Corvalan, C. Climate change and human health: Impacts, vulnerability and public health. Public Health 2006, 120, 585–596. [Google Scholar] [CrossRef] [PubMed]
- Luber, G.; McGeehin, M. Climate Change and Extreme Heat Events. Am. J. Prev. Med. 2008, 35, 429–435. [Google Scholar] [CrossRef] [PubMed]
- Trenberth, K. Changes in precipitation with climate change. Clim. Res. 2011, 47, 123–138. [Google Scholar] [CrossRef] [Green Version]
- National Academies of Sciences, Engineering and Medicine. Framing the Challenge of Urban Flooding in the United States; National Academies Press: Washington, DC, USA, 2019. [Google Scholar] [CrossRef]
- Guneralp, B.; Guneralp, I.; Liu, Y. Changing global patterns of urban exposure to flood and drought hazards. Glob. Environ. Chang. 2015, 31, 217–225. [Google Scholar] [CrossRef]
- Limaye, V.S.; Max, W.; Constible, J.; Knowlton, K. Estimating the health-related costs of 10 climate-sensitive U.S. events during 2012. GeoHealth 2019, 3, 245–265. [Google Scholar] [CrossRef]
- Hsiang, S.; Kopp, R.; Jina, A.; Rising, J.; Delgado, M.; Mohan, S.; Rasmussen, D.J.; Muir-Wood, R.; Wilson, P.; Oppenheimer, M.; et al. Estimating economic damage from climate change in the United States. Science 2017, 356, 1362–1369. [Google Scholar] [CrossRef] [PubMed] [Green Version]
- Melillo, J.M.; Richmond, T.T.; Yohe, G.W. Climate Change Impacts in the United States: The Third National Climate Assessment; U.S. Global Change Research Program: Washington, DC, USA, 2014. [Google Scholar] [CrossRef]
- Sandink, D. Urban flooding and ground-related homes in Canada: An overview. J. Flood Risk Manag. 2016, 9, 208–223. [Google Scholar] [CrossRef]
- Depietri, Y.; McPhearson, T. Changing urban risk: 140 years of climatic hazards in New York City. Clim. Chang. 2018, 148, 95–108. [Google Scholar] [CrossRef] [Green Version]
- Field, C.B.; Barros, V.; Stocker, T.F.; Dahe, Q.; Dokken, D.J.; Ebi, K.L.; Mastrandrea, M.D.; Mach, K.J.; Plattner, G.K.; Allen, S.K.; et al. Managing the Risks of Extreme Events and Disasters to Advance Climate Change Adaptation: Special Report of the Intergovernmental Panel on Climate Change; Intergovernmental Panel on Climate Change (IPCC): Geneva, Switzerland, 2012. [Google Scholar] [CrossRef]
- Woodhall-Melnik, J.; Grogan, C. Perceptions of mental health and wellbeing following residential displacement and damage from the 2018 St. John River flood. Int. J. Environ. Res. Public Health 2019, 16, 4174. [Google Scholar] [CrossRef] [PubMed] [Green Version]
- Poole, J.A.; Barnes, C.S.; Demain, J.G.; Bernstein, J.A.; Padukudru, M.A.; Sheehan, W.J.; Fogelbach, G.G.; Wedner, J.; Codina, R.; Levetin, E.; et al. Impact of weather and climate change with indoor and outdoor air quality in asthma: A work group report of the AAAAI Environmental Exposure and Respiratory Health Committee. J. Allergy Clin. Immunol. 2019, 143, 1702–1710. [Google Scholar] [CrossRef] [PubMed] [Green Version]
- Phillippi, S.W.; Beiter, K.; Thomas, C.L.; Sugarman, O.K.; Wennerstrom, A.; Wells, K.B.; Trapido, E. Medicaid utilization before and after a natural disaster in the 2016 Baton Rouge–area flood. Am. J. Public Health 2019, 109, S316–S321. [Google Scholar] [CrossRef]
- Lal, A.; Fearnley, E.; Wilford, E. Local weather, flooding history and childhood diarrhoea caused by the parasite Cryptosporidium spp.: A systematic review and meta-analysis. Sci. Total Environ. 2019, 674, 300–306. [Google Scholar] [CrossRef] [PubMed]
- Demain, J.G. Climate change and the impact on respiratory and allergic disease: 2018. Curr. Allergy Asthma Rep. 2018, 18. [Google Scholar] [CrossRef]
- Graham, H.; White, P.; Cotton, J.; McManus, S. Flood- and weather-damaged homes and mental health: An analysis using England’s Mental Health Survey. Int. J. Environ. Res. Public Health 2019, 16, 3256. [Google Scholar] [CrossRef] [PubMed] [Green Version]
- Rorie, A.; Poole, J.A. The Role of Extreme Weather and Climate-Related Events on Asthma Outcomes. Immunol. Allergy Clin. N. Am. 2021, 41, 73–84. [Google Scholar] [CrossRef] [PubMed]
- Fernandez, A.; Black, J.; Jones, M.; Wilson, L.; Salvador-Carulla, L.; Astell-Burt, T.; Black, D. Flooding and Mental Health: A Systematic Mapping Review. PLoS ONE 2015, 10, e0119929. [Google Scholar] [CrossRef] [Green Version]
- Paterson, D.L.; Wright, H.; Harris, P.N.A. Health Risks of Flood Disasters. Clin. Infect. Dis. 2018, 67, 1450–1454. [Google Scholar] [CrossRef]
- Alderman, K.; Turner, L.R.; Tong, S. Floods and human health: A systematic review. Environ. Int. 2012, 47, 37–47. [Google Scholar] [CrossRef] [Green Version]
- Greene, G.; Paranjothy, S.; Palmer, S.R. Resilience and vulnerability to the psychological harm from flooding: The role of social cohesion. Am. J. Public Health 2015, 105, 1792–1795. [Google Scholar] [CrossRef]
- Lamond, J.E.; Joseph, R.D.; Proverbs, D.G. An exploration of factors affecting the long term psychological impact and deterioration of mental health in flooded households. Environ. Res. 2015, 140, 325–334. [Google Scholar] [CrossRef] [PubMed] [Green Version]
- Mason, V.; Andrews, H.; Upton, D. The psychological impact of exposure to floods. Psychol. Health Med. 2010, 15, 61–73. [Google Scholar] [CrossRef] [PubMed]
- Mulder, A.C.; Pijnacker, R.; De Man, H.; Van De Kassteele, J.; Van Pelt, W.; Mughini-Gras, L.; Franz, E. “Sickenin’ in the rain”—Increased risk of gastrointestinal and respiratory infections after urban pluvial flooding in a population-based cross-sectional study in the Netherlands. BMC Infect. Dis. 2019, 19, 377. [Google Scholar] [CrossRef]
- Wade, T.J.; Lin, C.J.; Jagai, J.S.; Hilborn, E.D. Flooding and Emergency Room Visits for Gastrointestinal Illness in Massachusetts: A Case-Crossover Study. PLoS ONE 2014, 9, e110474. [Google Scholar] [CrossRef]
- Jagai, J.S.; Deflorio-Barker, S.; Lin, C.J.; Hilborn, E.D.; Wade, T.J. Sanitary Sewer Overflows and Emergency Room Visits for Gastrointestinal Illness: Analysis of Massachusetts Data, 2006–2007. Environ. Health Perspect. 2017, 125, 117007. [Google Scholar] [CrossRef] [Green Version]
- De Man, H.; Mughini Gras, L.; Schimmer, B.; Friesema, I.H.M.; De Roda Husman, A.M.; Van Pelt, W. Gastrointestinal, influenza-like illness and dermatological complaints following exposure to floodwater: A cross-sectional survey in The Netherlands. Epidemiol. Infect. 2016, 144, 1445–1454. [Google Scholar] [CrossRef] [PubMed]
- Oluyomi, A.O.; Panthagani, K.; Sotelo, J.; Gu, X.; Armstrong, G.; Luo, D.N.; Hoffman, K.L.; Rohlman, D.; Tidwell, L.; Hamilton, W.J.; et al. Houston hurricane Harvey health (Houston-3H) study: Assessment of allergic symptoms and stress after hurricane Harvey flooding. Environ. Health 2021, 20, 9. [Google Scholar] [CrossRef] [PubMed]
- Flores, A.B.; Castor, A.; Grineski, S.E.; Collins, T.W.; Mullen, C. Petrochemical releases disproportionately affected socially vulnerable populations along the Texas Gulf Coast after Hurricane Harvey. Popul. Environ. 2021, 42, 279–301. [Google Scholar] [CrossRef]
- Anenberg, S.C.; Kalman, C. Extreme Weather, Chemical Facilities, and Vulnerable Communities in the U.S. Gulf Coast: A Disastrous Combination. GeoHealth 2019, 3, 122–126. [Google Scholar] [CrossRef]
- Ivers, L.C.; Ryan, E.T. Infectious diseases of severe weather-related and flood-related natural disasters. Curr. Opin. Infect. Dis. 2006, 19, 408–414. [Google Scholar] [CrossRef]
- Ghersi, B.M.; Peterson, A.C.; Riegel, C.; Campanella, R.; Childs, J.E.; Blum, M.J. Flooding and abandonment have shaped rat demography across post-Katrina New Orleans. Landsc. Urban Plan. 2021, 215, 104218. [Google Scholar] [CrossRef]
- Hayes, D., Jr.; Jhaveri, M.A.; Mannino, D.M.; Strawbridge, H.; Temprano, J. The effect of mold sensitization and humidity upon allergic asthma. Clin. Respir. J. 2013, 7, 135–144. [Google Scholar] [CrossRef] [PubMed]
- Tischer, C.; Chen, C.M.; Heinrich, J. Association between domestic mould and mould components, and asthma and allergy in children: A systematic review. Eur. Respir. J. 2011, 38, 812–824. [Google Scholar] [CrossRef] [PubMed] [Green Version]
- Murrison, L.B.; Brandt, E.B.; Myers, J.B.; Hershey, G.K.K. Environmental exposures and mechanisms in allergy and asthma development. J. Clin. Investig. 2019, 129, 1504–1515. [Google Scholar] [CrossRef] [PubMed] [Green Version]
- Reponen, T.; Lockey, J.; Bernstein, D.I.; Vesper, S.J.; Levin, L.; Khurana Hershey, G.K.; Zheng, S.; Ryan, P.; Grinshpun, S.A.; Villareal, M.; et al. Infant origins of childhood asthma associated with specific molds. J. Allergy Clin. Immunol. 2012, 130, 639–644.e5. [Google Scholar] [CrossRef] [Green Version]
- D’Amato, G.; Chong-Neto, H.J.; Monge Ortega, O.P.; Vitale, C.; Ansotegui, I.; Rosario, N.; Haahtela, T.; Galan, C.; Pawankar, R.; Murrieta-Aguttes, M.; et al. The effects of climate change on respiratory allergy and asthma induced by pollen and mold allergens. Allergy 2020, 75, 2219–2228. [Google Scholar] [CrossRef]
- Howard, E.J.; Vesper, S.J.; Guthrie, B.J.; Petty, C.R.; Ramdin, V.A.; Sheehan, W.J.; Gaffin, J.M.; Permaul, P.; Lai, P.S.; Bartnikas, L.M.; et al. Asthma prevalence and mold levels in US northeastern schools. J. Allergy Clin. Immunol. Pract. 2021, 9, 1312–1318. [Google Scholar] [CrossRef]
- Chew, G.L.; Wilson, J.; Rabito, F.A.; Grimsley, F.; Iqbal, S.; Reponen, T.; Muilenberg, M.L.; Thorne, P.S.; Dearborn, D.G.; Morley, R.L.; et al. Mold and Endotoxin Levels in the Aftermath of Hurricane Katrina: A Pilot Project of Homes in New Orleans Undergoing Renovation. Environ. Health Perspect. 2006, 114, 1883–1889. [Google Scholar] [CrossRef] [Green Version]
- Fisk, W.J.; Eliseeva, E.A.; Mendell, M.J. Association of residential dampness and mold with respiratory tract infections and bronchitis: A meta-analysis. Environ. Health 2010, 9, 72. [Google Scholar] [CrossRef] [Green Version]
- Dales, R.E.; Burnett, R.; Zwanenburg, H. Adverse Health Effects Among Adults Exposed to Home Dampness and Molds. Am. Rev. Respir. Dis. 1991, 143, 505–509. [Google Scholar] [CrossRef]
- Taylor, J.; Lai, K.M.; Davies, M.; Clifton, D.; Ridley, I.; Biddulph, P. Flood management: Prediction of microbial contamination in large-scale floods in urban environments. Environ. Int. 2011, 37, 1019–1029. [Google Scholar] [CrossRef] [PubMed]
- Institute of Medicine; Board on Health Promotion and Disease Prevention; Committee on Damp Indoor Spaces and Health. Damp Indoor Spaces and Health; National Academies Press: Washington, DC, USA, 2004. [Google Scholar]
- Environmental Protection Agency. A Brief Guide to Mold, Moisture and Your Home | US EPA—epa.gov. Available online: https://www.epa.gov/mold/brief-guide-mold-moisture-and-your-home (accessed on 3 May 2022).
- Downes, M.J.; Brennan, M.L.; Williams, H.C.; Dean, R.S. Development of a critical appraisal tool to assess the quality of cross-sectional studies (AXIS). BMJ Open 2016, 6, e011458. [Google Scholar] [CrossRef] [PubMed] [Green Version]
- Wells, G.; Shea, B.; O’Connell, D.; Peterson, J.; Welch, V.; Losos, M.; Tugwell, P.; Ga, S.W.; Zello, G.; Petersen, J. The Newcastle-Ottawa Scale (NOS) for Assessing the Quality of Nonrandomised Studies in Meta-Analyses. The Ottawa Hospital. Available online: https://www.ohri.ca//programs/clinical_epidemiology/oxford.Asp (accessed on 15 April 2022).
- Larson, P.S.; Gronlund, C.; Thompson, L.; Sampson, N.; Washington, R.; Steis Thorsby, J.; Lyon, N.; Miller, C. Recurrent Home Flooding in Detroit, MI 2012-2020: Results of a Household Survey. Int. J. Environ. Res. Public Health 2021, 18, 7659. [Google Scholar] [CrossRef] [PubMed]
- Eiffert, S.; Noibi, Y.; Vesper, S.; Downs, J.; Fulk, F.; Wallace, J.; Pearson, M.; Winquist, A. A Citizen-Science Study Documents Environmental Exposures and Asthma Prevalence in Two Communities. J. Environ. Public Health 2016, 2016, 1962901. [Google Scholar] [CrossRef] [PubMed]
- Saporta, D.; Hurst, D. Increased Sensitization to Mold Allergens Measured by Intradermal Skin Testing following Hurricanes. J. Environ. Public Health 2017, 2017, 2793820. [Google Scholar] [CrossRef] [Green Version]
- Schinasi, L.H.; Kenyon, C.C.; Moore, K.; Melly, S.; Zhao, Y.; Hubbard, R.; Maltenfort, M.; Diez Roux, A.V.; Forrest, C.B.; De Roos, A.J. Heavy precipitation and asthma exacerbation risk among children: A case-crossover study using electronic health records linked with geospatial data. Environ. Res. 2020, 188, 109714. [Google Scholar] [CrossRef]
- Fanny, S.A.; Kaziny, B.D.; Cruz, A.T.; Camp, E.A.; Murray, K.O.; Nichols, T.J.; Chumpitazi, C.E. Pediatric Emergency Departments and Urgent Care Visits in Houston after Hurricane Harvey. West. J. Emerg. Med. 2021, 22, 763–768. [Google Scholar] [CrossRef]
- Chowdhury, M.A.B.; Fiore, A.J.; Cohen, S.A.; Wheatley, C.; Wheatley, B.; Balakrishnan, M.P.; Chami, M.; Scieszka, L.; Drabin, M.; Roberts, K.A.; et al. Health Impact of Hurricanes Irma and Maria on St Thomas and St John, US Virgin Islands, 2017–2018. Am. J. Public Health 2019, 109, 1725–1732. [Google Scholar] [CrossRef]
- Brokamp, C.; Beck, A.F.; Muglia, L.; Ryan, P. Combined sewer overflow events and childhood emergency department visits: A case-crossover study. Sci. Total Environ. 2017, 607–608, 1180–1187. [Google Scholar] [CrossRef]
- Cowan, K.N.; Pennington, A.F.; Sircar, K.; Flanders, W.D. Asthma-Related Emergency Department Visits in North Carolina Following Hurricane Irene. Disaster Med. Public Health Prep. 2021, 1–4. [Google Scholar] [CrossRef]
- Hoppe, K.A.; Metwali, N.; Perry, S.S.; Hart, T.; Kostle, P.A.; Thorne, P.S. Assessment of airborne exposures and health in flooded homes undergoing renovation. Indoor Air 2012, 22, 446–456. [Google Scholar] [CrossRef] [PubMed] [Green Version]
- Hendrickson, L.A.; Vogt, R.L.; Goebert, D.; Pon, E. Morbidity on Kauai before and after Hurricane Iniki. Prev. Med. 1997, 26, 711–716. [Google Scholar] [CrossRef] [PubMed]
- Azuma, K.; Ikeda, K.; Kagi, N.; Yanagi, U.; Hasegawa, K.; Osawa, H. Effects of water-damaged homes after flooding: Health status of the residents and the environmental risk factors. Int. J. Environ. Health Res. 2014, 24, 158–175. [Google Scholar] [CrossRef] [PubMed]
- Cummings, K.J.; Cox-Ganser, J.; Riggs, M.A.; Edwards, N.; Hobbs, G.R.; Kreiss, K. Health Effects of Exposure to Water-Damaged New Orleans Homes Six Months After Hurricanes Katrina and Rita. Am. J. Public Health 2008, 98, 869–875. [Google Scholar] [CrossRef] [PubMed]
- Rath, B.; Young, E.A.; Harris, A.; Perrin, K.; Bronfin, D.R.; Ratard, R.; VanDyke, R.; Goldshore, M.; Magnus, M. Adverse Respiratory Symptoms and Environmental Exposures among Children and Adolescents following Hurricane Katrina. Public Health Rep. 2011, 126, 853–860. [Google Scholar] [CrossRef] [PubMed]
- Sato, S.; Saito, J.; Suzuki, Y.; Uematsu, M.; Fukuhara, A.; Togawa, R.; Sato, Y.; Misa, K.; Nikaido, T.; Wang, X.; et al. Association between typhoon and asthma symptoms in Japan. Respir. Investig. 2016, 54, 216–219. [Google Scholar] [CrossRef]
- Qu, Y.; Zhang, W.; Ye, B.; Penta, S.; Dong, G.; Liu, X.; Lin, S. Power outage mediates the associations between major storms and hospital admission of chronic obstructive pulmonary disease. BMC Public Health 2021, 21, 1961. [Google Scholar] [CrossRef]
- Shih, H.I.; Chao, T.Y.; Huang, Y.T.; Tu, Y.F.; Sung, T.C.; Wang, J.D.; Chang, C.M. Increased Medical Visits and Mortality among Adults with Cardiovascular Diseases in Severely Affected Areas after Typhoon Morakot. Int. J. Environ. Res. Public Health 2020, 17, 6531. [Google Scholar] [CrossRef]
- Wang, X.Y.; Ma, T.T.; Wang, X.Y.; Zhuang, Y.; Wang, X.D.; Ning, H.Y.; Shi, H.Y.; Yu, R.L.; Yan, D.; Huang, H.D.; et al. Prevalence of pollen-induced allergic rhinitis with high pollen exposure in grasslands of northern China. Allergy 2018, 73, 1232–1243. [Google Scholar] [CrossRef]
- Fuhlbrigge, A.; Peden, D.; Apter, A.J.; Boushey, H.A.; Camargo, C.A.; Gern, J.; Heymann, P.W.; Martinez, F.D.; Mauger, D.; Teague, W.G.; et al. Asthma outcomes: Exacerbations. J. Allergy Clin. Immunol. 2012, 129, S34–S48. [Google Scholar] [CrossRef] [Green Version]
- Shibasaki, M.; Namba, M.; Oshiro, M.; Kakigi, R.; Nakata, H. Suppression of cognitive function in hyperthermia; From the viewpoint of executive and inhibitive cognitive processing. Sci. Rep. 2017, 7, 43528. [Google Scholar] [CrossRef] [Green Version]
- Great flood and aeroallergen sensitization in children with asthma and/or allergic rhinitis. Asian Pac. J. Allergy Immunol. 2017. [CrossRef]
- D’Amato, G.; Holgate, S.T.; Pawankar, R.; Ledford, D.K.; Cecchi, L.; Al-Ahmad, M.; Al-Enezi, F.; Al-Muhsen, S.; Ansotegui, I.; Baena-Cagnani, C.E.; et al. Meteorological conditions, climate change, new emerging factors, and asthma and related allergic disorders. A statement of the World Allergy Organization. World Allergy Organ. J. 2015, 8, 25. [Google Scholar] [CrossRef] [PubMed] [Green Version]
- Mendell, M.J.; Mirer, A.G.; Cheung, K.; Tong, M.; Douwes, J. Respiratory and Allergic Health Effects of Dampness, Mold, and Dampness-Related Agents: A Review of the Epidemiologic Evidence. Environ. Health Perspect. 2011, 119, 748–756. [Google Scholar] [CrossRef]
- Sheehan, W.J.; Phipatanakul, W. Indoor allergen exposure and asthma outcomes. Curr. Opin. Pediatr. 2016, 28, 772–777. [Google Scholar] [CrossRef] [PubMed] [Green Version]
- Barbeau, D.N.; Grimsley, L.F.; White, L.E.; El-Dahr, J.M.; Lichtveld, M. Mold Exposure and Health Effects Following Hurricanes Katrina and Rita. Annu. Rev. Public Health 2010, 31, 165–178. [Google Scholar] [CrossRef]
- Quansah, R.; Jaakkola, M.S.; Hugg, T.T.; Heikkinen, S.A.M.; Jaakkola, J.J.K. Residential Dampness and Molds and the Risk of Developing Asthma: A Systematic Review and Meta-Analysis. PLoS ONE 2012, 7, e47526. [Google Scholar] [CrossRef]
- Zhang, Z.; Reponen, T.; Hershey, G.K.K. Fungal Exposure and Asthma: IgE and Non-IgE-Mediated Mechanisms. Curr. Allergy Asthma Rep. 2016, 16, 86. [Google Scholar] [CrossRef]
- Kao, C.C.; Hanania, N.A.; Parulekar, A.D. The impact of fungal allergic sensitization on asthma. Curr. Opin. Pulm. Med. 2021, 27, 3–8. [Google Scholar] [CrossRef]
- Bush, R.K.; Portnoy, J.M.; Saxon, A.; Terr, A.I.; Wood, R.A. The medical effects of mold exposure. J. Allergy Clin. Immunol. 2006, 117, 326–333. [Google Scholar] [CrossRef]
- Toskala, E.; Kennedy, D.W. Asthma risk factors. Int. Forum Allergy Rhinol. 2015, 5, S11–S16. [Google Scholar] [CrossRef] [PubMed]
- Burge, S.; Wedzicha, J.A. COPD exacerbations: Definitions and classifications. Eur. Respir. J. Suppl. 2003, 41, 46s–53s. [Google Scholar] [CrossRef] [PubMed] [Green Version]
- Forno, E.; Celedón, J.C. Health Disparities in Asthma. Am. J. Respir. Crit. Care Med. 2012, 185, 1033–1035. [Google Scholar] [CrossRef] [PubMed] [Green Version]
- Pleasants, R.A.; Riley, I.L.; Mannino, D.M. Defining and targeting health disparities in chronic obstructive pulmonary disease. Int. J. Chronic Obstr. Pulm. Dis. 2016, 11, 2475–2496. [Google Scholar] [CrossRef] [PubMed] [Green Version]
- Kercsmar, C.M.; Dearborn, D.G.; Schluchter, M.; Xue, L.; Kirchner, H.L.; Sobolewski, J.; Greenberg, S.J.; Vesper, S.J.; Allan, T. Reduction in Asthma Morbidity in Children as a Result of Home Remediation Aimed at Moisture Sources. Environ. Health Perspect. 2006, 114, 1574–1580. [Google Scholar] [CrossRef]
- Gruber, K.J.; McKee-Huger, B.; Richard, A.; Byerly, B.; Raczkowski, J.L.; Wall, T.C. Removing asthma triggers and improving children’s health: The Asthma Partnership Demonstration project. Ann. Allergy Asthma Immunol. 2016, 116, 408–414. [Google Scholar] [CrossRef]

| Search Field | PubMed | Web of Science | Scopus |
|---|---|---|---|
| 1 | (flood OR hurricane OR monsoon OR typhoon OR “tropical storm”) | (AB = flood OR AB = hurricane OR AB = monsoon OR AB = typhoon OR AB = “tropical storm”) | ABS (flood OR hurricane OR monsoon OR typhoon OR “tropical storm”) |
| 2 | (asthma OR “allergic rhinitis” OR “bronchitis” OR “COPD” OR “chronic obstructive pulmonary disease”) | (AB= asthma OR AB = “allergic rhinitis” OR AB = “bronchitis” OR AB = “COPD” OR AB = “chronic obstructive pulmonary disease”) | ABS (asthma OR “allergic rhinitis” OR “bronchitis” OR “COPD” OR “chronic obstructive pulmonary disease”) |
| Author (Year) | Location | Study Duration | Sample Size | Study Design |
|---|---|---|---|---|
| Schinasi LH, 2020 | Philadelphia PA, USA | 2011–2016 | 10,343 children | Case-crossover |
| Shih HI, 2020 | Taiwan | 2008–2011 | 715,233 adults with cerebrovascular disease | Population based case-control |
| Larson PS, 2021 | Detroit MI, USA | 2012–2020 | 4803 households | Cross-sectional survey |
| Fanny SA, 2021 | Houston TX, USA | 2016–2017 | 39,514 children | Cross-sectional survey |
| Eiffert S, 2016 | Atlanta GA, USA | June–August 2014 | 507 households | Cross-sectional survey |
| Saporta D, 2017 | New Jersey, USA | 2003–2015 | 200 patients | Cohort |
| Qu Y, 2021 | New York, USA | 2001–2013 | All COPD hospitalizations during study period (unknown number) | Time-series |
| Chowdhury M, 2019 | US Virgin Islands | 2017–2018 | 11,313 ED encounters | Time-series |
| Hoppe KA, 2012 | Iowa, USA | 2008–2009 | 73 households | Retrospective survey |
| Hendrickson LA, 1997 | Hawaii, USA | August–October 1992 | 1584 primary care and ED encounters | Retrospective record review |
| Cowan K, 2021 | North Carolina, USA | 2010–2011 | All ED visits in 100 NC counties | Retrospective record review |
| Azuma K, 2013 | Japan | 2004–2010 | 379 households | Retrospective survey |
| Cummings K, 2008 | NOLA, USA | 2006 | 553 post-hurricane residents | Cross-sectional survey |
| Brokamp C, 2017 | Ohio, USA | 2010–2014 | 21,108 pediatric asthma ED encounters | Case-crossover |
| Rath B, 2011 | NOLA, USA | 2005–2006 | 1243 children and adolescents | Cross-sectional survey |
| Sato S, 2016 | Fukushima, Japan | 2013 | 58 asthma patients | Cross-sectional survey |
| Author (Year) | Precipitation Type | NCRD | Health Outcome | Significance | Association |
|---|---|---|---|---|---|
| Schinasi LH, 2020 | Daily heavy precip. 1 | Asthma | Odds of asthma exacerbation in children were 11% higher on heavy precipitation vs. no precipitation days | 95% CI: (1.02–1.21) | ↑ |
| Shih HI, 2020 | Typhoon | COPD and Asthma | Among affected adults, patients with chronic obstructive pulmonary diseases (COPD) and asthma had significantly increased mortality rates | Adjusted HR: 1.7–2.1 | ↑ |
| Larson PS, 2021 | Pluvial flooding | Asthma | Having at least one adult with asthma in the home was associated with flooding | OR 1.42 [95% CI (1.22, 1.64)] | ↑ |
| Fanny SA, 2021 | Hurricane | Asthma | There was a significantly higher amount of pediatric asthma exacerbation ED visits in the month after the hurricane, but this association was not significant when controlling for seasonal trends | aOR: 1.81 [95% CI (1.54–2.14)] | ↑ |
| Eiffert S, 2016 | Pluvial flooding | Asthma | When controlling for smoking status and length of residence, self-reported current asthma was associated with higher ERMI values 2 | aOR: 1.12, [95% CI: (1.01–1.25); two-tailed p = 0.04] | ↑ - |
| Saporta D, 2017 | Hurricanes | Asthma | Post-hurricane patients reported more asthma or lower respiratory symptoms than pre-hurricane (39% vs. 25%) | p < 0.05 | ↑ |
| Qu Y, 2019 | Major storms | COPD | Higher rates of COPD hospitalization were associated with major storms, which mainly included flooding, thunder, hurricane, snow, ice, and wind across lag 0–6 days | Adjusted RRs ranged from 1.23–1.49, with significant effects on lag days 0–4 [95% CI: (1.05–2.58)] | ↑ |
| Chowdhury M, 2019 | Hurricanes | Asthma | Higher rates of ED visits for asthma in the two month post-hurricane period compared to pre-hurricane (87.6 asthma patients per 1000 ED visits compared to 74.8) | p < 0.05 | ↑ |
| Hoppe KA, 2012 | Flooding | Asthma | Residents of flooded homes experienced more asthma symptoms and required an increase in controller medications | aOR 3.77; [95% CI: (2.06–6.92)] and aOR 1.38, [95% CI: (1.01–1.88)] | ↑ |
| Hendrickson LA, 1997 | Hurricane | Asthma | Primary care visits for asthma were increased in the two week period following Hurricane Iniki | RR: 2.8, [95% CI: (1.93–4.09)] | ↑ |
| Cowan K, 2021 | Hurricane | Asthma | Rates of asthma ED visits were similar in counties that received a disaster declaration and counties that did not | Adjusted rate ratio: 1.02 [95% CI: (0.97–1.08)] | - |
| Azuma K, 2015 | Flooding | Respiratory symptoms–cough/rhinorrhea | Residents of water damaged homes had higher rates of respiratory and nasal symptoms one week after flooding | aOR: 4.19 [95% CI: (1.17–15.0) and aOR: 8.15 [95% CI: (2.39–27.8)] | ↑ |
| Cummings K, 2008 | Flooding | LRS/wheeze | Positive association between exposure to water-damaged homes and lower respiratory symptoms (cough/wheeze) | p < 0.05 | ↑ |
| Brokamp C, 2017 | Flooding | Asthma | Increased risk per combined sewer overflow (CSO) event for an asthma-related ED visit was observed 1 and 5 days following CSO events | OR: 1.11 [95% CI: (0.98,1.25)] and OR: 1.12 [95% CI: (0.99,1.27)], respectively) | ↑ |
| Rath B, 2011 | Hurricane | Asthma | Self-reported URS and LRS (76% and 36%, respectively) were higher after the hurricane than before the hurricane (22% and 9%, respectively | p < 0.0001 | ↑ |
| Sato S, 2016 | Typhoon | Asthma | 29.3% patients reported worsened asthma symptoms and received systemic corticosteroids as rescue medication over the study period of 1 year (47.0% vs. 19.5%) | p = 0.033 | ↑ |
| Author (Year) | Location | Rater 1 Score | Rater 2 Score |
|---|---|---|---|
| Larson PS, 2021 | Detroit MI, USA | 18 | 17 |
| Fanny SA, 2021 | Houston TX, USA | 17 | 16 |
| Eiffert S, 2016 | Atlanta GA, USA | 17 | 16 |
| Qu Y, 2021 | New York, USA | 17 | 17 |
| Chowdhury M, 2019 | US Virgin Islands | 16 | 14 |
| Hoppe KA, 2012 | Iowa, USA | 16 | 16 |
| Hendrickson LA, 1997 | Hawaii, USA | 18 | 18 |
| Cowan K, 2021 | North Carolina, USA | 15 | 15 |
| Azuma K, 2013 | Japan | 17 | 17 |
| Cummings K, 2008 | NOLA, USA | 18 | 17 |
| Rath B, 2011 | NOLA, USA | 16 | 16 |
| Sato S, 2016 | Fukushima, Japan | 18 | 17 |
| Cross-sectional studies | |||
| Schinasi LH, 2020 | Philadelphia PA, USA | Good quality | Good quality |
| Shih HI, 2020 | Taiwan | Good quality | Good quality |
| Saporta D, 2017 | New Jersey, USA | Good Quality | Good quality |
| Brokamp C, 2017 | Ohio, USA | Good quality | Good quality |
Publisher’s Note: MDPI stays neutral with regard to jurisdictional claims in published maps and institutional affiliations. |
© 2022 by the authors. Licensee MDPI, Basel, Switzerland. This article is an open access article distributed under the terms and conditions of the Creative Commons Attribution (CC BY) license (https://creativecommons.org/licenses/by/4.0/).
Share and Cite
Peirce, A.M.; Espira, L.M.; Larson, P.S. Climate Change Related Catastrophic Rainfall Events and Non-Communicable Respiratory Disease: A Systematic Review of the Literature. Climate 2022, 10, 101. https://doi.org/10.3390/cli10070101
Peirce AM, Espira LM, Larson PS. Climate Change Related Catastrophic Rainfall Events and Non-Communicable Respiratory Disease: A Systematic Review of the Literature. Climate. 2022; 10(7):101. https://doi.org/10.3390/cli10070101
Chicago/Turabian StylePeirce, Alexandra M., Leon M. Espira, and Peter S. Larson. 2022. "Climate Change Related Catastrophic Rainfall Events and Non-Communicable Respiratory Disease: A Systematic Review of the Literature" Climate 10, no. 7: 101. https://doi.org/10.3390/cli10070101
APA StylePeirce, A. M., Espira, L. M., & Larson, P. S. (2022). Climate Change Related Catastrophic Rainfall Events and Non-Communicable Respiratory Disease: A Systematic Review of the Literature. Climate, 10(7), 101. https://doi.org/10.3390/cli10070101