Abstract
The dynamics of land surface temperature (LST) in Afghanistan in the period 2000–2021 were investigated, and the impact of the factors such as soil moisture, precipitation, and vegetation coverage on LST was assessed. The remotely sensed soil moisture data from Land Data Assimilation System (FLDAS), precipitation data from Climate Hazards Group Infra-Red Precipitation with Station (CHIRPS), and NDVI and LST from Moderate-Resolution Imaging Spectroradiometer (MODIS) were used. The correlations between these data were analyzed using the regression method. The result shows that the LST in Afghanistan has a slightly decreasing but insignificant trend during the study period (R = 0.2, p-value = 0.25), while vegetation coverage, precipitation, and soil moisture had an increasing trend. It was revealed that soil moisture has the highest impact on LST (R = −0.71, p-value = 0.0007), and the soil moisture, precipitation, and vegetation coverage explain almost 80% of spring (R2 = 0.73) and summer (R2 = 0.76) LST variability in Afghanistan. The LST variability analysis performed separately for Afghanistan’s river subbasins shows that the LST of the Amu Darya subbasin had an upward trend in the study period, while for the Kabul subbasin, the trend was downward.
1. Introduction
The temperature of the land surface is one of the most fundamental parameters of the Earth in geophysical research on both local and global scales [1]. It was recognized as one of the key climate parameters by the World Meteorological Organization [2,3]. Land Surface Temperature (LST) is one of the key variables in the Earth’s energy exchange, and it plays an important role in assessing the surface energy level, being the interface between turbulent heat fluxes and Earth heat fluxes. LST is seriously affected by the effect of intensification of global warming connected to the day-by-day increase in the concentration of greenhouse gases in the atmosphere. Nowadays, a large part of the scientific community focuses on mitigation and adaptation to the effects of global warming, as the associated rise in average air temperatures has a severe impact on the global climate [4,5]. Air temperature changes influence not only LST but also soil moisture and nutrient contents, which, in turn, affect the physiological characteristics, community structure, and population dynamics of plants [6,7,8]. Such abnormal climate change resulting from the negative effects of human activities over the past few decades is the main reason for the series of environmental and ecological problems, such as soil degradation, air pollution, surface temperature changes, biodiversity loss, and ecosystem degradation [9,10,11]. Albedo changes resulting from the intensification of global warming additionally and significantly impact local weather conditions, especially in the case of the snow-covered ground at mid-latitudes and high latitudes in the Northern Hemisphere [12,13,14,15].
LST is a very useful variable, which found its application in many different fields of science, including hydrology, climatology, geophysics, and specifically, in the assessment of the surface urban heat island [16,17]. LST is also recognized as complementary to near-surface air and spatial temperature data in nature, thus helping to achieve the sustainable development of climate action goals [18,19]. One of the characteristics of the LST is that it shows very high spatial and temporal variation, mostly because of the heterogeneity of factors influencing its value, such as characteristics of the vegetation cover, precipitation, soil moisture, area topography, and geology [20,21,22,23]. Because of this, accurate measurements of LST in larger spatial and temporal scales are more and more desired. LST can be obtained via ground measurements or analysis of remote sensing data based on estimates of the Earth’s energy balance model. Although terrestrial measurements are more accurate than satellite imagery, point observations and the dispersion of meteorological stations are the main limitations of their research and application on regional and global scales [24]. Because of that, obtaining LST on an extensive terrain or global scale was not possible until satellite thermal sensors were developed, yet it was difficult to obtain spatial, temporal, and spectral high-resolution satellite imagery because of the relationships between these resolutions [25]. Nowadays, thermal infrared satellites can be used to detect LST changes at various temporal and spatial scales due to the benefits of their coverage, reproducibility, and low cost needed to download and process the data [26]. The temperature calculated by remote sensing usually corresponds to the radiometric temperature of the surface measured in the direction of the sensor, meaning that the temperature is obtained from the radiative energy balance of the surface [27,28,29]. LST variability and its long-term dynamics have been assessed in many studies at various scales, both local and global; however, only limited studies investigated the influence of vegetation and meteorological parameters, such as precipitation and soil moisture, on LST [30,31,32,33].
Due to a combination of political, geographical, and social factors, Afghanistan is one of the countries in the world most vulnerable to the effects of climate change, and it is ranked 176th out of 181 countries in the ND-GAIN Index 2019 list [34]. Afghanistan is a mountainous country with a dry and continental climate. Mountainous areas are commonly known as fragile and unfounded environments, very sensitive to global climate change, earlier and to a greater extent affected by its effects than lowland areas [20]. Afghanistan’s mountainous regions experience annual LST below zero, while the arid southern regions regularly experience LST above 35 °C [30]. LST increase in Afghanistan can affect various sectors, with agriculture and water resources being the most vulnerable ones. Agriculture is one of the largest and most important sectors of the economy in Afghanistan, with about 85% of the country’s population earnings coming directly and indirectly from agriculture. The vulnerability of the agricultural sector to LST increase is considered high, as it leads to drought, which, in turn, will increase the water pressure on Afghanistan [31]. Despite the existing problems, the Afghan government has made no effort to prepare for the effects of climate change and remedy them. Because of that, the study of spatial and temporal LST variability in Afghanistan and assessment of LST affecting factors has been undertaken to cover the information gaps.
In this study, the dynamics of LST over the whole of Afghanistan and separately for its main river basins were assessed for the period from 2000 to 2021. The main objectives of this research are (a) to investigate the trend of spatial and temporal changes of LST by using MODIS product; and (b) to investigate the relationship between LST and such factors as vegetation, precipitation, and soil moisture by using regression methods. In addition, this study provides important information for understanding surface–atmospheric energy exchanges.
The text is organized in the following order: the materials and methods section presents the description of the study area (Section 2.1), the sources of the data used (Section 2.2), and the methods of data analysis (Section 2.3). In the results section, the seasonal and annual variations of LST are assessed for the whole region of Afghanistan and taking into account the rivers’ subbasins, annual variations of precipitation, and NDVI are studied, and the correlation of LST with other variables is analyzed using the linear and multiple regression methods. The fourth section is dedicated to discussing the obtained results, whereas the conclusions are presented in Section 5.
2. Materials and Methods
2.1. Study Area
Afghanistan is located in the central zone of Asia, approximately between 29 and 38° N and from 61 to 74° E. It has a border with Uzbekistan, Tajikistan, and Turkmenistan in the north, Iran in the west, Pakistan in the southeast, and China in the northeast. Part of Afghanistan is located in the Hindu Kush region of the Himalayas, with an area of 652,000 km2. The altitude of the country is from 230 to 7471 m, and it has a complex topography [35]. Afghanistan is a mountainous country with an arid and semi-arid climate, cold winters, and hot summers. The vast plains of southern Afghanistan experience extreme seasonal temperature changes, with summer temperatures exceeding 33 °C and average temperatures around 10 °C. The average temperature in the highlands of Afghanistan does not exceed 15 °C, and in the winter season (from December to February), the average value is below zero [32,36]. Afghanistan has large areas with scarce precipitation. The peak in the precipitation usually occurs in February and March, mainly over the northern highlands [36]. The precipitation between April and November mostly occurs in the form of snow in the high mountains due to storms of Mediterranean origin.
In Afghanistan, five main river basins can be distinguished: Amu Darya, Northern, Harirod-Murghab, Helmand, and Kabul (Indus) (Figure 1). The Helmand river basin (HRB) is the largest basin in the country, with an area of 327,661 km2. The Amu Darya basin (ADB) is the second-largest basin in Afghanistan, with an area of about 90,941 km2. The Northern basin (NB) is the only closed basin area in Afghanistan, with an area of about 70,000 km2 [37,38]. The Kabul river basin (KRB) is the eastern basin in Afghanistan, which covers approximately 12% of the country’s area (71,266 km2) [38]. The Harirod-Murghab basin (HMB) is located in the western part of the country and covers around 13% of the country (78,060 km2) [38,39].
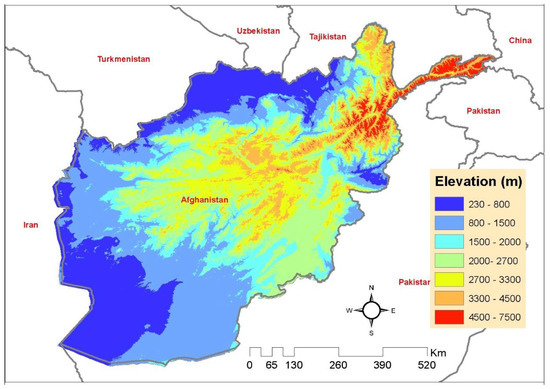
Figure 1.
The map of Afghanistan, including an elevation profile.
2.2. Data
In this study, LST-Day variability in Afghanistan was investigated for the period 2000–2021, and the impact of such factors as soil moisture, precipitation, and vegetation coverage on LST was assessed using regression methods. The summary of the sources of the remote sensing data used in this study is provided in Table 1, while the flowchart of data processing is presented in Figure 2. All satellite-born statistics of the surfaces belong to the bright days (hours) only.

Table 1.
Remote sensing data used in this study.
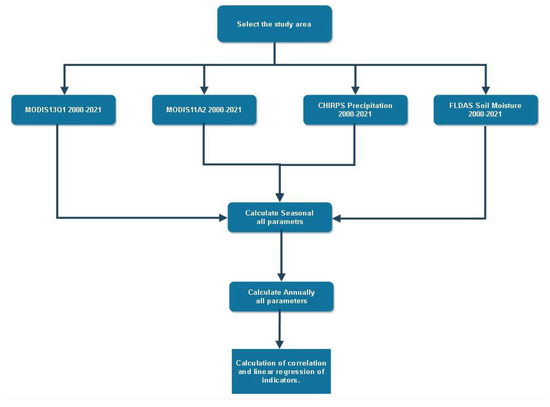
Figure 2.
Flowchart of the data processing.
2.2.1. Land Surface Temperature (LST) Data
In the study, the MODIS-LST-Day MOD11A2 product with a spatial resolution of 1 km and temporal resolution of 8 days data were used. The data from 2000 to 2021 were downloaded using the Google Earth Engine (GEE) platform. The seasonal and annual LST were calculated using the equations:
where the index i is numbering images for each year chronologically by dates.
2.2.2. Normalized Difference Vegetation Index (NDVI) Data
NDVI is one of the most common indicators for measuring crop health in the agricultural sector. In recent years, NDVI has been used by many scientists in various studies such as vegetation classification, land cover changes, vegetation phenology, continental cover mapping, and vegetation dynamics [40,41]. This index provides information on green and healthy leaf pigments that strongly reflect infrared radiation, at the same time absorbing a large portion of the visible spectrum [42]. NDVI is calculated using the formula
where RRED is the reflectance in the red visible range (0.670–0.620 µm), and RNIR is the infrared reflectance (0.876–0.841 µm). The range of NDVI values is between −1 and 1, with vegetation usually having NDVI in the range of 0.2–0.8, corresponding to the areas with greenness or with plants. NDVI can be divided into eight classes (<0.2, 0.2–0.3, 0.3–0.4, 0.4–0.5, 0.5–0.6, 0.6–0.7, 0.7–0.8, and >0.8). Values lesser than 0.2 indicate areas with no vegetation and are barren, or covered with rocks, snow, water, ice, or urban areas. Values between 0.2 and 0.3 indicate areas with shrubs and pastures, 0.3–0.4 indicate areas with scattered vegetation, 0.5–0.6 indicate areas with moderate vegetation, 0.6–0.7 can be interpreted as areas with dense vegetation, values between 0.7 and 0.8 indicate areas with very dense vegetation, and a value greater than 0.8 is the indicator of the area with extremely dense and green vegetation [43,44]. In this study, the NDVI vegetation index was examined by downloading MOD13Q1 products with a spatial resolution of 250 m and a temporal resolution of 16 days for the period 2000–2021 using the Google Earth Engine (GEE) platform.
2.2.3. Precipitation Data
Climate Hazards Group Infra-Red Precipitation with Station (CHIRPS) is a product developed by the US Geological Survey Earth Resources Observation and science center in association with the Santa Barbara Climate Risk Group at the University of California. The data spans from 1981 up to the present and is updated almost in real-time. CHIRPS covers the area from 50° S to 50° N and from 180° E to 180° W, and delivers information on precipitation with a spatial resolution of 0.05° (approximately 5 km) with daily, pentad, and monthly temporal resolution [45]. This product is designed to monitor drought conditions in areas with a complex topography and deep precipitation system [46]. In this research, the CHIRPS data product (precipitation data) was downloaded for the whole Afghanistan area and the period from 2000 to 2021 using the Google Earth Engine (GEE) platform.
2.2.4. Soil Moisture Data
The Land Data Assimilation System (FLDAS) satellite has been developed with the help and cooperation of several reputable organizations (NASA, USGS, EROS, GSFC, UCSB) and produces various parameters such as soil moisture, temperature, evapotranspiration, and runoff [47]. FLDAS from version 3.6.1 introduced global monthly products with 1° spatial resolution, which have been available for the period from January 1982 up to the present. In this study, the soil moisture of the topsoil (0–10 cm) product has been downloaded for the period 2000–2021 using the Google Earth Engine (GEE) platform.
2.3. Standardized Anomaly Calculation
The standardized anomaly, also known as the -score, shows the deviations of the quantity under consideration from the mean. The average standardized anomaly (-score) is always 0, and the deviation ranges from −3 to 3 for almost all of the results (in fact, 99.7% of them) [20,22]. The standardized anomaly is calculated using the formula
where Zij is a standardized anomaly, i stands for the assessed period, and j represents the time scale. Xij is an analyzed parameter in a given year (i.e., LST, precipitation, vegetation, or soil moisture), U represents the mean statistical period, and σij indicates the standard deviation. Positive values of the standardized anomaly indicate that the values under consideration are larger than the mean, while negative values of the standardized anomaly indicate that the values are smaller than the mean [8].
2.4. Margin of Error Calculation
The errors were estimated using the margin of error formula, in which the standardized anomaly (Z-score) and standard deviation are used to calculate errors as:
where σ is the standard deviation, and n is the sample size.
3. Results
3.1. Seasonal and Annual Variations of LST
3.1.1. Seasonal and Annual Variations of LST over the Whole Afghanistan Area
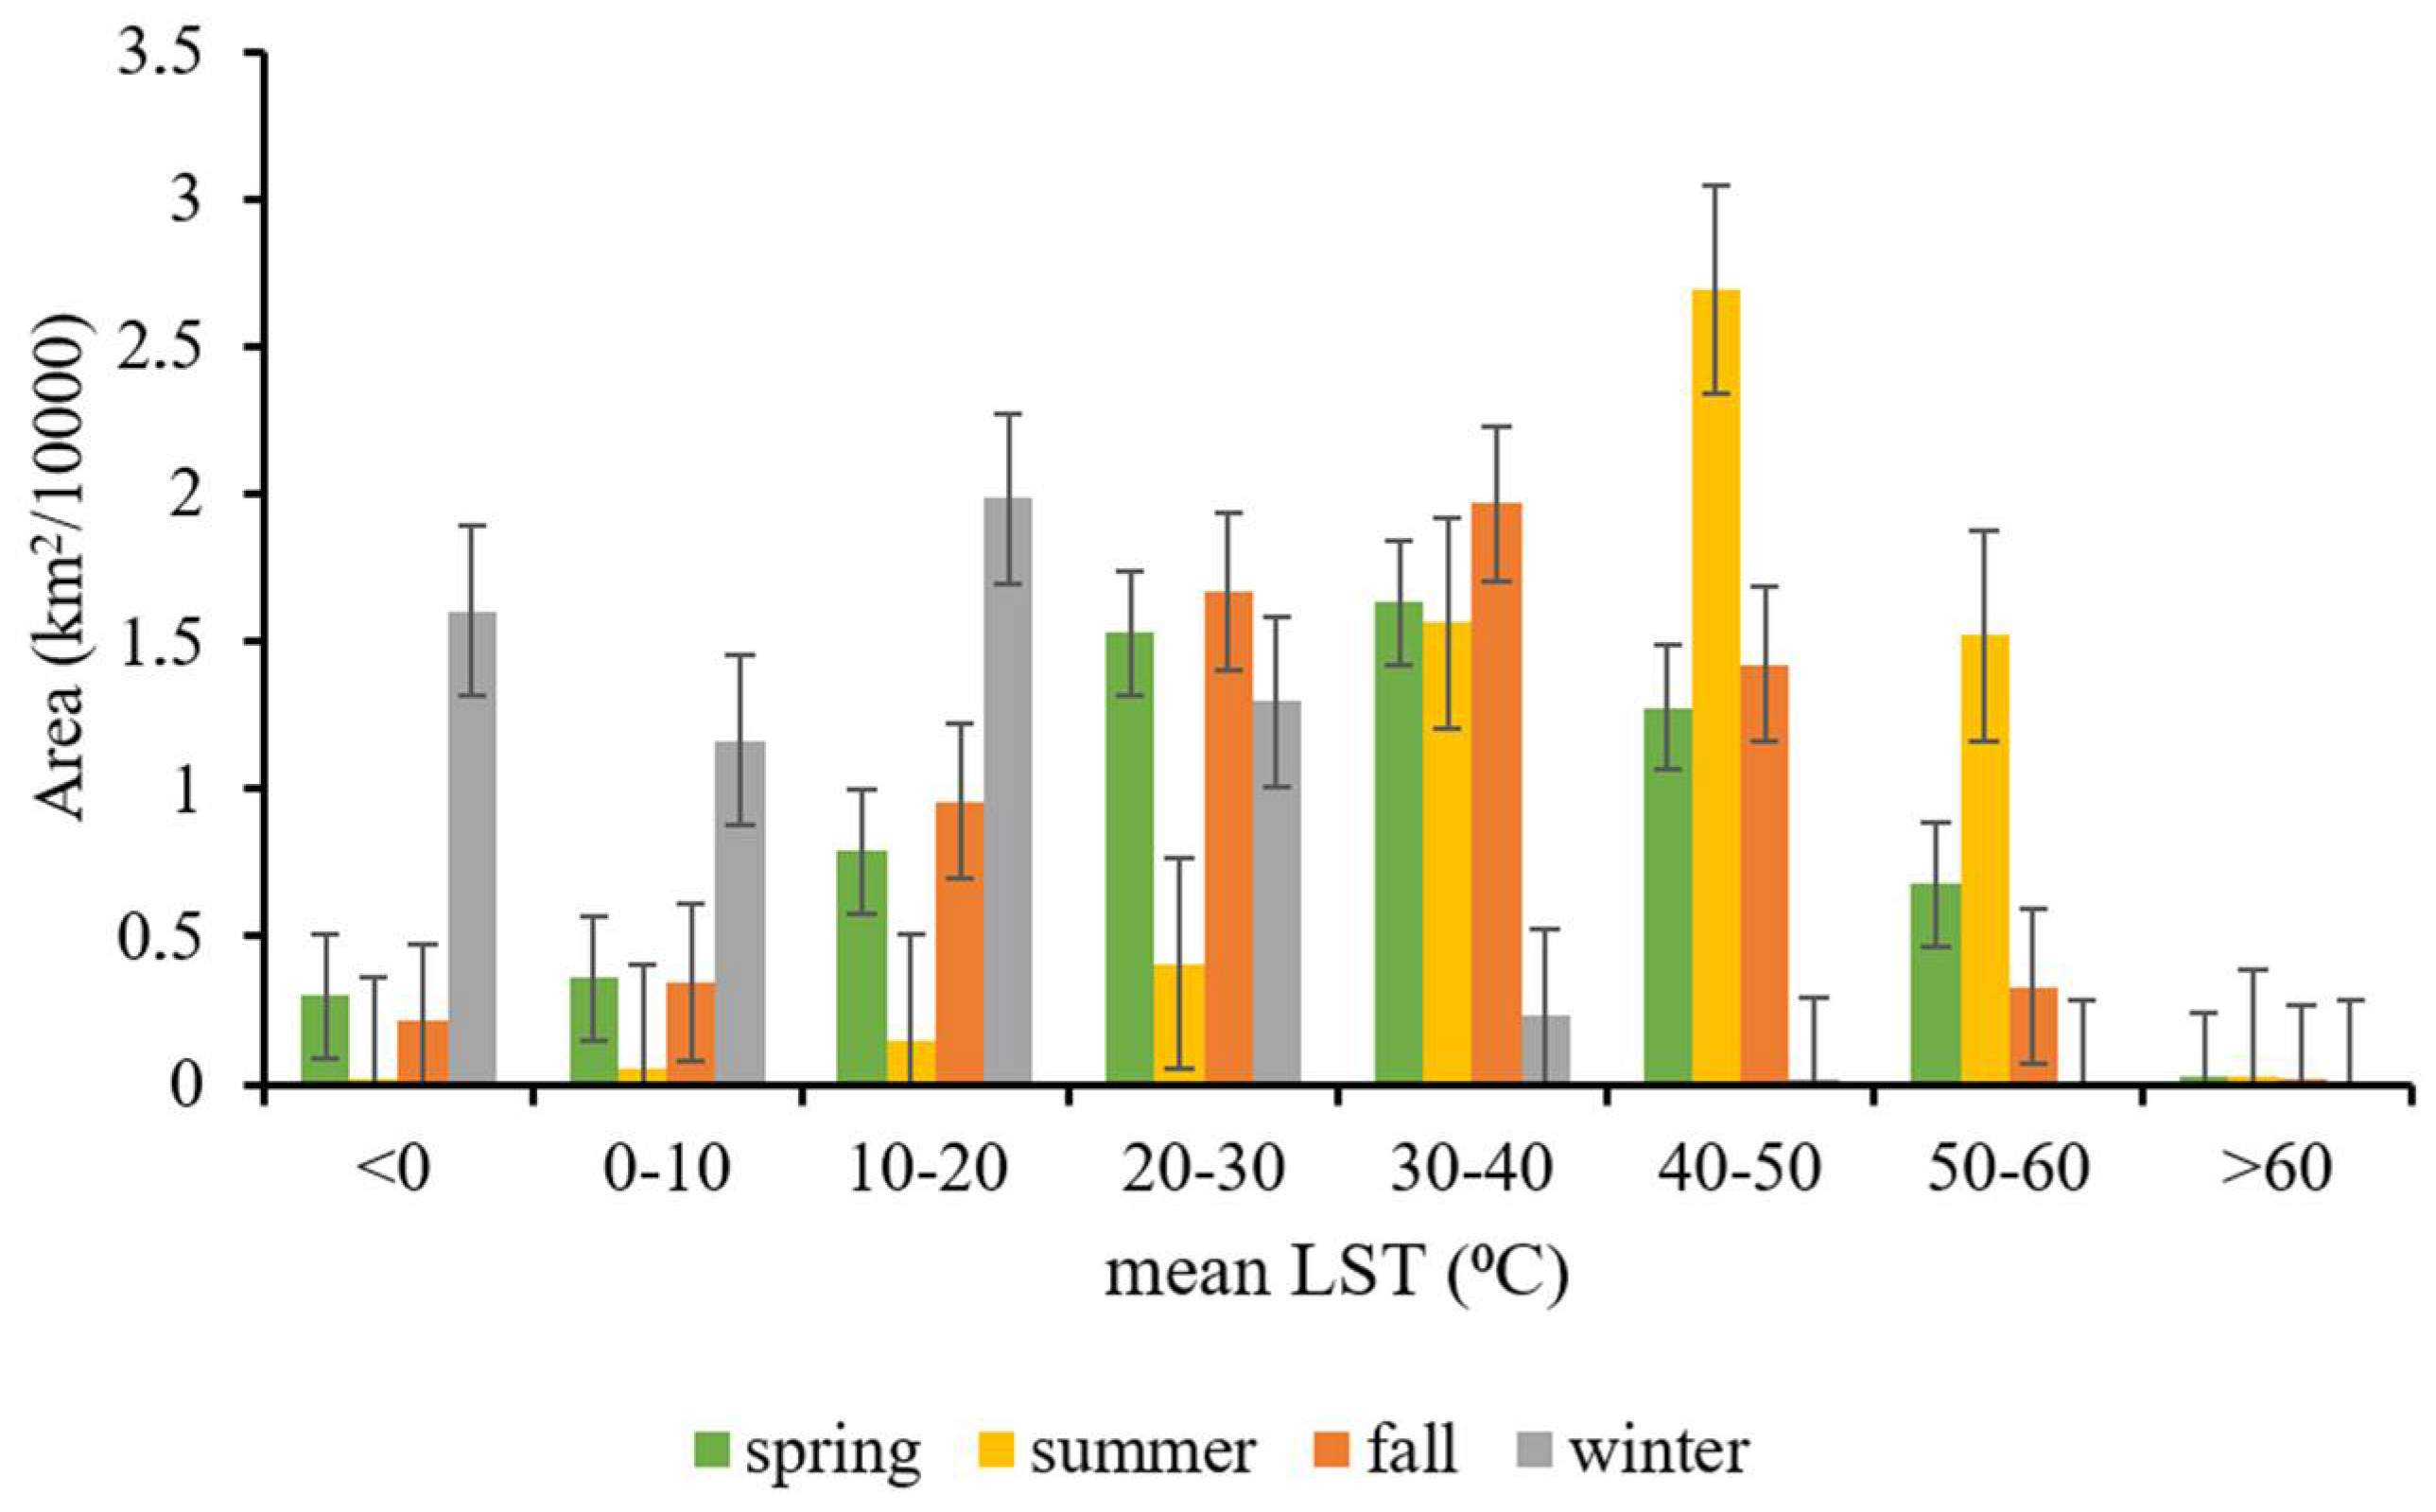
Figure 3 shows the seasonal variations of Afghanistan’s LST during the study period. The warmest season was summer, whereas the coldest season was winter. In the spring and fall, the LST was moderate. In the winter, 44% of the area (276,824.14 ± 38,814 km2) had an LST lower than 10 °C, and 56% of the area (351,962 ± 82,195 km2) had an LST between 10 and 50 °C. In the spring, 10% of the area (65,965 ± 58,683 km2) had an LST lesser than 10 °C, 79% of the area (522,384 ± 107,829 km2) had an LST between 10 and 50 °C, and 11% of the area (70,361 ± 56,145 km2) had an LST above 50 °C. In the summer, 0.9% (5890 ± 50,921 km2) of the study area had an LST less than 10 °C, 75% (482,343 ± 174,833 km2) of the study area had LST between 10 and 50 °C, and about 24.1% (154,923 ± 68,754 km2) of the study area had an LST higher than 50 °C. In the fall, 8.1% of the area (55,858.96 ± 60,718 km2) had an LST lower than 10 °C, 87.1% of the area (601,843 ± 154,506 km2) had an LST between 10 and 50 °C, and 4.8% (33,220 ± 63,788 km2) of the area had an LST higher than 50 °C.

Figure 3.
The mean seasonal histograms for the period 2000–2021 showing the areas of Afghanistan with specific values of LST.
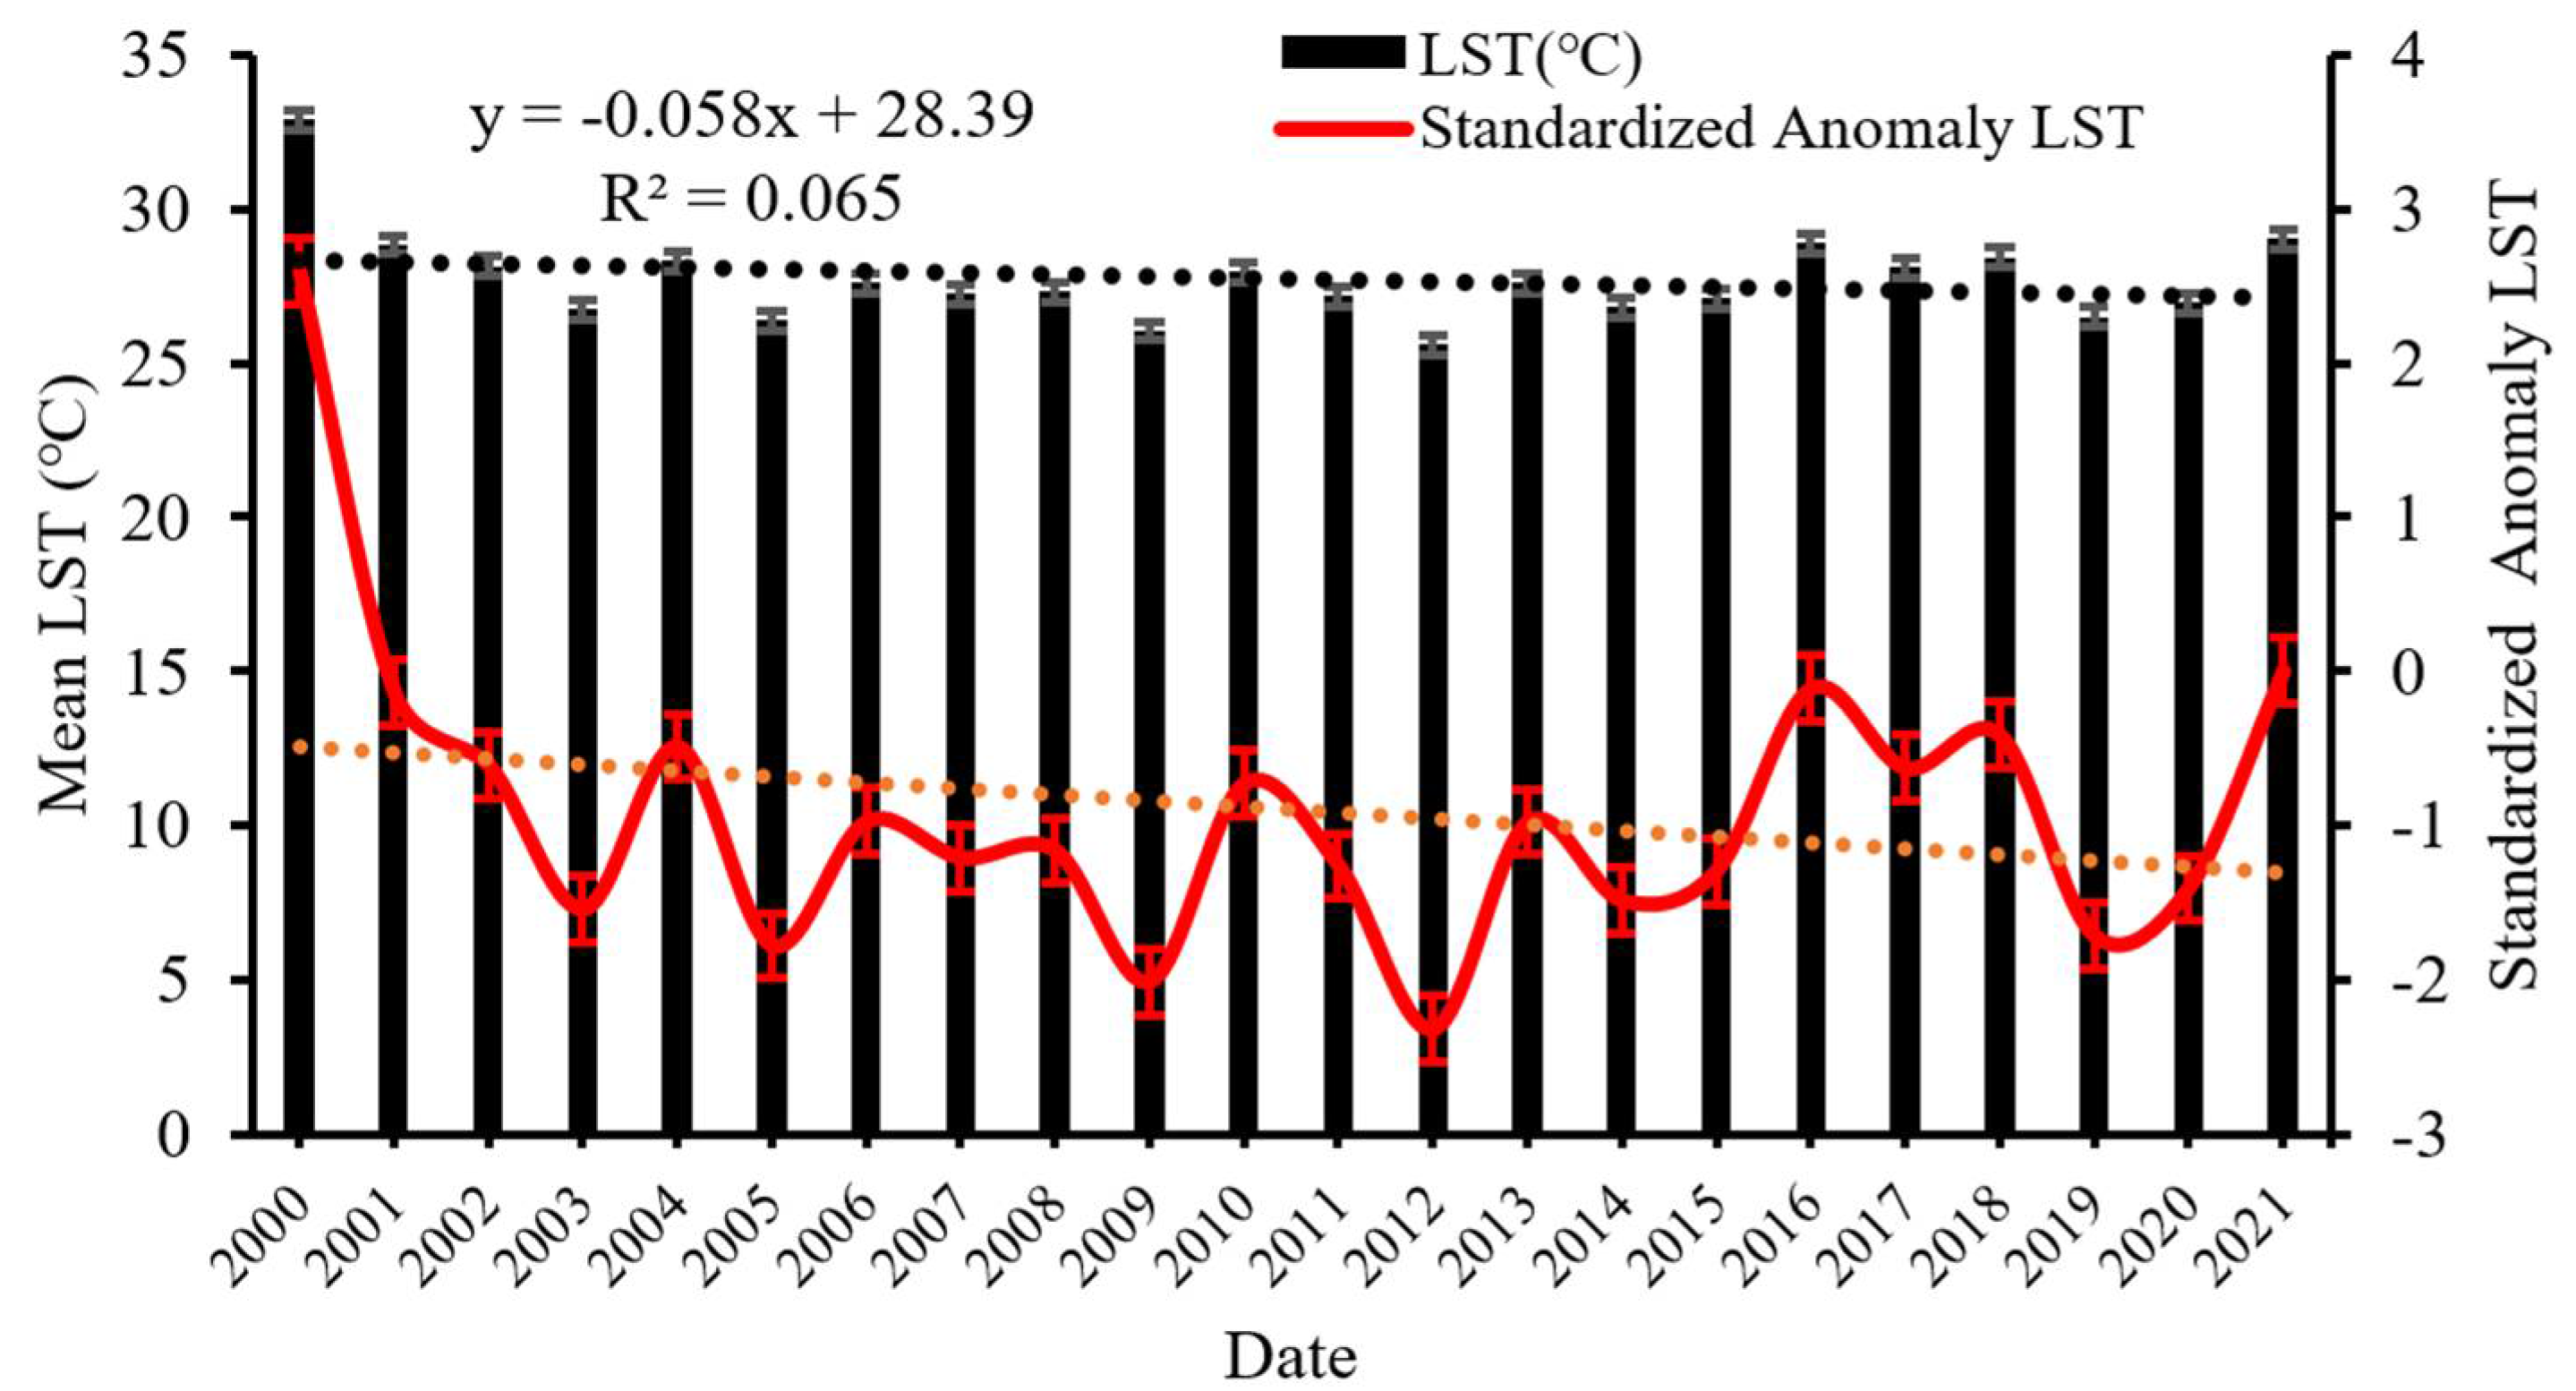
In Figure 4, the time series of mean annual LST variations in Afghanistan during the study period are presented. The year 2000 was the warmest, with an LST equal to 32.92 °C (±0.62), followed by 2001, 2004, 2010, 2016, 2017, 2018, and 2021 having almost the same temperatures, with LSTs of 28.84 (±0.14), 28.31 (±0.15), 27.96 (±0.23), 28.88 (±0.13), 28.11 (±0.14), 28.43 (±0.13), and 29.05 (±0.11) °C, while 2005, 2009, 2012, and 2019 were the coldest years during the study period, with LSTs equal to 26.39 (±0.56), 27.96 (±0.63), 25.58 (±0.43), and 26.49 (±0.54) °C, respectively. The trend line fitted to the LST data indicates a slow decrease in the LST in Afghanistan (~0.05 °C/year).

Figure 4.
Time series of yearly LST and standardized LST anomaly in Afghanistan in the period 2000–2021.
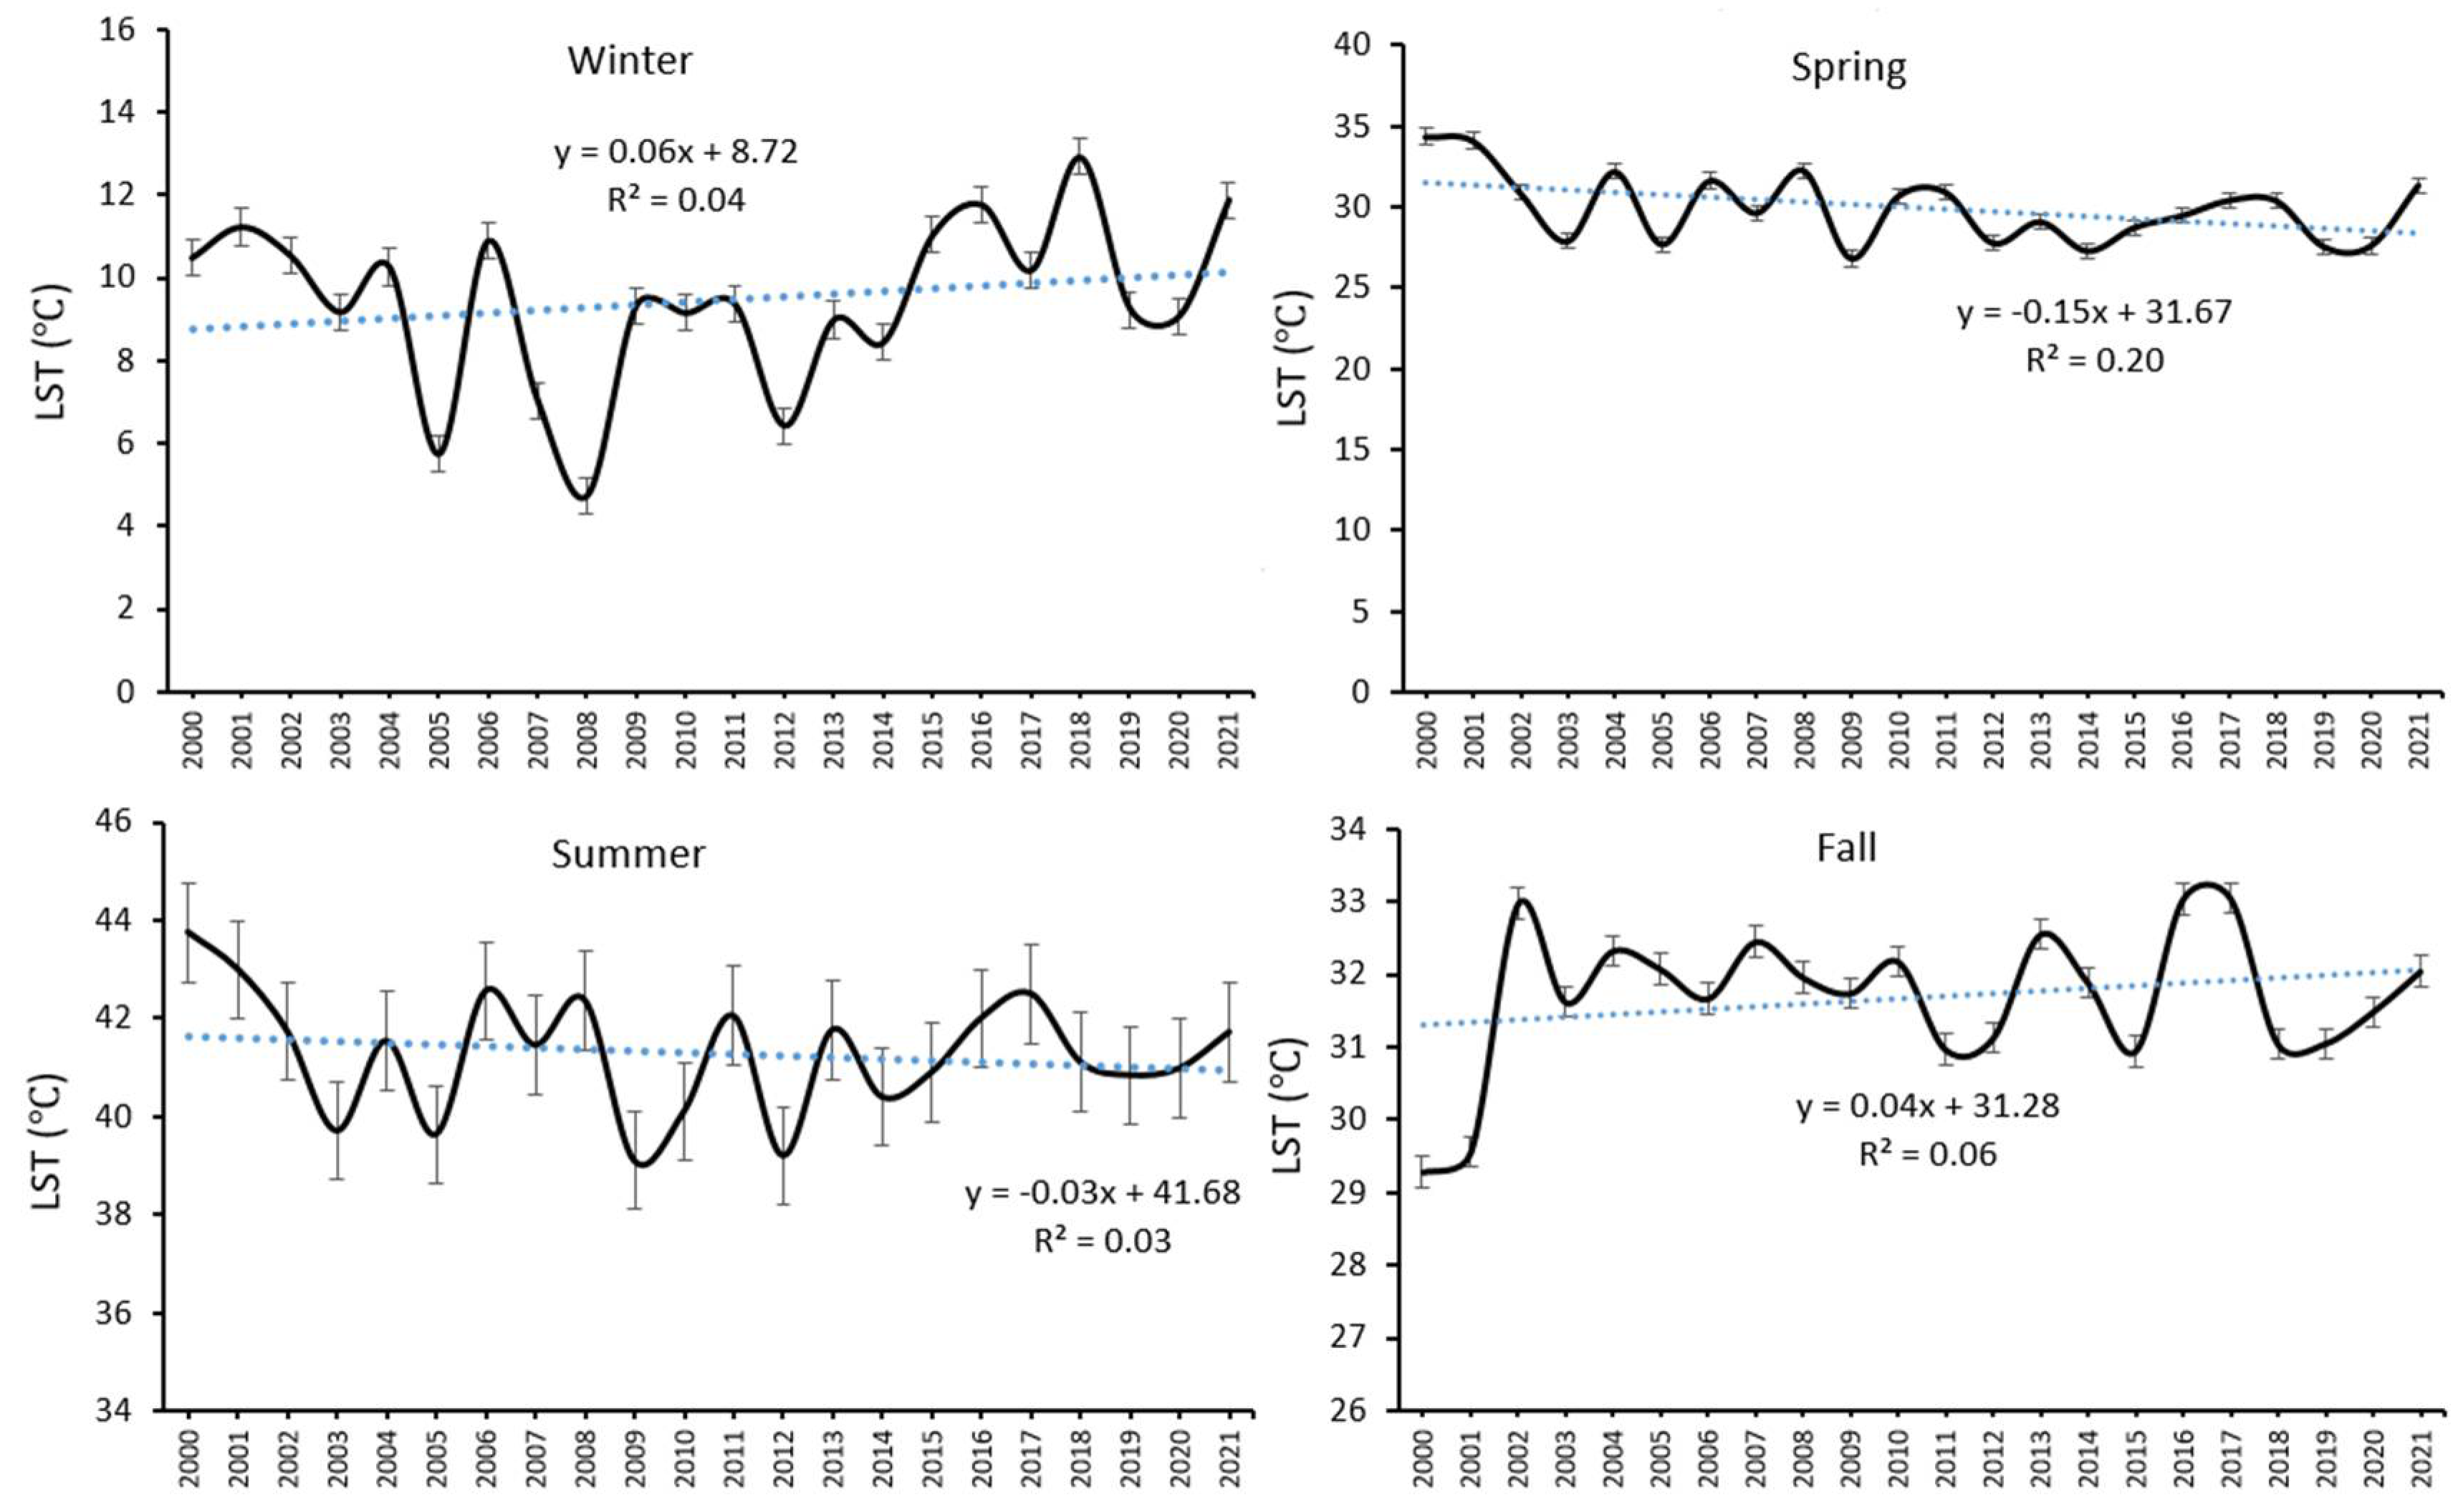
In Figure 5, the mean seasonal variations of LST during the study period are presented. In the winter, the highest LST was observed in 2018 (12.91 ± 0.73 °C), while the lowest was in 2008 (4.7 ± 0.79 °C). In the spring, the highest LST values were in 2000 and 2001 (34.37 ± 0.94 and 34.12 ± 0.88 °C, respectively), and the lowest values were observed in 2003, 2005, 2014, 2019, and 2020 (27.87 ± 0.44, 27.68 ± 0.48, 27.27 ± 0.57, 27.54 ± 0.51, 27.60 ± 0.5 °C, respectively). In the summer, the highest LST was in 2000 (43.74 ± 1.04 °C). However, the errors in the LST estimation indicate that it should be treated the same as the values for 2001, 2006, 2008, 2011, 2013, 2016, 2017, and 2021. The lowest summer LST was in 2009 (39.1 ± 1.03 °C), but it is indistinguishable from the values for 2003, 2005, 2010, 2012, 2014, and 2019. In the fall, the highest LSTs were in 2002, 2016, and 2017 (32.97 ± 0.27, 33.03 ± 0.28, 33.05 ± 0.29 °C, respectively) and the lowest in 2000 and 2001 (29.28 ± 0.5, and 29.55 ± 0.4 °C, respectively). The trend lines fitted to the seasonal time series of LST indicate that the LST went up by 0.063 °C/year in the winter and by 0.035 °C/year in the fall, while it decreased by 0.14 °C/year in the spring and 0.03 °C/year in the summer.
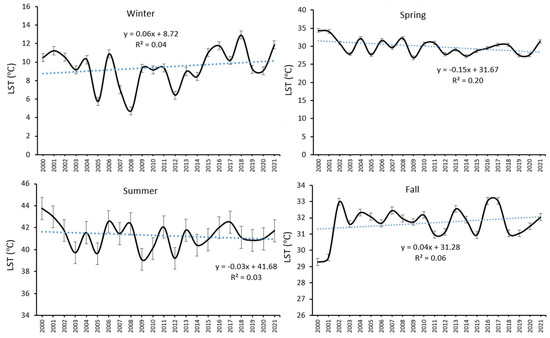
Figure 5.
Time series of seasonal LST in Afghanistan in the period 2000–2021.
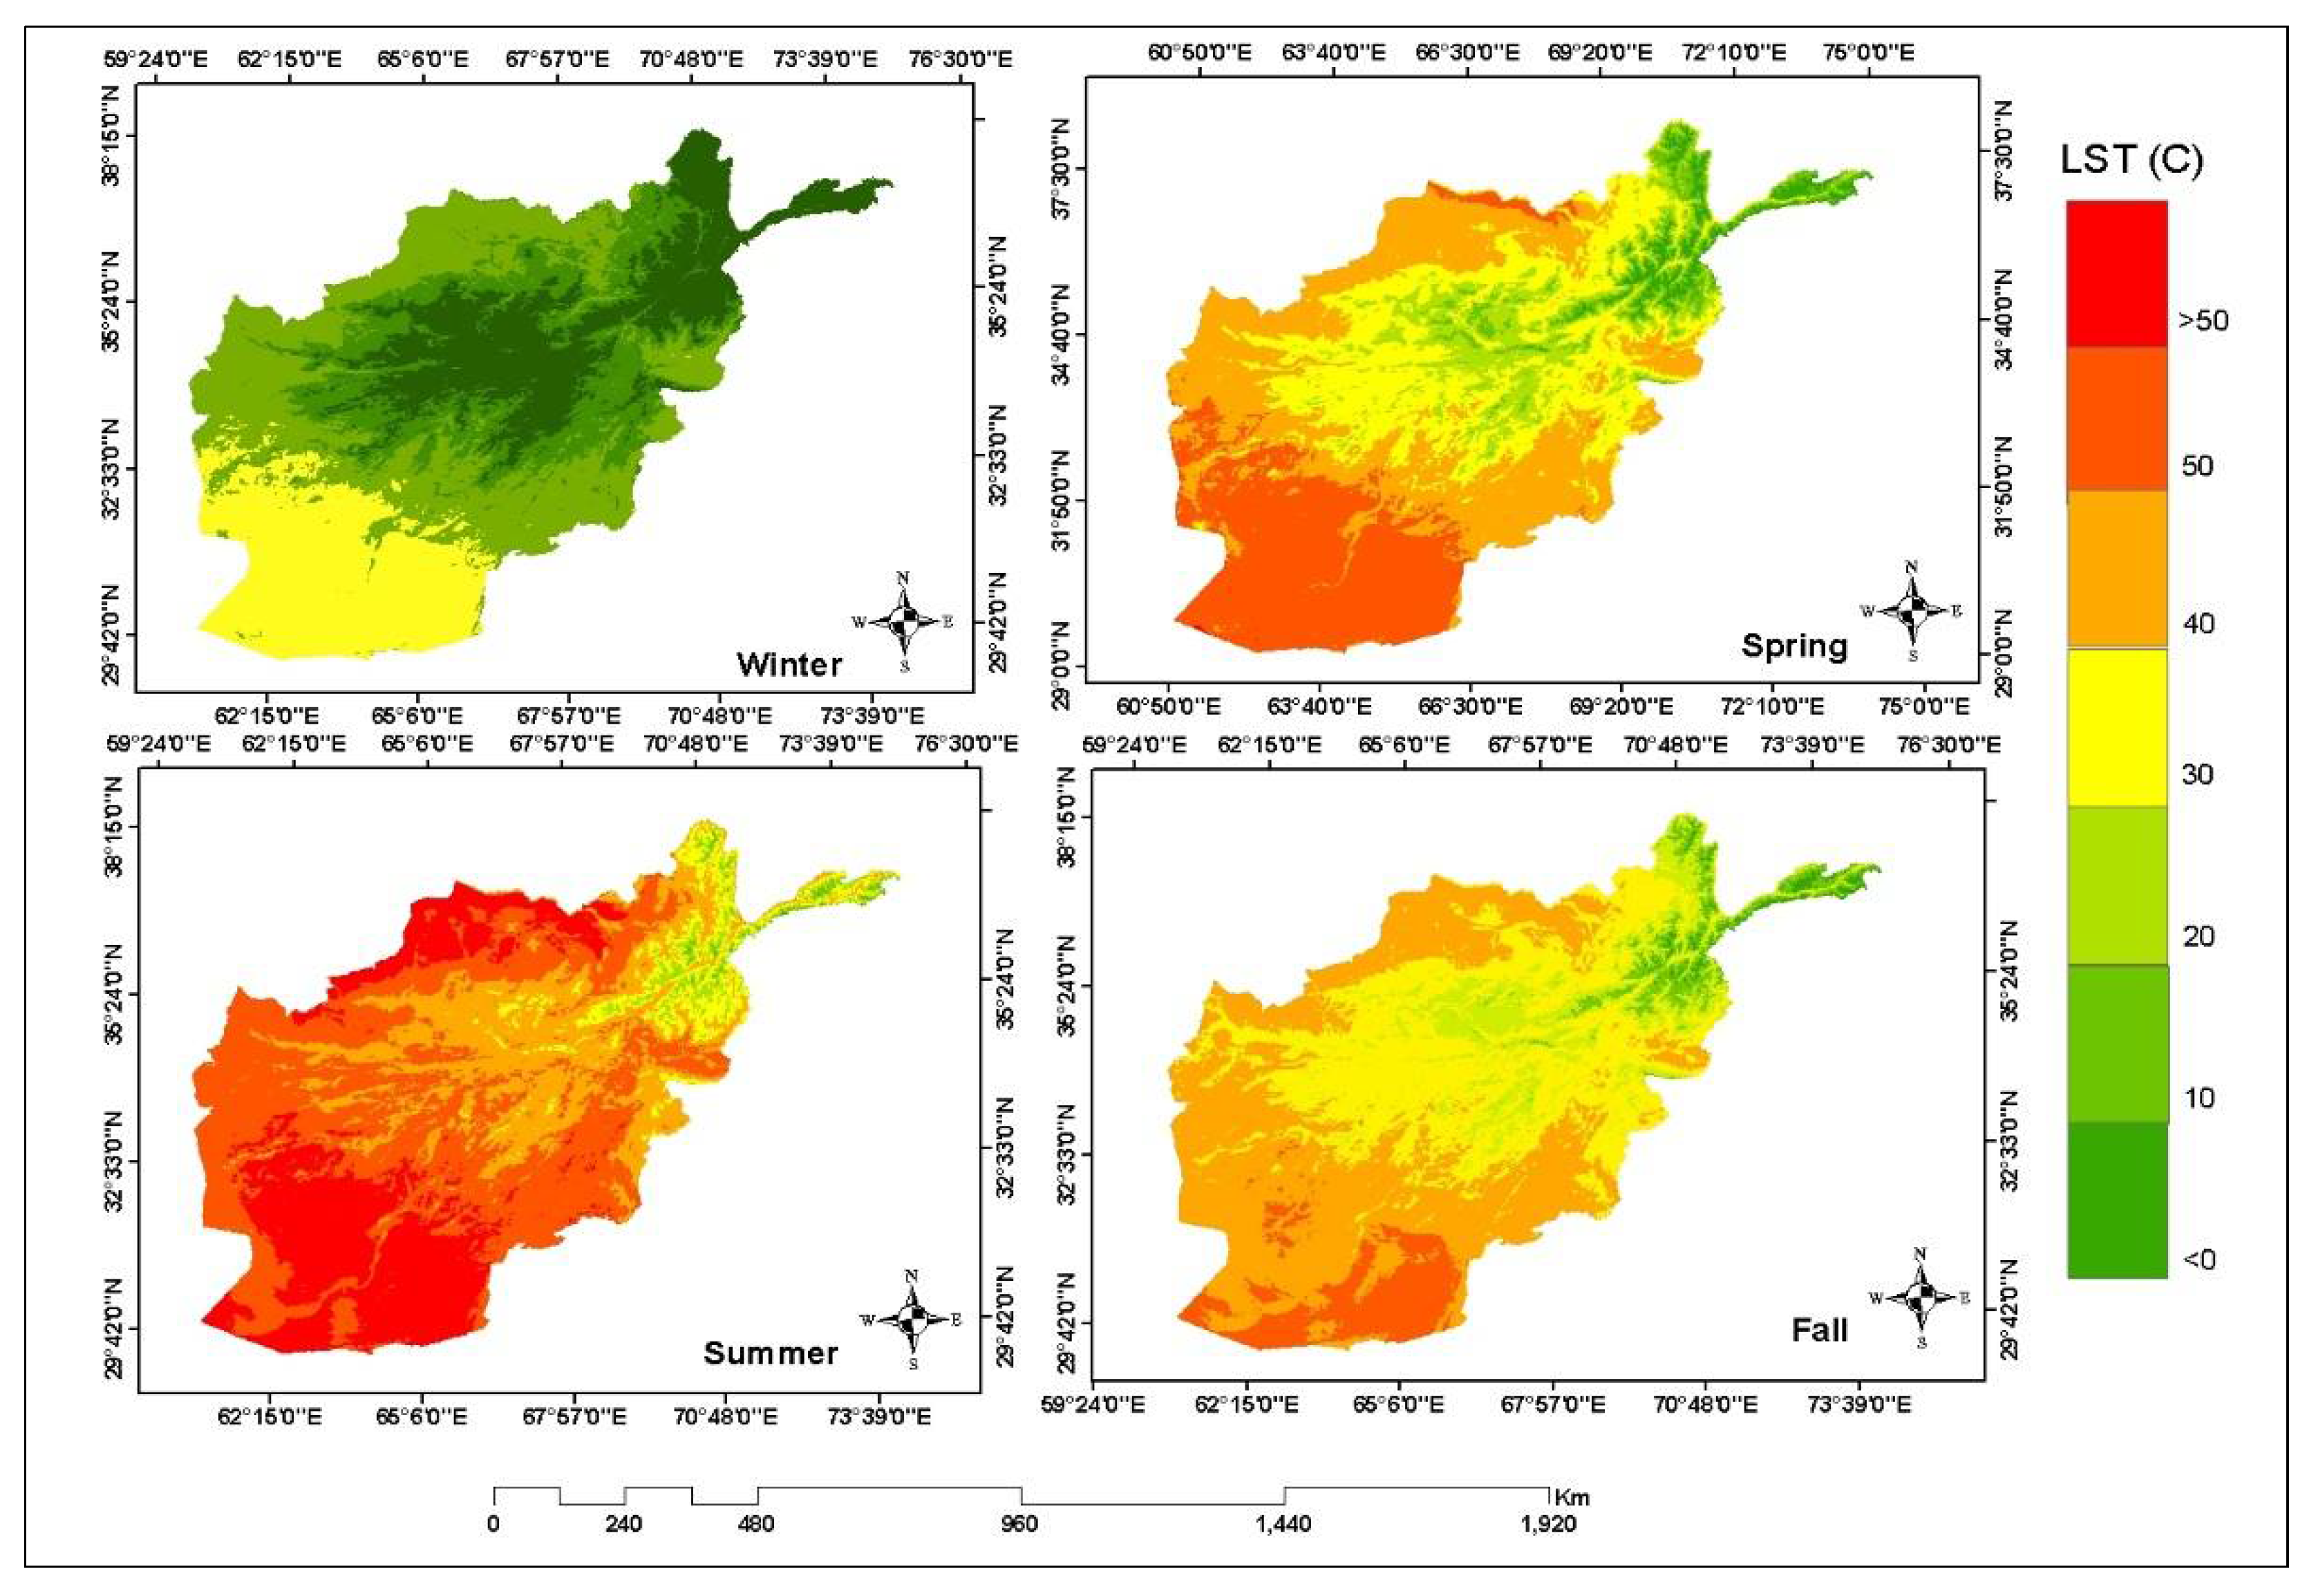
Figure 6 shows the maps of seasonal mean LST in the period 2000–2021. The highest LST was observed in the summer, and the lowest LST was observed in winter. The HRB was the warmest basin, and ADB was the coldest basin in Afghanistan during the study period.
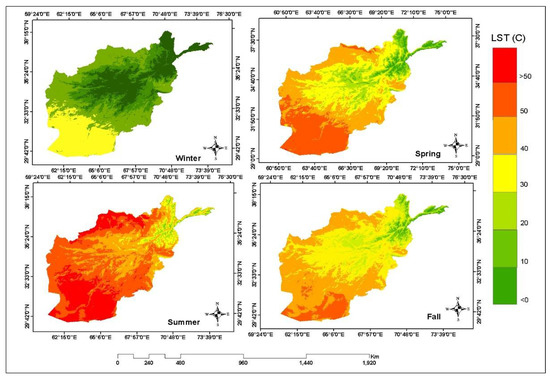
Figure 6.
The maps of the seasonal mean LST in Afghanistan in the period 2000–2021.
3.1.2. Seasonal and Annual Variations of LST over the Afghanistan River Basins
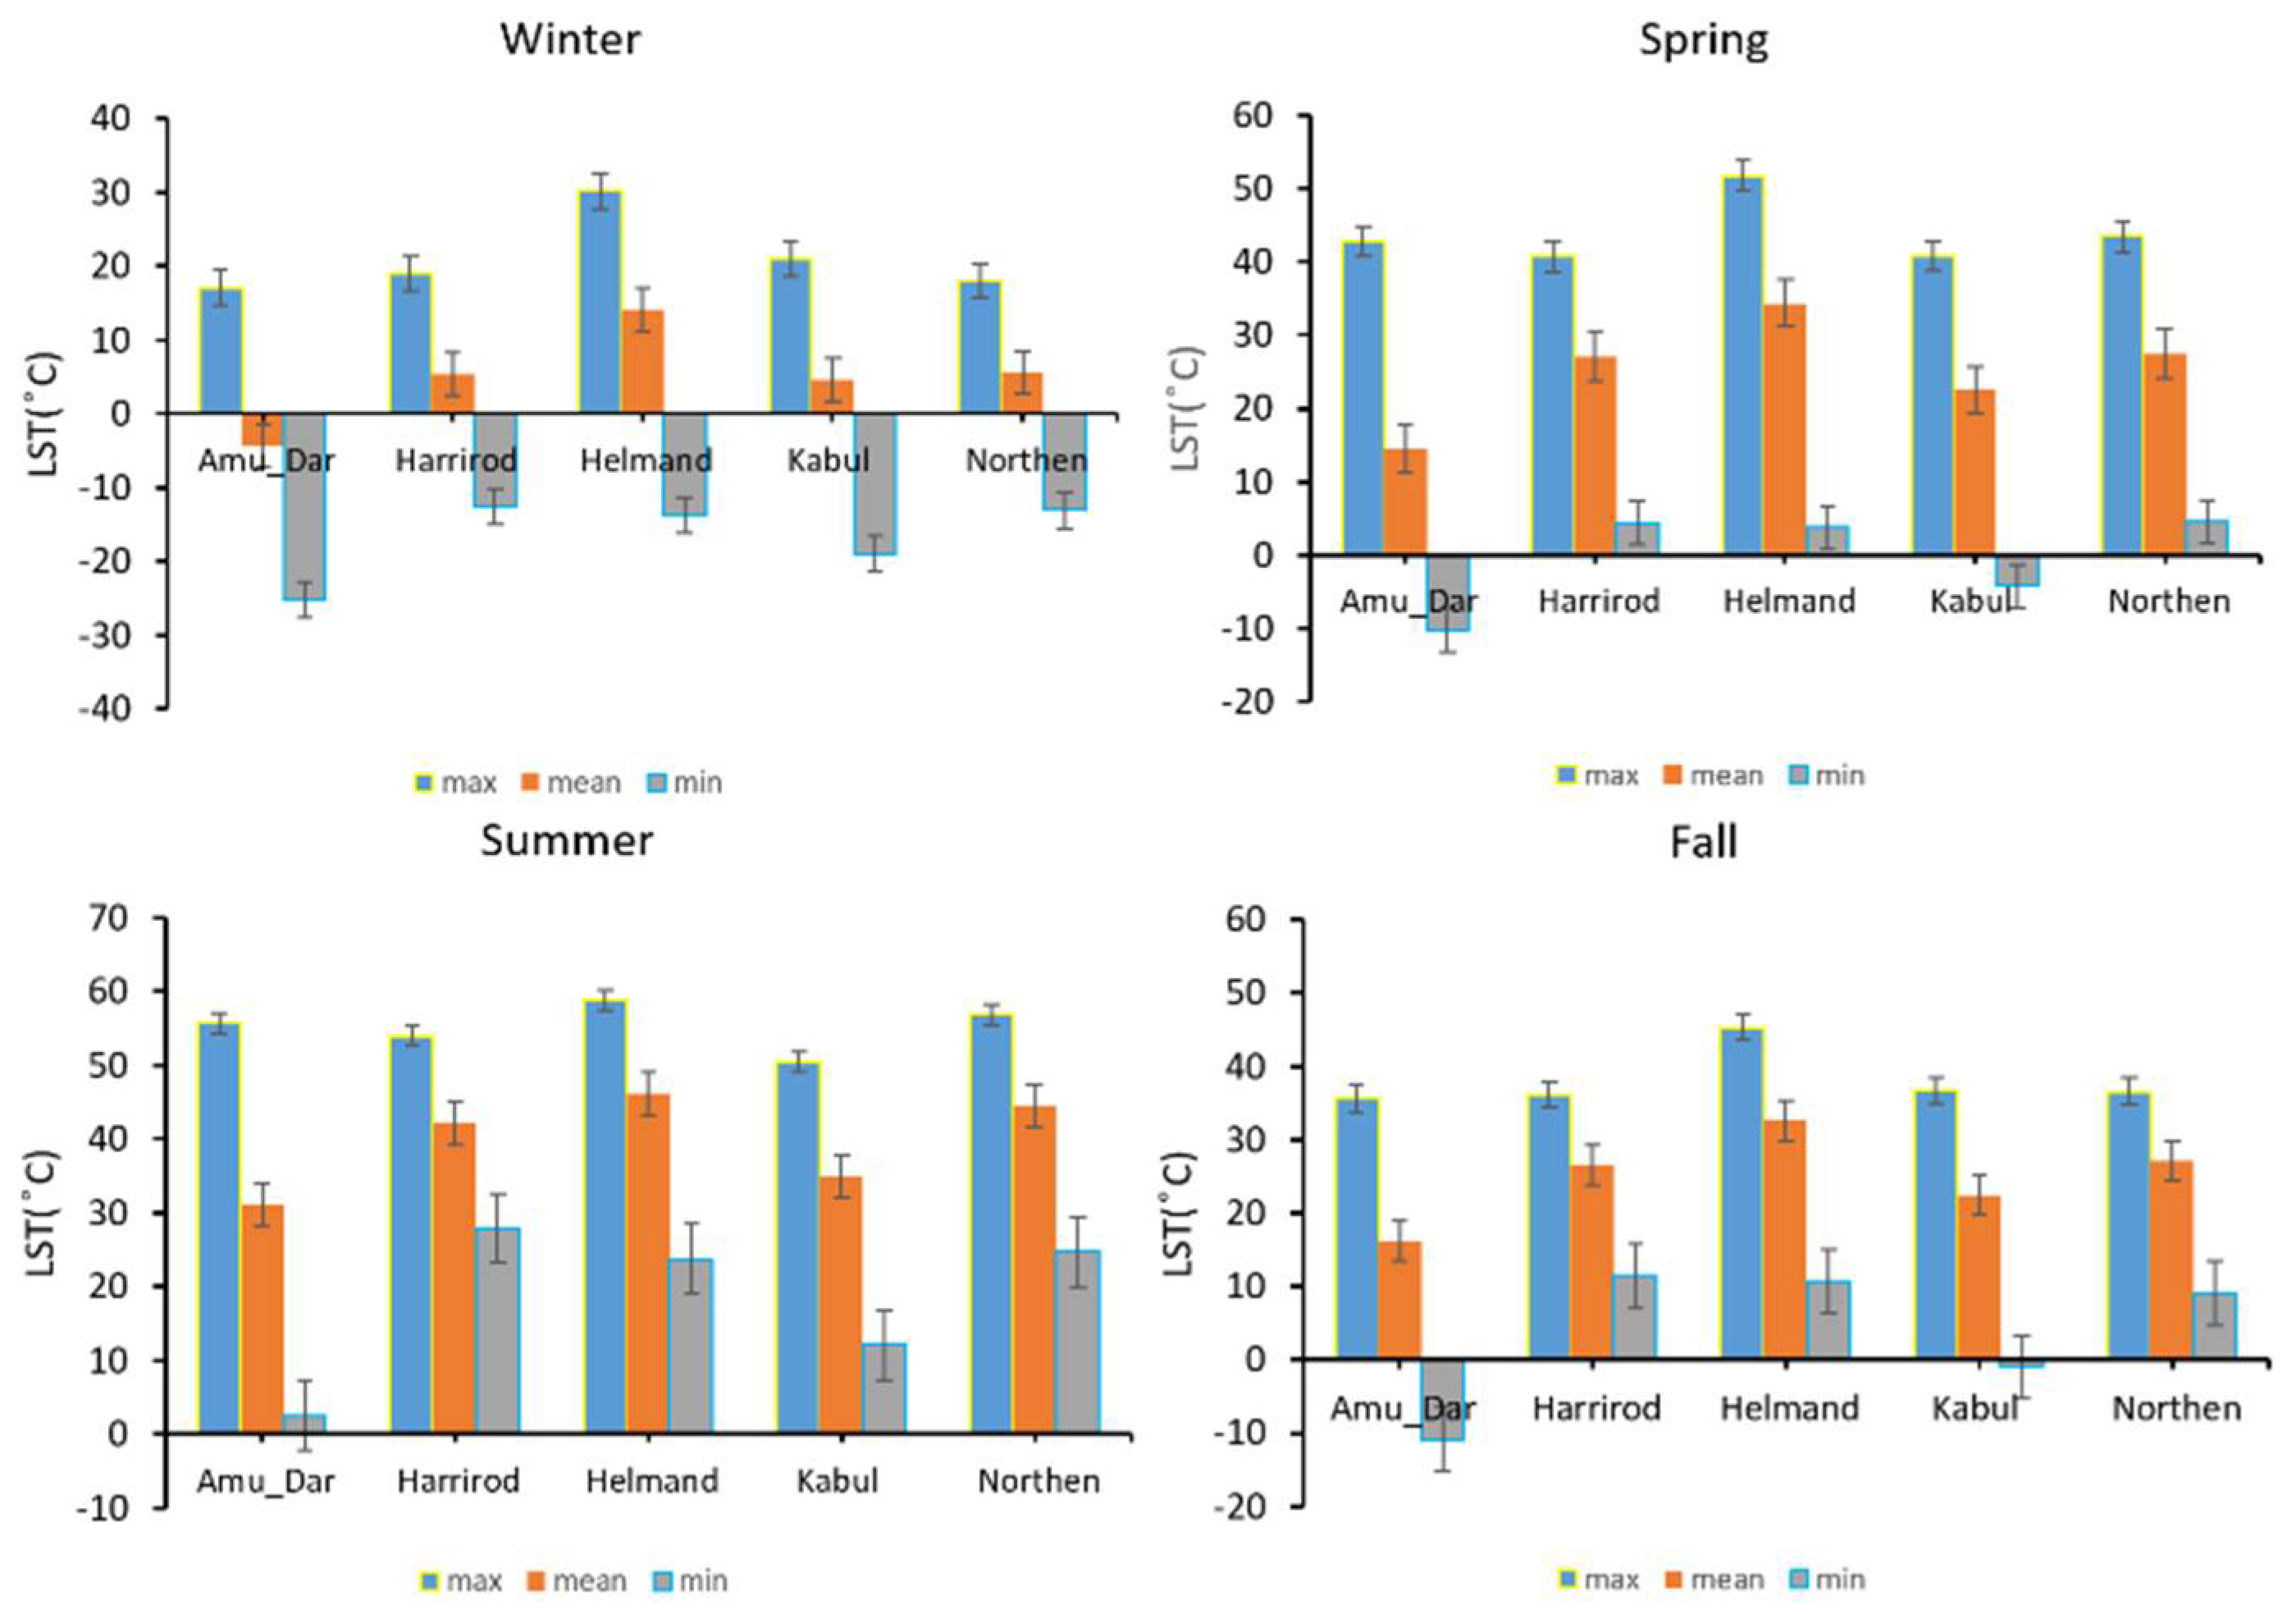
Figure 7 shows the mean, minimum, and maximum LST of Afghanistan’s basins during all seasons. In the winter, the maximum LST of 30.14 °C (±4.06) was observed in the HRB, and the minimum LST was equal to −25°C (±2.9) in the ADB. In the spring, the maximum LST of HRB was 51.75 °C (±3.52), and the highest mean LST of HRB was 34.3 °C (±4.01), while the minimum LST was observed in the ADB (–10.5 ± 4.42 °C) and KRB (−4.17 ± 4.27 °C). In the summer, the maximum LST was 58.7°C (±2.06) in the HRB, and 56.8°C (±1.9) in the NB, and the minimum LST was 2.58°C (±6.99) in the ADB. The highest mean LST of HRB was 46.2°C (±2.88). During the fall, the highest mean LST was 32.55 °C (±3.39) in HRB.
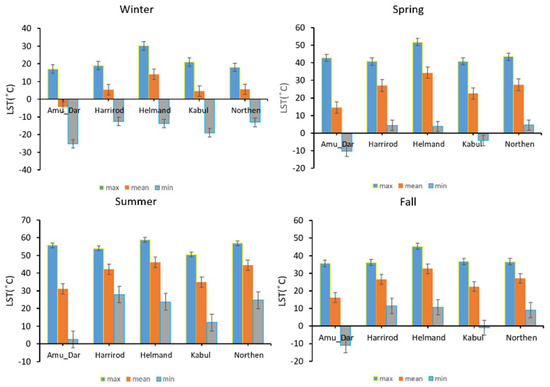
Figure 7.
The maximum, minimum, and mean seasonal LST of Afghanistan’s basins in the period 2000–2021.
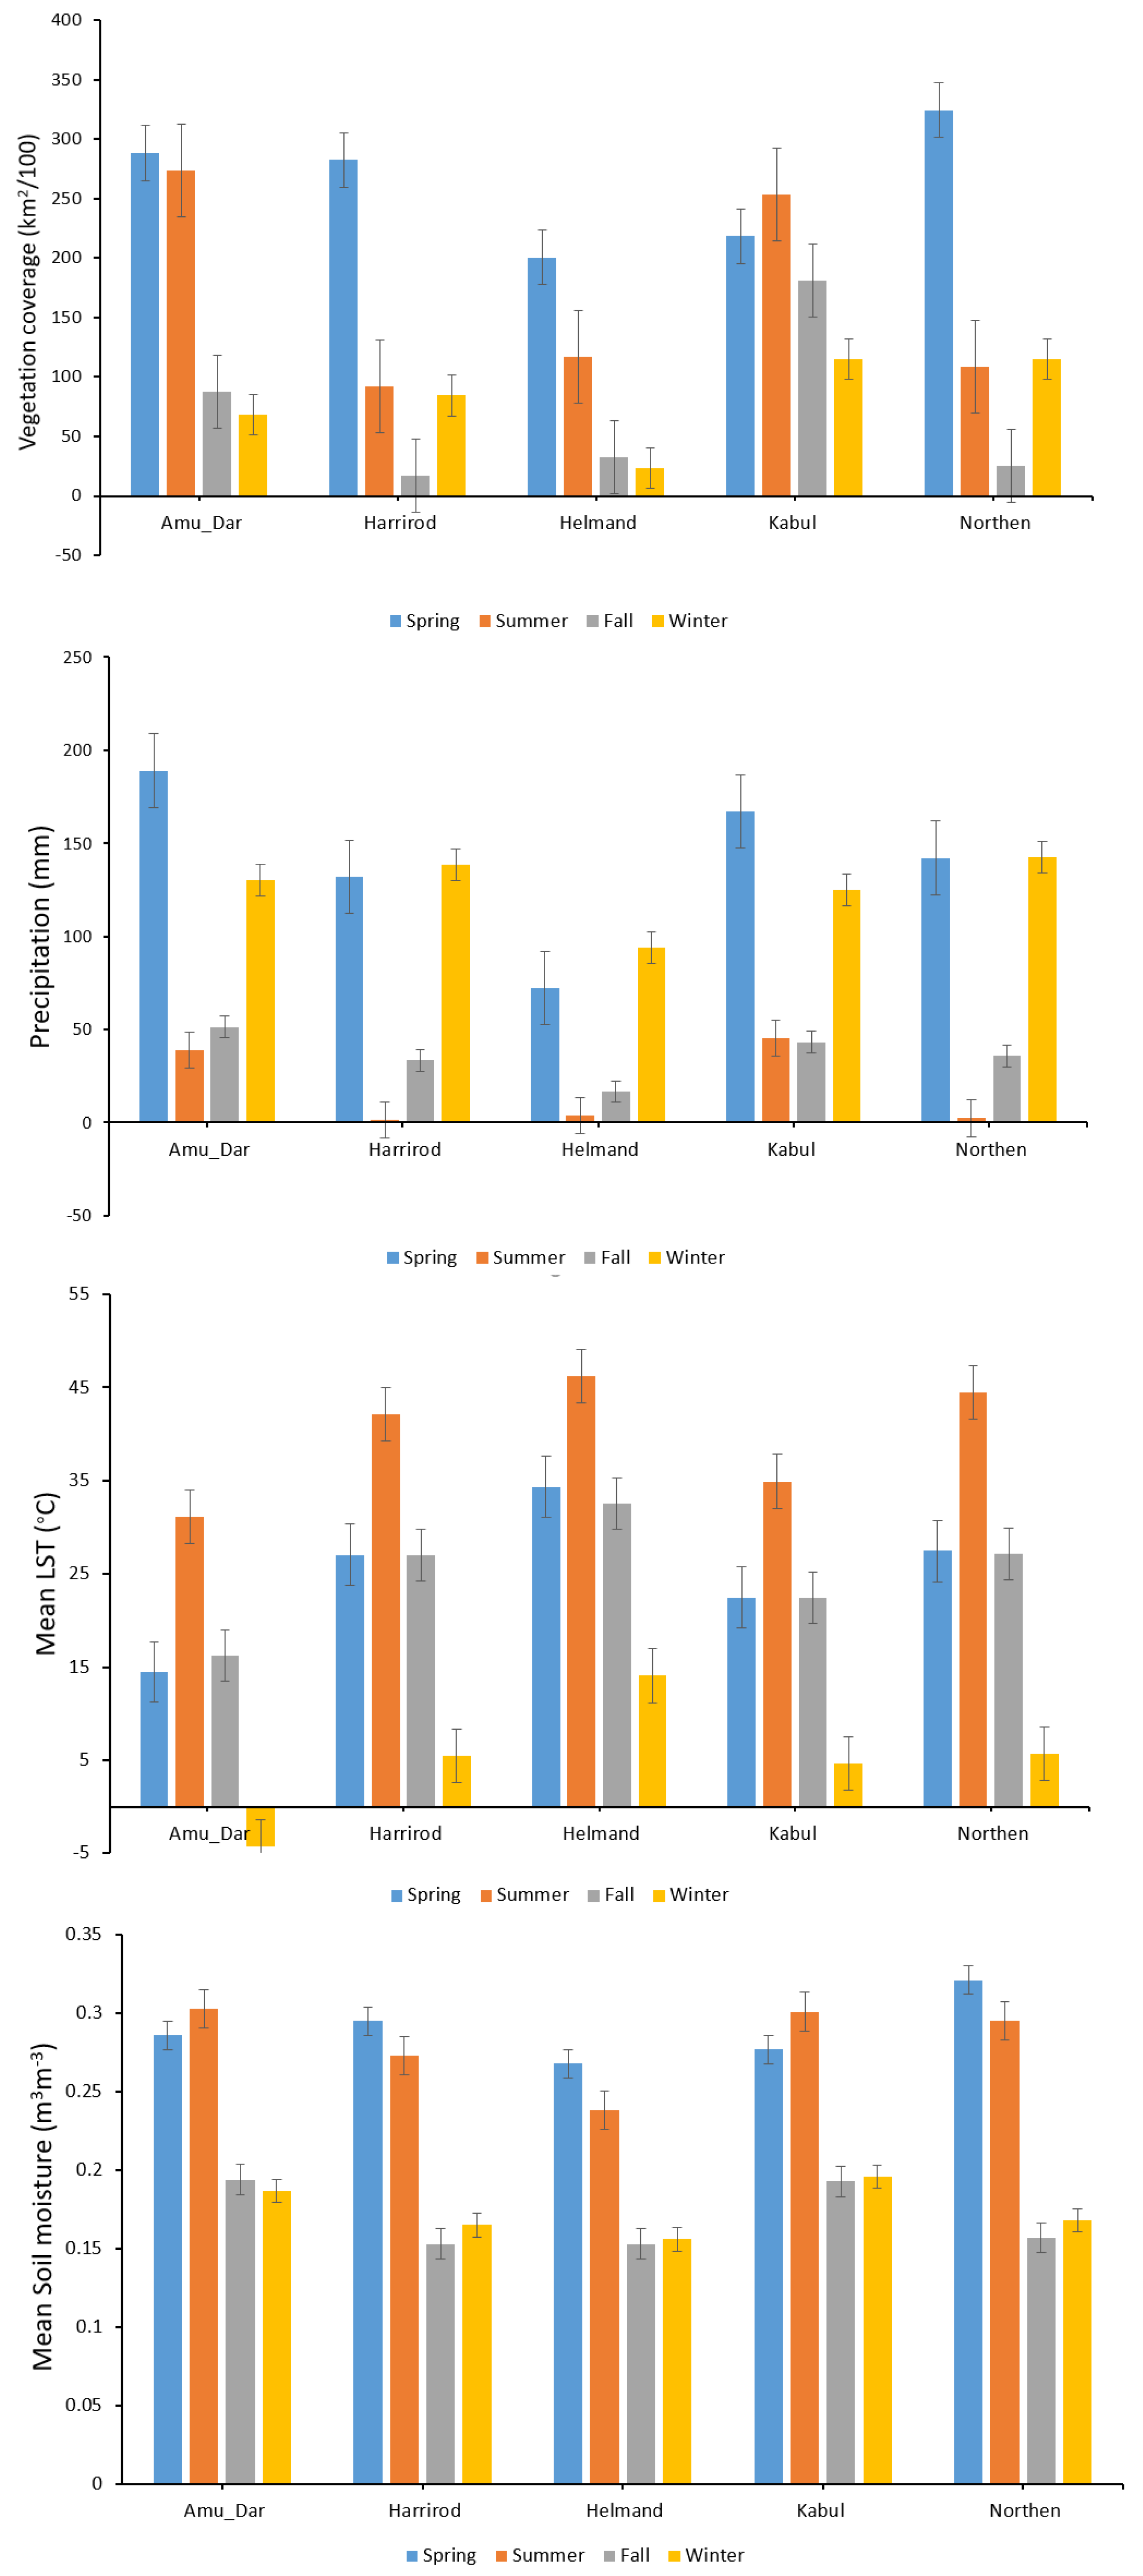
Figure 8 shows the seasonal variations of LST, precipitation, vegetation coverage, and soil moisture in Afghanistan’s basins. In the summer, being the hottest season in Afghanistan, all basins had high LST. The HRB, NB, and HMB were the warmest basins, with the LSTs equal to 46.14 (±2.8), 44.5 (±2.8), and 42.1 °C (±2.7), respectively, and ADB and KRB were the coldest basins, with LST’s equal to 31 (±3.0), and 34.9 °C (±2.9), respectively. In spring, HRB and NB had higher LSTs; however, during the fall, they had low LSTs. In the fall, KBR, HMR, and ADB had high LSTs, but in the spring, they had low LSTs. Winter was the coldest season in Afghanistan, and during this season, the warmest basin was HRB, and the coldest basin was ADB, with LSTs in these basins equal to 14 (±4.0) and −4.25 °C (±3.1), respectively. Precipitation was the highest in Afghanistan in the spring. In this season, ADB and KRD had the highest precipitation sums, equal to 188 (±21.6) and 167 (±20.4) mm, and HRB had the lowest precipitation sum, equal to 72 (±20.5) mm. In the summer in Afghanistan, the lowest precipitation sums were observed, except for KRB (with the lowest precipitation sum during the fall). In this season, the highest precipitation sum was observed in KRB and ADB, with 45 (±12) and 38.7 (±11.2) mm, respectively, whereas the lowest was in HMB, NB, and HRB, with 1.6 (±7.5), 2.3 (±7.8) and 3.4 (±7.6) mm, respectively. Such precipitation sum values were indicators of drought conditions occurring in Afghanistan in the summer. The highest soil moisture values were observed during spring in ADB, HMB, and NB (0.286 ± 0.009, 0.29 ± 0.0075, and 0.32 ± 0.014 m3 m-3, respectively), and the lowest in the spring and fall in the same basins. In ADR and KRB basins, the highest soil moisture value occurred in the summer (0.303 ± 0.009 and 0.301 ± 0.008 m3 m-3), and the lowest was recorded in the winter and the fall. From the analysis of the seasonal vegetation coverage variability, the fall and winter seasons were the least green seasons in Afghanistan, with the HMB and NB having the least vegetation in the fall season and KRB, HRB, and ADB having the least vegetation during the winter season.
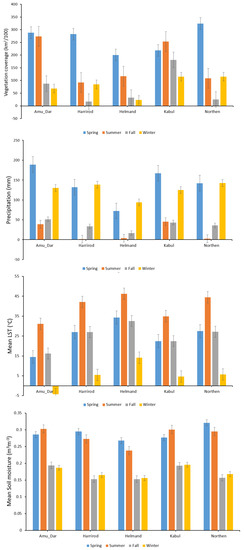
Figure 8.
The seasonal averages of LST, precipitation, soil moisture, and vegetation coverage in Afghanistan’s basins in the period 2000–2021.
3.2. Annual Variations of Precipitation and NDVI
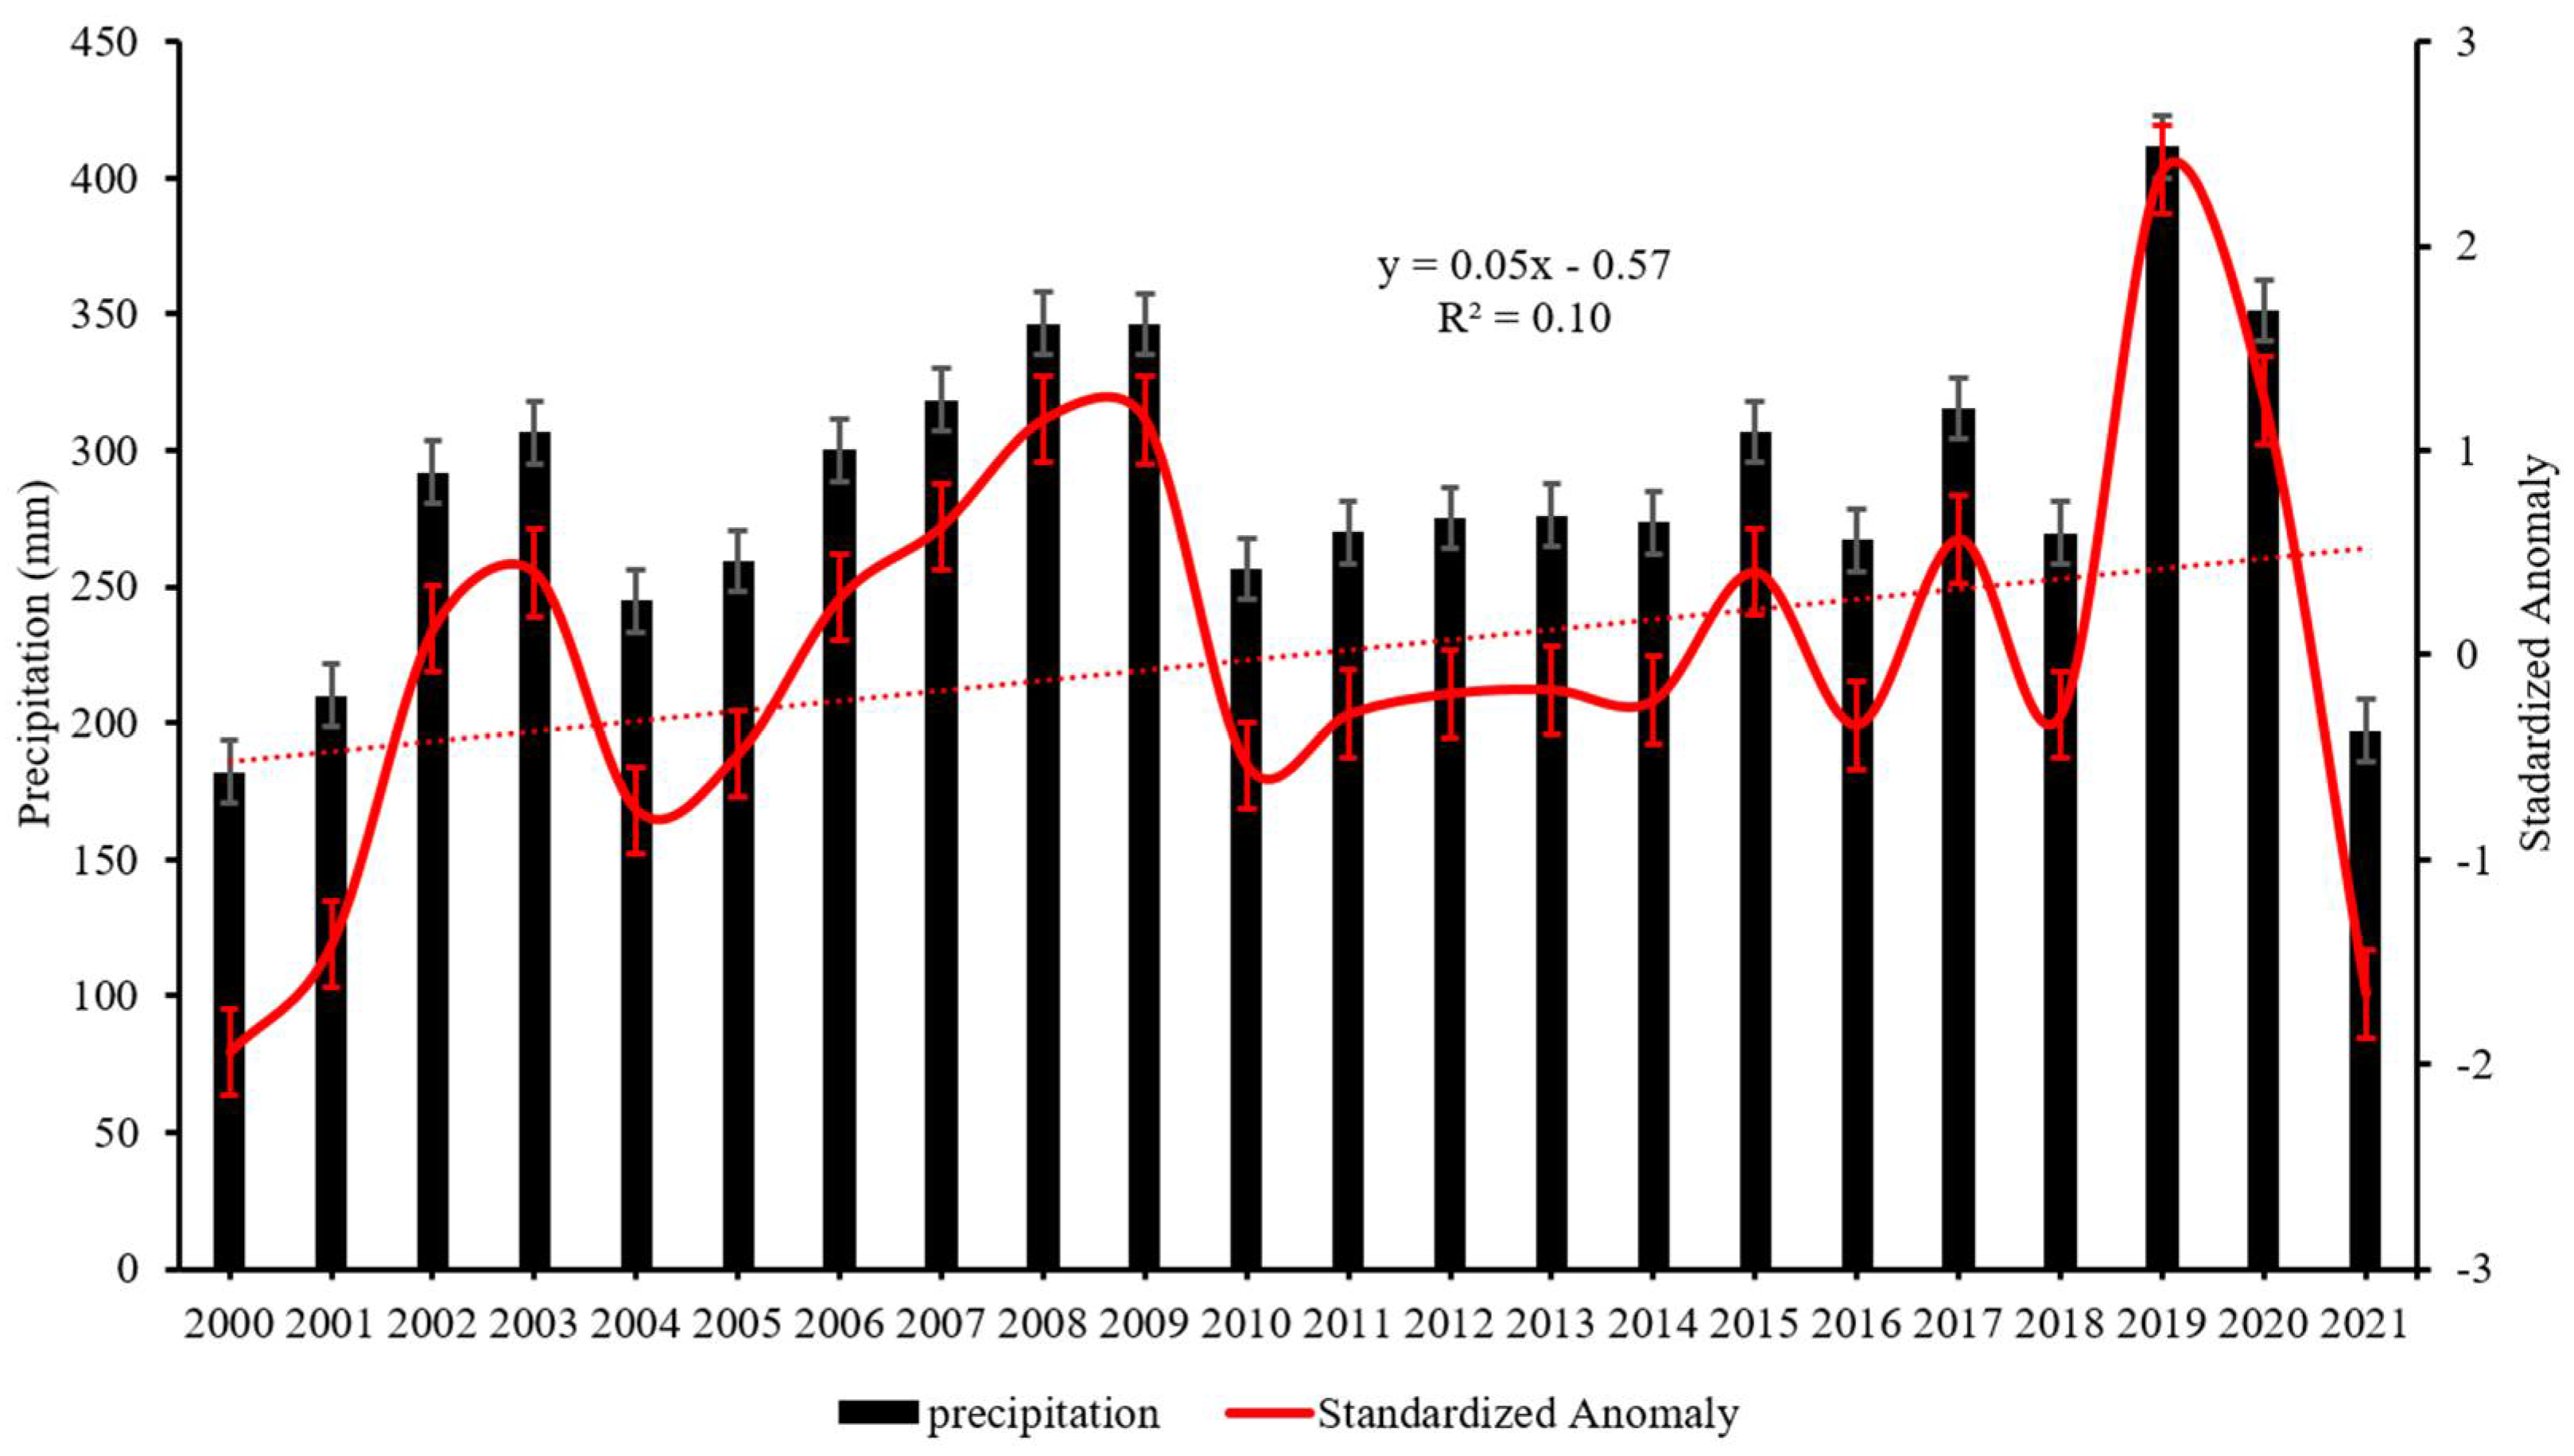
Figure 9 shows the changes in the mean annual precipitation in the study area over 22 years. The trend line indicates that in the study area, the yearly precipitation sum slightly increased with subsequent years. The highest precipitation was observed for 2008, 2009, 2019, and 2020, with sums of 346.6 (±13.04), 346.4 (±13.02), 411.33 (±16.8), and 351.42 (±14) mm, respectively. The lowest precipitation sums were observed for 2000, 2001, and 2021, with sums of 182 (±22), 210 (±16), and 197 (±18.7) mm, respectively. A brief look at the LST and precipitation anomalies (Figure 4 and Figure 9) suggests that they should be negatively correlated, which indicates that the precipitation parameter was one of the factors affecting the LST.
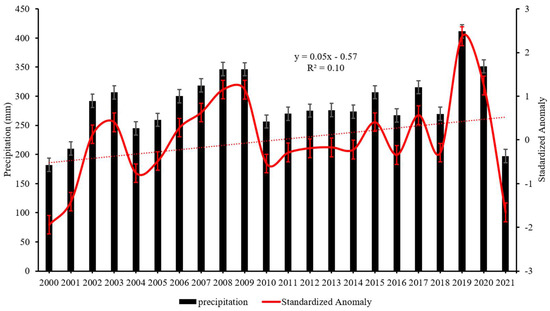
Figure 9.
Time series of yearly precipitation sums and standardized precipitation anomaly in Afghanistan in the period 2000–2021.
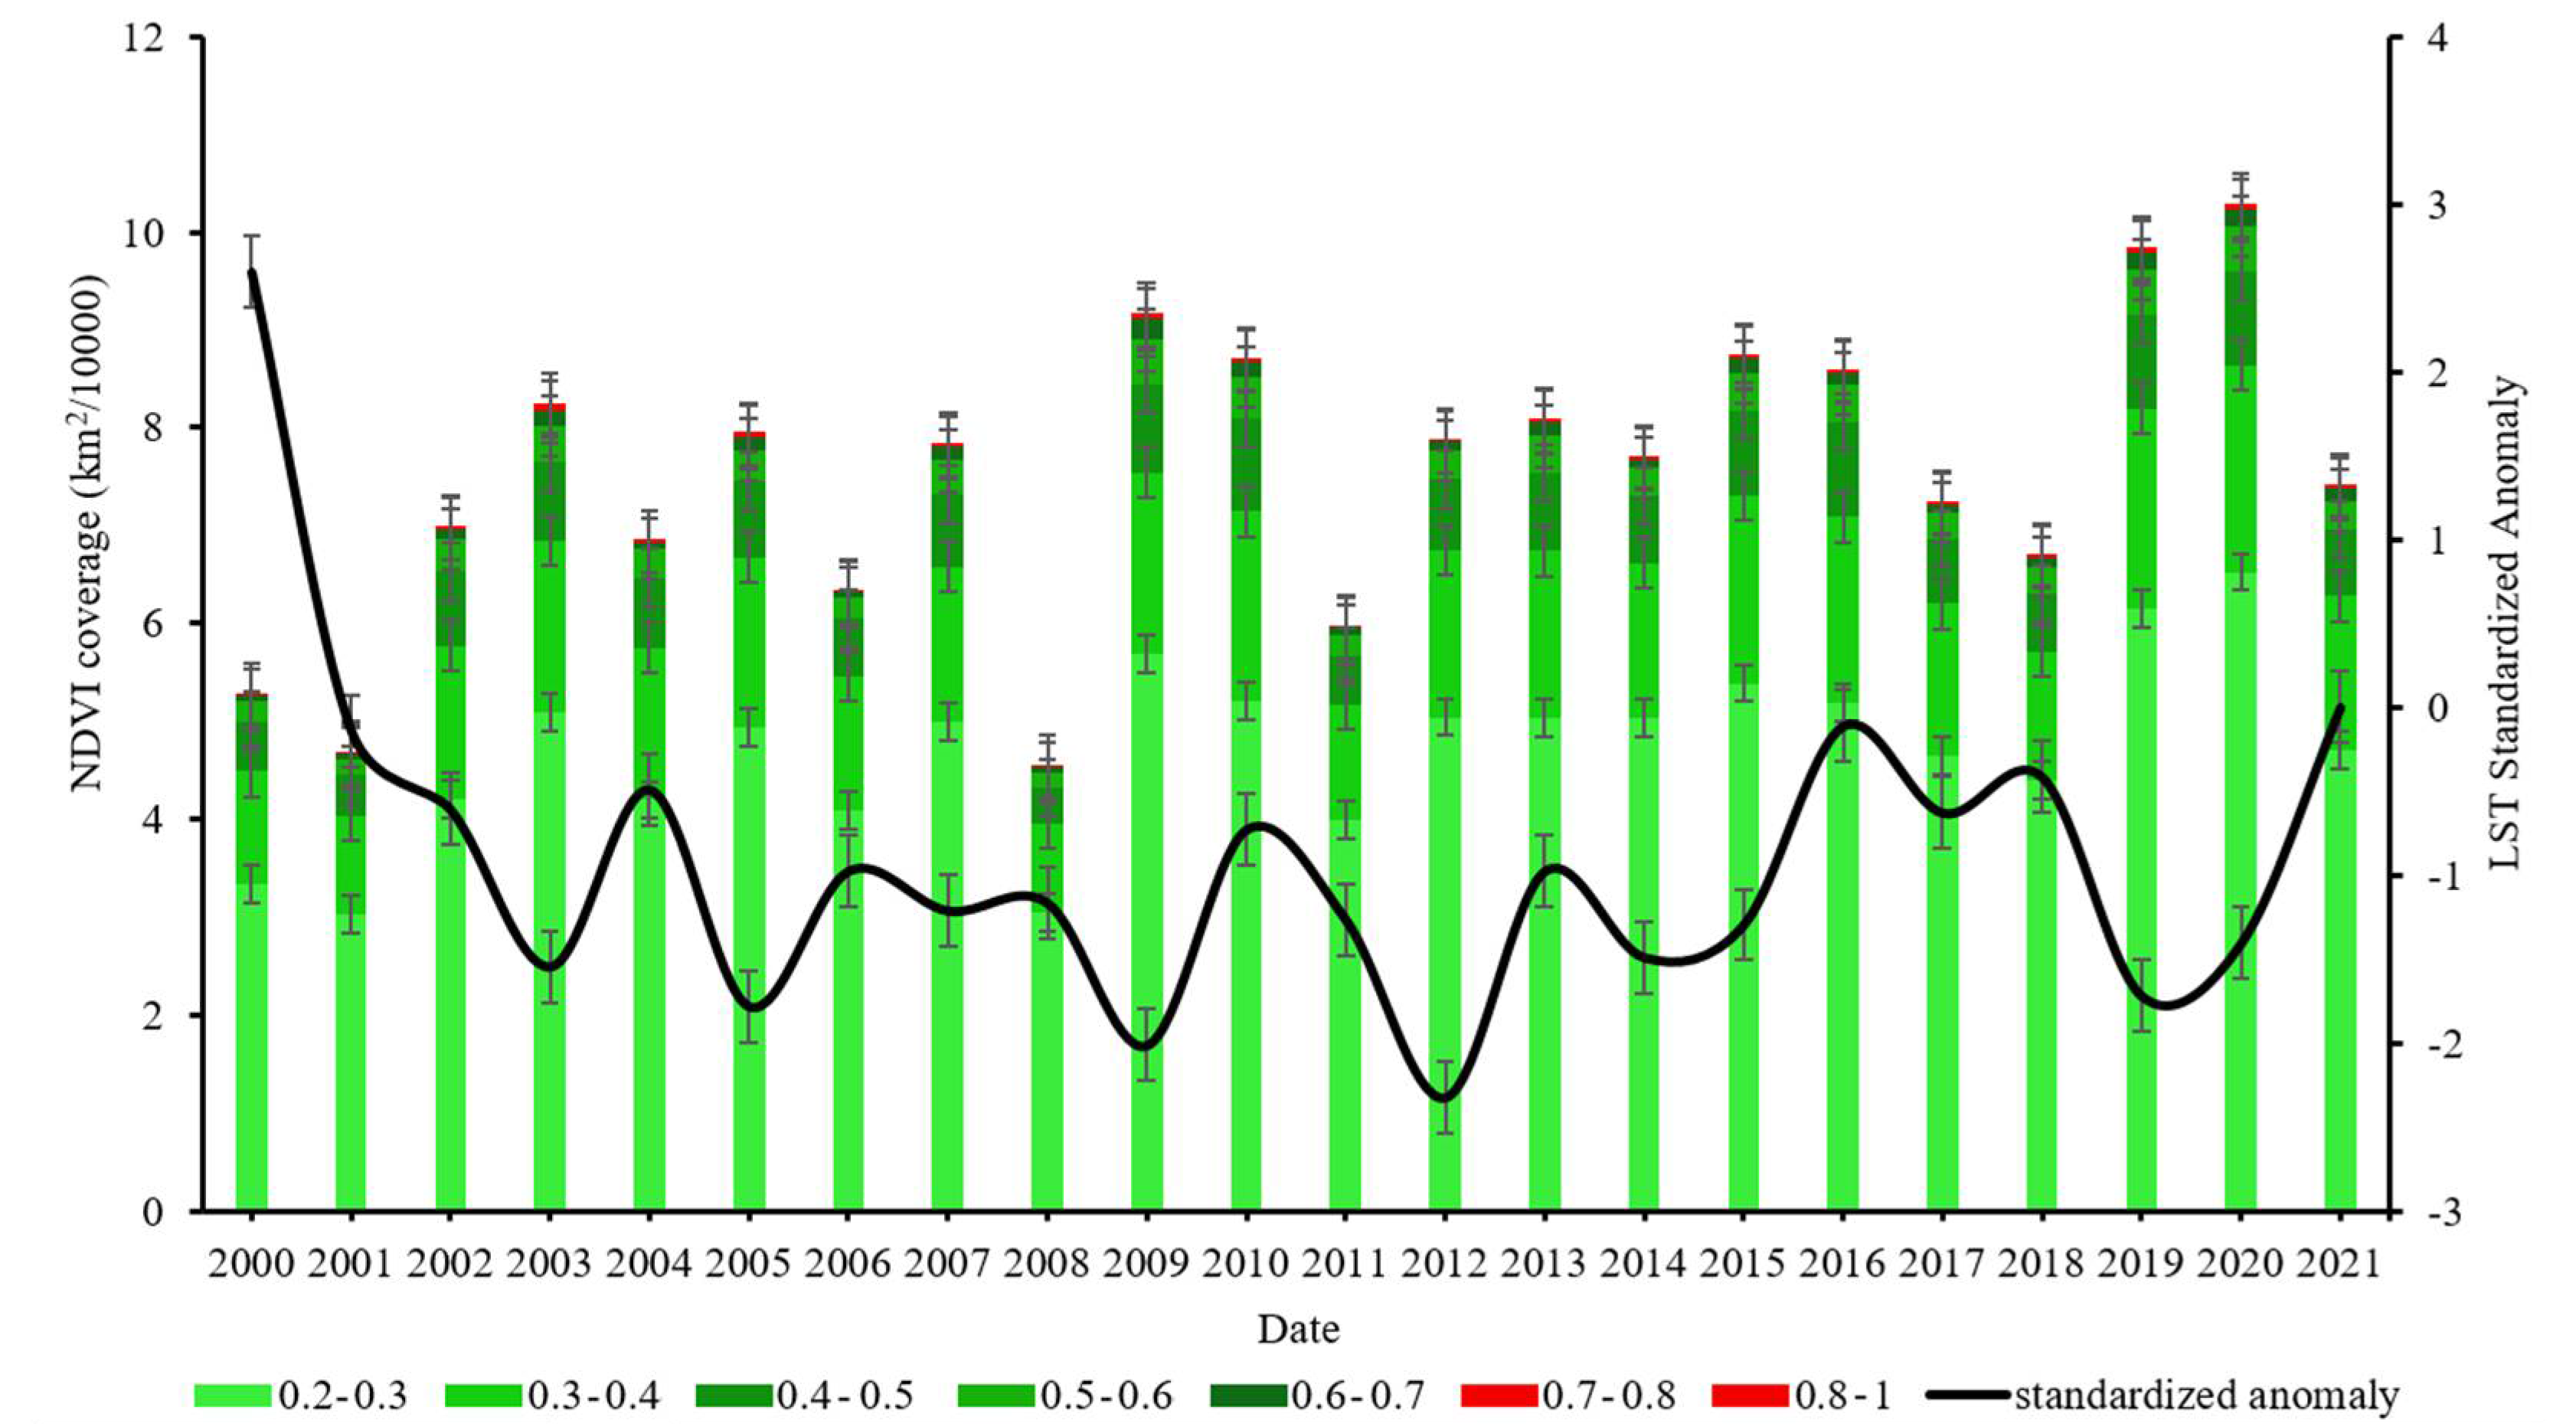
Figure 10 shows the vegetation coverage changes during the analyzed period. The years 2009, 2019, and 2020 were the greenest, with 87,011 (±2576), 98,380 (±4999), and 102,724 (±5926) km2 of the area covered by vegetation, respectively. In turn, 2000, 2001, 2008, and 2021 were the least green, with 52,731 (±4732), 46,701 (±6018), 45,422 (±6290), and 74,116 (±6173) km2 of the area covered by vegetation, respectively.

Figure 10.
The relationship between time series of yearly vegetation coverage variations and standardized LST anomaly in Afghanistan in the period 2000–2021.
3.3. Correlation of LST with Other Variables
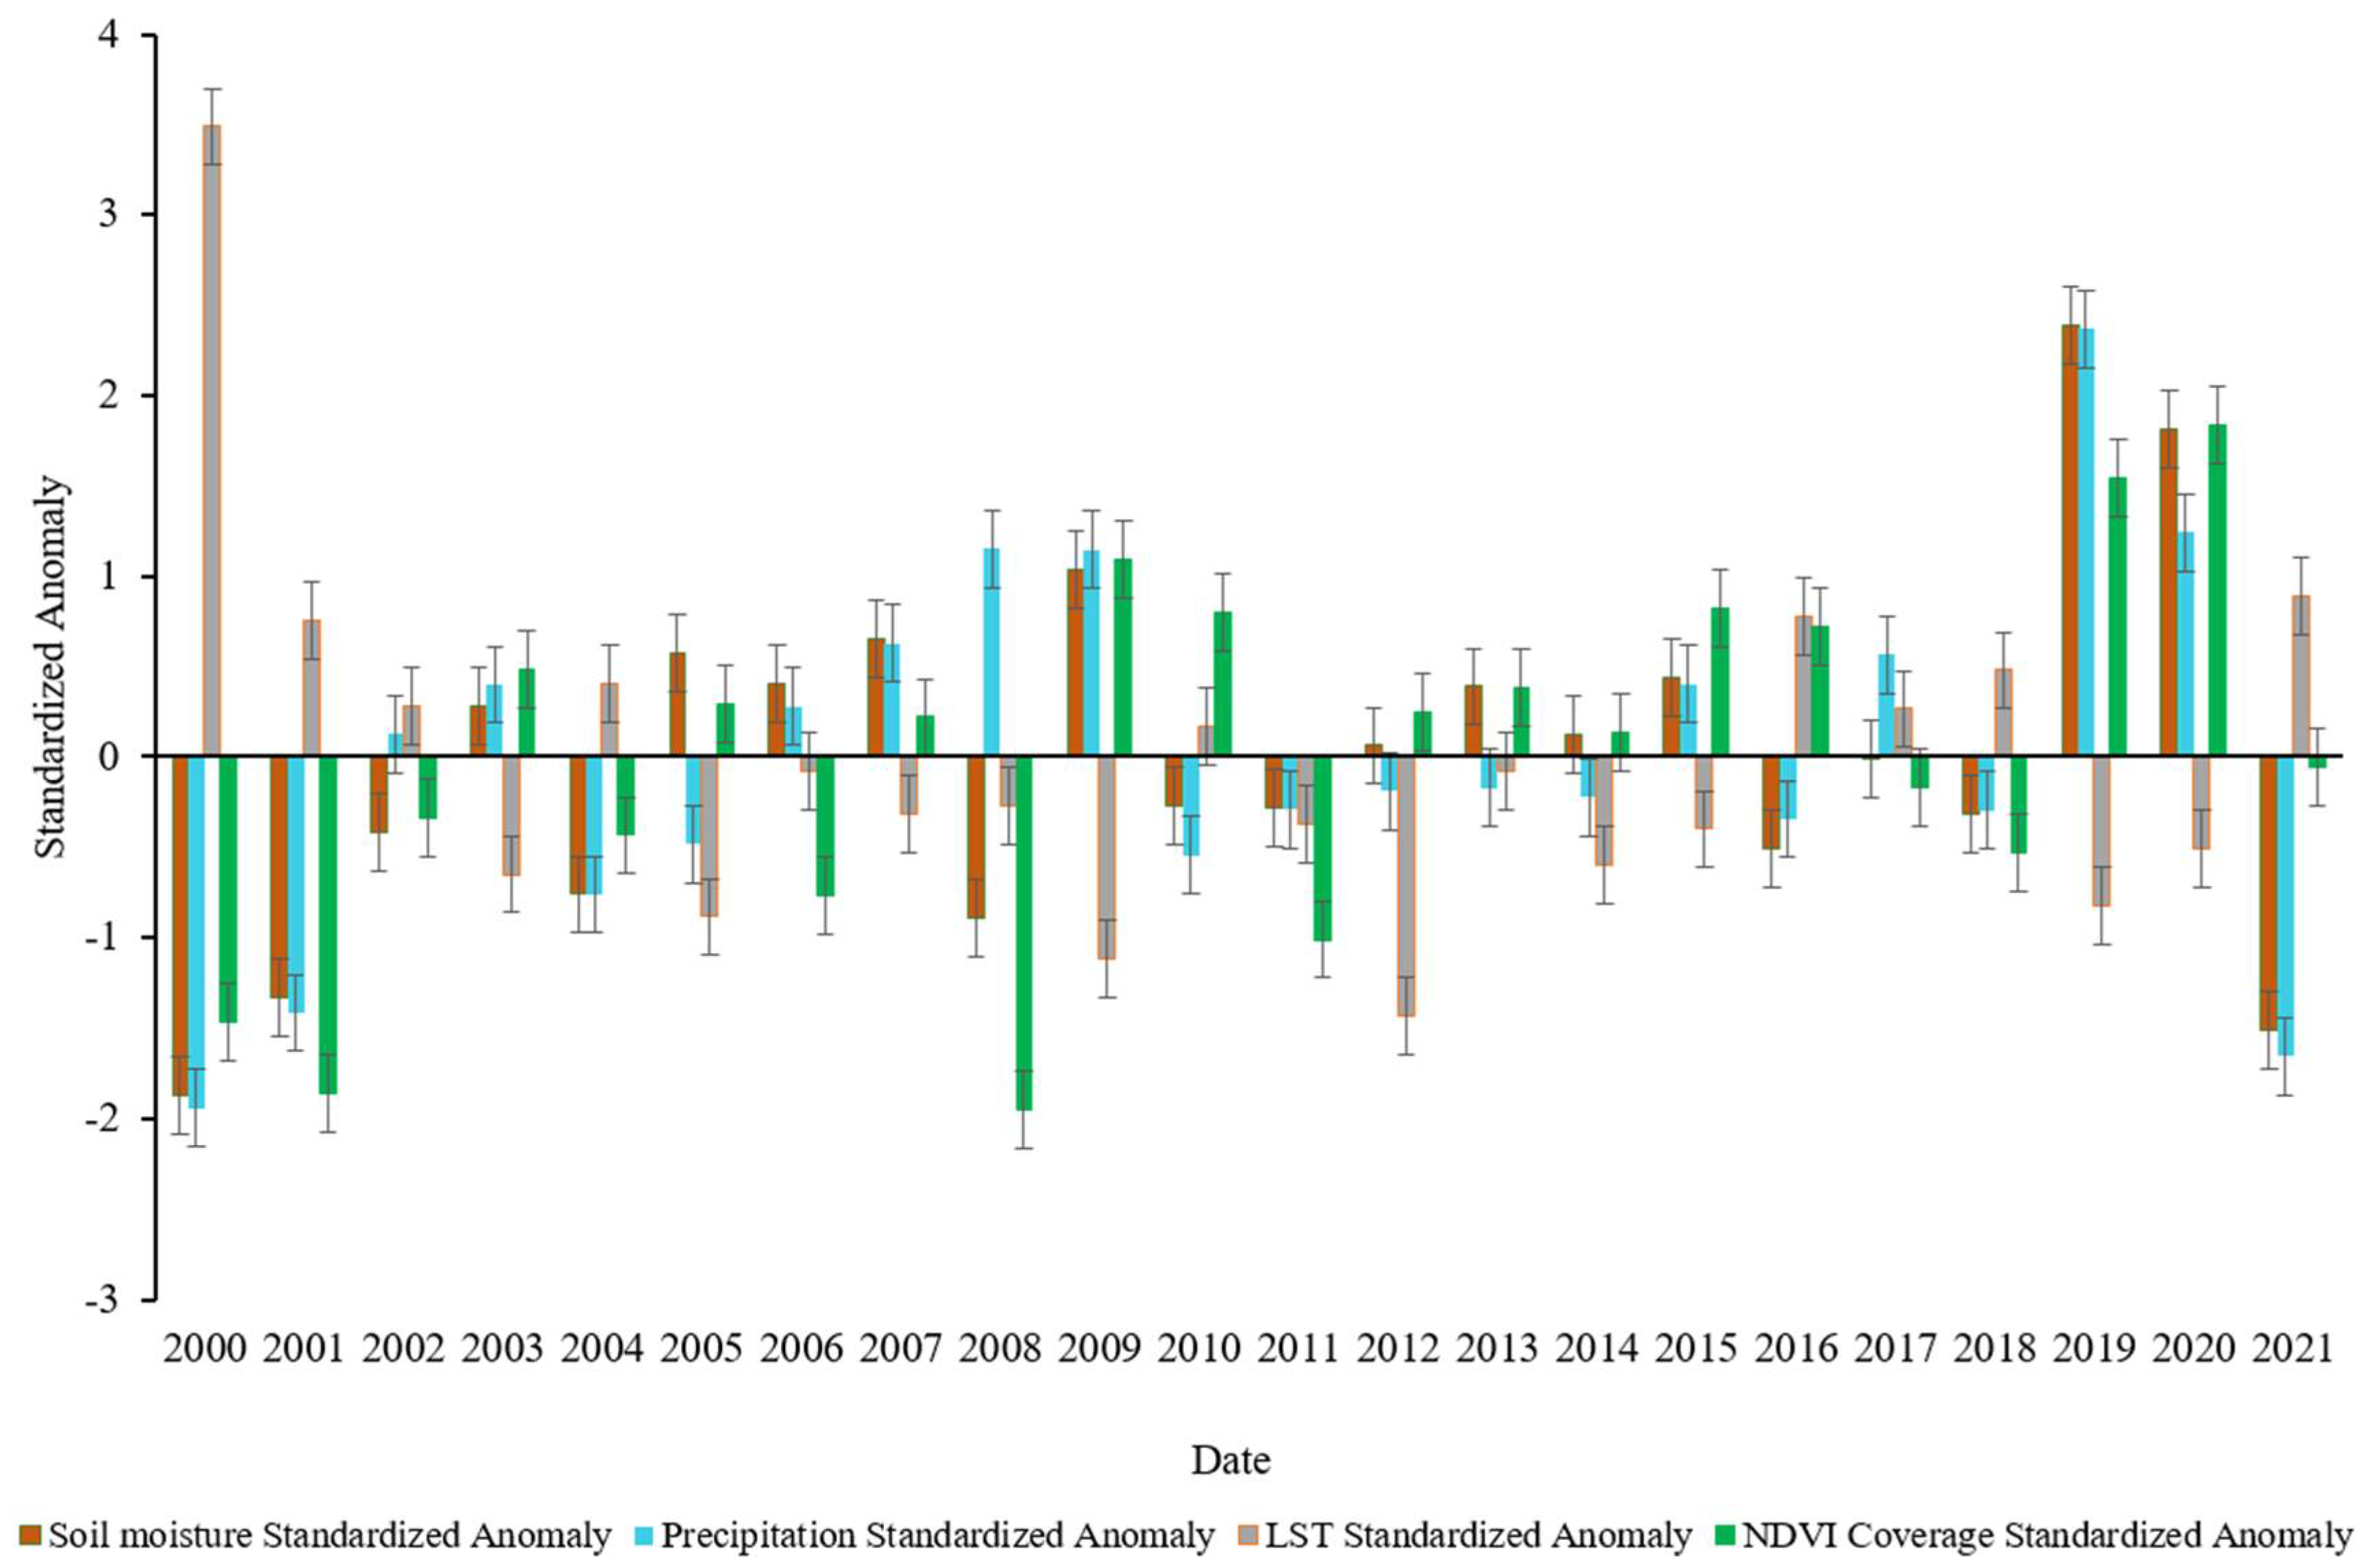
In Figure 11, the variations of annual anomalies of LST, precipitation, soil moisture, and vegetation coverage are presented. In 2000, 2001, and 2021 the highest LST and the lowest vegetation coverage, precipitation, and soil moisture were observed simultaneously, while in 2012 and 2019, the lowest LST was followed by the highest vegetation coverage, precipitation, and soil moisture.
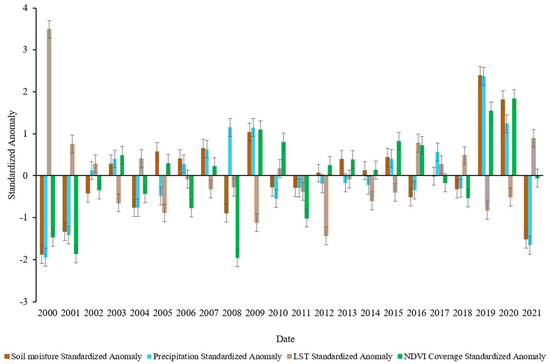
Figure 11.
Time series of the standardized annual anomalies of LST, precipitation, vegetation coverage, and soil moisture in Afghanistan in the period 2000–2021.
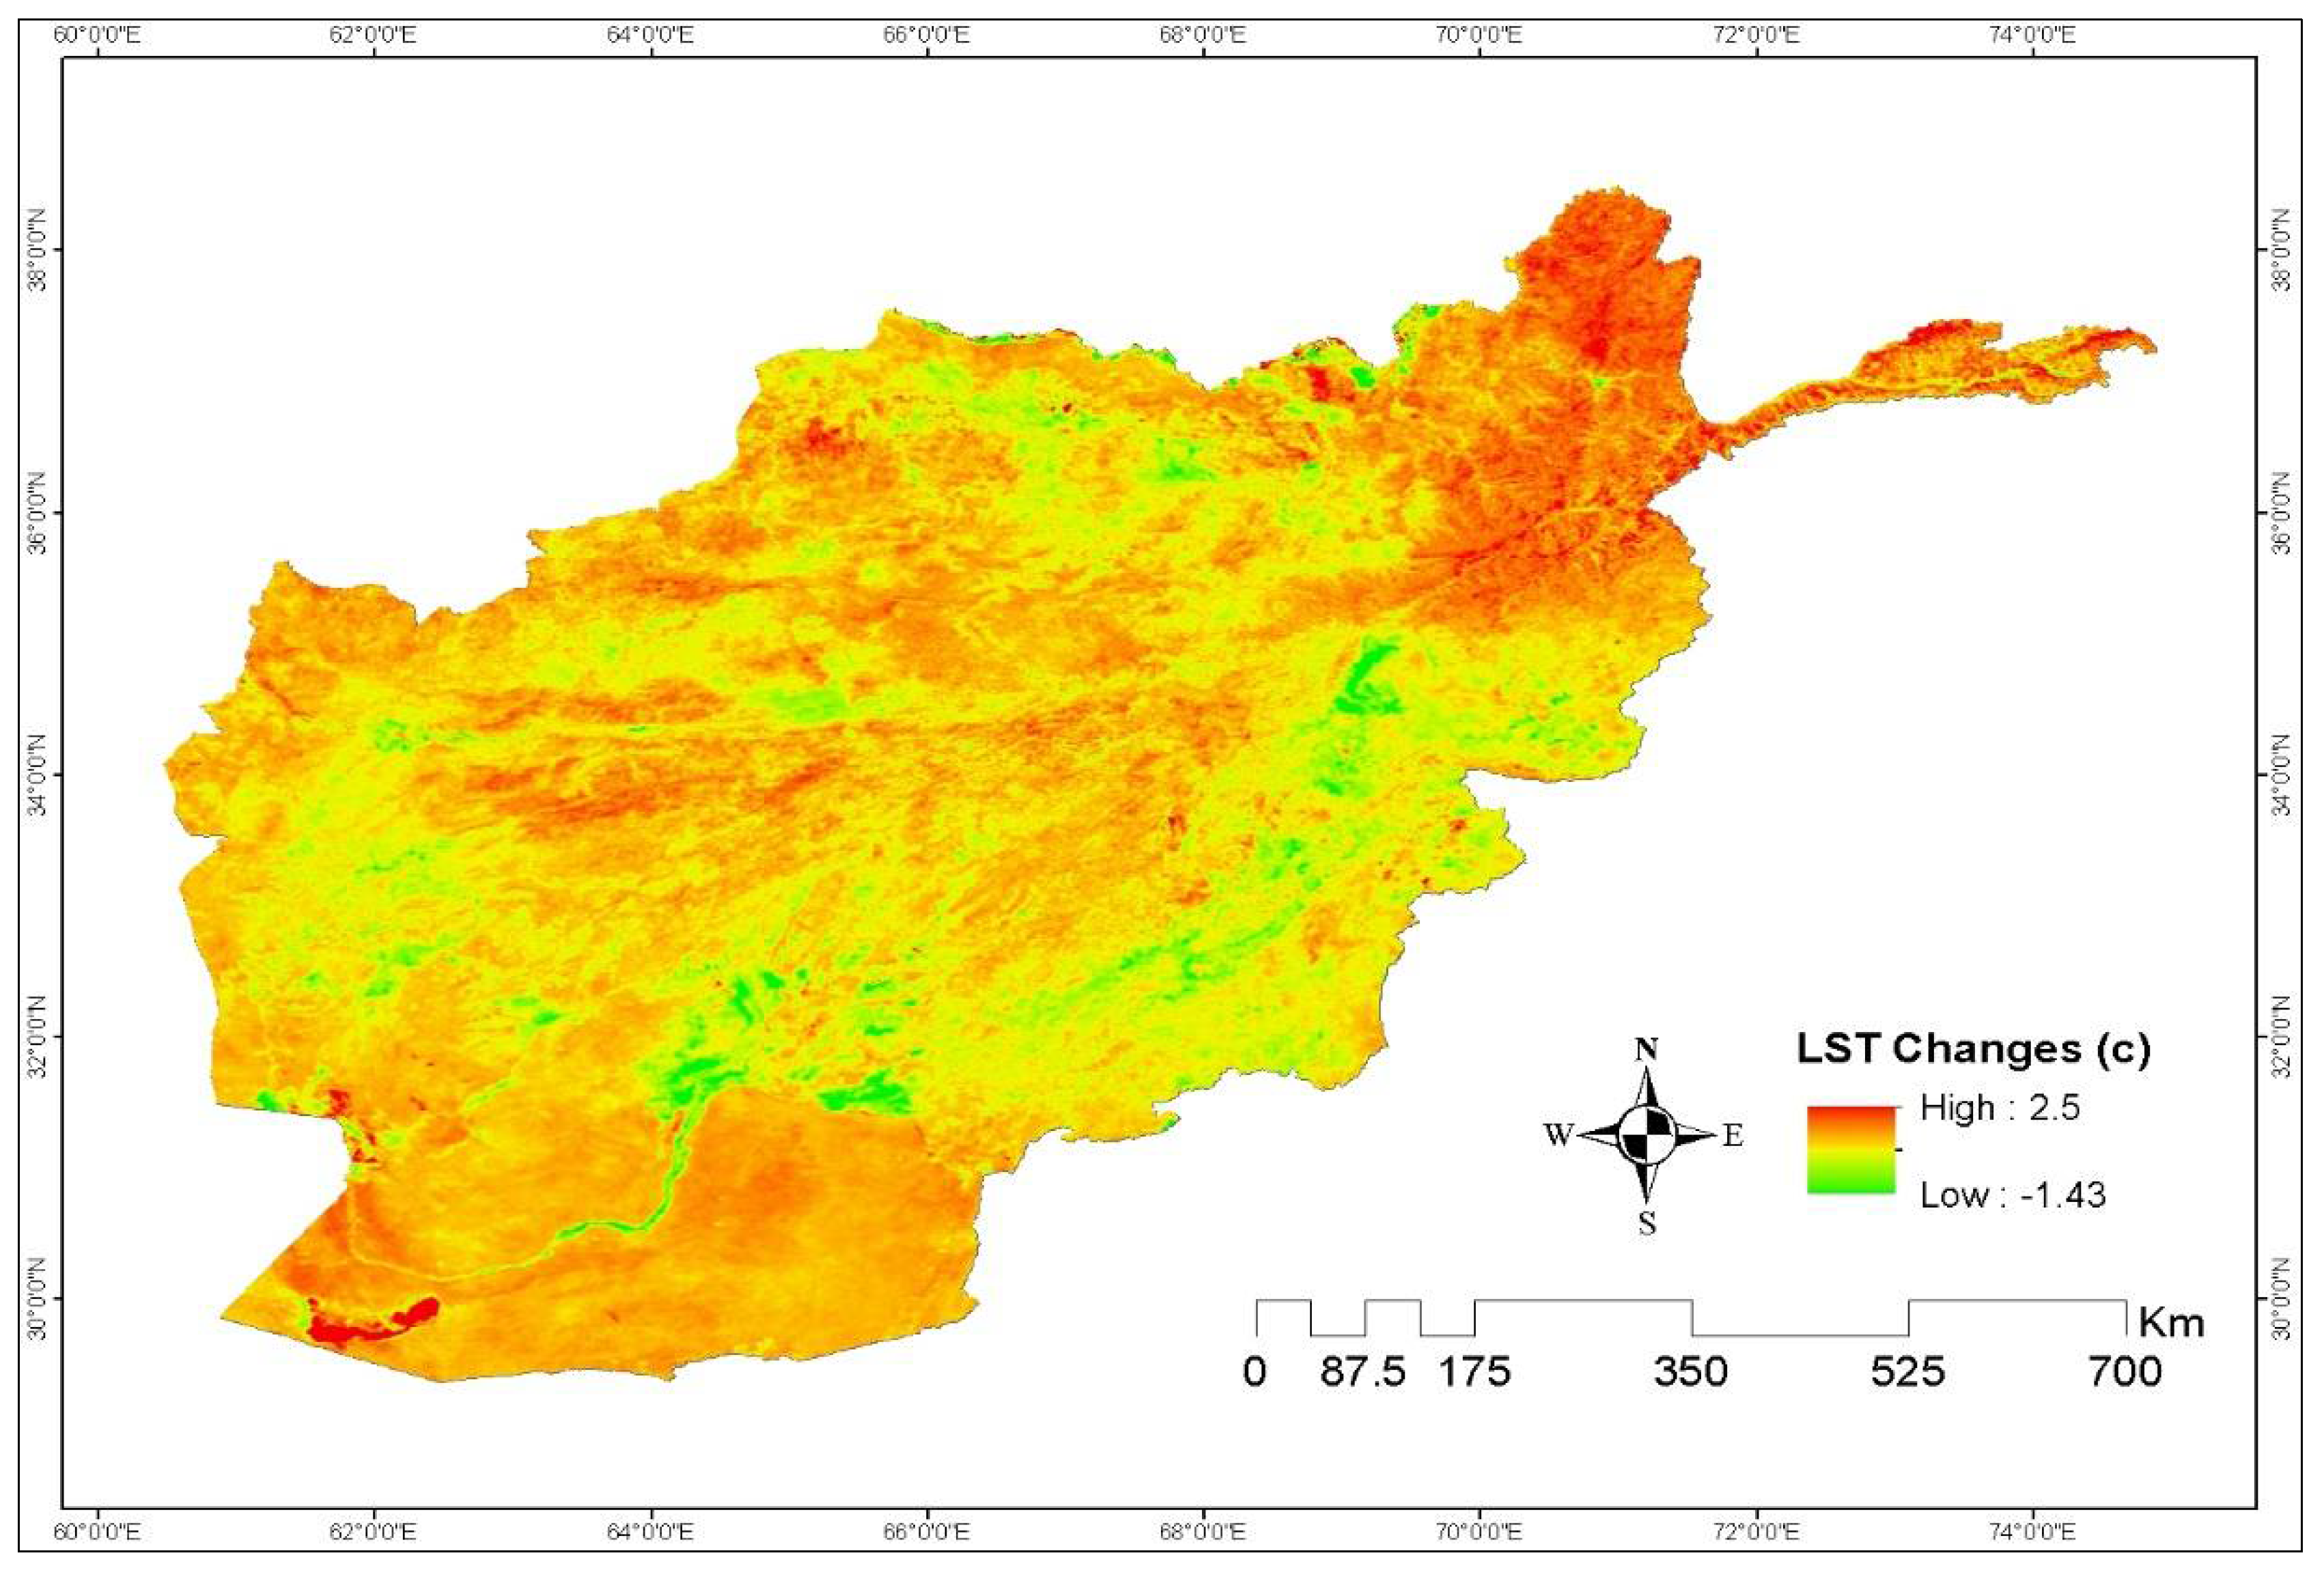
Figure 12 shows the spatiotemporal map of Afghanistan’s LST change over the period from 2000 to 2021. The map was created by calculating the linear trend for chronologically ordered values of the LST for each pixel, taking the value of the slope, and then multiplying it by the length of the study period (22 years). The red color on the map, with values greater than 0 °C, indicates that the LST of those areas has increased during the study period, whereas the green color, with values less than 0 °C, indicates that the LST of those areas has decreased in the study period. The yellow color, with values of 0 °C or close to 0 °C, indicates that the LST changed insignificantly in these areas during 2000–2021. It can be concluded that the eastern parts of Afghanistan (mostly the ADB and some areas of the NB) had an upward LST trend, whereas in the southern parts of Afghanistan (KRB and some parts of HRB) downward LST trend occurred in the study period.

Figure 12.
The map of temporal LST changes in Afghanistan in the study period.
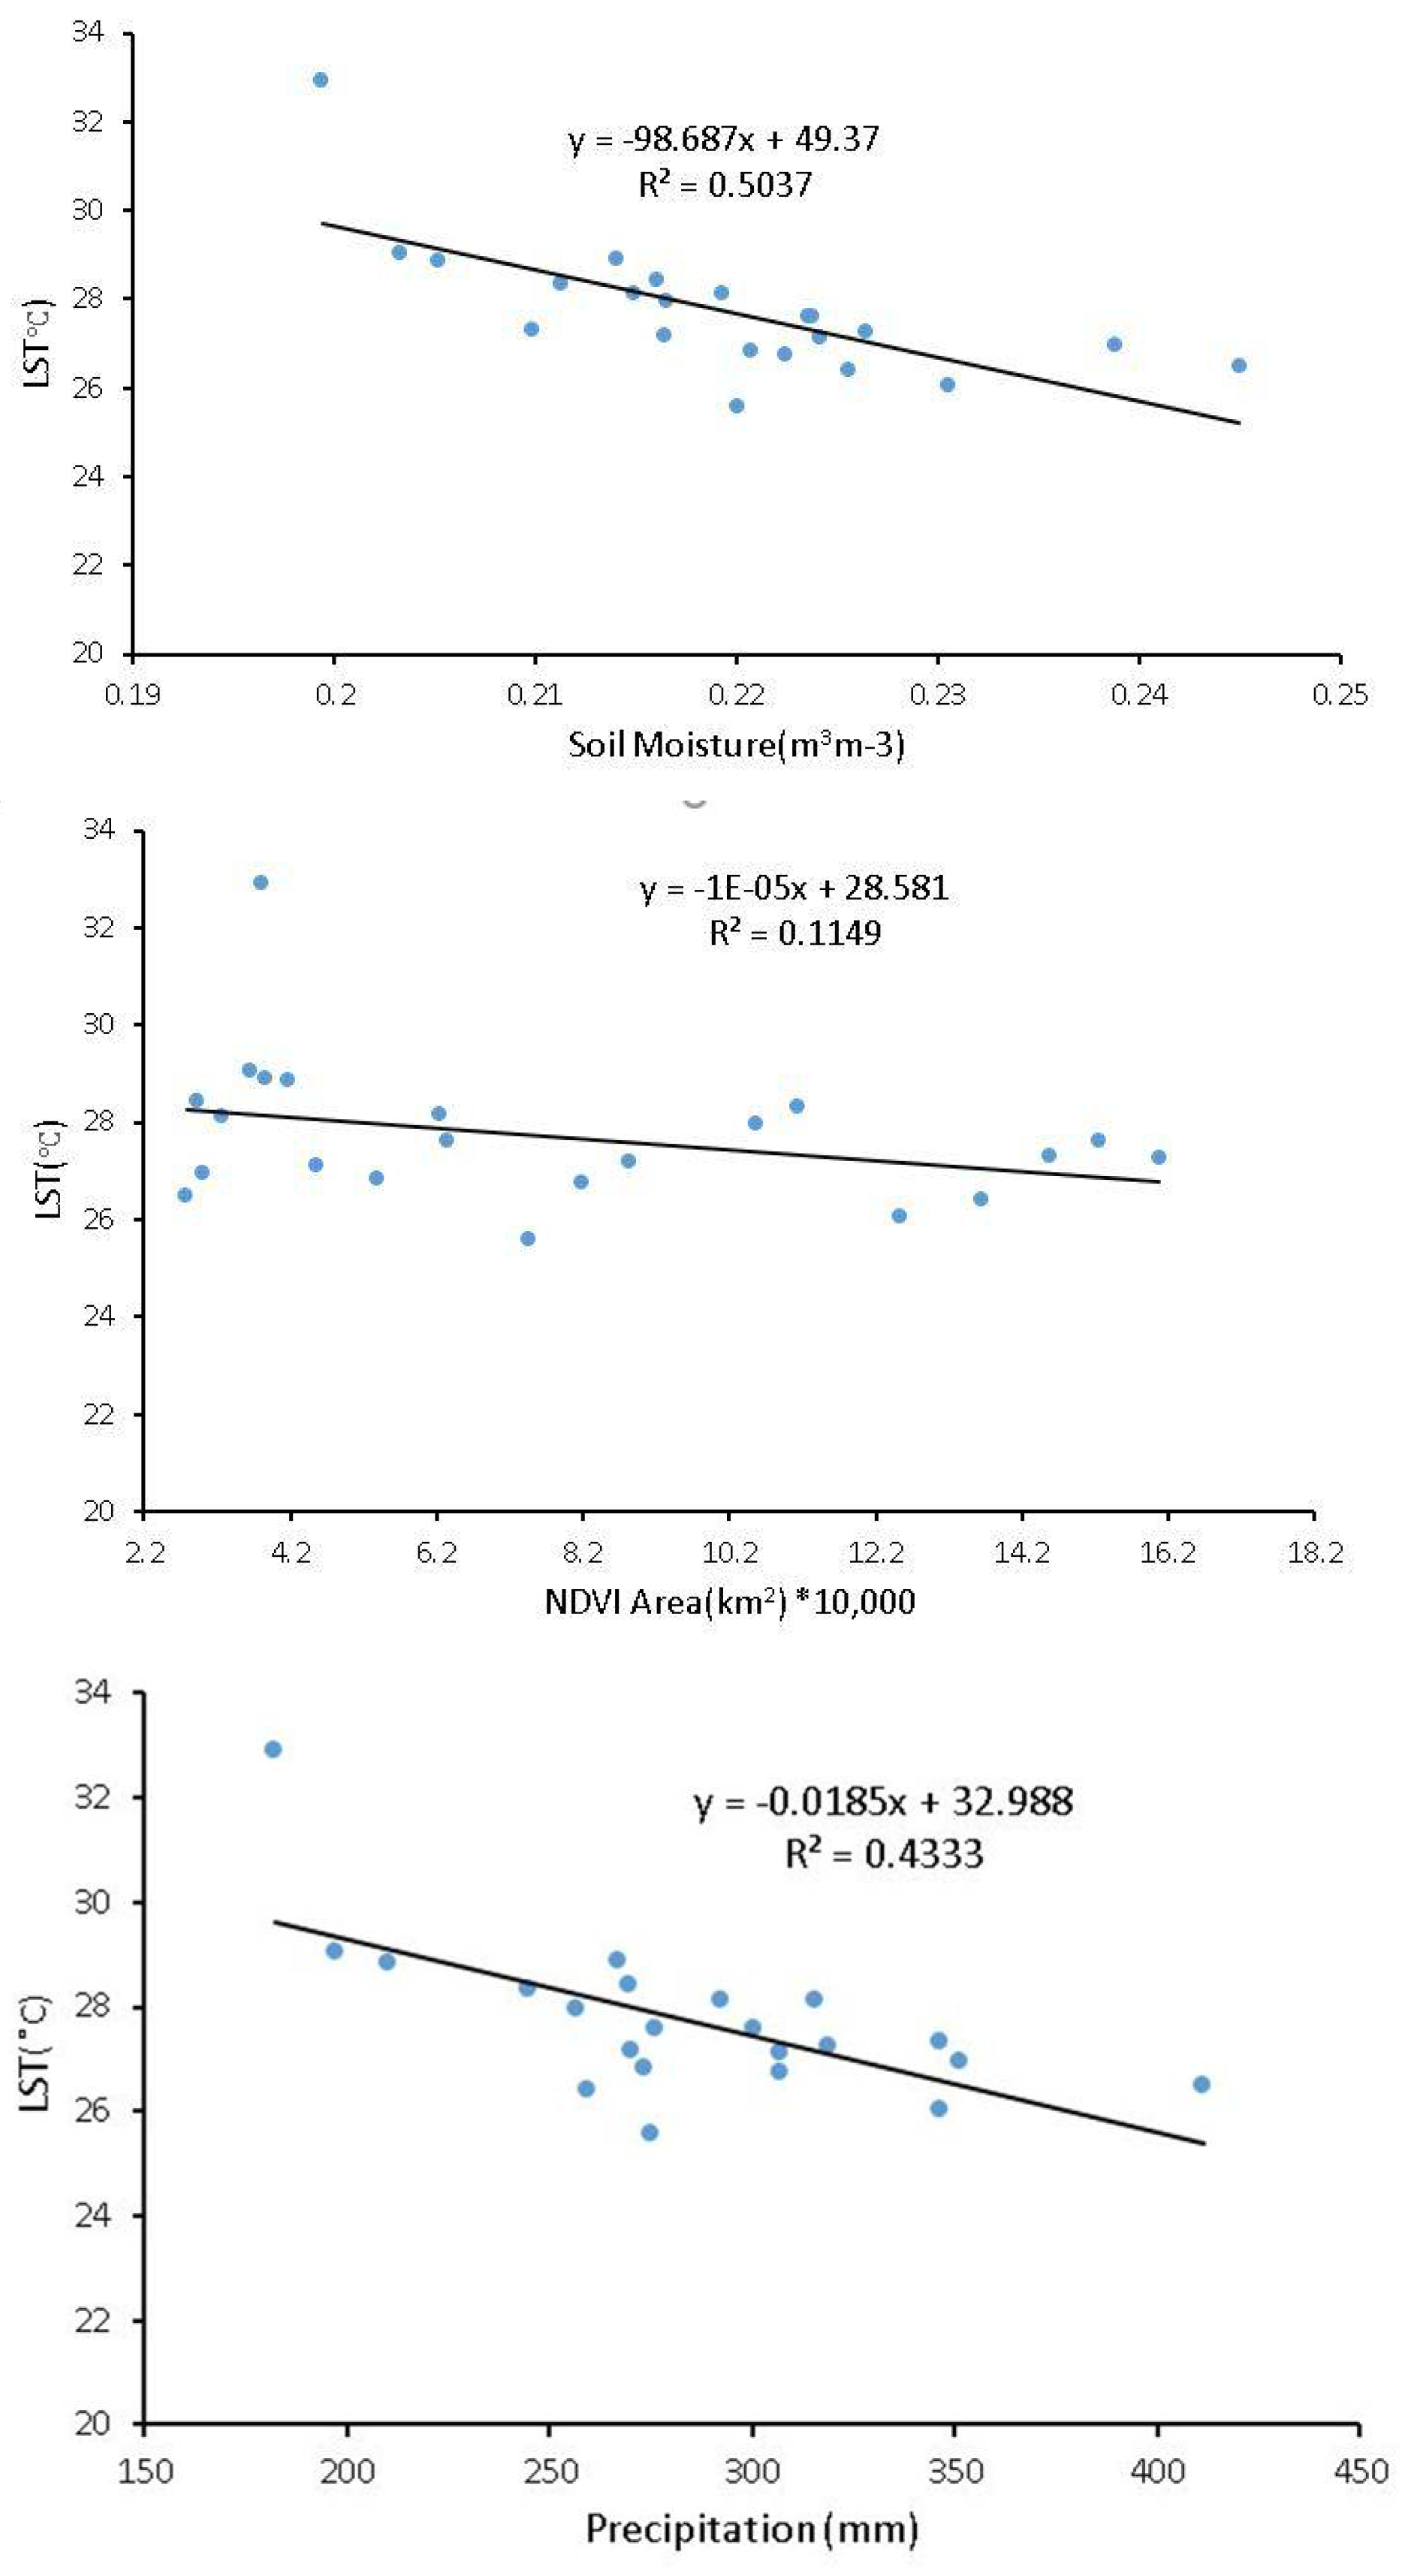
In Table 2 and Figure 13, the relationships between LST, precipitation, soil moisture, and vegetation coverage obtained employing the linear regression are presented. They were obtained for annual country-wide means. It can be concluded that the relationships between LST and soil moisture and precipitation were significant, high, and negative (R = −0.79, and R = −0.635, respectively), which means that the increase in soil moisture or precipitation caused a decrease in LST. LST was also anticorrelated with vegetation coverage (R = −0.337); however, this relation was statistically insignificant. Soil moisture had the highest impact on LST variability, and vegetation coverage had the lowest impact on LST changes.
Table 2.
The correlation (R) and determination (R2) coefficients and p-value for relationships between LST, precipitation, soil moisture, and vegetation coverage in Afghanistan in the period 2000–2021 calculated using the linear regression method.
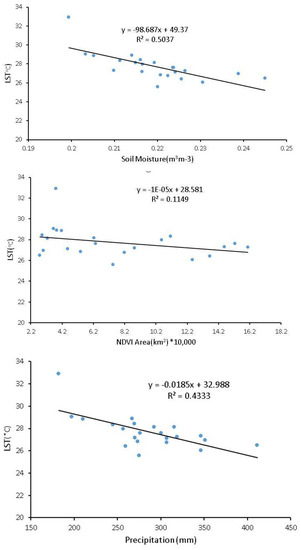
Figure 13.
The scatter plots of relationships between annual country-wide means of LST and soil moisture (upper panel), vegetation coverage (middle panel), and precipitation (bottom panel) in Afghanistan in the period 2000–2021.
For the variations of LST, the multiple regression equations taking into account the relationships between LST, precipitation, soil moisture, and vegetation coverage in Afghanistan in the period 2000–2021 were obtained for both yearly and seasonal values (Table 3). These equations allow the estimation of the projected value of LST. The obtained multiple regression and determination coefficients indicate that precipitation, soil moisture, and vegetation coverage explained about 60% of the yearly LST variation, almost 80% of the spring and summer LST variations, and only around 30% of its variation in winter and 20% of its variation in fall.
Table 3.
The yearly and seasonal multiple regression relationships between country-wide means of LST, precipitation, soil moisture, and vegetation coverage in Afghanistan in the period 2000–2021.
4. Discussion
The purpose of this study was to investigate the spatial and temporal LST variations and the impact of vegetation coverage, soil moisture, and precipitation on these variations in Afghanistan and also for its main river basins. To assess the LST variability in more detail, various statistical parameters such as mean, maximum, and minimum LST for separate watersheds of Afghanistan have been calculated for the period 2000–2021. The LST of each basin was separately investigated, taking into account such factors as climatic parameters, topography, and vegetation cover of the area.
The vegetation coverage had an upward trend in Afghanistan during the analyzed period, with 2009 and 2020 being the greenest and 2001 and 2008 the least vegetated years. The LST in Afghanistan had a decreasing trend, with 2000 having the highest LST, and 2001, 2004, 2010, 2016, 2017, 2018, and 2021 having the second-highest LST, and 2005, 2009, 2012, and 2019 having the lowest LST. The trend of precipitation was upward, with 2000, 2001, and 2021 with the lowest precipitation, and 2008, 2009, 2019, and 2020 with the highest precipitation, which is in agreement with other research [32]. It was revealed that the soil moisture impacted the LST to the greatest extent, whereas vegetation coverage had a low and statistically insignificant impact on the LST changes in Afghanistan. The results of the study also indicate that in Afghanistan, the highest LST in summer was observed in HRB and the NB, and the lowest LST was observed in winter in the ADB, also in agreement with other studies [31]. The highest soil moisture was observed in the NB, HMB, and ADB in the spring season, and the lowest soil moisture was observed in HRB, NB, and HMB in the fall. The highest rainfall was observed in the ADB and KRB in the spring, and the lowest precipitation was observed in HRB, NB, and HMB in the summer. The highest vegetation was observed in the northern basin and the ADB in the spring, and the lowest vegetation was observed in HMB, HRB, and NB in the fall.
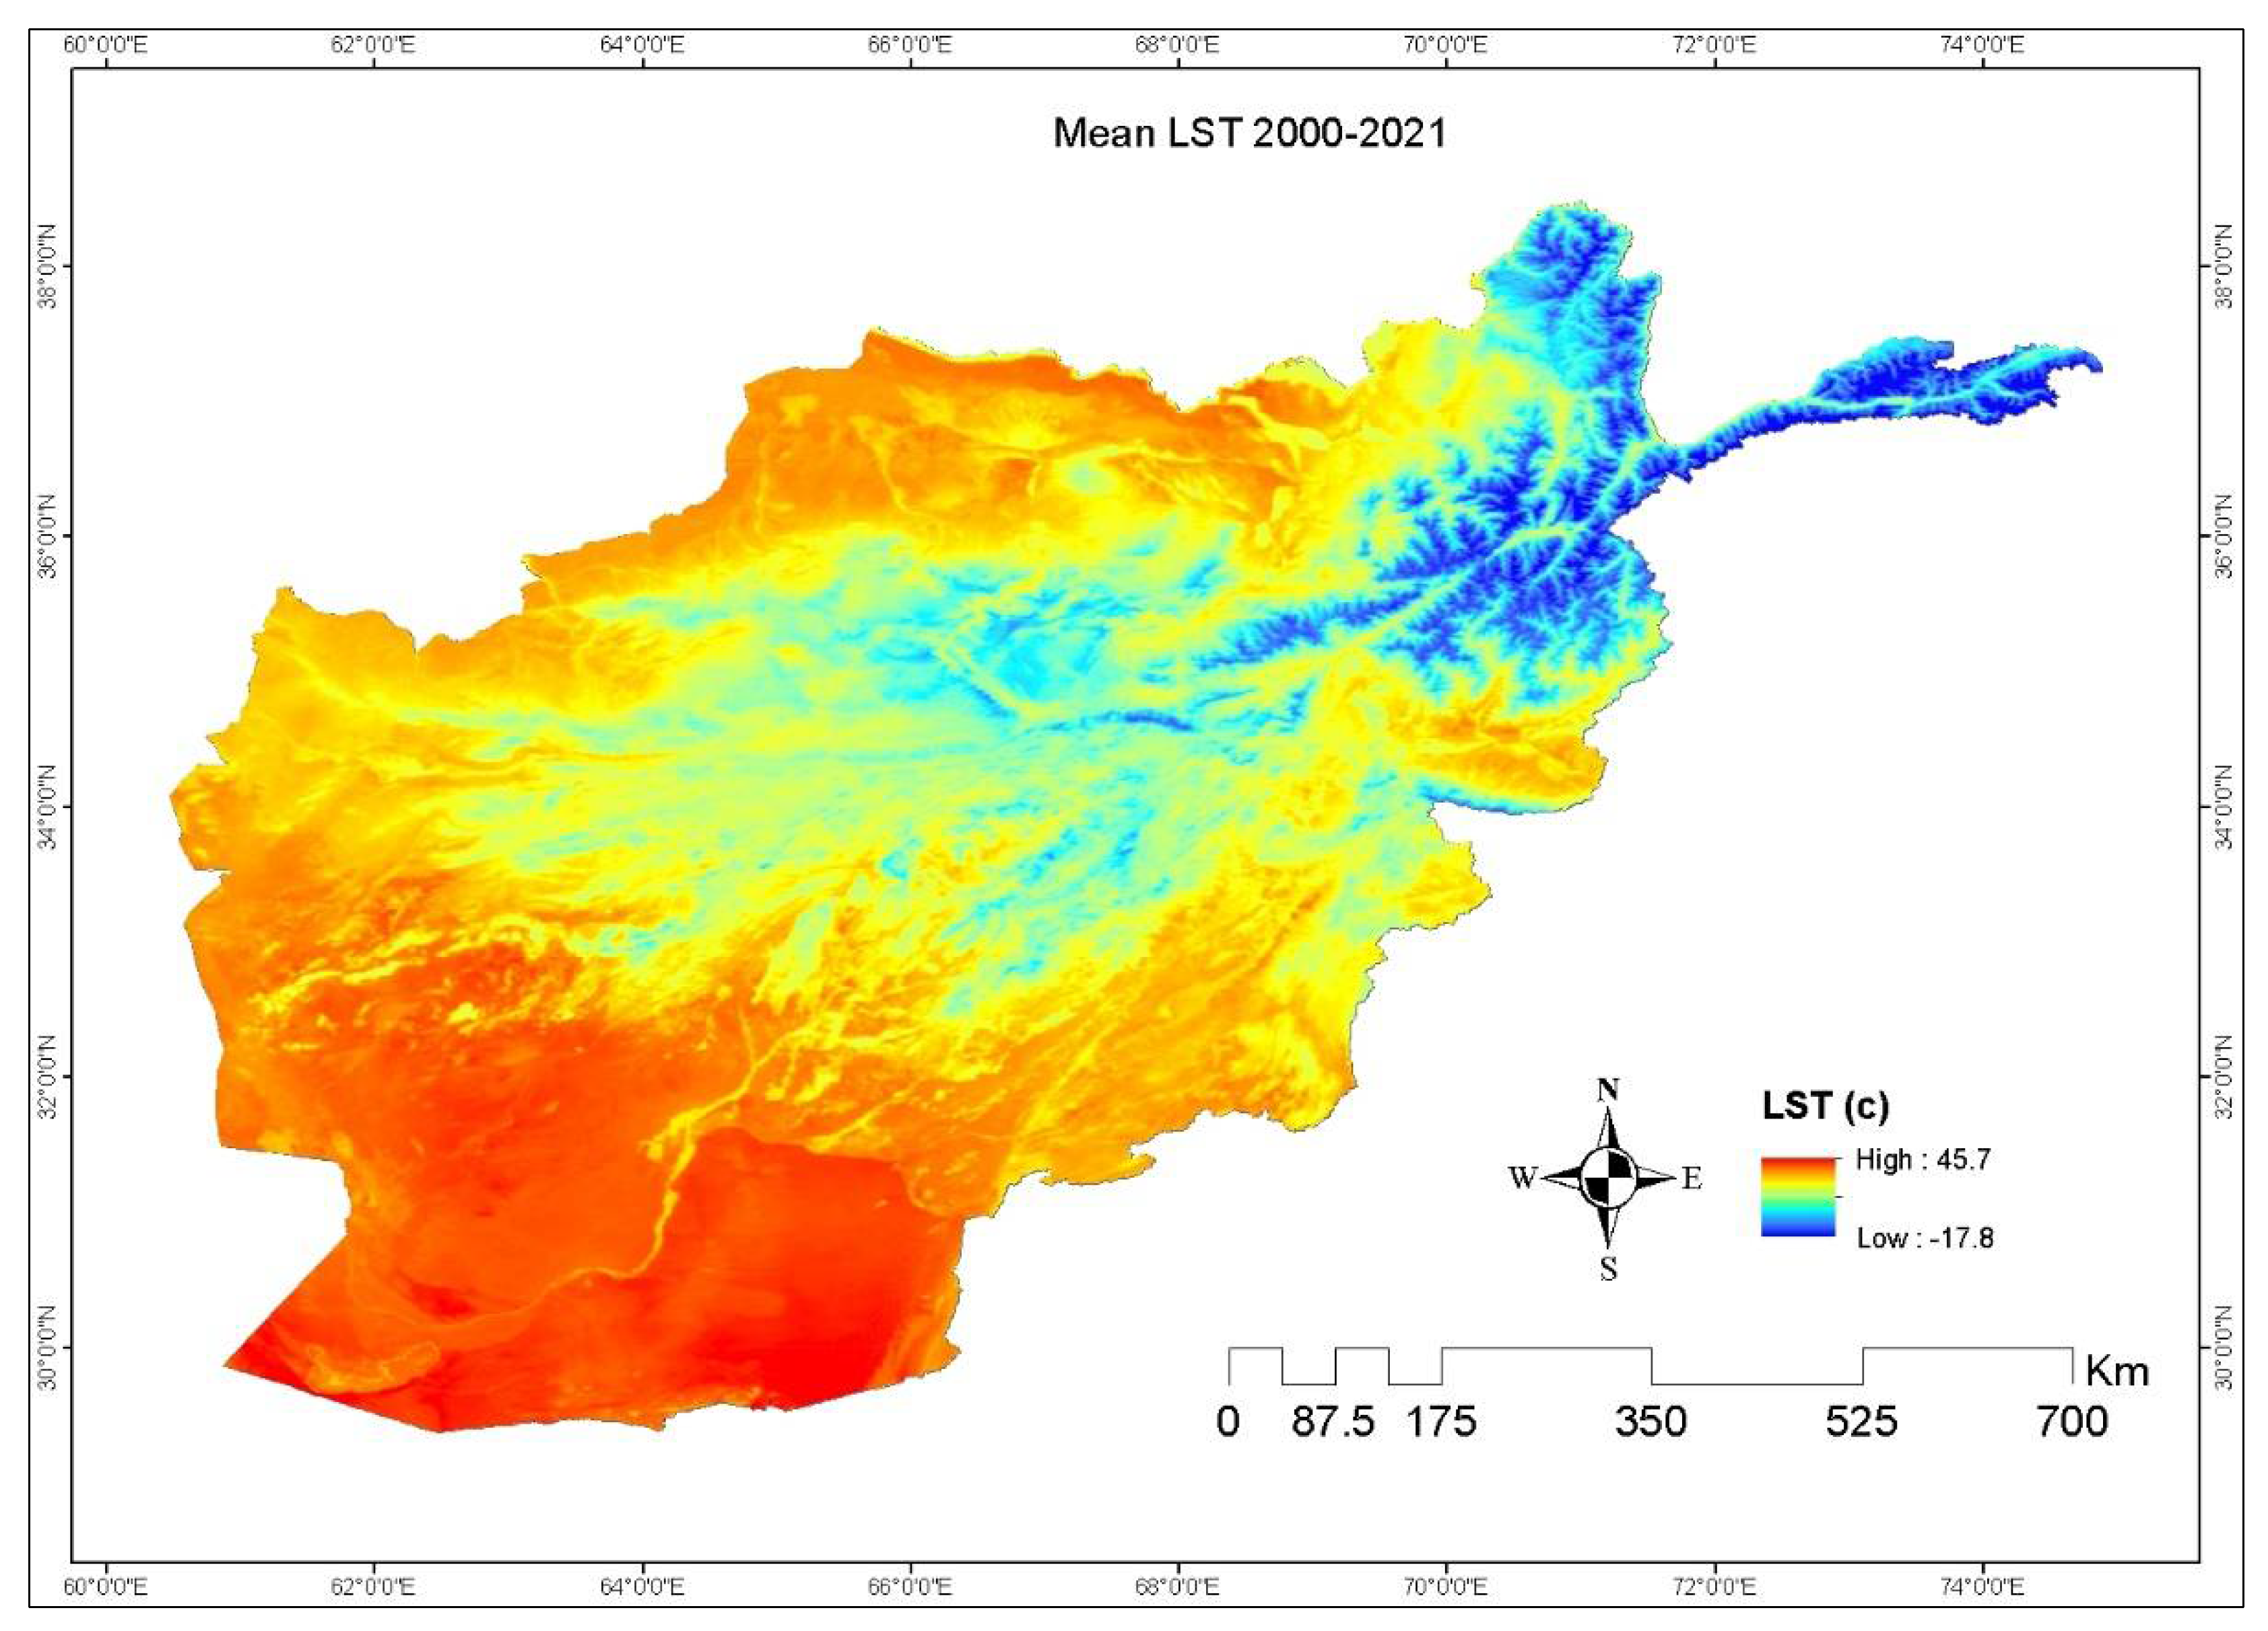
The eastern parts of Afghanistan connected to the ADB and the northeastern parts of the KRB, which are situated at high altitudes, have low LST (Figure 14). The southern and southwestern areas of HRB, the northern sides of the NB, the south and southwest of HMB, the southeastern areas of KRB, and the northwestern areas of the ADB have low elevations and high LST. The central regions of Afghanistan, which include the areas southwest of the ADR, west of KRB, northeast of HRB, west of HMB, and south of the NB, are situated at moderate altitudes and have moderate LST. Because of this, HRB is the warmest basin, and ADB is the coldest basin in Afghanistan.

Figure 14.
The map of mean LST in Afghanistan in the study period.
Thus far, no research assessing the LST changes and quantifying the impact of various parameters on them has been performed for Afghanistan, but such research has been performed for other countries. Among them are the simulations of land cover changes and their effects on LST in Dhaka, Bangladesh [48], analysis of LST changes with the use of MODIS products for the central Himalayas [49], and also quantification of the actual impact of forest cover changes on LST in Guangdong, China [50]. The additional aspect of the present study, besides the investigation of the spatial and temporal changes of LST, is the quantification of the impact of vegetation coverage, precipitation, and soil moisture variations on the LST in Afghanistan during the period 2000–2021. In the manuscript, considerable and significant correlations were found between LST and soil moisture (R = −0.709) and LST and precipitation (R = −0.658), while the correlation between LST and NDVI coverage was small and insignificant (R = −0.339), contrary to several other reports [51,52,53]. However, it was revealed by Sun and Kefastos [54], who studied the LST-NDVI relation over North America, and Kaufmann et al. [55], that the correlations between LST and vegetation depend on the region, the season of the year, and even the time of day. They found that in the winter (or cold) season, the correlation between LST and NDVI was positive, whereas a strong negative correlation between LST and NDVI was found in the warm months (from May to October). It suggests the correlation coefficient R calculated for the annual period may be close to zero because of the mutual suppression of positive and negative values observed in various seasons, depending on the analyzed region. It can be expected that if the correlation coefficient R calculated for the annual period is close to zero, then also its value calculated for the longer period (21 years) can be close to zero.
5. Conclusions
This study analyzed the spatial and temporal changes of LST and the impact of parameters affecting these changes by using remote sensing data for the period 2000–2021. The research showed that 2000 was the hottest year in Afghanistan, with an LST of 32.92 °C, and 2009, 2012, and 2019 were the coldest years, with LSTs equal to 26.39, 25.58, and 26.49 °C, respectively. It occurred that the warmest basins were HRB and NB, and the coldest one was ADB during the study period. During the spring, 29,896 (±29,143) km2 of the study area had an LST less than 0 °C, while during the summer, 437 (±32,538) km2 had an LST less than 0 °C. During the fall, 21,355 (±30,362) km2 of Afghanistan had an LST lower than 0 °C, and during the winter, 160,227 (±28,719) km2 of the study area had an LST less than 0 °C. It was shown that many parameters affect LST directly and indirectly. The research revealed that soil moisture had the strongest impact on LST, and they were anticorrelated (R = −0.79 and p-value = 0.000216). Precipitation also impacted LST (R = −0.636 and p-value = 0.00146), while the impact of the vegetation coverage was rather small and statistically insignificant (R = −0.339 and p-value = 0.122). It was revealed that precipitation, soil moisture, and vegetation coverage explained about 60% of the yearly LST variation and almost 80% of the spring and summer LST variations in Afghanistan.
The trend of LST changes was downward (R = 0.2, p-value = 0.25). The decrease of the LST was around 0.05 degrees each subsequent year, but in the fall and the winter, the LST was slightly increasing by 0.035 and 0.063 °C each year. The trend of soil moisture changes was upward in the study area, with the highest soil moisture of 0.238 m3 m–3 observed in 2020 and the lowest soil moisture in 2000, equal to 0.199 m3 m–3. The trend of precipitation changes in Afghanistan in the period 2000–2021 was upward, with the highest precipitation observed in 2019 equal to 411.33 mm and the lowest in 2000 and 2021 equal to 182 and 197 mm, respectively. The trend of vegetation changes in the study area between 2000 and 2021 was upward, with 2019 and 2020 being the greenest years, with vegetation covering about 98,260.65 and 102,601.204 km2 of the study area, respectively, while the least vegetation was observed in 2008, with vegetation covering about 45,360.703 km2 of study Afghanistan.
Author Contributions
A.F.N. and I.R. proposed the topic. A.F.N., I.R., M.D. and H.O. commanded the data processing, and analysis. A.F.N., I.R., M.D., H.O., A.S. and J.K. wrote the manuscript. A.S., J.K. and P.B. enhanced the research design, helped to analyze and interpret the results, and wrote some parts of the manuscript. All authors have read and agreed to the published version of the manuscript.
Funding
This research was supported by Vedurfelagid, Rannis, and Rannsoknastofa i vedurfraedi.
Institutional Review Board Statement
Not applicable.
Informed Consent Statement
Not applicable.
Data Availability Statement
Not applicable.
Conflicts of Interest
The authors declare no conflict of interest. The funders had no role in the design of the study; in the collection, analyses, or interpretation of data; in the writing of the manuscript, or in the decision to publish the results.
References
- Feng, Y.; Gao, C.; Tong, X.; Chen, S.; Lei, Z.; Wang, J. Spatial patterns of land surface temperature and their influencing factors: A case study in Suzhou, China. Remote Sens. 2019, 11, 182. [Google Scholar] [CrossRef] [Green Version]
- Reiners, P.; Asam, S.; Frey, C.; Holzwarth, S.; Bachmann, M.; Sobrino, J.; Göttsche, F.-M.; Bendix, J.; Kuenzer, C. Validation of AVHRR Land Surface Temperature with MODIS and in situ LST—A timeline thematic processor. Remote Sens. 2021, 13, 3473. [Google Scholar] [CrossRef]
- O’Connor, B.; Bojinski, S.; Röösli, C.; Schaepman, M.E. Monitoring global changes in biodiversity and climate essential as ecological crisis intensifies. Ecol. Inform. 2020, 55, 101033. [Google Scholar] [CrossRef]
- Kayet, N.; Pathak, K.; Chakrabarty, A.; Sahoo, S. Spatial impact of land use/land cover change on surface temperature distribution in Saranda Forest, Jharkhand. Model. Earth Syst. Environ. 2016, 2, 127. [Google Scholar] [CrossRef] [Green Version]
- Southworth, J. An assessment of Landsat TM band 6 thermal data for analysing land cover in tropical dry forest regions. Int. J. Remote Sens. 2004, 25, 689–706. [Google Scholar] [CrossRef]
- Huang, F.; Feng, T.; Guo, Z.; Li, L. Impact of winter snowfall on vegetation greenness in Central Asia. Remote Sens. 2021, 13, 4205. [Google Scholar] [CrossRef]
- Heegaard, E. A model of alpine species distribution in relation to snowmelt time and altitude. J. Veg. Sci. 2002, 13, 493–504. [Google Scholar] [CrossRef]
- Wu, Y.; Onipchenko, V. The impact of snow-cover on alpine vegetation type of different aspects in the west of Sichuan Province. Shengtai Xuebao. Acta Ecol. Sin. 2007, 27, 5120–5129. [Google Scholar]
- Marajh, L.; He, Y. Temperature variation and climate resilience action within a changing landscape. Remote Sens. 2022, 14, 701. [Google Scholar] [CrossRef]
- Naeem, S.; Zhang, Y.; Tian, J.; Qamer, F.M.; Latif, A.; Paul, P.K. Quantifying the impacts of anthropogenic activities and climate variations on vegetation productivity changes in China from 1985 to 2015. Remote Sens. 2020, 12, 1113. [Google Scholar] [CrossRef] [Green Version]
- Zhou, W.; Yang, H.; Huang, L.; Chen, C.; Lin, X.; Hu, Z.; Li, J. Grassland degradation remote sensing monitoring and driving factors quantitative assessment in China from 1982 to 2010. Ecol. Indic. 2017, 83, 303–313. [Google Scholar] [CrossRef]
- Lin, X.; Wen, J.; Liu, Q.; You, D.; Wu, S.; Hao, D.; Xiao, Q.; Zhang, Z.; Zhang, Z. Spatiotemporal variability of land surface albedo over the Tibet Plateau from 2001 to 2019. Remote Sens. 2020, 12, 1188. [Google Scholar] [CrossRef] [Green Version]
- Anderson, R.G.; Canadell, J.G.; Randerson, J.T.; Jackson, R.B.; Hungate, B.A.; Baldocchi, D.D.; Ban-Weiss, G.A.; Bonan, G.B.; Caldeira, K.; Cao, L. Biophysical considerations in forestry for climate protection. Front. Ecol. Environ. 2011, 9, 174–182. [Google Scholar] [CrossRef] [Green Version]
- Bala, G.; Caldeira, K.; Wickett, M.; Phillips, T.; Lobell, D.; Delire, C.; Mirin, A. Combined climate and carbon-cycle effects of large-scale deforestation. Proc. Natl. Acad. Sci. USA 2007, 104, 6550–6555. [Google Scholar] [CrossRef] [PubMed] [Green Version]
- Planque, C.; Carrer, D.; Roujean, J.-L. Analysis of MODIS albedo changes over steady woody covers in France during the period of 2001–2013. Remote Sens. Environ. 2017, 191, 13–29. [Google Scholar] [CrossRef]
- Duan, S.-B.; Li, Z.-L.; Tang, B.-H.; Wu, H.; Tang, R. Generation of a time-consistent land surface temperature product from MODIS data. Remote Sens. Environ. 2014, 140, 339–349. [Google Scholar] [CrossRef]
- Anderson, M.; Norman, J.; Kustas, W.; Houborg, R.; Starks, P.; Agam, N. A thermal-based remote sensing technique for routine mapping of land-surface carbon, water and energy fluxes from field to regional scales. Remote Sens. Environ. 2008, 112, 4227–4241. [Google Scholar] [CrossRef]
- Dang, T.; Yue, P.; Bachofer, F.; Wang, M.; Zhang, M. Monitoring Land Surface Temperature change with Landsat images during dry seasons in Bac Binh, Vietnam. Remote Sens. 2020, 12, 4067. [Google Scholar] [CrossRef]
- United Nations General Assembly. Transforming Our World: The 2030 Agenda for Sustainable Development; United Nations: New York, NY, USA, 2015. [Google Scholar]
- Zhao, W.; He, J.; Wu, Y.; Xiong, D.; Wen, F.; Li, A. An analysis of land surface temperature trends in the central Himalayan region based on MODIS products. Remote Sens. 2019, 11, 900. [Google Scholar] [CrossRef] [Green Version]
- Li, Z.-L.; Tang, B.-H.; Wu, H.; Ren, H.; Yan, G.; Wan, Z.; Trigo, I.F.; Sobrino, J.A. Satellite-derived land surface temperature: Current status and perspectives. Remote Sens. Environ. 2013, 131, 14–37. [Google Scholar] [CrossRef] [Green Version]
- Liu, J.; Hagan, D.F.T.; Liu, Y. Global land surface temperature change (2003–2017) and its relationship with climate drivers: AIRS, MODIS, and ERA5-land based analysis. Remote Sens. 2020, 13, 44. [Google Scholar] [CrossRef]
- Betts, R.A.; Falloon, P.D.; Goldewijk, K.K.; Ramankutty, N. Biogeophysical effects of land use on climate: Model simulations of radiative forcing and large-scale temperature change. Agric. For. Meteorol. 2007, 142, 216–233. [Google Scholar] [CrossRef]
- Abbas, A.; He, Q.; Jin, L.; Li, J.; Salam, A.; Lu, B.; Yasheng, Y. Spatio-temporal changes of land surface temperature and the influencing factors in the Tarim basin, Northwest China. Remote Sens. 2021, 13, 3792. [Google Scholar] [CrossRef]
- Zhan, W.; Chen, Y.; Zhou, J.; Wang, J.; Liu, W.; Voogt, J.; Zhu, X.; Quan, J.; Li, J. Disaggregation of remotely sensed land surface temperature: Literature survey, taxonomy, issues, and caveats. Remote Sens. Environ. 2013, 131, 119–139. [Google Scholar] [CrossRef]
- Quan, J.; Zhan, W.; Chen, Y.; Wang, M.; Wang, J. Time series decomposition of remotely sensed land surface temperature and investigation of trends and seasonal variations in surface urban heat islands. J. Geophys. Res. Atmos. 2016, 121, 2638–2657. [Google Scholar] [CrossRef]
- Trigo, I.; Boussetta, S.; Viterbo, P.; Balsamo, G.; Beljaars, A.; Sandu, I. Comparison of model land skin temperature with remotely sensed estimates and assessment of surface-atmosphere coupling. J. Geophys. Res. Atmos. 2015, 120, 12096–12111. [Google Scholar] [CrossRef] [Green Version]
- Norman, J.M.; Becker, F. Terminology in thermal infrared remote sensing of natural surfaces. Agric. For. Meteorol. 1995, 77, 153–166. [Google Scholar] [CrossRef]
- Mildrexler, D.J.; Zhao, M.; Running, S.W. Satellite finds highest land skin temperatures on Earth. Bull. Am. Meteorol. Soc. 2011, 92, 855–860. [Google Scholar] [CrossRef] [Green Version]
- United Nations Environment Programme. Afghanistan: National Capacity Needs Self-Assessment for Global Environmental Management (NCSA) and National Adaptation Programme of Action for Climate Change (NAPA); UNEP: Vernier, Swtizerland, 2009. [Google Scholar]
- Savage, M.; Dougherty, B.; Hamza, M.; Butterfield, R.; Bharwani, S. Socio-Economic Impacts of Climate Change in Afghanistan: A Report to the Department for International Development; Stockholm Environment Institute: Oxford, UK, 2009. [Google Scholar]
- Rousta, I.; Olafsson, H.; Moniruzzaman, M.; Zhang, H.; Liou, Y.-A.; Mushore, T.D.; Gupta, A. Impacts of drought on vegetation assessed by vegetation indices and meteorological factors in Afghanistan. Remote Sens. 2020, 12, 2433. [Google Scholar] [CrossRef]
- Rousta, I.; Khosh Akhlagh, F.; Soltani, M.; Modir Taheri, S.S. Assessment of blocking effects on rainfall in northwestern Iran. In Proceedings of the COMECAP2014, Heraklion, Greece, 28–31 May 2014; p. 291. [Google Scholar]
- Ranghieri, F.; Fallesen, D.M.G.; Jongman, B.; Balog-Way, S.A.B.; Mashahid, S.S.; Siercke, G.A.; Simpson, A.L. Disaster Risk Profile: Afghanistan; World Bank Institute: Washington, DC, USA, 2017. [Google Scholar]
- Aliyar, Q.; Dhungana, S.; Shrestha, S. Spatio-temporal trend mapping of precipitation and its extremes across Afghanistan (1951–2010). Theor. Appl. Climatol. 2022, 147, 605–626. [Google Scholar] [CrossRef]
- Breckle, S.-W. Flora and vegetation of Afghanistan. Basic Appl. Dryland Res. 2007, 1, 155–194. [Google Scholar] [CrossRef]
- Hearns, G. Dammed if you do and damned if you don’t. In Water, Security and U.S. Foreign Policy, 1st ed.; Reed, D., Ed.; Routledge: London, UK, 2017; Volume 10, pp. 189–205. [Google Scholar]
- Maharjan, S.B.; Joya, E.; Rahimi, M.M.; Azizi, F.; Muzafari, K.A.; Bariz, M.; Bromand, M.T.; Shrestha, F.; Shokory, A.G.; Anwari, A. Glaciers in Afghanistan: Status and Changes from 1990 to 2015; International Centre for Integrated Mountain Development (ICIMOD): Patan, Nepal; National Water Affairs Regulation Authority (NWARA): Sanatoruim Kabul, Afghanistan, 2021. [Google Scholar]
- King, M.; Sturtewagen, B. Making the Most of Afghanistan’s River Basins: Opportunities for Regional Cooperation; EastWest Institute: New York, NY, USA, 2010. [Google Scholar]
- Olafsson, H.; Rousta, I. Influence of atmospheric patterns and North Atlantic Oscillation (NAO) on vegetation dynamics in Iceland using Remote Sensing. Eur. J. Remote Sens. 2021, 54, 351–363. [Google Scholar] [CrossRef]
- Geerken, R.; Zaitchik, B.; Evans, J. Classifying rangeland vegetation type and coverage from NDVI time series using Fourier Filtered Cycle Similarity. Int. J. Remote Sens. 2005, 26, 5535–5554. [Google Scholar] [CrossRef]
- Rousta, I.; Olafsson, H.; Zhang, H.; Moniruzzaman, M.; Baranowski, P.; Krzyszczak, J. Anthropogenic factors affecting the vegetation dynamics in the arid Middle East. Environ. Clim. Technol. 2022, accepted. [Google Scholar]
- Aquino, D.d.N.; Rocha Neto, O.C.d.; Moreira, M.A.; Teixeira, A.d.S.; Andrade, E.M.d. Use of remote sensing to identify areas at risk of degradation in the semi-arid region. Rev. Ciênc. Agron. 2018, 49, 420–429. [Google Scholar] [CrossRef]
- Kafira, V.; Albanakis, K.; Oikonomidis, D. Flood susceptibility assessment using GIS: An example from Kassandra Peninsula, Halkidiki, Greece. In Proceedings of the 10th International Congress of the Hellenic Geographical Society, Thessaloniki, Greece, 22–24 October 2014; pp. 287–308. [Google Scholar]
- Perdigón-Morales, J.; Romero-Centeno, R.; Pérez, P.O.; Barrett, B.S. The midsummer drought in Mexico: Perspectives on duration and intensity from the CHIRPS precipitation database. Int. J. Climatol. 2018, 38, 2174–2186. [Google Scholar] [CrossRef]
- Funk, C.; Peterson, P.; Landsfeld, M.; Pedreros, D.; Verdin, J.; Shukla, S.; Husak, G.; Rowland, J.; Harrison, L.; Hoell, A. The climate hazards infrared precipitation with stations—A new environmental record for monitoring extremes. Sci. Data 2015, 2, 150066. [Google Scholar] [CrossRef] [Green Version]
- McNally, A.; Arsenault, K.; Kumar, S.; Shukla, S.; Peterson, P.; Wang, S.; Funk, C.; Peters-Lidard, C.D.; Verdin, J.P. A land data assimilation system for sub-Saharan Africa food and water security applications. Sci. Data 2017, 4, 170012. [Google Scholar] [CrossRef] [Green Version]
- Ahmed, B.; Kamruzzaman, M.; Zhu, X.; Rahman, M.; Choi, K. Simulating land cover changes and their impacts on land surface temperature in Dhaka, Bangladesh. Remote Sens. 2013, 5, 5969–5998. [Google Scholar] [CrossRef] [Green Version]
- Ricotta, C.; Avena, G.; De Palma, A. Mapping and monitoring net primary productivity with AVHRR NDVI time-series: Statistical equivalence of cumulative vegetation indices. ISPRS J. Photogramm. Remote Sens. 1999, 54, 325–331. [Google Scholar] [CrossRef]
- Shen, W.; He, J.; Huang, C.; Li, M. Quantifying the actual impacts of forest cover change on surface temperature in Guangdong, China. Remote Sens. 2020, 12, 2354. [Google Scholar] [CrossRef]
- Malik, M.S.; Shukla, J.; Mishra, S.N. Relationship of LST, NDBI and NDVI using Landsat-8 data in Kandaihimmat watershed, Hoshangabad, India. Indian J. Geo-Mar. Sci. 2019, 48, 25–31. [Google Scholar]
- Deng, Y.; Wang, S.; Bai, X.; Tian, Y.; Wu, L.; Xiao, J.; Chen, F.; Qian, Q. Relationship among land surface temperature and LUCC, NDVI in typical karst area. Sci. Rep. 2018, 8, 641. [Google Scholar] [CrossRef]
- Andronis, V.; Karathanassi, V.; Tsalapati, V.; Kolokoussis, P.; Miltiadou, M.; Danezis, C. Time Series Analysis of Landsat Data for Investigating the Relationship between Land Surface Temperature and Forest Changes in Paphos Forest, Cyprus. Remote Sens. 2022, 14, 1010. [Google Scholar] [CrossRef]
- Sun, D.; Kafatos, M. Note on the NDVI-LST relationship and the use of temperature-related drought indices over North America. Geophys. Res. Lett. 2007, 34, L24406. [Google Scholar] [CrossRef] [Green Version]
- Kaufmann, R.K.; Zhou, L.; Myneni, R.B.; Tucker, C.J.; Slayback, D.; Shabanov, N.V.; Pinzon, J. The effect of vegetation on surface temperature: A statistical analysis of NDVI and climate data. Geophys. Res. Lett. 2003, 30, 2147. [Google Scholar] [CrossRef] [Green Version]


Publisher’s Note: MDPI stays neutral with regard to jurisdictional claims in published maps and institutional affiliations. |
© 2022 by the authors. Licensee MDPI, Basel, Switzerland. This article is an open access article distributed under the terms and conditions of the Creative Commons Attribution (CC BY) license (https://creativecommons.org/licenses/by/4.0/).