Article

Climate Change Impact on Energy Poverty and Energy Efficiency in the Public Housing Building Stock of Bari, Italy

by
Giandomenico Vurro
1,2,
Valentina Santamaria
1,
Carla Chiarantoni
1 and
Francesco Fiorito
1,*
1
Department of Civil, Environmental, Land, Building Engineering and Chemistry (DICATECh), Polytechnic University of Bari, 70126 Bari, Italy
2
Climate and Atmosphere Research Center (CARE-C), The Cyprus Institute, Nicosia 1065, Cyprus
*
Author to whom correspondence should be addressed.
Climate 2022, 10(4), 55; https://doi.org/10.3390/cli10040055
Submission received: 30 December 2021 / Revised: 20 March 2022 / Accepted: 31 March 2022 / Published: 2 April 2022
(This article belongs to the Special Issue Anthropogenic Climate Change: Social Science Perspectives)

Abstract

:
The public housing stock across the European Union is generally constituted of old buildings (built prior to 1980) with high energy demand and indoor thermal comfort issues, which could be exacerbated by climate change. The aim of this paper was to quantify the impact of climate change on the energy demand of the public housing building stock. A neighbourhood located in Bari (south Italy) is considered as representative of a common construction typology of late 1970s in Italy. Energy models were created and calibrated with real-time data collected from utilities’ bills. The results showed a medium to strong correlation between age and energy consumption (r = 0.358), but no evident correlation between the number of tenants and energy consumption, although a significantly low energy consumption was found in apartments occupied by more than five tenants. An energy penalty of about 7 kWh/m2 of heating energy consumption for every 10 years of increase in the average age of tenants was calculated. Moreover, the impact of future weather scenarios on energy consumptions was analysed and an average annual energy penalty of 0.3 kWh/m2 was found.

1. Introduction

In developed countries, energy poverty is understood as the economic inability to access services considered essential for everyday life, such as energy for adequate heating, cooling, lighting, production of domestic hot water, food processes and operating household appliances [1,2,3]. Energy poverty has been increasing in the European Union in recent years, capturing the attention of policymakers and scholars [4]. In this climate of extreme attention to energy poverty, there has been a great deal of action by the Member States of the European Union. As a matter of fact, many of these actions acted in the context of the Internal Energy Market dimension. Some countries focused on developing strategies to combat energy poverty and others aimed at developing national systems for assessing and monitoring the evolution of energy poverty problems over time [5]. All these actions stemmed from the adoption of the Energy Union strategy aiming to providing competitive, affordable, sustainable and secure energy to European consumers. An integral part of this strategy is the 2030 climate and energy framework, which defines necessary targets for reducing greenhouse gas emissions and increasing the deployment of renewable energy resources and energy efficiency. In this framework, under the Governance Regulation, Member States have developed integrated national energy and climate plans (NECPs) for the period 2021–2030. These plans introduce several energy poverty measures aimed at either improving energy efficiency, providing energy supply assistance in energy-poor households, or providing general living support measures and improving energy efficiency [6].
A recent study by Jessel et al. [7] described how energy poverty is a long-term phenomenon (chronic), which depends on household economic hardship, on housing quality, type and tenure, and on energy access [8]. However, in particular circumstances, short-term (acute) episodes of energy poverty can be determined by extreme weather events, which are exacerbated by local and global climatic changes [9,10,11], and/or by the temporary inability to pay bills. Both phenomena have a direct consequence on health, under the physical, physiological and psychological points of view [7].
The main tools made available to combat energy poverty are (i) economic subsidies, (ii) social tariffs on the price of energy, (iii) social bonuses that limit the impact of the price on bills and (iv) houses’ energy efficiency improvement. While the first three tools are palliative, as they alleviate the problem for people who are affected but do not solve it at the base, the improvement of energy efficiency is the solution that fights the problem at the bottom, and therefore, it is the main investment underlined by the European Union. Energy efficiency is in fact considered the key driver for the solution of the “energy trilemma”, linked to energy security, access to energy at competitive prices and environmental sustainability of energy uses [12,13]. Although significant levels of energy poverty can be found in heating-dominated climates and have effects on human health [14,15] and on winter deaths [16], energy poverty can be considered as equally distributed in the different climatic regions and is influenced by the ability to access different types of energy [17]. Recently, several studies have assessed the issue of summer energy poverty [18,19,20], particularly spread in southern European countries. These countries, together with those located in the eastern part of the continent, are those affected the most by the phenomenon of energy poverty [4,21]. From the study of Scarpellini et al. [21], it also emerges that, among the three different indicators used by the European community, i.e. the inability to adequately heat the home, the delays in paying bills and the poor quality of buildings, in those areas, the latter is significantly higher than the other two. The explanation is that the European building stock is generally long-standing and, therefore, not in compliance with current regulations. This is also particularly evident for public housing neighbourhoods, where the most vulnerable part of the population lives [22,23].

Energy Poverty in Italy

According to the EU Energy Poverty Observatory [24], a much higher incidence of energy poverty is observed in Italy than in the EU on average. For individuals unable to keep their home adequately warm, Italy has experienced a strong increase in the incidence of this problem from 2010 onwards, reaching a peak of 21.3% in 2012. From 2013 on, the indicator registered a decrease rate comparable to the average one of the EU but remaining further from the EU norm than it was before 2010.
Faiella and Lavecchia [25] in a study on energy poverty in Italy proposed various parameters for the identification of the phenomenon in Italy. They found that the most suitable one is an indicator highlighting low-income and high-spending families. The indicator requires two conditions: (i) energy expenditure above the national median value, and (ii) income, net of energy expenditure, below the poverty levels. The study concluded that, according to this indicator, in 2015, there were about 2.2 million energy-poor households in Italy (8.6% of the population), and that they were unevenly distributed across the country. Indeed, a strong incidence in the southern regions (around 13%) was found, which is more than double compared to the central regions (around 5.5%) and to the northern ones (around 5.8%). Moreover, energy poverty affects much more those who are not homeowners (12.2% in 2012), with an almost double incidence compared to owners (less than 7% in 2012). Being unemployed also greatly increases the incidence of the phenomenon (10–11%).
In a more recent study, Faiella and Lavecchia [26] linked energy poverty indicators to the national heating demand, grouped for household size. In this way, the authors created a new measure of energy poverty that (i) is not affected by family preferences, and (ii) is focused on heating. With this new indicator, they defined energy-poor households as those whose total expenditure, net of the required heating expenditure, falls below the relative poverty threshold. In conclusion, according to this study, different factors affect the likelihood to be energy-poor such as (i) the size of the family, (ii) the age or (iii) the education of relatives, (iv) geographical zone (especially living in the South and in the Islands) and (v) city size. Indeed, in the period between 2014 and 2016, the study showed that around 3 million households were fuel-poor (11.7% of all householders), and most of them were living in the South and/or had lower average age.
As shown in the study for the ITRE (Industry, Research and Energy) Committee [27], among the factors that contribute to creating the conditions for energy poverty, one of the main ones is the poor building energy performance. A situation of particular interest is that defined within the public residential property, where socioeconomic causes are flanked by the performance factors of the buildings.
In Italy, more than 60% of the building stock was built before 1976, the year in which the first Italian legislation on energy saving entered into force [28]. Therefore, the Italian building heritage can be defined as obsolete and not very efficient. It is possible to note, to date, in Italy as in Europe, that a significant percentage of residential buildings has exceeded the performance efficiency limit in the absence of interventions. This is due to the fact that many buildings were built before the entry into force of restrictive regulatory measures with respect to the reduction in energy consumption, the rational management of resources and the efficiency of the plant; that is, they were built before Law 373/1976, which contained the first indications and requirements for the construction of buildings with good energy efficiency, later replaced by Law 10/91.
The aim of the paper was to define the occurrence of energy poverty phenomena within the public housing building stock in Bari. The questions that guided this study were:
  • Is there a link between sociodemographic indicators and building energy consumptions?
  • Is there a link between energy consumption and users’ behavioural patterns, which can denote energy poverty conditions?
  • How will climate change affect energy poverty?
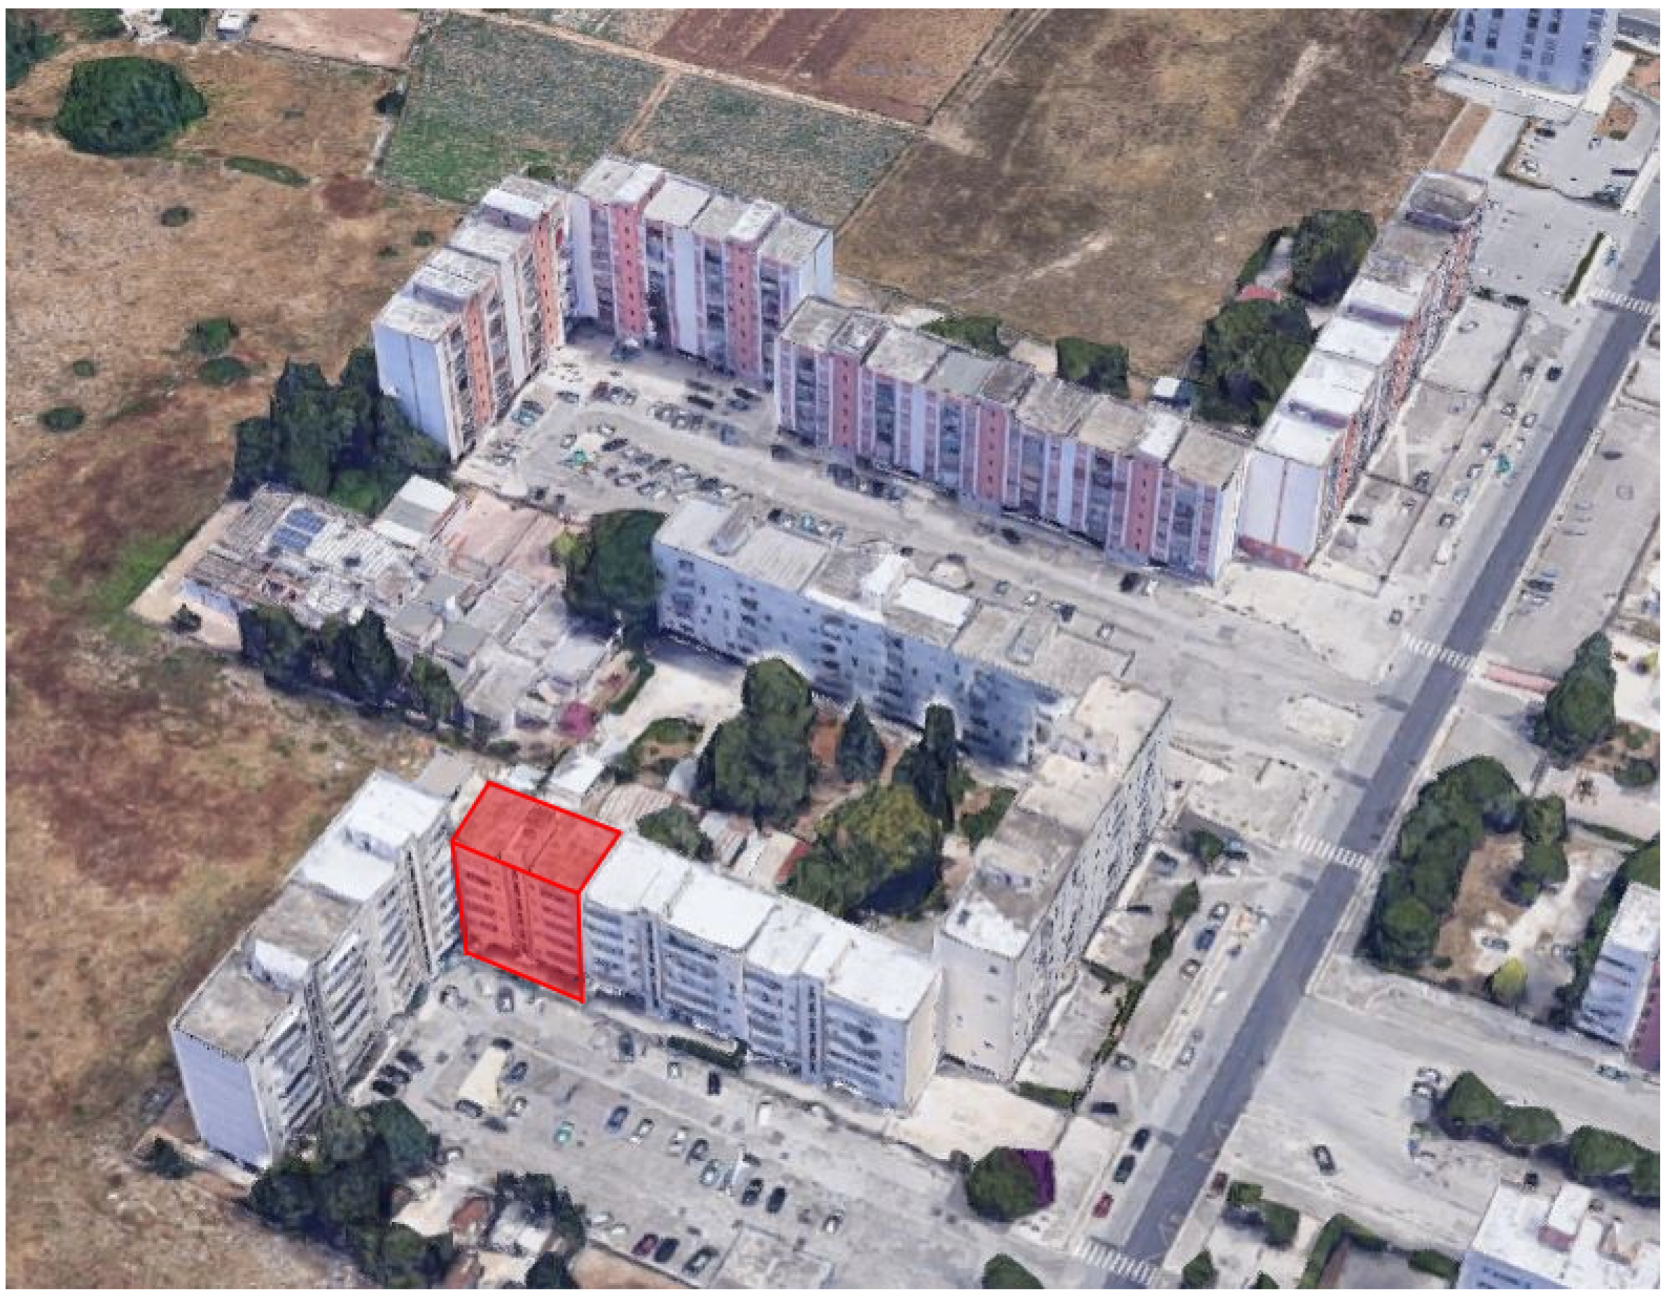
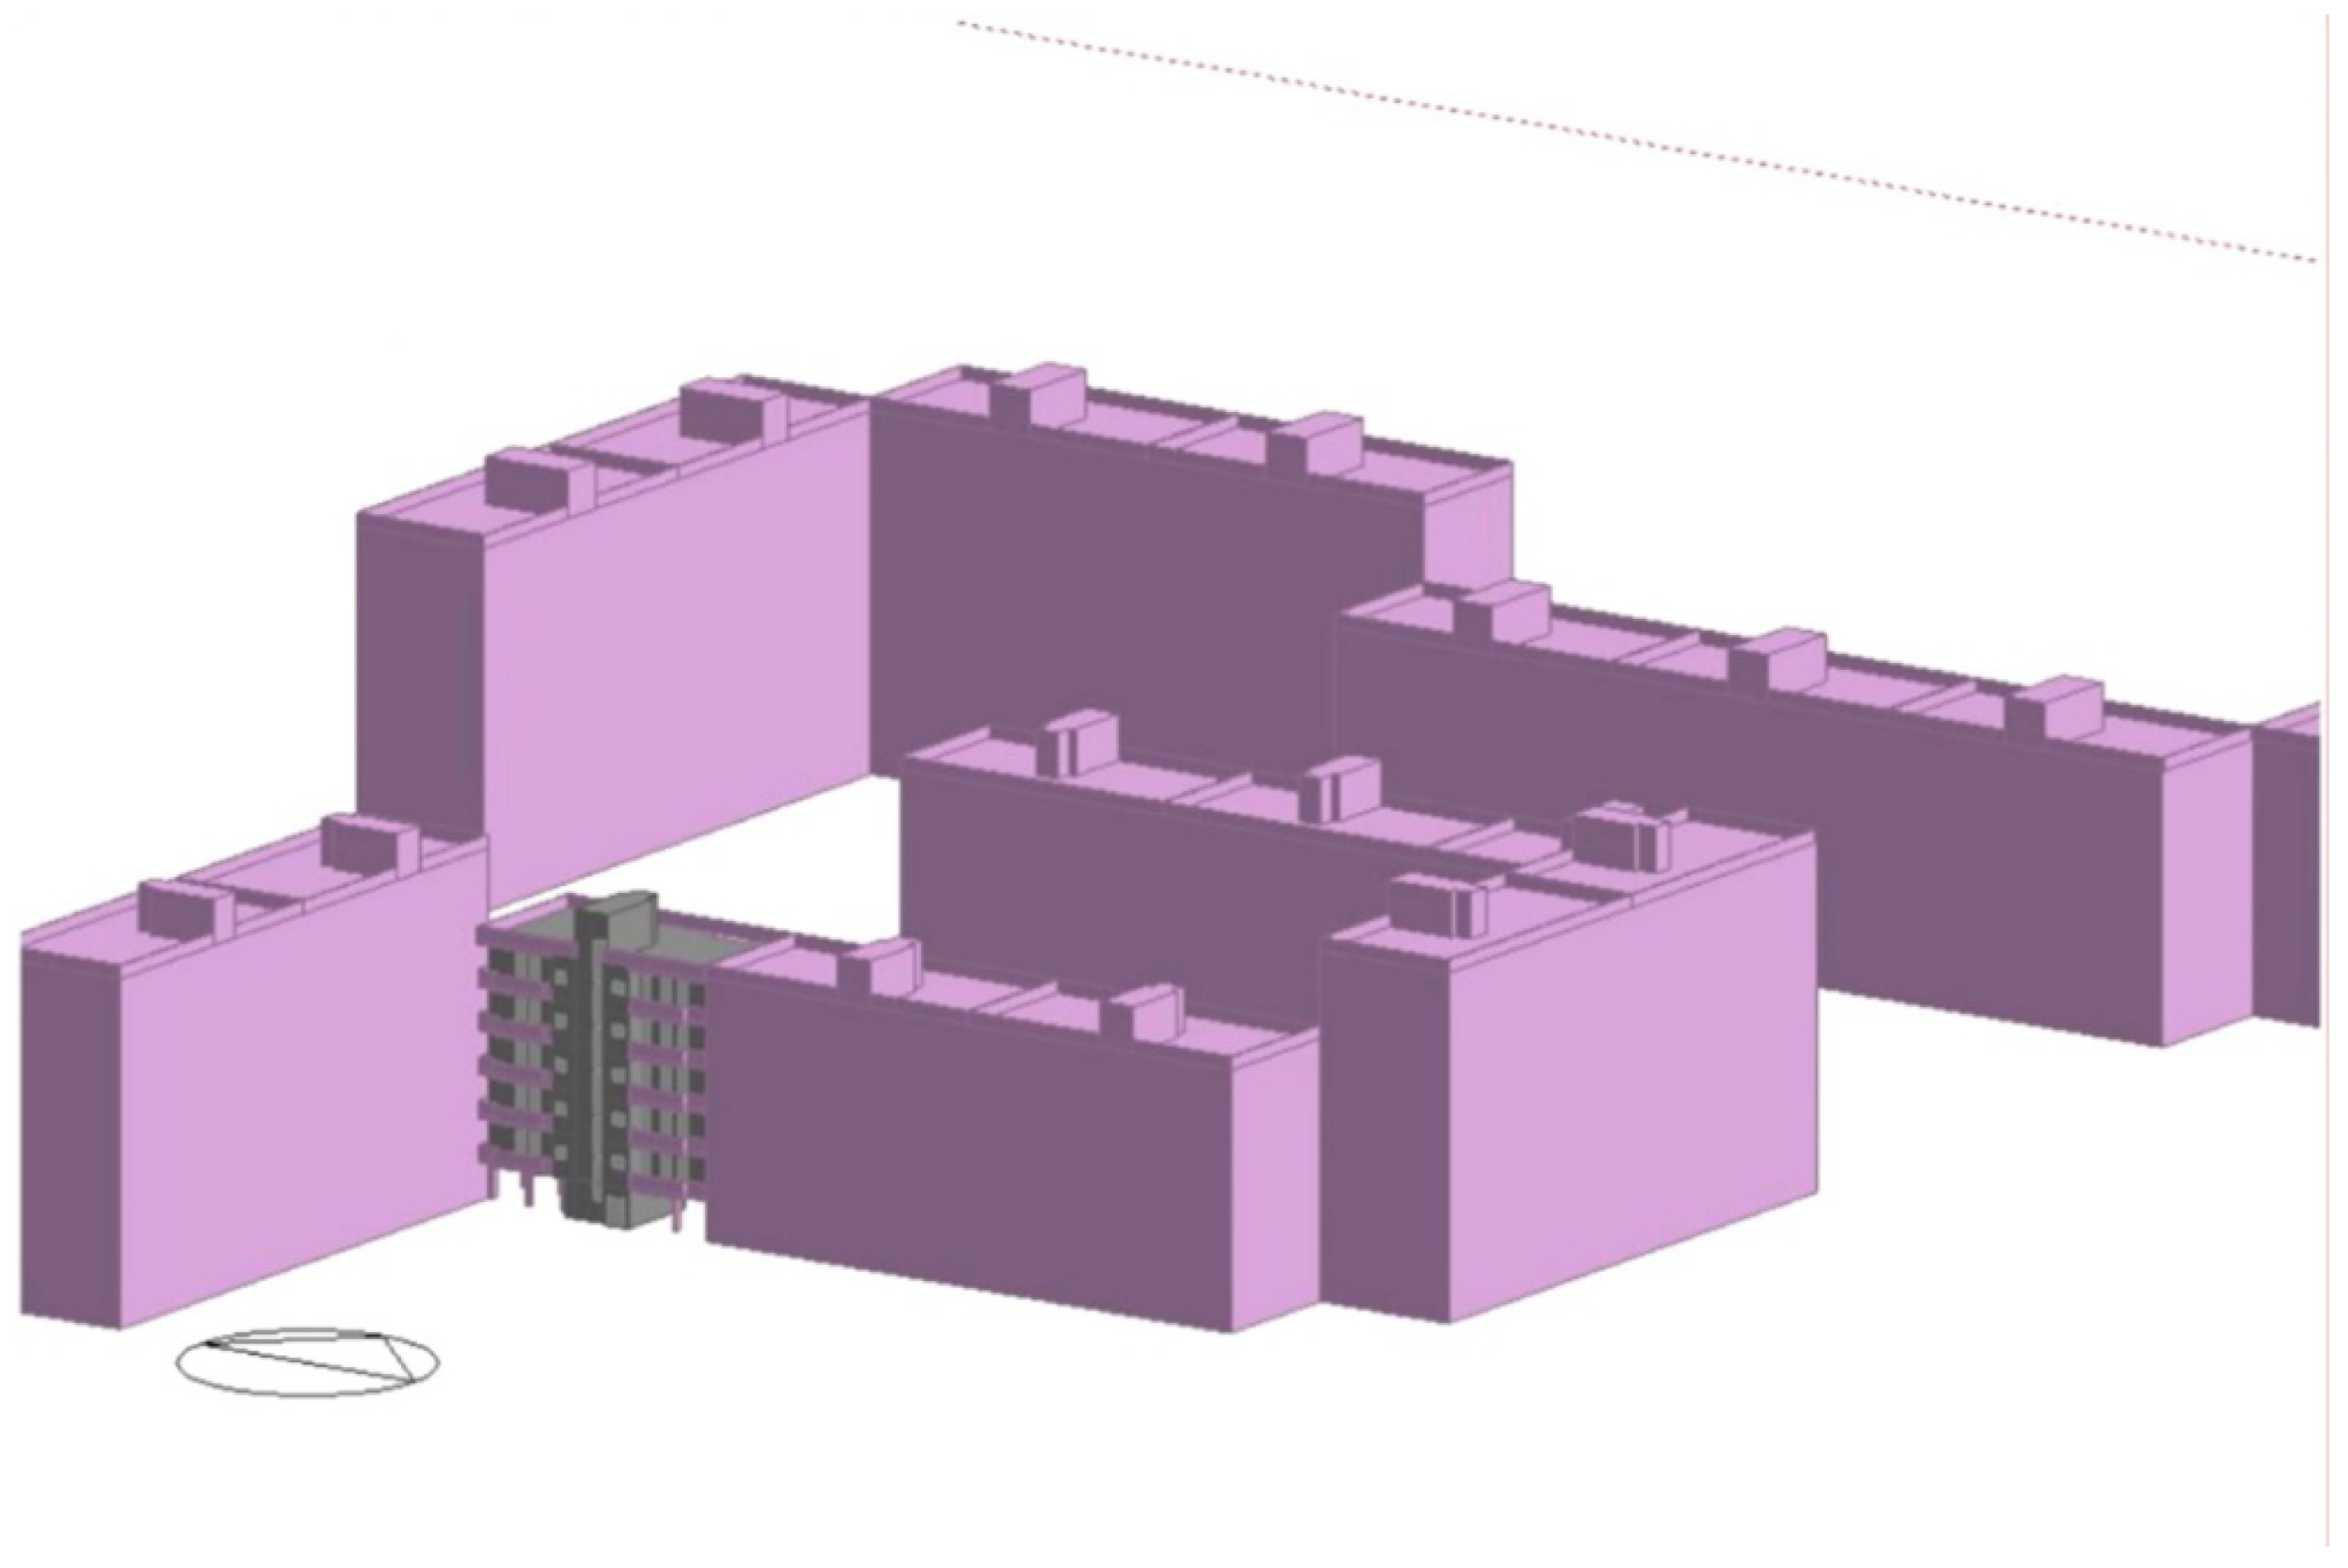
2. Case Overview

To tackle the specific research questions, the public housing building stock of the municipality of Bari (Apulia region, Italy) was considered. Bari is a typical Mediterranean city, built along the coastline. Bari is the major metropolitan city of Apulia and, together with the neighbouring municipalities within the metropolitan area, hosts about 1.2 million inhabitants and about 180,000 residential units [29]. According to the Apulian Regional Observatory on Housing Conditions (ORCA), about 20% of the total number of residential units are public-owned, belonging to the Regional Agency for Housing (ARCA Puglia) or to the municipality of Bari [30]. The public housing building stock of Bari is representative of typical conditions found in Italy, as it has been built—as most of the developments in Italy—starting from the adoption of the “INA-Casa” plans in the period between 1949 and 1963 [31]. Within the municipality of Bari, public housing is mainly concentrated in three homogeneous areas: San Paolo, Japigia and Poggiofranco neighbourhoods, with buildings built between 1962 and 1980, and therefore before the adoption of the first national energy code [28]. The specific case of the “Japigia” neighbourhood was selected as the case of study for the current work. Five buildings with similar characteristics (i.e., same exposure and same number of storeys) were considered in order to analyse the correlations between demographic characteristics and energy consumption. The buildings include a total of 50 residential units and 145 residents. As shown in Figure 1, the distribution of population within the case of study is well representative of the distribution of population in the public housing building stock of Bari.
Differences between frequencies are within a ±2% limit for all age ranges, with the only notable difference for the frequencies of residents with over 80 years of age, which are slightly higher in the case of study (about 15% of the total residents) than in the city of Bari (about 9% of the total residents). On this point, it has to be noted that residents within the public housing of “Japigia” neighbourhood are generally first-generation residents (i.e., residents who are still the first assigners of the houses after their construction).
The buildings belong to the “multi-storey in-line” type (see Figure 2) and show the following characteristics:
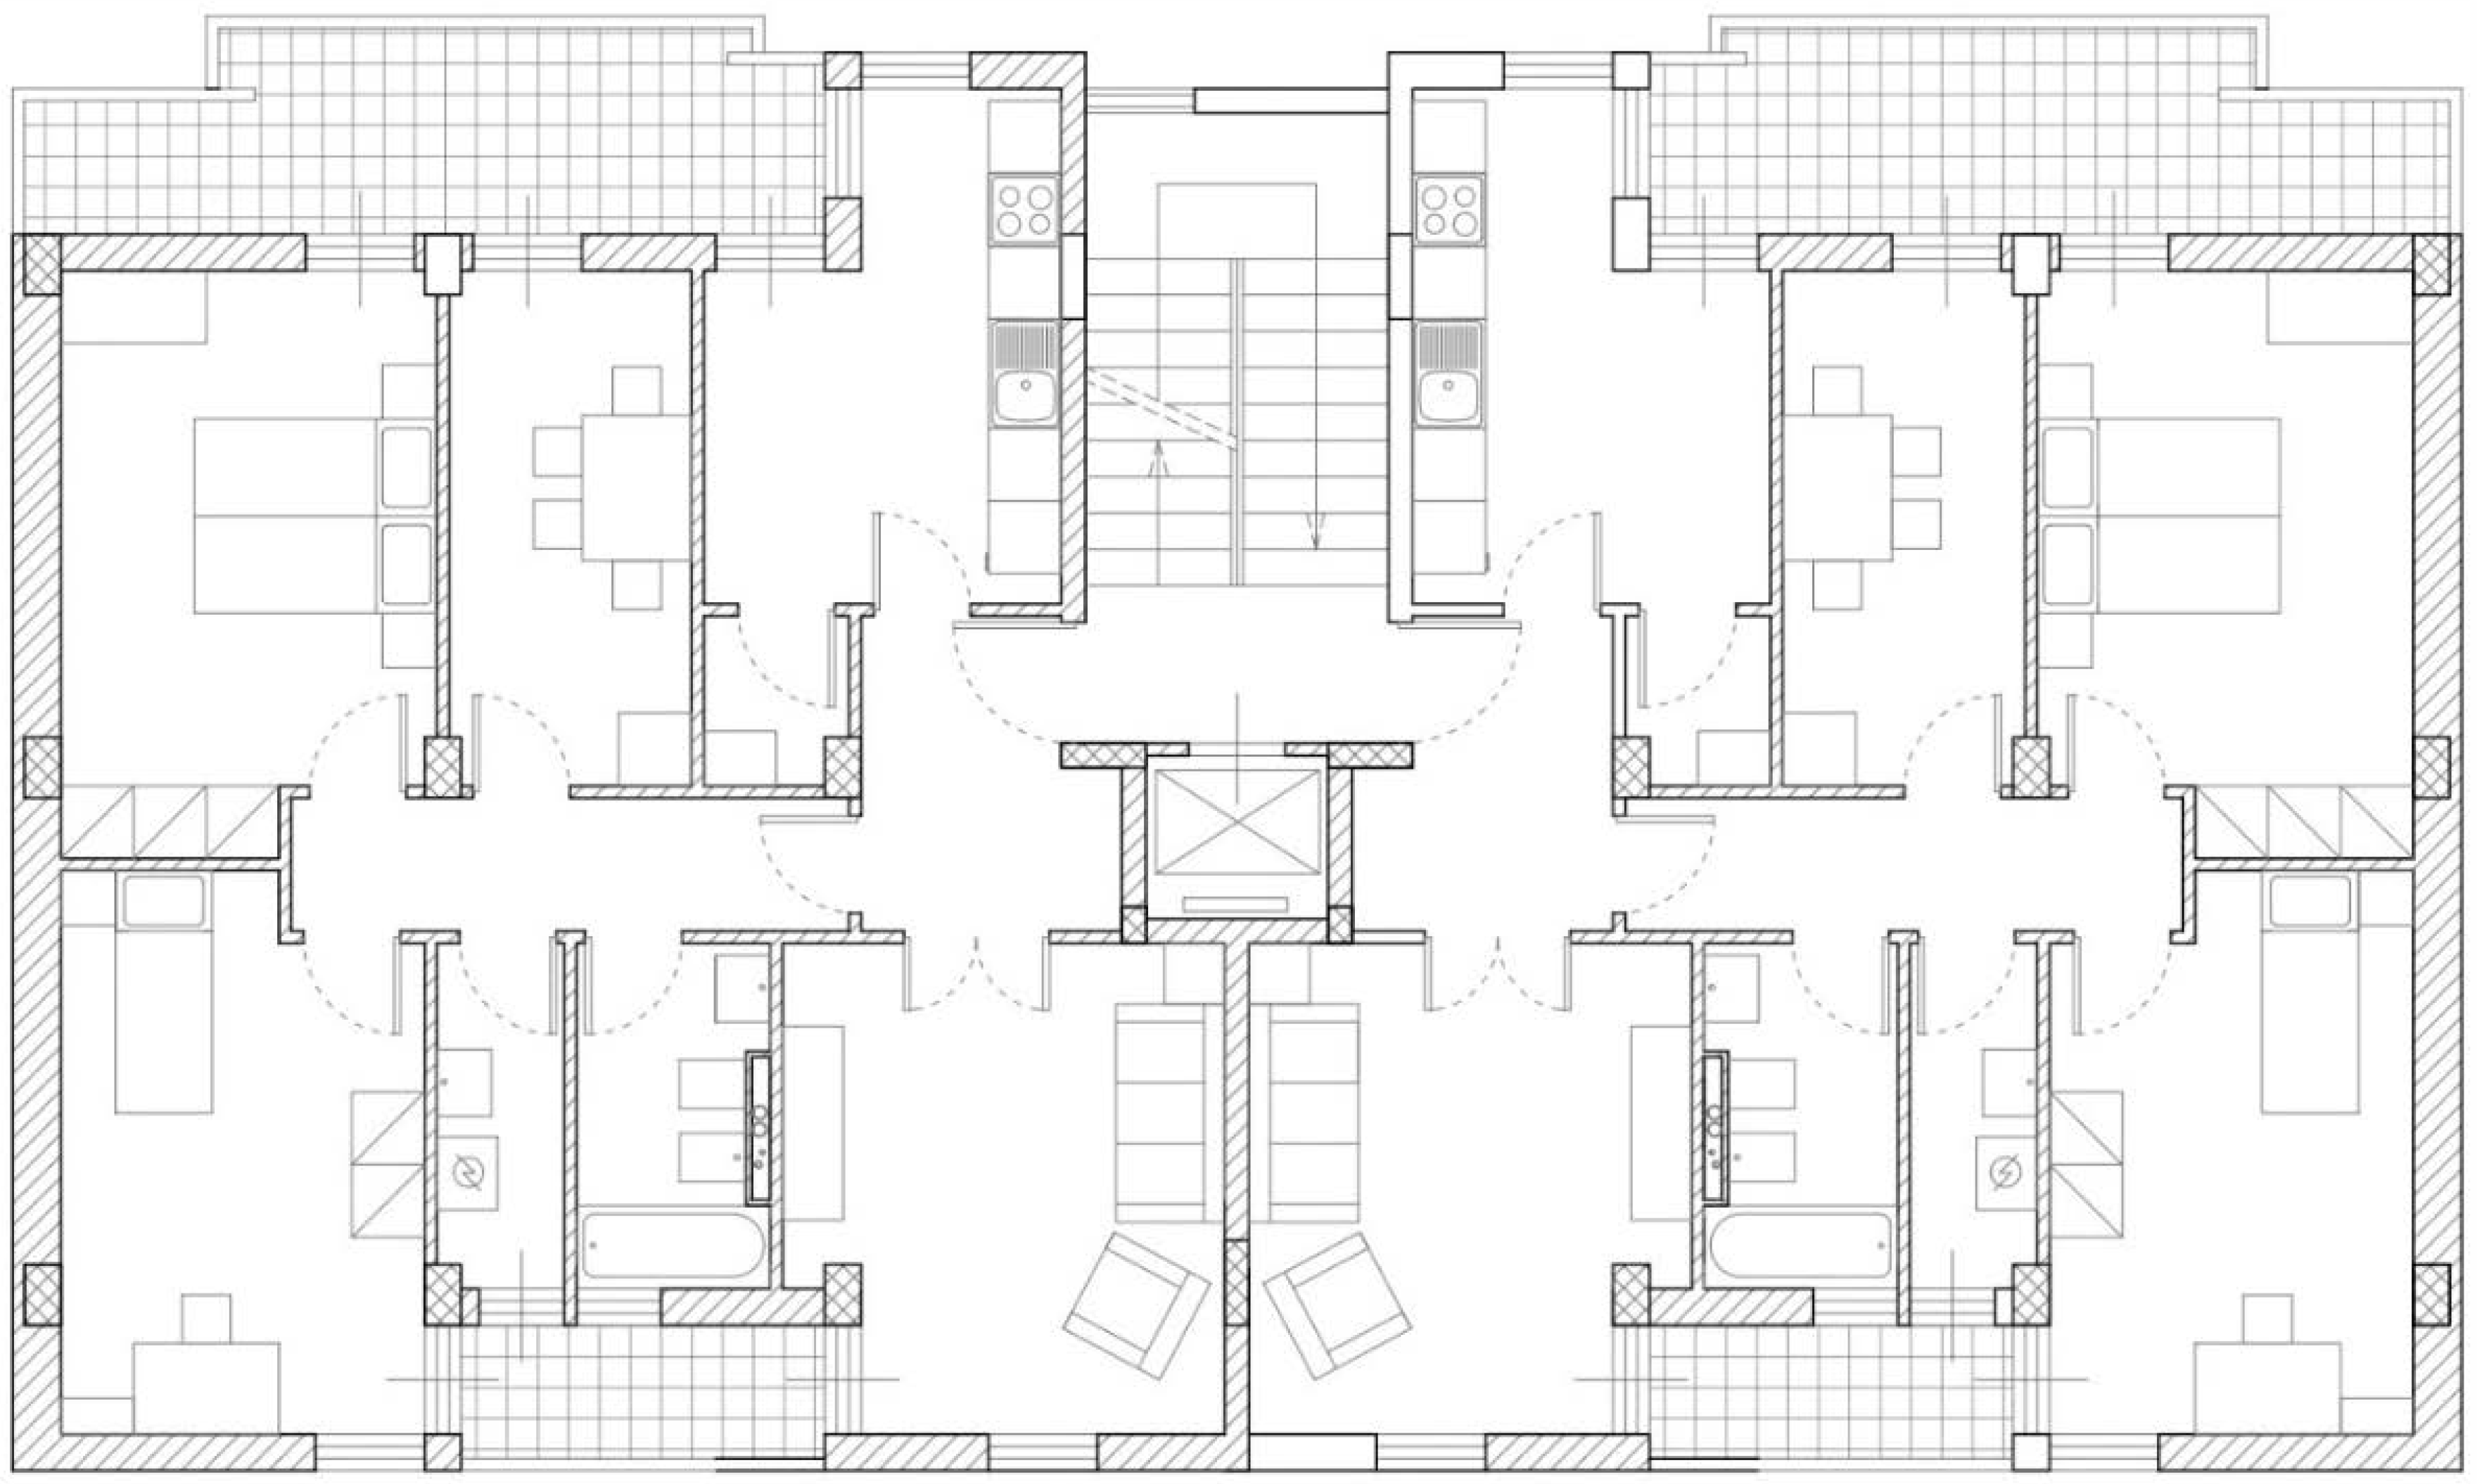
  • Partially enclosed buildings, with two externally exposed facades (north–south or east–west) and two facades adjacent to surrounding buildings.
  • Block of stairs and elevators generally positioned in the middle of the building and serving two apartments per floor.
  • Internal layout of apartments characterised by a clear separation between living area and sleeping area with a corridor separating the two areas.
  • Load-bearing reinforced concrete structures and uninsulated external walls (generally two layers of lightweight tufa stone or of perforated bricks with intermediate air cavity (U = 1.05 W/m2K).
  • Uninsulated roof constituted of brick-cement structure with concrete topping and bitumen rainproofing finishing (U = 1.5 W/m2K).
  • Windows with single glass and aluminium frame without thermal break, with external roller shutters as blackout closures (U = 5 W/m2K).

3. Materials and Methods

3.1. Measurement of the Energy Poverty

Measuring energy poverty is fundamental for analysing the problem from a quantitative point of view, and consequently also allows the creation of appropriate policies to combat the phenomenon. The creation of appropriate indicators is hindered by the limited availability of data, as well as by a lack of consensus on how energy poverty should be conceptualised and measured. According to Hassani et al. [32], in the literature, there is a great variety of evaluation measures and indicators, each of which is based on a precise method. Depending on the context and environmental conditions, the methods and indicators vary. In general, indicators can be created based on three different approaches:
  • The spending approach, where an examination of the energy costs incurred, compared to absolute or relative thresholds, provides an indicator to estimate the degree of domestic energy deprivation. The expense taken into consideration can be the real expense or the ideal one necessary to maintain indoor comfort conditions. A disadvantage of this approach is that it limits the causes of energy poverty to low incomes, inadequate quality of buildings and high energy prices, thus not considering the importance of the energy need and sociodemographic circumstances at the level of the tenants.
  • The consensual approach, based on surveys with questionnaires proposed to families, by means of questions about the conditions of the house and the ability to reach needs considered basic, relative to the society in which the family lives. The consensual approach requires less complex data to be obtained than that necessary for the previous approach. Finally, a consensual approach has the power to capture the most “hidden” elements of energy poverty, such as social exclusion and material deprivation. The main disadvantage is the subjectivity of the method. Family units, in fact, may not be considered energy-poor despite being characterised as such according to other indicators. Furthermore, the energy-poor could deny the reality of their situation.
  • Direct measurements, where the level of energy services (such as heating) is compared to a standard situation. The measurements try to measure whether sufficient levels of energy services are achieved in the home.
Although the last approach is rarely used, due to technical problems in measurements and to privacy issues, in some studies [33,34], the combination of the last two approaches was found. Moreover, some studies [35] defined new complex indicators which include both sociodemographic parameters (type, tenure of household, employment conditions, education level, age of residents) and houses’ characteristics (age of the property, heating type and demand).
In order to answer to the specific research questions, it was decided to follow the third approach between those proposed to Hassani et al. [32] and to determine the energy poverty incidence within the public housing building stock of Bari by using direct measurements of buildings’ heating consumption. This approach is common to other studies performed under similar conditions. Ortiz et al. [36] assessed the effect of household composition and building energy demand on the health of users and defined protocols for the economic assessment of energy retrofit interventions. On the other hand, both sociodemographic characteristics and behaviours of households have an impact on energy expenditure [37], and therefore, it is essential to identify behavioural patterns of users in order to properly account for energy poverty issues.

3.2. Assessment of Energy Consumption and Calibration of the Energy Model of a Selected Building

A first analysis involved the definition of building energy consumptions of the five buildings representative of the public housing building stock in the “Japigia” neighbourhood. The total energy consumption for heating and for the production of domestic hot water was calculated from energy bills over two consecutive years (from 1 January 2017 to 31 December 2018). The average value of the two years was considered as the reference parameter for the assessment of energy consumption.
Then, among the buildings constituting the neighbourhood, a typical one was further considered and modelled. The building consists of five storeys above ground and is only residential. Each of the five storeys hosts two units of the same size, each with an internal floor area of about 80 m2, as depicted in Figure 3. The units do not have any summer air conditioning system, and a natural gas boiler (seasonal energy efficiency ratio equal to 0.4) is connected to radiators for winter heating and provides domestic hot water.
A full model of the building was then produced, using DesignBuilder software [38], and calibrated with real-time energy consumptions obtained from energy bills. DesignBuilder is an EnergyPlus-based tool used for analysing many different aspects of the buildings such as energy, carbon, lighting and comfort.
As depicted in Figure 4, the building energy model was created starting from the real geometry of the building and including all the context information to accurately account for the shading effect from surrounding buildings.
The model on which DesignBuilder relies is the thermal balance method, whilst for load calculations, a methodology solves the heat and mass balance for each surface and calculates space loads and the building system simulation [39]. As the apartments do not have any summer air conditioning system, the calibration of the energy model was restricted to the winter period. Therefore, a control period of one full winter season, from 1 October 2017 and 31 March 2018, was considered. Consequently, real-time weather data from the closest weather station (Bari Caldarola, 41.1128 N, 16.8879 E, managed by the local Regional Authority for Environmental Prevention and Protection—ARPA) were collected for the years 2017 and 2018 [40] and used to calibrate the energy model.
As all characteristics of the building, including geometry and thermal properties of constructions, were already known, the calibration was performed using an empirical approach, based on the modification of the two main parameters affecting the performance of the thermal model: the setpoint temperature for heating, and the number of hours of daily activation of the heating system.
Three steps were, therefore, considered:
  • Simulation in a standardised user regime of all apartments, where each apartment was modelled with the same heating setpoint temperature (21 °C) and the same ignition period (9 h).
  • Change in the heating setpoint temperature.
  • Change in the ignition period.
The calibration is validated through the index k, calculated according to the following Equation (1). For a successful calibration, the k index must be within the limits of +/− 10% [41].
k = C O C E C E
where CO represents the simulated energy consumption (as daily average energy consumption over the considered period) and CE represents the effective energy consumption derived from the energy bills (also, in this case, expressed as daily average energy consumption over the considered period).
The calibration index was calculated for each time interval in the reference period in which the energy data were recorded.

3.3. Generation of Future Weather Files

To predict future trends of energy consumption, as well as the exacerbation of energy poverty issues within the selected neighbourhood due to climate change, future weather scenarios were generated. One of the most common methods for generating future climate files is that based on the creation of the Typical Meteorological Year (TMY). The advantage of this method lies in the fact that the calculations are reduced, given that one year describes the trend of 30 years, while in any case, the most representative conditions are taken into consideration. The largest disadvantage, however, concerns the fact that extreme events are underestimated as the process generates an average of the events [42]. Once that TMY has been created, it is necessary to develop future weather files; thus, CCWorldWeatherGen, a tool based on MS ExcelTM spreadsheets, was used [43]. The method used by the tool is a statistical downscaling method, known as a morphing method. This tool is based on the HadCM3 model, forced with the IPCC’s A2 scenario. The A2 scenario has been provided by the Intergovernmental Panel on Climate Change (IPCC) in the Special Reports on Emission Scenarios (SRES) [44]. The scenario predicts that, by 2050, the World’s population will exceed 10 billion, with regionally oriented development and fragmented technological changes and improvements [45]. From these main factors and applying the Integrated Assessment Models (IAMs), CO2 cumulative emissions projected for the mid-and-late 21st century are about 600 and 1850 GtCO2, respectively. In addition, the expected CO2 concentrations are projected to be about 575 and 880 ppm for the middle and the end of the century, respectively [44]. Recently, the names of these scenarios have been replaced by the term Representative Concentration Pathways (RCPs), introduced by the IPCC fifth assessment report [46] in order to describe groups of scenarios. RCPs are numbered according to the change in radiative forcing (from +2.6 W/m2 to +8.5 W/m2) that will result by 2100 due to climate change. Comparing the A2 scenario to the RCPs results in A2 being between RCP6 and RCP8.5.

4. Results

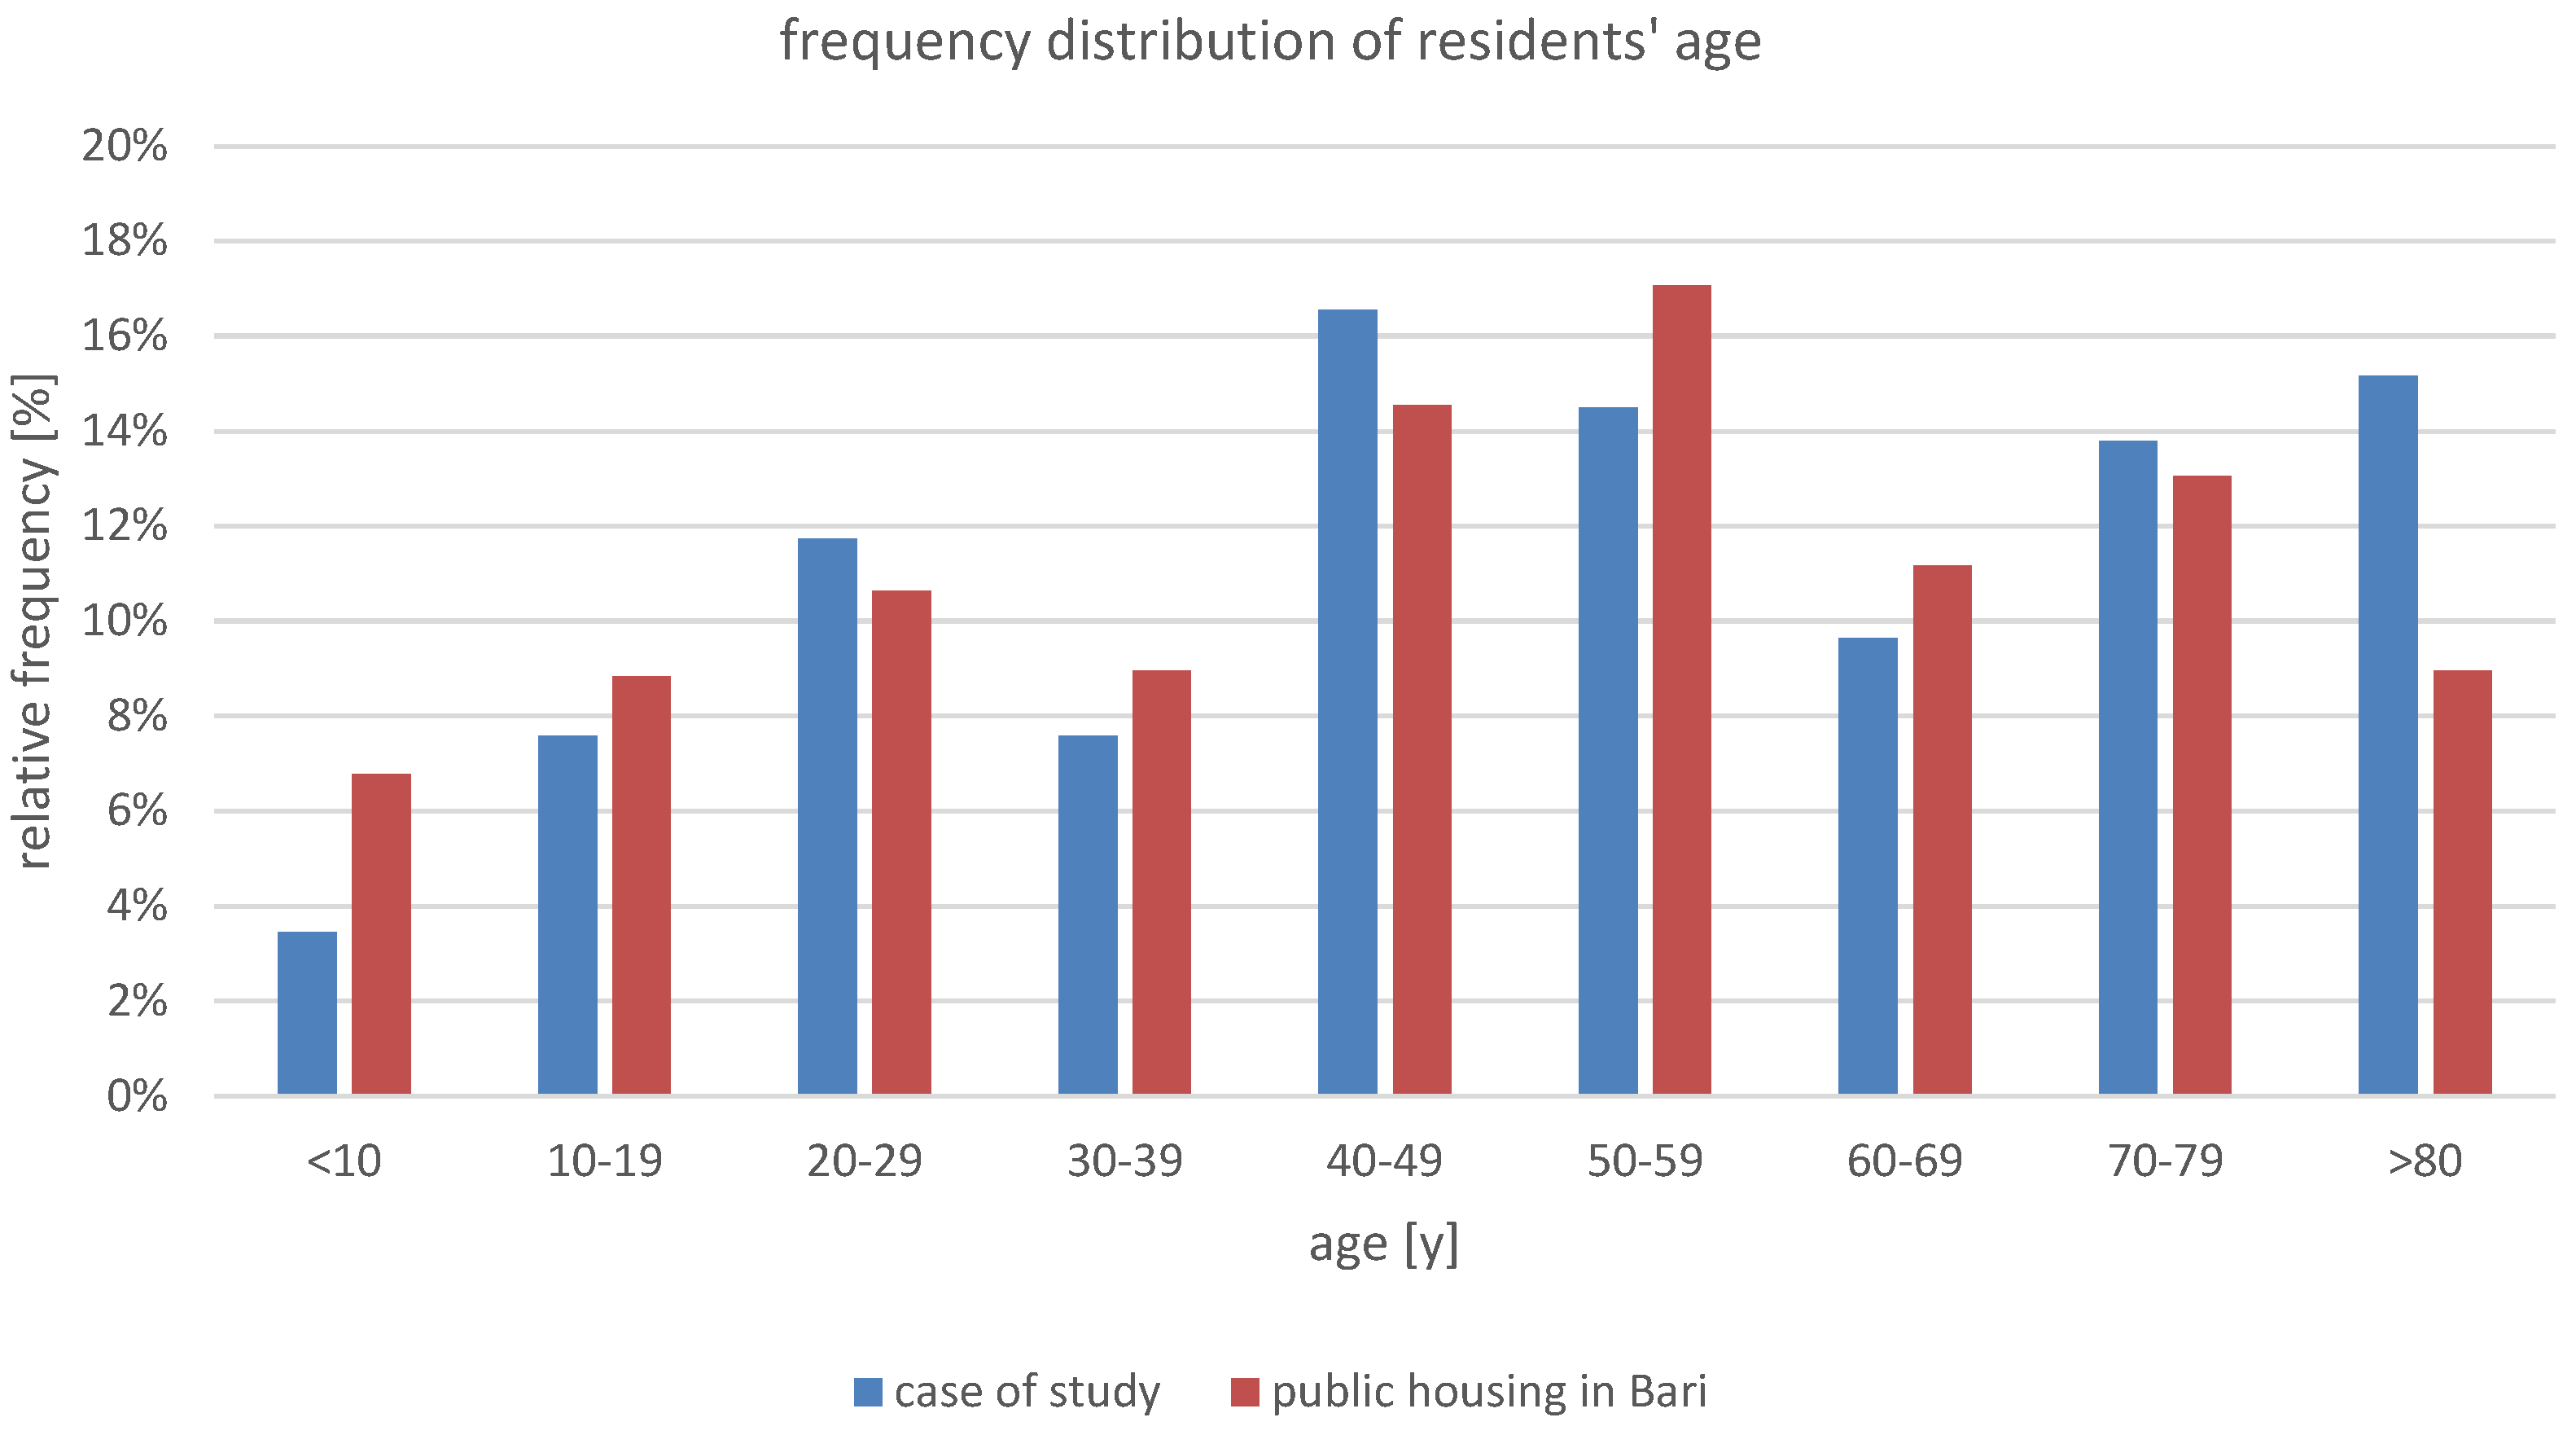
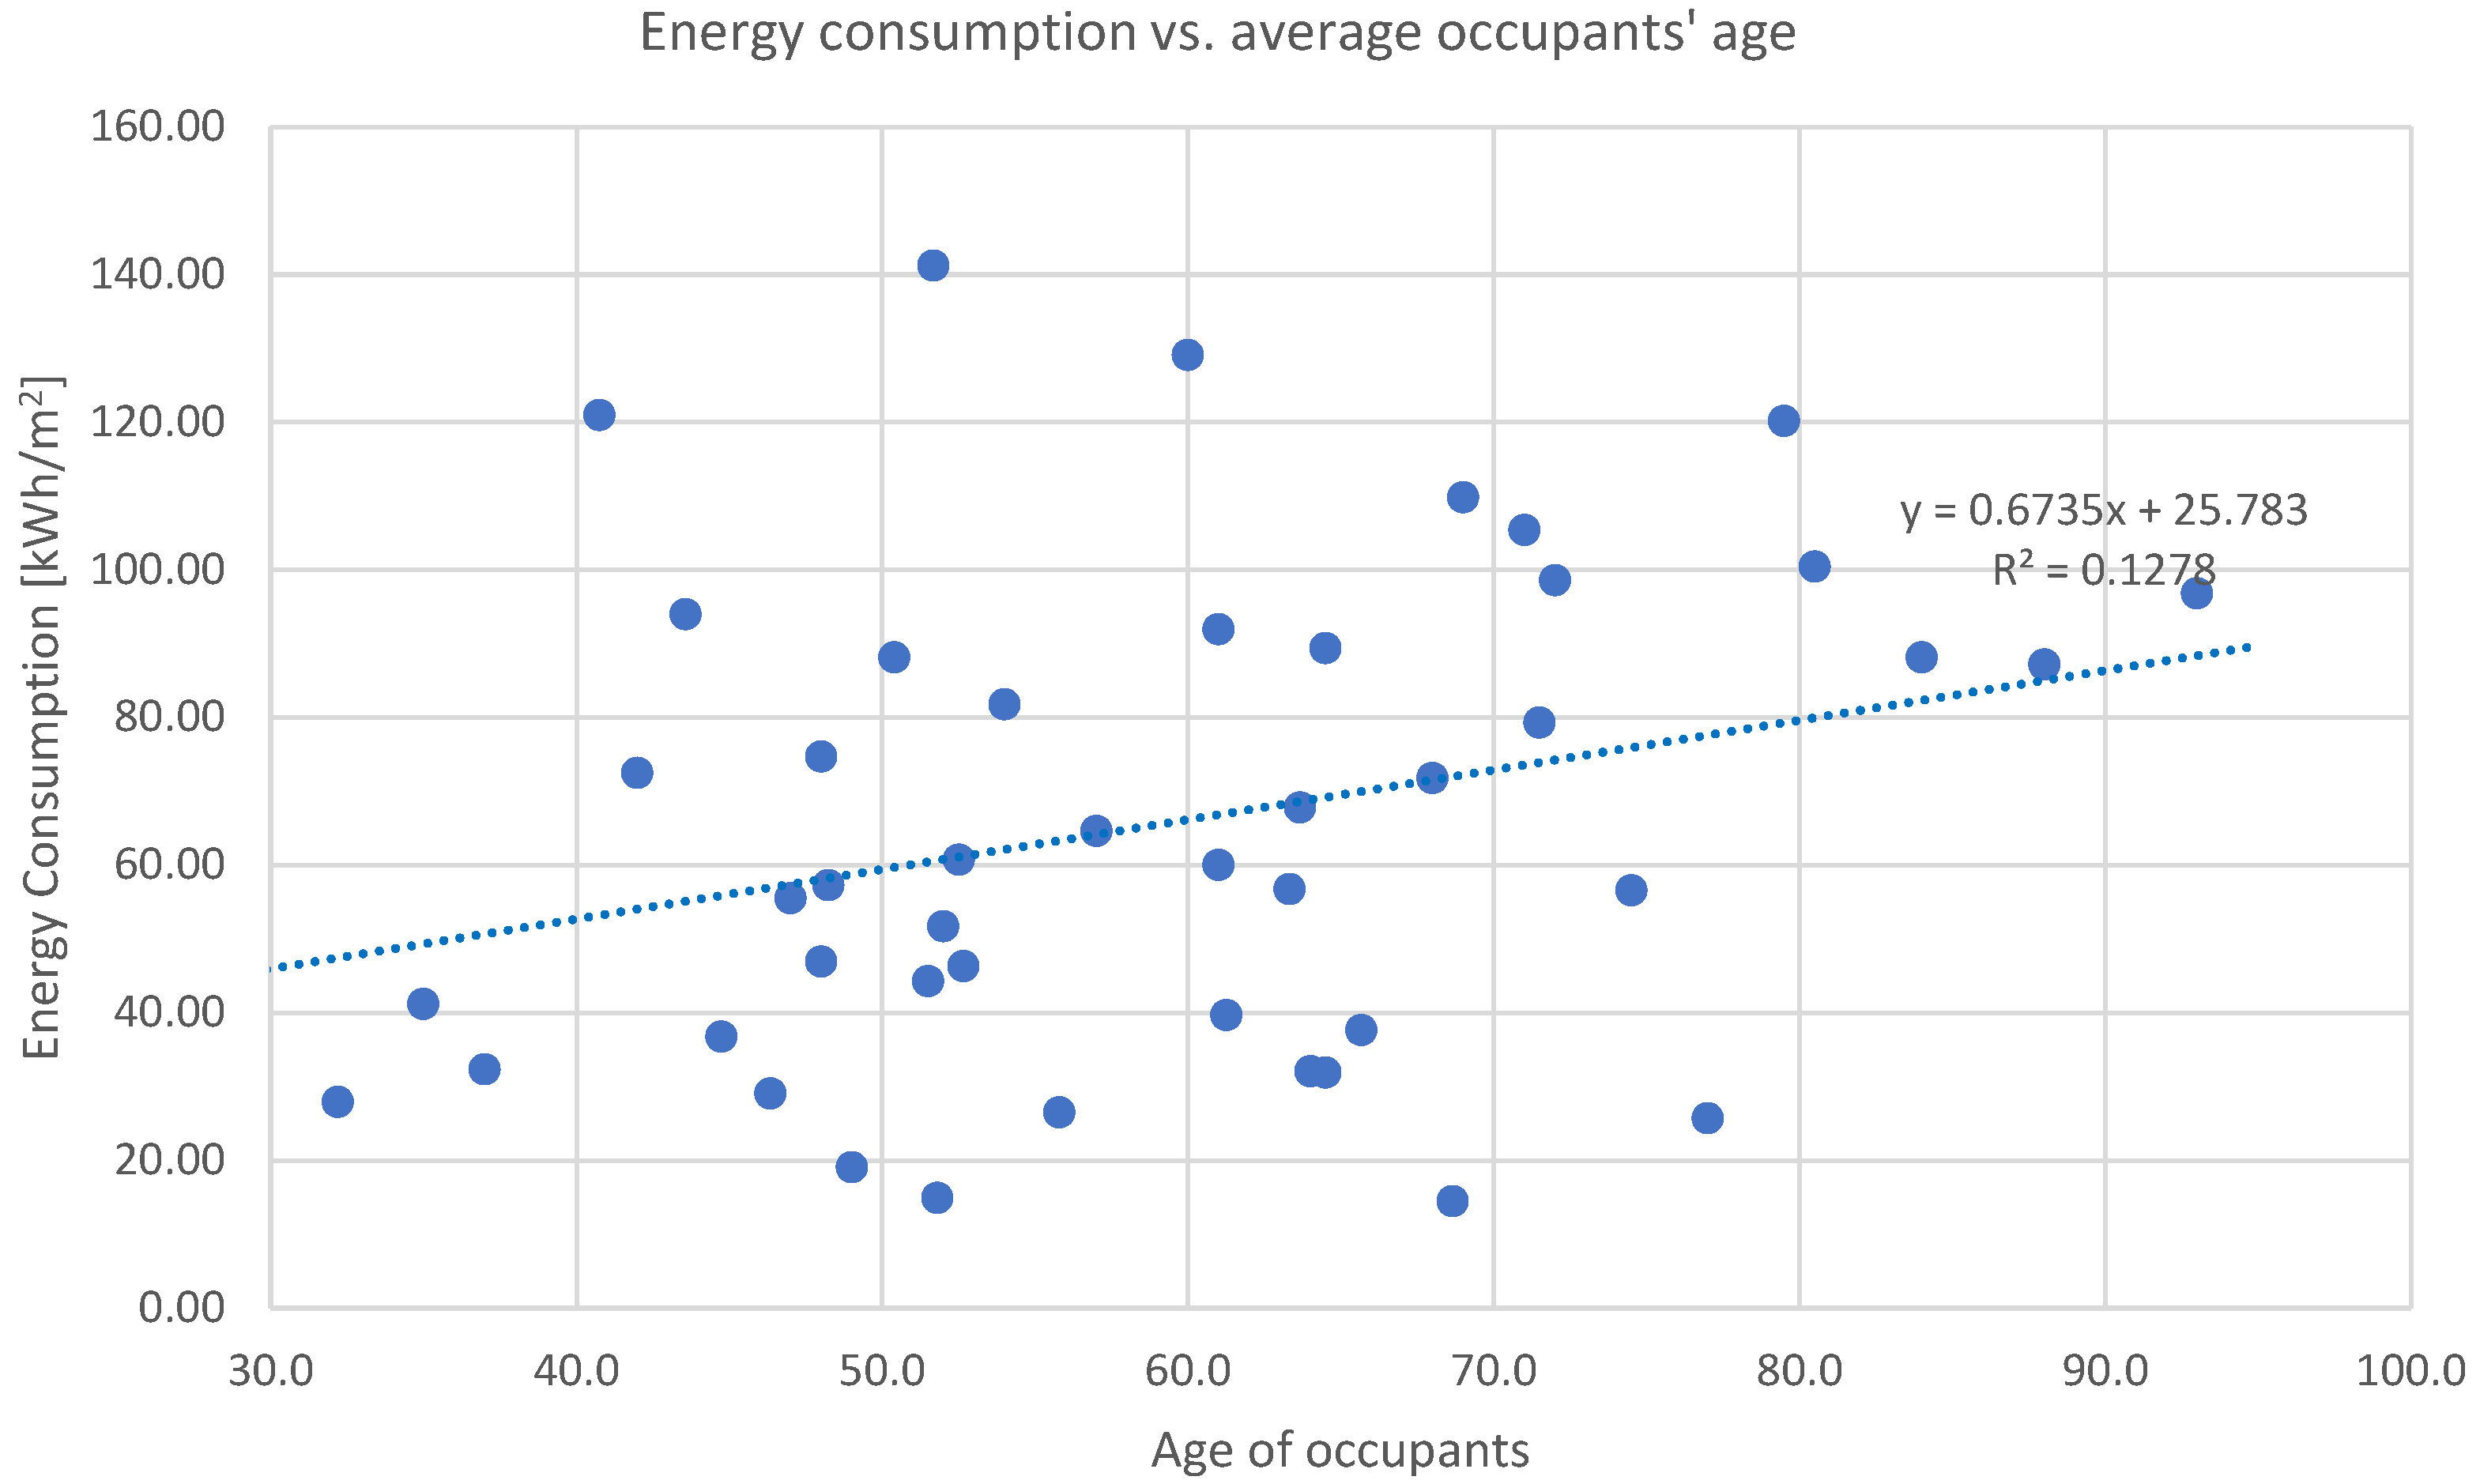
4.1. Effects of Sociodemographic Indicators on Energy Consumptions

A first analysis of the annual energy consumptions of natural gas for heating and Domestic Hot Water (DHW) shows an extreme variability of consumptions among the units. The average energy consumption is 63.4 kWh/m2, while the individual apartments show energy consumptions variable from about 10 kWh/m2 to more than 140 kWh/m2, but with a very high dispersion of values (standard deviation of 32.9 kWh/m2). As shown in Figure 5, it can be noticed that the apartments considered can be clustered into three groups: apartments with energy consumption equal to or lower than 40 kWh/m2 (about 30% of the total), apartments with energy consumption between 40 kWh/m2 and 100 kWh/m2 (about 55% of the total) and apartments with energy consumption of over 100 kWh/m2 (about 15% of the total). Considering that the insulation levels and the efficiency of the heating systems are the same for all the apartments, the differences in the energy consumptions are due to the users’ behaviour, as discussed later.
The analyses performed in this work, and which are described in this section, were carried out considering the effects not only of climate change, but also of demographic changes occurring within the population. In fact, not only the characteristics of the building, but also the number, age and composition of tenants, determine a variation in energy expenditures. Therefore, the assessment of energy poverty presupposes the correlation between demographic indicators and the data obtained by calibrated energy models.
In detail, three correlations were analysed and are presented here:
  • Correlation between heating energy consumption and age of tenants.
  • Correlation between heating energy consumption and number of tenants.
  • Behavioural analysis of tenants and prediction of energy poverty conditions.
From a first analysis, the tenants are constituted of families with a low number of components (2.90 ± 1.57) and a high average age (55.89 ± 17.46). Only in 2 cases out of 50, two families share the same apartment.
The results show a medium to strong positive correlation between energy consumptions and average age of tenants (Pearson’s r = 0.358, p = 0.011). From the analyses summarised in Figure 6, a very high energy consumption is found in apartments where people over 80 years of age reside. In these cases, users will almost certainly be characterised by a domestic profile which implies the constant presence of users inside the apartment. Overall, despite a high dispersion of data (R2 of linear regression equal to 0.1278) and the relatively low number of population values (50 data points), the overall trend highlighted is a linear dependence of energy consumption and average age of tenants, with an energy penalty of about 7 kWh/m2 of annual heating energy consumption for every 10 years of increase of age. This result is particularly important, considering the continuous increase in average age of occupants of the public housing building stock.
The analysis of the correlation between annual energy consumption for heating and number of occupants reveals the absence of a correlation between the two parameters (Pearson’s r = −0.117, p = 0.420). However, analysing the personal data of tenants in apartments with high occupancy levels (5 and 6) and excluding the two apartments shared among two families, in the 83% of cases, there is an occurrence of very low energy consumption (lower than 30 kWh/m2). In most of these cases, we note that the principal tenant still shares the apartment with its own offspring, albeit the latter in adulthood. This phenomenon could be associated with an income condition characterised by inoperability or by the presence of unemployment situations, which forces this situation to happen.

4.2. Calibration of Building Enery Model and Definition of Users’ Behavioural Patterns

The following Table 1 shows the results of the calibration process. As only the heating systems are present in the apartments, the calibration was restricted to the winter period of years 2017–2018 (i.e., from October 2017 to March 2018). For all the apartments, the average annual differences between real and simulated energy consumptions are lower than 10%, as are all the differences between real and simulated energy consumptions in the three measurement periods. The only notable exception is for the measurement period between 31/10/2017 and 14/2/2018 for apartment 2, where the calibration index is slightly higher than 10%.
From the calibration of the thermal model, it can be highlighted that:
  • Apartment 1 is the only one among those analysed which was calibrated using the default settings previously reported.
  • Apartments 2, 8, 9 and 10, on the other hand, required a calibration approach that provided for the gradual reduction in both the setpoint temperature and the system start-up period. This aspect is singular because it indicates lower indoor comfort conditions consequent to potential energy poverty.
  • Apartments 3, 5 and 6, on the contrary, required a calibration approach that provided for the increase in the setpoint temperature and/or of the star-up period.
  • Apartment 4 showed energy consumptions so low as to cover only the production of domestic hot water. Therefore, in the calibrated value, the heating system was switched off at all times. This situation highlights extreme energy poverty issues.
Looking at the potential behavioural pattern of users, it can be, therefore, concluded that, while in 1 case (apt. #4), the heating system appears to be always switched off, in the other 5 cases (apt. #1, #2, #8, #9, #10), the heating systems appear to have been active with setpoint temperature required to avoid health issues [25], but lower than those required to provide comfort conditions. Therefore, according to the parameters presented by Faiella and Lavecchia [26], it is possible to estimate that around 67% of units, comprising 81% of users, are likely to fall below the energy poverty threshold.
Consistently with what was expected, the fuel-poor households are those with a larger family and with older relatives.
It must be noted that low natural gas consumptions may not be indicative of indoor temperatures far from the comfort conditions. Indeed, users in greater economic difficulties may prefer to use electrical devices for heating, as bonuses on electricity bills are usually provided in the case of economic hardship.

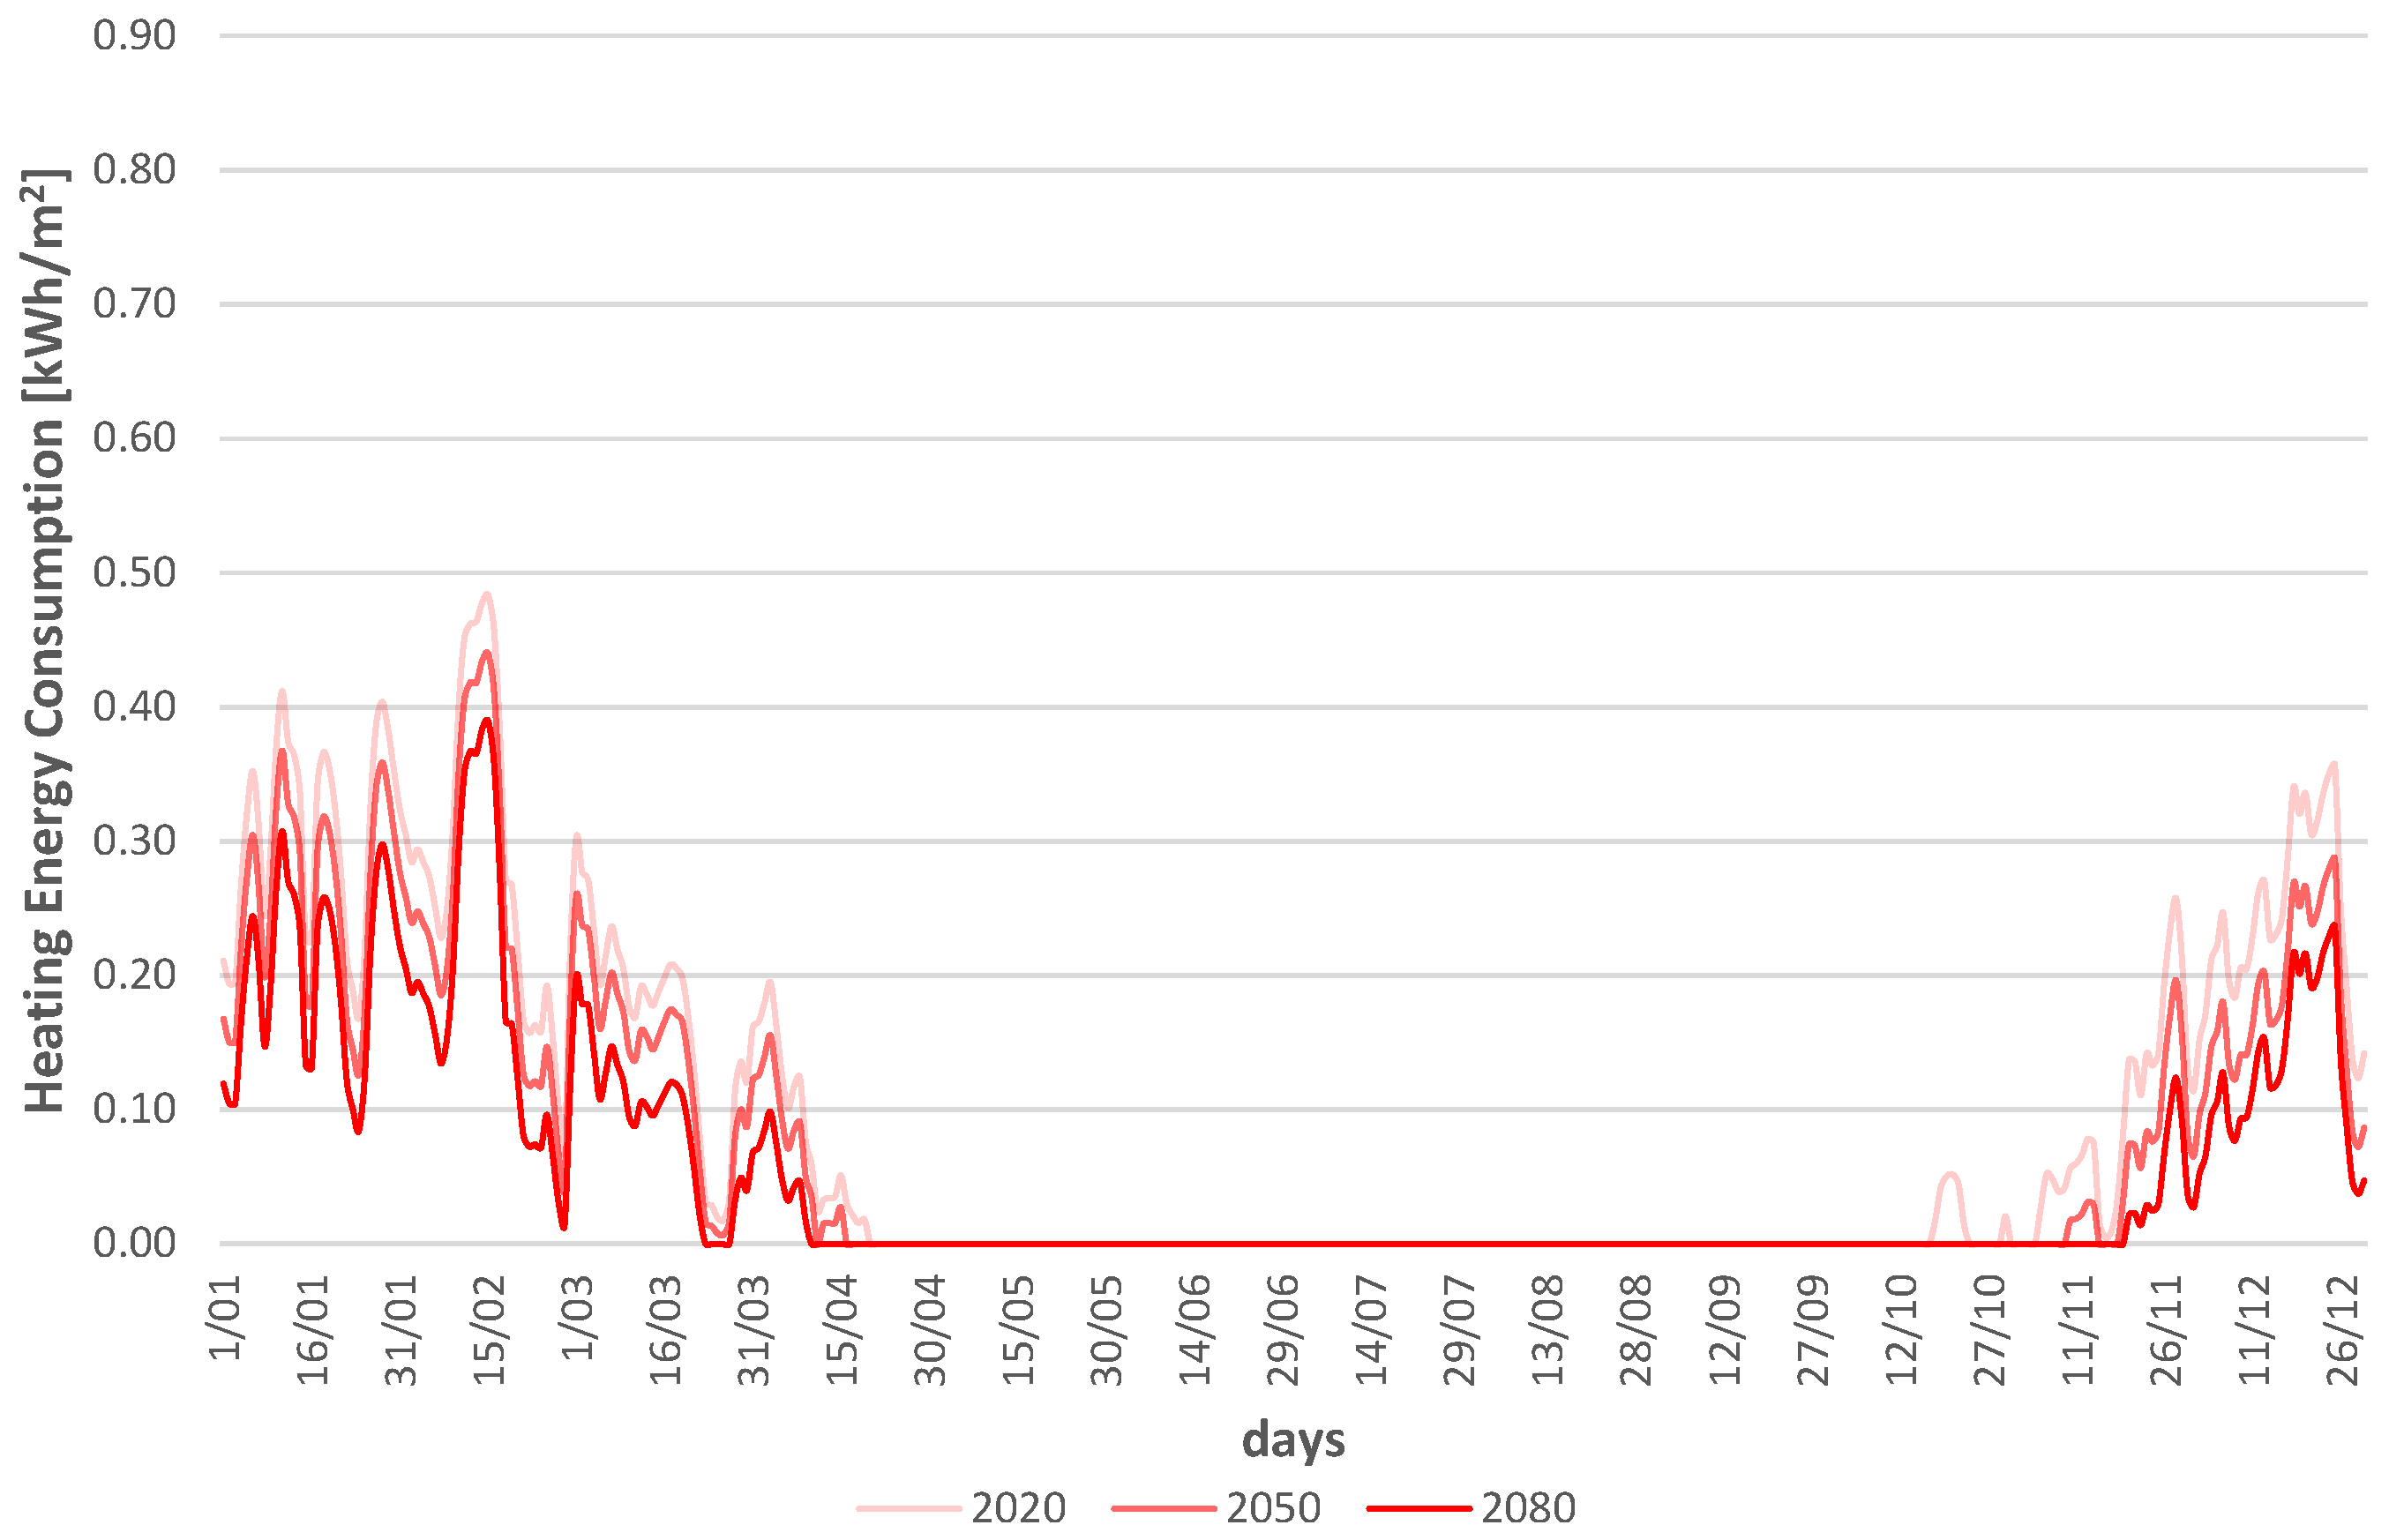
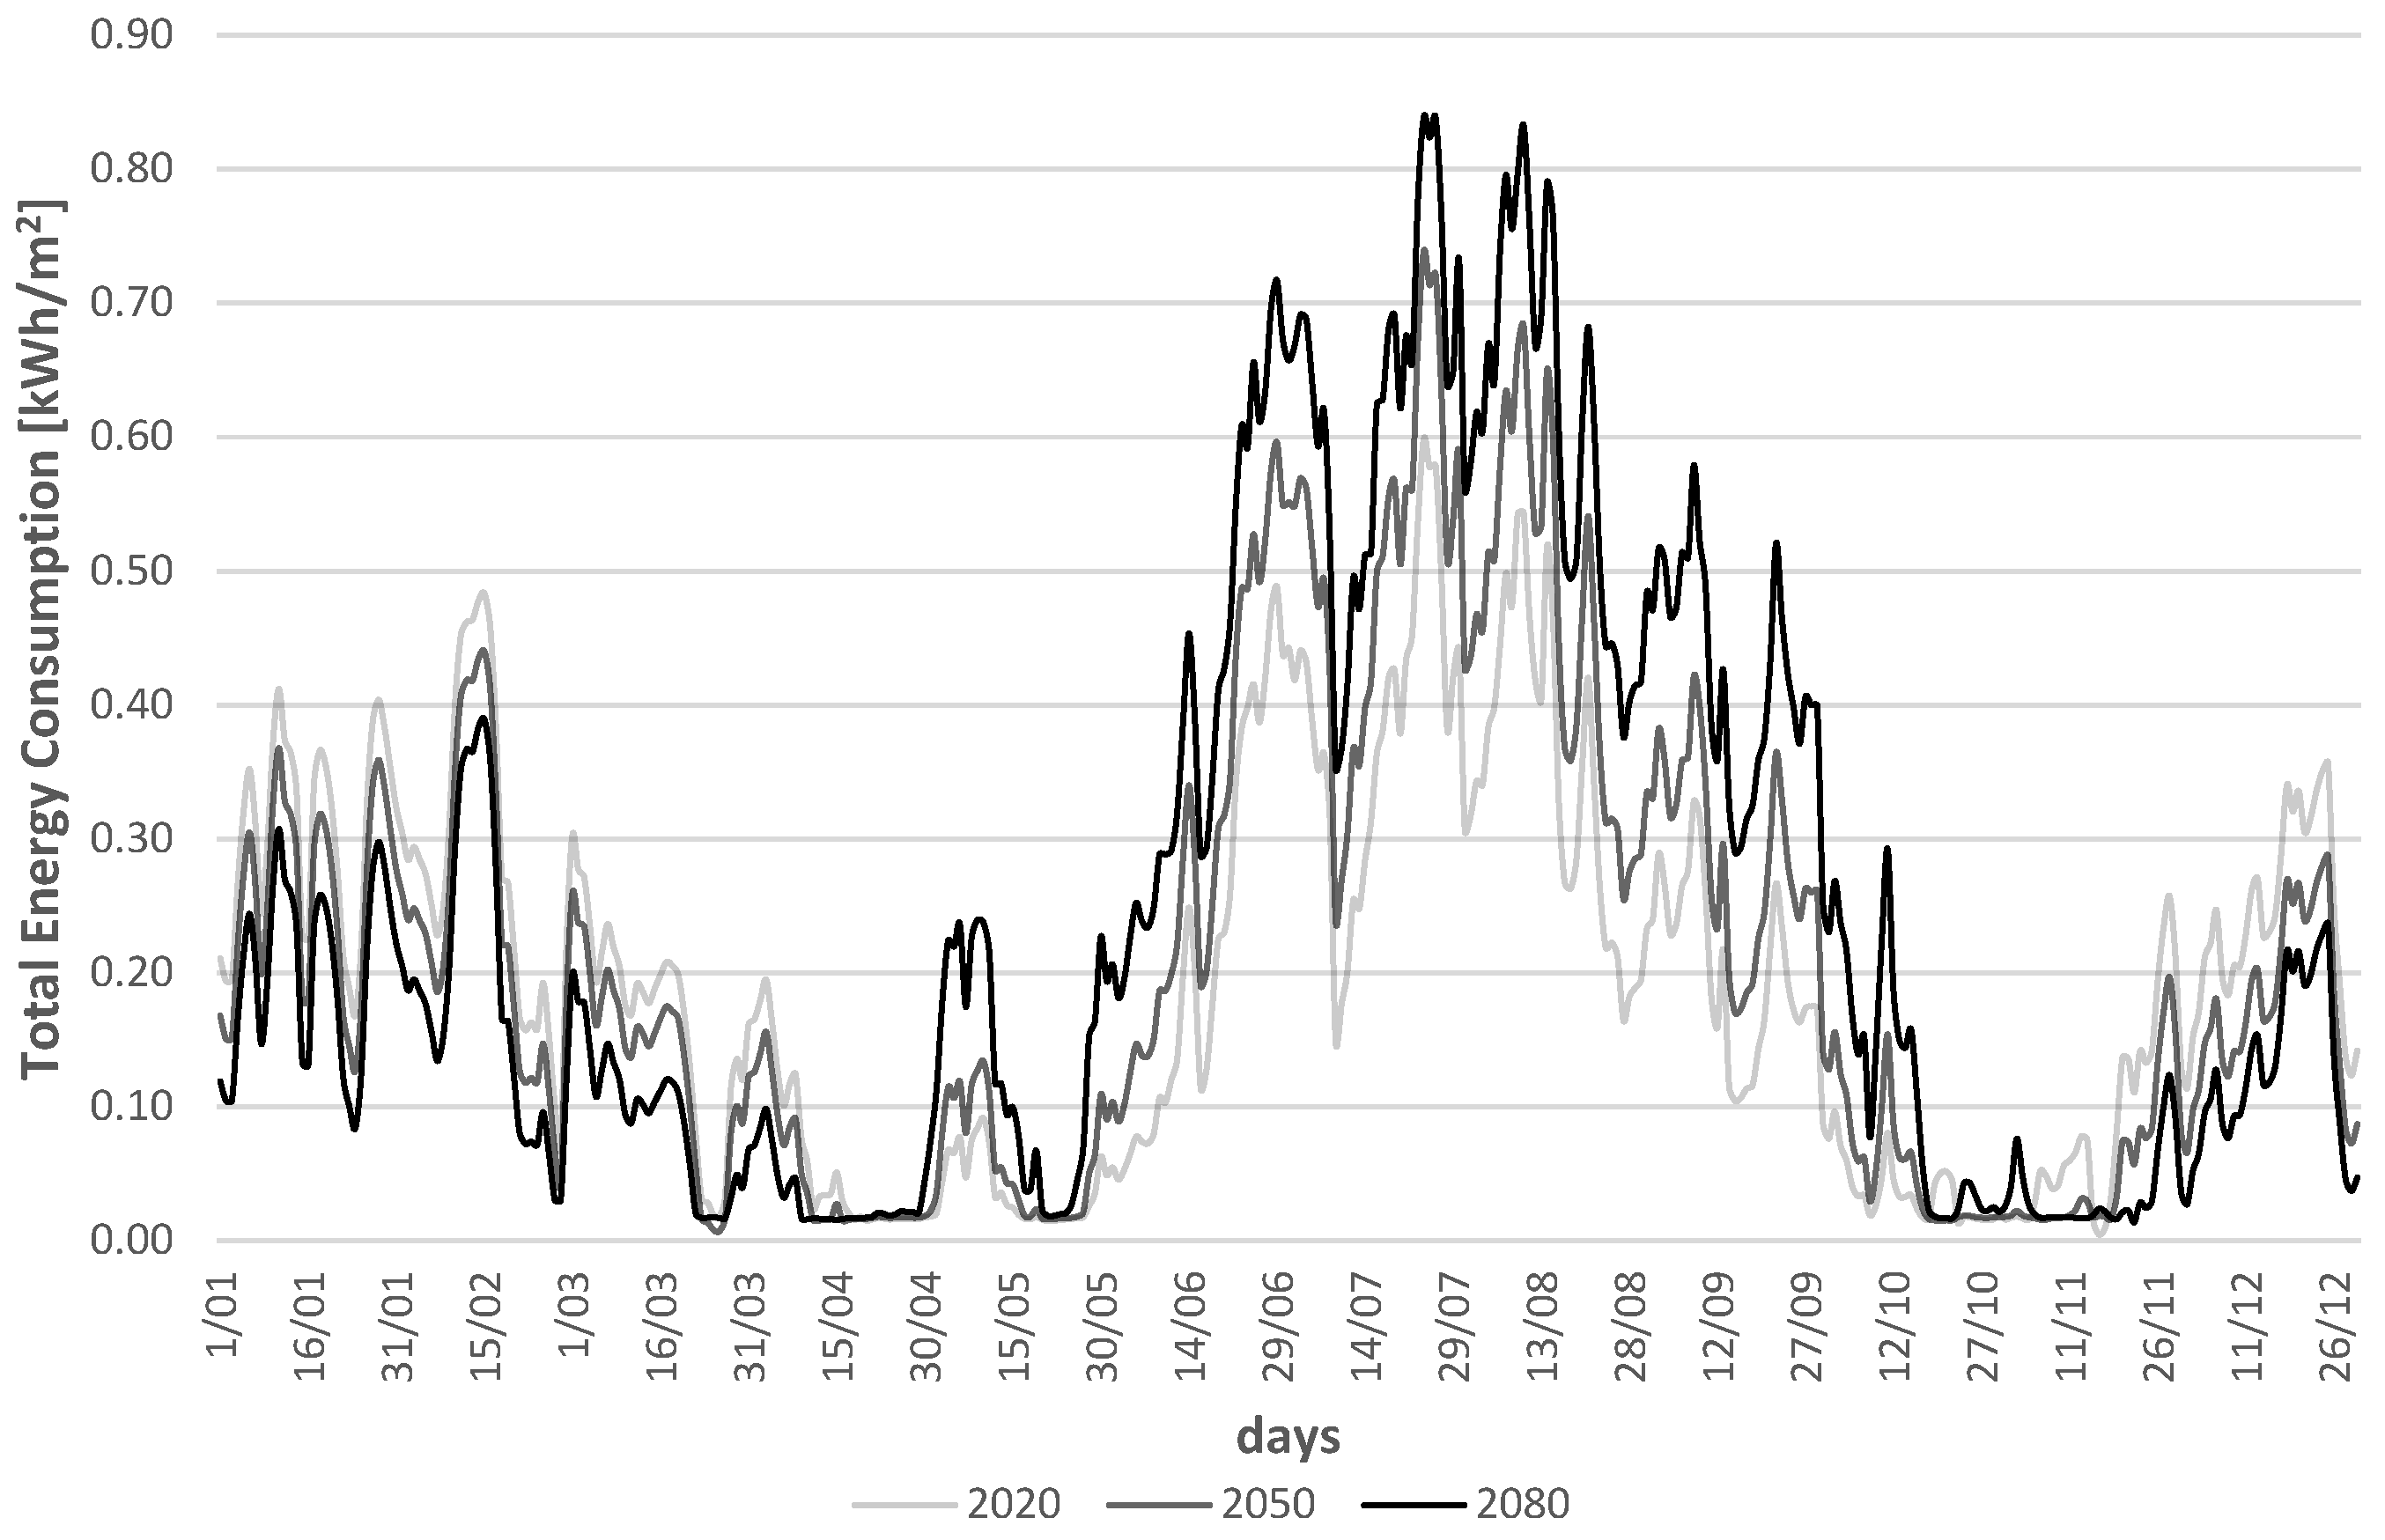
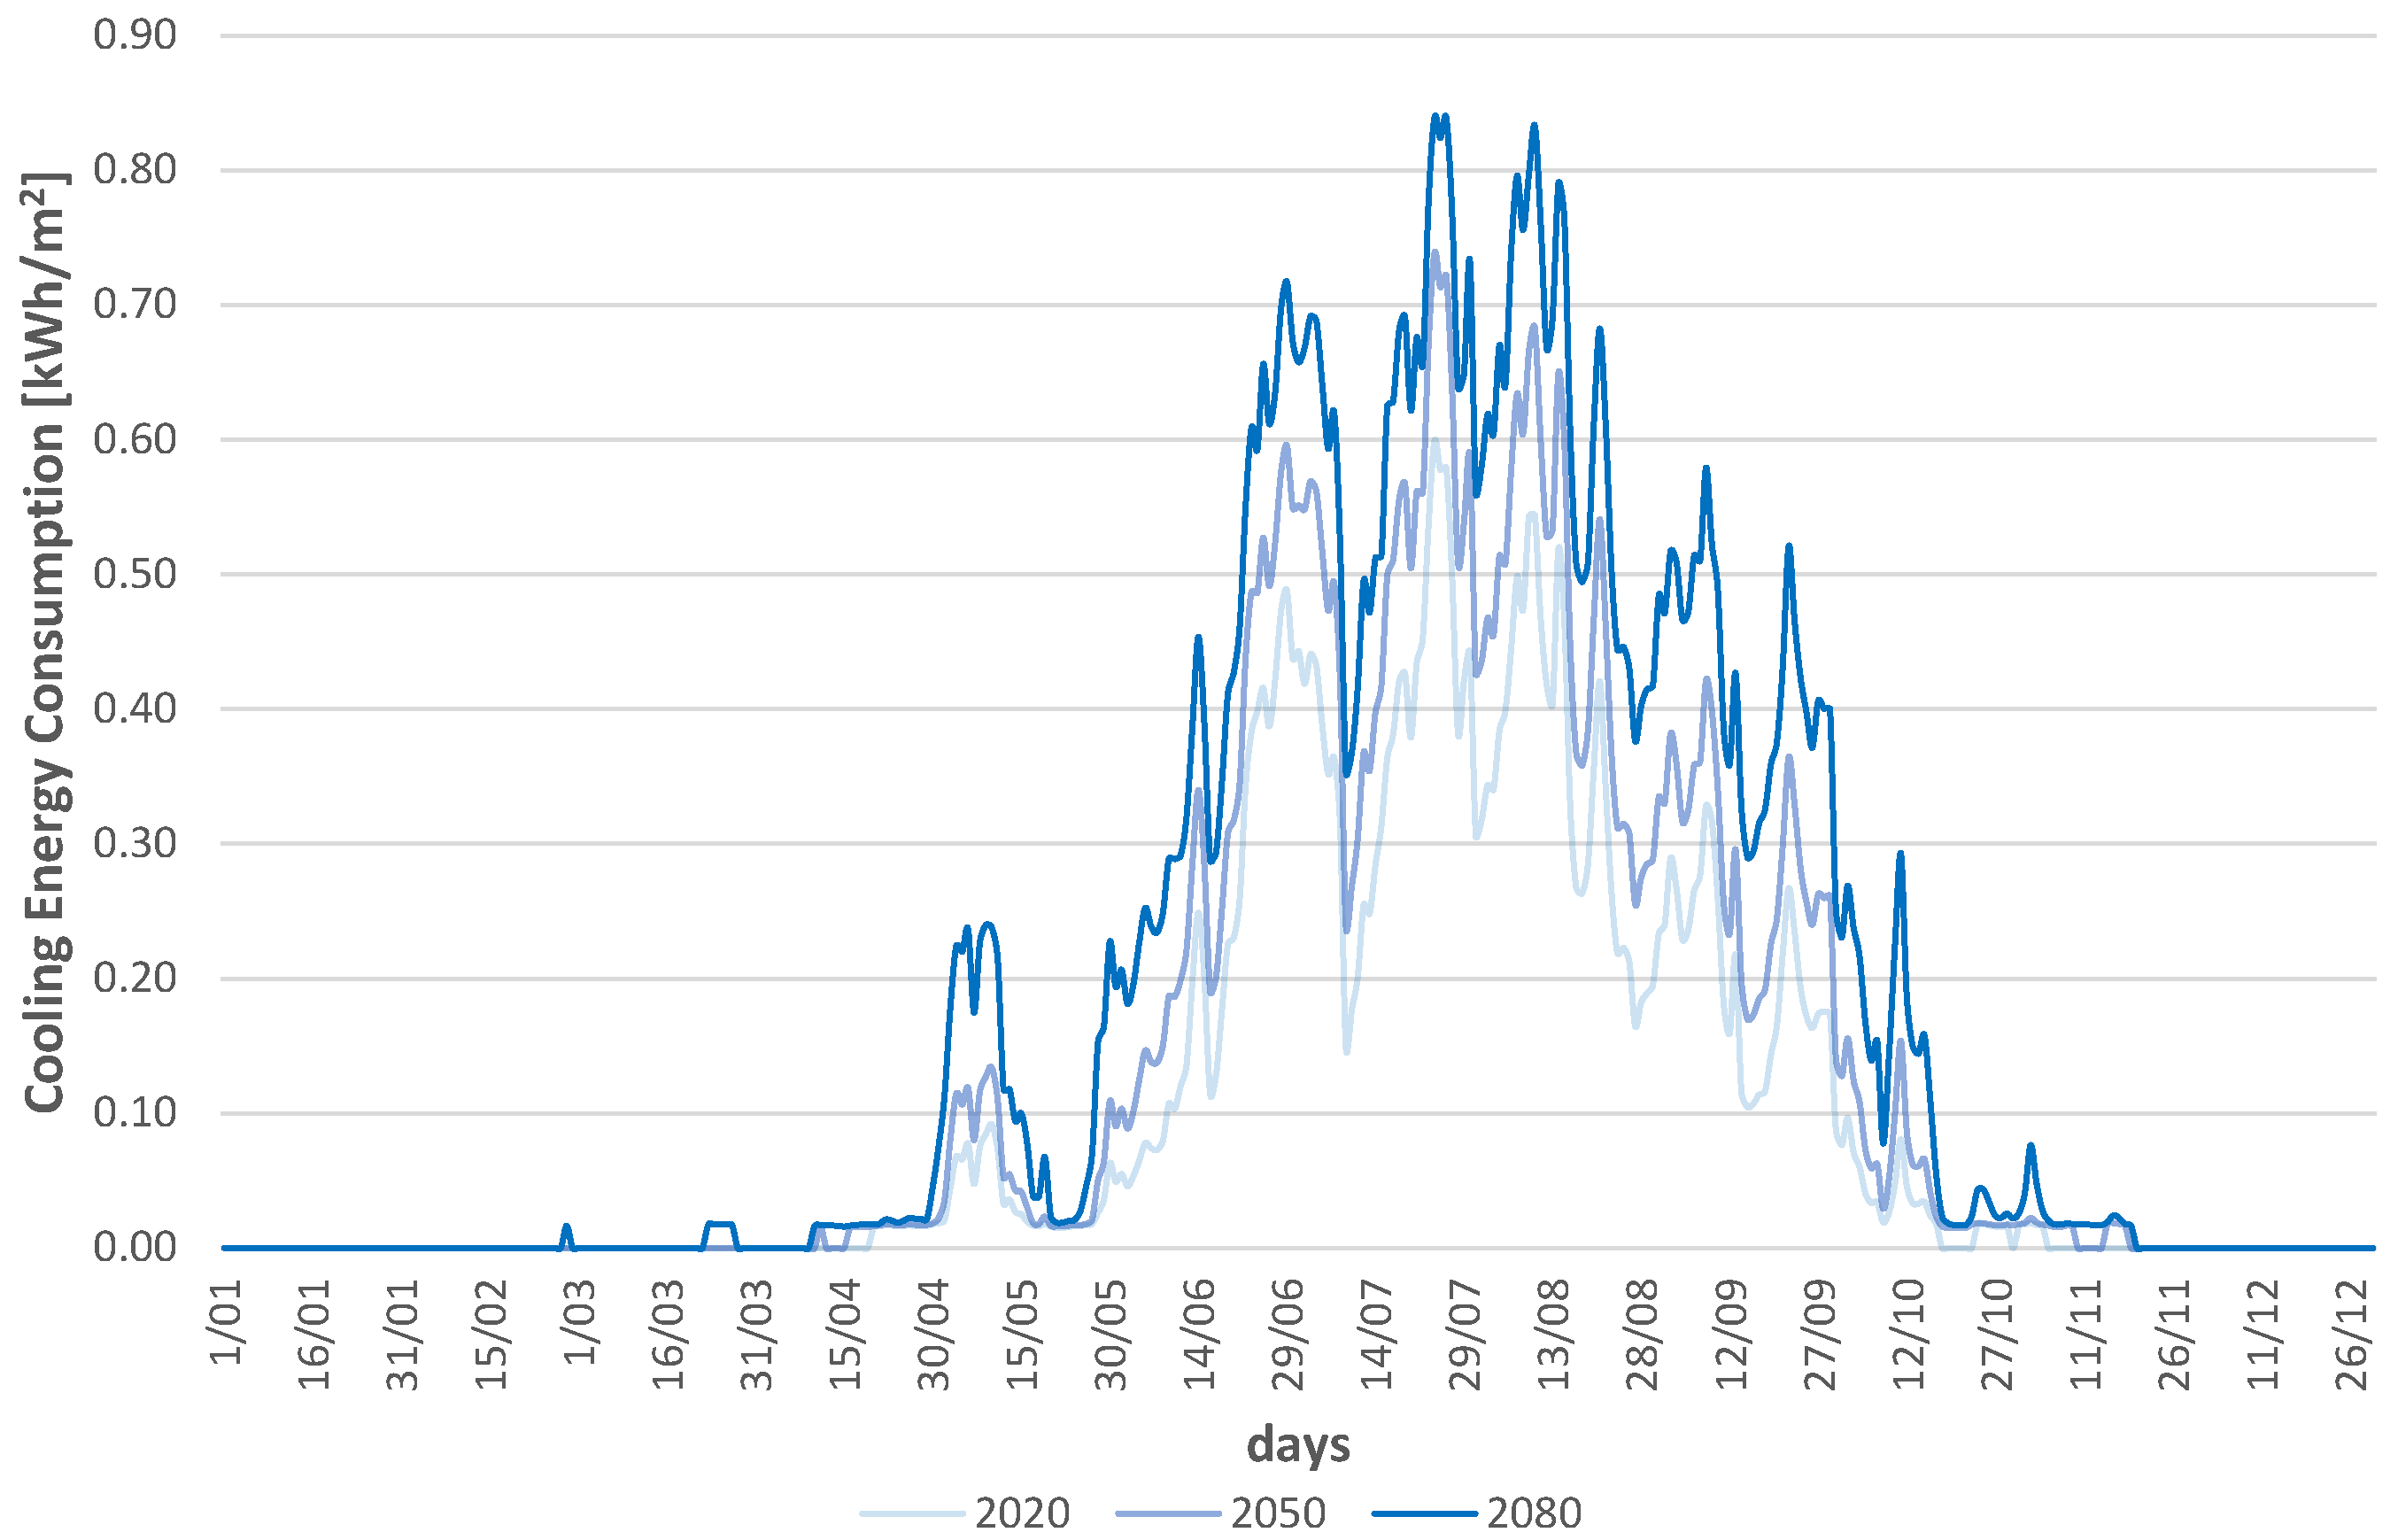
4.3. Climate Change and Future Energy Consumptions

The analysis carried out with respect to climate change took into consideration three future scenarios: short, medium and long term. The climatic files for the years 2020, 2050 and 2080 were generated using the morphing method previously analysed and the CCWorldWeatherGen tool. The energy simulations were performed on the model previously calibrated. As the calibration did not consider any summer air conditioning system, for a realistic prediction of future energy consumptions, a standard air-conditioning based on split systems powered by electricity was modelled.
The results of energy consumptions for cooling and heating were extrapolated from each simulation and then compared for the various periods.
Figure 7, Figure 8 and Figure 9 summarise the results of simulations and include the total energy consumptions and their split in cooling and heating contributions for 2020 (current consumptions) and for 2050 and 2080. According to the results, energy consumption is currently balanced between cooling and heating, although a slight surge is beginning to be noticed, especially in relation to the hottest days of the year. The daily maximum energy consumption for cooling in summer (0.60 kWh/m2) slightly exceeds the daily maximum energy consumption in winter for heating (0.48 kWh/m2). However, the annual energy consumptions are almost balanced (37.50 kWh/m2 for cooling, 34.14 kWh/m2 for heating).
This trend, if further exacerbated in 2050 and 2080, would lead to the limited reduction in heating energy consumptions not being able to balance the increase in cooling energy consumptions. By the comparative analysis of the graphs, it can be highlighted that the reduction between peak heating energy consumptions in 2020 and peak heating energy consumptions in 2050 is about 19%, while the increase in peak cooling energy consumption within the same timeframe is about 40%.
Looking at the annual energy consumptions (Table 2), it can be noticed that, while a reduction of 43.3% of heating energy consumption can be expected between 2020 and 2080, during the same period, an increase of 89.1% of cooling energy consumption is estimated. Overall, an increase of 26% of total energy consumptions is calculated between 2020 and 2080, with an average annual energy penalty of 0.43%.
This phenomenon would lead to an ever-greater diffusion of the use of systems of summer air conditioning, and an ever-greater spread of energy poverty within poor neighbourhoods.

5. Discussion and Conclusions

The study of energy poverty and of the measures to mitigate this problem, thanks also to the directives promoted by the European Union, has meant that numerous researchers and policymakers are focusing on how to overcome this problem through different methodologies. Most European countries are affected by energy poverty and energy insecurity due to different forcing factors. Italy, in particular, is affected by energy poverty which, according to Betto et al. [47], corresponds to an increased number of people forced to reduce their energy expenditure. DellaValle’s study [48] showed that there is a link between energy poverty and user behaviour, and that energy poverty can be improved by certain actions on the part of users. Climate change is another important issue which affects energy poverty. As several studies have shown, climate change is affecting human health and heat stress is causing more and more deaths [49,50,51]. Energy efficiency is part of this wide-ranging discussion at a time when the oldest and poorest buildings are also those that consume the most and protect the least against climate change. This situation, therefore, translates into higher energy expenditure by householders who, if in a precarious condition, will unfortunately not be able to meet their own needs.
At the European level, there are still no precise indicators, shared by the whole community, and the univocal and quantitative definition of energy poverty is the first problem that is encountered to carry out a thorough study. In this work, we wanted to define a new method that would use, rather than statistical data of an economic nature, an approach linked to the definition of the use of real building services. The practical approach, indeed, gives access to a series of important information for the assessment of situations of energy poverty, as it is necessary to evaluate not only the economic approach relating to consumption, but also the relationship that exists between occupants’ behaviour, plant performance and number of users. According to this sociodemographic indicator, only 30% of the households set an 18 °C setpoint temperature, turning on the heating system for an average of 3 h per day. Moreover, the average age strongly affects the energy consumption. These parameters indicate that 67% of the households are fuel-poor. However, the results obtained, with the use of the energy analysis methodology, only represent the starting point for further analyses with larger fields of investigation.
The future weather simulations showed that the current energy consumption is quite balanced between heating consumption in winter and cooling consumption in summer. On the other hand, from 2020 onwards, there is a turnaround that leads to an increase in cooling consumptions due to the increasing temperatures and a consequent reduction in heating energy consumption. In the extreme scenario, almost the entire energy consumption is affected by cooling. In 2050, the energy consumption will increase by 8.9% with respect to 2020, and in 2080, consumption will increase by 15.7% with respect to 2050.
These findings are an asset for policy makers to carry out redevelopment programs of poor neighbourhoods, where the spread of energy poverty is significant. Moreover, the problems due to future global warming and its impact on domestic energy poverty should not be overlooked, to define resolution actions. The identification of the redevelopment interventions characterised by an optimal performance profile is strongly influenced by the typological and technological characteristics of the building, and by the assumed climatic scenarios. As these factors vary, performance differences may occur, and an accurate assessment is required to avoid sub-optimal efficiency solutions. Consequently, it is appropriate to evaluate energy efficiency measures of existing buildings, taking into consideration also the effects of climate change on the various building types, period of construction and climatic and microclimatic contexts.

Author Contributions

Conceptualization, F.F.; methodology, F.F. and V.S.; formal analysis, G.V. and V.S.; resources, V.S. and C.C.; writing—original draft preparation, G.V. and F.F.; writing—review and editing, V.S. and C.C.; project administration, F.F. All authors have read and agreed to the published version of the manuscript.

Funding

This research received no external funding.

Conflicts of Interest

The authors declare no conflict of interest.

References

  1. Middlemiss, L.; Ambrosio-Albalá, P.; Emmel, N.; Gillard, R.; Gilbertson, J.; Hargreaves, T.; Mullen, C.; Ryan, T.; Snell, C.; Tod, A. Energy poverty and social relations: A capabilities approach. Energy Res. Soc. Sci. 2019, 55, 227–235. [Google Scholar] [CrossRef]
  2. Bouzarovski, S.; Thomson, H.; Cornelis, M. Confronting Energy Poverty in Europe: A Research and Policy Agenda. Energies 2021, 14, 858. [Google Scholar] [CrossRef]
  3. Trinomics. Selecting Indicators to Measure Energy Poverty; ENER/A47516-2014. 2016. Available online: https://energy.ec.europa.eu/selecting-indicators-measure-energy-poverty_en (accessed on 7 February 2022).
  4. Scarpellini, S.; Rivera-Torres, P.; Suárez-Perales, I.; Aranda-Usón, A. Analysis of energy poverty intensity from the perspective of the regional administration: Empirical evidence from households in southern Europe. Energy Policy 2015, 86, 729–738. [Google Scholar] [CrossRef] [Green Version]
  5. Economidou, M.; Ringel, M.; Valentova, M.; Zancanella, P.; Tsemekidi-Tzeiranaki, S.; Zangheri, P.; Paci, D.; Serrenho, T. National Energy and Climate Plans for 2021–2030 under the EU Energy Union: Assessment of the Energy Efficiency Dimension; Publications Office of the European Union: Luxembourg, 2020. [Google Scholar] [CrossRef]
  6. European National Energy and Climate Plans (NECPs). Available online: https://energy.ec.europa.eu/topics/energy-strategy/national-energy-and-climate-plans-necps_en (accessed on 7 February 2022).
  7. Jessel, S.; Sawyer, S.; Hernández, D. Energy, Poverty, and Health in Climate Change: A Comprehensive Review of an Emerging Literature. Front. Public Health 2019, 7, 357. [Google Scholar] [CrossRef] [PubMed] [Green Version]
  8. Public Health England. Local Action on Health Inequalities: Fuel Poverty and Cold Home-Related Health Problems. Health Equity Evidence Review 7; UCL Institute of Health Equity: London, UK, 2014. [Google Scholar]
  9. Santamouris, M. Innovating to zero the building sector in Europe: Minimising the energy consumption, eradication of the energy poverty and mitigating the local climate change. Sol. Energy 2016, 128, 61–94. [Google Scholar] [CrossRef]
  10. Santamouris, M. Minimizing Energy Consumption, Energy Poverty and Global and Local Climate Change in the Built Environment: Innovating to Zero; Elsevier: Amsterdam, The Netherlands, 2019. [Google Scholar]
  11. Campagna, L.M.; Fiorito, F. On the Impact of Climate Change on Building Energy Consumptions: A Meta-Analysis. Energies 2022, 15, 354. [Google Scholar] [CrossRef]
  12. Dubois, U.; Meier, H. Energy affordability and energy inequality in Europe: Implications for policymaking. Energy Res. Soc. Sci. 2016, 18, 21–35. [Google Scholar] [CrossRef]
  13. Castaño-Rosa, R.; Solís-Guzmán, J.; Rubio-Bellido, C.; Marrero, M. Towards a multiple-indicator approach to energy poverty in the European Union: A review. Energy Build. 2019, 193, 36–48. [Google Scholar] [CrossRef]
  14. Liddell, C.; Morris, C. Fuel poverty and human health: A review of recent evidence. Energy Policy 2010, 38, 2987–2997. [Google Scholar] [CrossRef]
  15. Wilkinson, P.; Landon, M.; Armstrong, B.; Stevenson, S.; Pattenden, S.; McKee, M.; Fletcher, T. Cold Comfort. The Social and Environmental Determinants of Exceess Winter Deaths in England, 1986–1996; The Policy Press: Bristol, UK, 2001. [Google Scholar]
  16. Bull, A.; Mahmood, H.; Cush, N. Identifying people at risk of fuel poverty to prevent excess winter deaths. Nurs. Times 2010, 106, 12–13. [Google Scholar] [PubMed]
  17. Okushima, S. Understanding regional energy poverty in Japan: A direct measurement approach. Energy Build. 2019, 193, 174–184. [Google Scholar] [CrossRef]
  18. Sanchez-Guevara, C.; Núñez Peiró, M.; Taylor, J.; Mavrogianni, A.; Neila González, J. Assessing population vulnerability towards summer energy poverty: Case studies of Madrid and London. Energy Build. 2019, 190, 132–143. [Google Scholar] [CrossRef] [Green Version]
  19. Thomson, H.; Simcock, N.; Bouzarovski, S.; Petrova, S. Energy poverty and indoor cooling: An overlooked issue in Europe. Energy Build. 2019, 196, 21–29. [Google Scholar] [CrossRef] [Green Version]
  20. Oliveira Panão, M.J.N. Lessons learnt from using energy poverty expenditure-based indicators in a mild winter climate. Energy Build. 2021, 242, 110936. [Google Scholar] [CrossRef]
  21. Scarpellini, S.; Alexia Sanz Hernández, M.; Moneva, J.M.; Portillo-Tarragona, P.; Rodríguez, M.E.L. Measurement of spatial socioeconomic impact of energy poverty. Energy Policy 2019, 124, 320–331. [Google Scholar] [CrossRef]
  22. OECD. Social Housing: A Key Part of Past and Future Housing Policy; OECD: Paris, France, 2020. [Google Scholar]
  23. CEB. Housing Inequality in Europe. Tackling Inequalities in Europe: The Role of Social Investment; CEB: Paris, France, 2017. [Google Scholar]
  24. European Commission. EU Energy Poverty Observatory. Available online: https://www.energypoverty.eu/indicators-data (accessed on 29 March 2021).
  25. Faiella, I.; Lavecchia, L. Energy Poverty in Italy. Politica Econ. 2015, 31, 27–76. [Google Scholar] [CrossRef]
  26. Faiella, I.; Lavecchia, L. Energy poverty. How can you fight it, if you can’t measure it? Energy Build. 2021, 233, 110692. [Google Scholar] [CrossRef]
  27. European Parliament Directorate General for Internal Policies. Energy Efficiency for Low-Income Households; European Parliament: Brussels, Belgium, 2016. [Google Scholar]
  28. Italian Law nr. 373 of 30/04/1976. Rules for Thermal Energy Consumptions in Buildings; 1976.
  29. ISTAT. Italian Institute of Statistics. Open Data Platform. Available online: www.istat.it (accessed on 18 July 2020).
  30. ORCA Puglia. Regional Observatory on Housing Conditions. Available online: http://old.regione.puglia.it/web/orca (accessed on 16 March 2022).
  31. Di Biagi, P. La Grande Ricostruzione: Il Piano Ina-Casa e l’Italia Degli Anni Cinquanta; Donzelli: Rome, Italy, 2001. [Google Scholar]
  32. Hassani, H.; Yeganegi, M.R.; Beneki, C.; Unger, S.; Moradghaffari, M. Big data and energy poverty alleviation. Big Data Cogn. Comput. 2019, 3, 50. [Google Scholar] [CrossRef] [Green Version]
  33. Horta, A.; Gouveia, J.P.; Schmidt, L.; Sousa, J.C.; Palma, P.; Simões, S. Energy poverty in Portugal: Combining vulnerability mapping with household interviews. Energy Build. 2019, 203, 109423. [Google Scholar] [CrossRef] [Green Version]
  34. Robinson, C.; Yan, D.; Bouzarovski, S.; Zhang, Y. Energy poverty and thermal comfort in northern urban China: A household-scale typology of infrastructural inequalities. Energy Build. 2018, 177, 363–374. [Google Scholar] [CrossRef]
  35. Romero, J.C.; Linares, P.; López, X. The policy implications of energy poverty indicators. Energy Policy 2018, 115, 98–108. [Google Scholar] [CrossRef]
  36. Ortiz, J.; Casquero-Modrego, N.; Salom, J. Health and related economic effects of residential energy retrofitting in Spain. Energy Policy 2019, 130, 375–388. [Google Scholar] [CrossRef]
  37. Longhi, S. Residential energy expenditures and the relevance of changes in household circumstances. Energy Econ. 2015, 49, 440–450. [Google Scholar] [CrossRef] [Green Version]
  38. DesignBuilder v.7.0. Available online: https://designbuilder.co.uk/ (accessed on 21 April 2020).
  39. Singh, S.; Martinez Arias, A.; Kensek, K.; Schiler, M. Comparison of two different simulation programs while calibrating the same building. In Proceedings of the SIMBUILD 2012, Madison, WI, USA, 1–3 August 2012. [Google Scholar]
  40. ARPA Puglia. Official Website. Available online: www.arpa.puglia.it (accessed on 21 April 2020).
  41. ASHRAE. Guideline 14-2014: Measurement of Energy, Demand, and Water Savings; ASHRAE: Atlanta, GA, USA, 2014. [Google Scholar]
  42. Jentsch, M.F.; James, P.A.B.; Bourikas, L.; Bahaj, A.S. Transforming existing weather data for worldwide locations to enable energy and building performance simulation under future climates. Renew. Energy 2013, 55, 514–524. [Google Scholar] [CrossRef]
  43. Jentsch, M.F.; Bahaj, A.S.; James, P.A.B. Climate change future proofing of buildings—Generation and assessment of building simulation weather files. Energy Build. 2008, 40, 2148–2168. [Google Scholar] [CrossRef]
  44. IPCC. Emissions Scenarios. A Special Report of IPCC Working Group III; IPCC Special Report; Intergovernmental Panel on Climate Change: Geneva, Switzerland, 2000. [Google Scholar]
  45. Jahanbani, H.; Shui, L.T.; Bavani, A.M.; Ghazali, A.H. Uncertainty of climate change and its impact on reference evapotranspiration in Rasht City, Iran. J. Water Clim. Chang. 2011, 2, 72–83. [Google Scholar] [CrossRef]
  46. IPCC. Contribution of Working Groups I, II and III to the Fifth Assessment Report of the Intergovernmental Panel on Climate Change; Climate Change 2014: Syntesis Report; IPCC: Geneva, Switzerland, 2014; p. 151. [Google Scholar]
  47. Betto, F.; Garengo, P.; Lorenzoni, A. A new measure of Italian hidden energy poverty. Energy Policy 2020, 138, 111237. [Google Scholar] [CrossRef]
  48. DellaValle, N. People’s decisions matter: Understanding and addressing energy poverty with behavioral economics. Energy Build. 2019, 204, 109515. [Google Scholar] [CrossRef]
  49. Santamouris, M. Recent progress on urban overheating and heat island research. Integrated assessment of the energy, environmental, vulnerability and health impact. Synergies with the global climate change. Energy Build. 2020, 207, 109482. [Google Scholar] [CrossRef]
  50. Vardoulakis, S.; Dear, K.; Hajat, S.; Heaviside, C.; Eggen, B.; McMichael, A.J. Comparative assessment of the effects of climate change on heat- and cold-related mortality in the United Kingdom and Australia. Environ. Health Perspect. 2015, 122, 1285–1292. [Google Scholar] [CrossRef] [Green Version]
  51. Gronlund, C.J.; Sullivan, K.P.; Kefelegn, Y.; Cameron, L.; O’Neill, M.S. Climate change and temperature extremes: A review of heat- and cold-related morbidity and mortality concerns of municipalities. Maturitas 2018, 114, 54–59. [Google Scholar] [CrossRef] [PubMed]
Figure 1. Frequency distribution of population age within the case of study in comparison with the distribution of population in public housing building stock of Bari.
Climate 10 00055 g001
Figure 2. Aerial view of the area of study. Source: Google MapsTM.
Climate 10 00055 g002
Figure 3. Layout of the typical floor (not to scale).
Climate 10 00055 g003
Figure 4. 3D representation of the building energy model.
Climate 10 00055 g004
Figure 5. Frequency distribution of annual energy consumption for heating and DHW of the buildings.
Climate 10 00055 g005
Figure 6. Relationship between energy consumption for heating and age of occupants of the building.
Climate 10 00055 g006
Figure 7. Comparison of total energy consumption of the building for the future scenarios.
Climate 10 00055 g007
Figure 8. Comparison of cooling energy consumption of the building for the future scenarios.
Climate 10 00055 g008
Figure 9. Comparison of heating energy consumption of the building for the future scenarios.
Climate 10 00055 g009
Table 1. Values of simulated and real energy consumptions, of the calibration index k and of behavioural patterns.
Apt. nr.Measurement PeriodCO
[kWh]
CE
[kWh]
k
[%]
Heating
Setpoint T [°C]
System
Ignition Time [h]
Nr. of
Occupants
Ave Age of
Occupants
[y]
101 October 2017–30 October 20174.034.000.79
31 October 2017–14 February 201824.2926.61−8.72
15 February 2018–31 March 201816.3315.326.60
Average18.9820.09−5.5220.79251.5
201 October 2017–30 October 20171.481.50−0.91
31 October 2017–14 February 20189.768.6712.61
15 February 2018–31 March 201815.3015.180.74
average9.779.107.35182237.0
301 October 2017–30 October 20176.505.939.76
31 October 2017–14 February 201830.7432.39−5.12
15 February 2018–31 March 201820.0519.562.53
average24.1024.86−3.0525.39248.0
401 October 2017–30 October 20173.193.073.89
31 October 2017–14 February 20183.633.600.84
15 February 2018–28 February 20182.762.702.27
average3.343.291.60-0368.7
501 October 2017–30 October 20174.314.183.21
31 October 2017–14 February 201847.1950.66−6.84
15 February 2018–31 March 201846.9550.73−7.44
average40.0743.02−6.862624188.0
601 October 2017–30 October 20173.072.905.75
31 October 2017–14 February 201839.7442.68−6.89
15 February 2018–31 March 201832.2130.107.01
average31.8333.01−3.57269193.0
801 October 2017–30 October 20173.093.26−5.12
31 October 2017–14 February 20188.808.671.56
15 February 2018–31 March 20188.108.89−8.79
average7.697.83−1.80199346.3
901 October 2017–30 October 20177.758.05−3.79
31 October 2017–14 February 201815.3314.773.80
15 February 2018–31 March 201812.3912.89−3.87
average13.3513.191.18184452.5
1001 October 2017–30 October 20179.409.52−1.19
31 October 2017–14 February 201814.4913.675.99
15 February 2018–31 March 201813.3414.68−9.18
average13.3713.240.98182352.7
Table 2. Heating, cooling and total energy consumptions of the building in 2020, 2050 and 2080.
Energy Consumption [kWh/m2]Variation [%]
2020205020802020–20502050–20802020–2080
Heating34.1326.6319.35−22.0−27.3−43.3
Cooling37.5051.3570.8937.038.089.1
Total71.6377.9990.248.915.726.0
Publisher’s Note: MDPI stays neutral with regard to jurisdictional claims in published maps and institutional affiliations.

