1. Introduction
Sea surface temperature (SST) is an “essential climate variable” for understanding our climate system and its evolution [
1]. On short timescales, it affects the meteorological weather, while, on interannual and longer periods, it fundamentally contributes to shaping prominent climate patterns like the El Niño–Southern Oscillation (ENSO) and the Pacific Decadal Oscillation (PDO) (e.g., [
2]). Its knowledge allows for quantifying the exchanges between the ocean and the overlying atmosphere [
3]. Therefore, the estimate of its variability is crucial in the investigation of climate changes as well as in the comprehension of the functioning of the physics and the biogeochemistry of the ocean, including that of marine ecosystems [
4].
Since the middle of the XX century, the availability of continuous SST time series has significantly increased, together with a rediscovery of the fundamental economic, political, and environmental relevance of the world ocean [
5]. Thanks to the advent of remote sensing and, more recently, unmanned vehicles for in situ observations, we have witnessed in recent decades a frequency and coverage of SST measurements never seen before [
6]. On the contrary, SST data are scarce and mostly non-continuous for the previous periods, and no time series of SST seem to exist until the end of the XIX century. Very noticeably, this is in opposition to what happened in meteorology starting from the middle of the XVII century [
7]. Indeed, since the XVIII century and till the XX century, except for a few early observations (e.g., [
8]), SST measurements have been performed mostly from ships [
5]. Acknowledging the importance of this fundamental climate variable and hence the already collected data, in 1853 a common “abstract log” was defined for recording SST on ships with wooden buckets [
9].
The International Comprehensive Ocean-Atmosphere Data Set (ICOADS) includes surface marine data since 1662. According to its last release, R.3.0 [
9,
10,
11,
12,
13], the first SST data in the Mediterranean Sea were obtained in September 1848 in the Western basin, while the first record for the Eastern Mediterranean Sea is dated two years later. A more significant spatial and temporal continuity in the records for the Mediterranean Sea was achieved since about 1870, thanks also to the opening of the Suez Channel, which substantially increased the trades in the basin. Despite the invaluable importance of such data, they are limited to the ship routes covering different portions of the Mediterranean Sea in different periods. On the contrary, continuous time series like that started in 1895 in Marseille [
8] are limited to a very small amount since the late XIX century [
11].
In this study, we present the first sea surface temperature time series ever recorded in the Mediterranean Sea and, to the best of our knowledge, in the whole world ocean. The data consist of measurements performed in the Venice lagoon in June–August of years 1851 and 1852 at the beach resort Bagni Galleggianti, funded in 1833 by the surgeon Prof. Dr. Tommaso Rima. Data were retrieved from the book Guida ai Bagni di mare Nella laguna di Venezia, written and published in 1853 by Dr. C. Barzilai, the medical director of that facility. This book represents a precious testimony of the Venice area from 1851–1852, as it includes a detailed description of the Venice lagoon, its environment, and its climate. The book aimed to promote the health effects of the lagoon water at the resort facility. Also, estimates of the air temperature and chemical composition of the water are provided in the same work.
Here, we present the sea water temperature measurements and show their statistical distributions. Finally, we qualitatively compare them with the corresponding quantities obtained by measurements performed in the Venice lagoon since 2002. The considered location is inside the Venice lagoon. It thus belongs to a specific coastal environment. To account for this peculiarity, in the following, we will refer to the measurements as “estuary SST” (eSST).
2. Data
The time series consists of temperature measurements performed with a Réaumur thermometer three times per day, at 8 a.m., 12 p.m., and 8 p.m. (local time) for June–August in 1851 and 1852. Measurements were made (translating from the book) “by immersing a thermometer quite deeply for a few minutes in the waters where bathing is practised”. The resort was located in the Venice city center, close to the
Basilica di Santa Maria Della Salute. At the same time, air temperature measurements were recorded, and a short description of the sky conditions (e.g., clear sky, cloudy, rainy) was also provided. For simplicity, in this study, data have been converted from °R to °C. Conversion from Reaumur temperature measurements to degrees Celsius is not straightforward if the instrument’s calibration is unknown [
14]. In this study, we use the conversion 1 °R = 1.25 °C, popular since the second half of the XVIII century [
14]: clearly, the specific selection of a calibration rule affects the obtained conversion. Unfortunately, the information about the sensitivity and calibration of the thermometer used to perform the measurements is missing. Since the highest precision reported in the book is 0.5 °R, we assume this value to be the instrumental uncertainty. The temperature value of 29 °R is noted for 12 p.m. of July 10, 1851: this datum very likely derives from a typing error. We replaced this temperature with 20 °R (25 °C), which we consider to be the correct value.
The current SST dataset consists of hourly resolution measurements of eSST performed at the
Punta Della Salute site in the Venice city center (45° 25′ 51.88” N, 12° 20′ 10.96” E), close to the original location of the beach resort
Bagni Galleggianti. The data cover 2002–2021 and have a sensitivity of 0.1 °C. The record is almost complete, except for some short periods with missing values. Data collected in 2002 have been discarded because of the lack of records for the summer season. Data are distributed by the
Centro Previsioni e Segnalazioni Maree of the city of Venice (CPSM) [
15].
3. Results
The temperature time series recorded in 1851 and 1852 are shown in
Figure 1. The instrument’s sensitivity is relatively low, which causes sequences of repeated equal values.
The average water temperature in the summer of 1851 was about 25 °C at 8 a.m. and 8 p.m. and 26 °C at noon. In 1852, the average value over the whole period was slightly lower (24 °C in the morning and evening and 25 °C at noon). In all cases, the variability range, quantified through the standard deviation, was the same, about 2 °C. By computing the monthly averages, in 1851, August was the warmest month, while in 1852, the average warmest temperature was obtained in July. At the end of August 1951, the weather was described as “rainy, stormy, light rainy and windy”. These adverse meteorological conditions may have caused the observed temperature to drop at the end of that period. On the contrary, when low temperatures were recorded in both years at the beginning of June, the meteorological conditions were quite good.
In the Venice area, eSST measurements have been performed since 2002. Data are provided by the CPSM and have an hourly resolution. The available time series is shown in
Figure 2a.
The annual cycle of eSST in the Venice lagoon has an amplitude of about 20 °C, starting from the lowest temperatures around 7 °C in January and reaching the average maximum of 27 °C in July and August, according to the monthly averages. The exceptionally low temperatures in winter 2012 were caused by a prolonged bora wind event between January and February [
16]. The linear interpolations of the 12 monthly records—obtained by averaging all eSST data of the same month of the year—returned no significant trend (
p value < 0.05) in all cases (not shown).
In order to qualitatively compare the mid-XIX century eSST measurements with the current data, we extracted from the series shown in
Figure 2a only the measurements performed at 8 a.m., 12 p.m., and 8 p.m. (local time). We highlight here that the comparison does not take into account (a) the possible biases due to the °R to °C conversion and (b) the uncertainties due to the different locations (even if in the same channel of the city center), which may also arise from changes in the lagoon circulation and bathymetry.
The distributions of temperature values (both in the old data and in the modern ones) are mostly asymmetric, generally with negative skewness. In most cases, this is the result of the seasonal cycle. Therefore, the daily climatology (i.e., the average for each day of the year of all data available from modern observations over the period 2003–2021), is calculated for each of the measurement times at 8 a.m., 12 p.m., and 8 p.m. The so-obtained time series are shown in
Figure 2b (dashed curves) and compared with the average values over the period 1851–1852 (i.e., each daily value is the average of the two measurements in 1851 and 1852; straight curves). For a better comparison, the averages of the mid-XIX century are shown with respect to the mean value of the corresponding curves in the modern decades. The mid-XIX century values show good agreement with the modern climatologies, considering that we are comparing 2-year averages with 20-year averages. Exceptions are obtained at the beginning (end) of the record when in the first (last) ten days the temperature shows a faster increase (decrease) compared to the modern values.
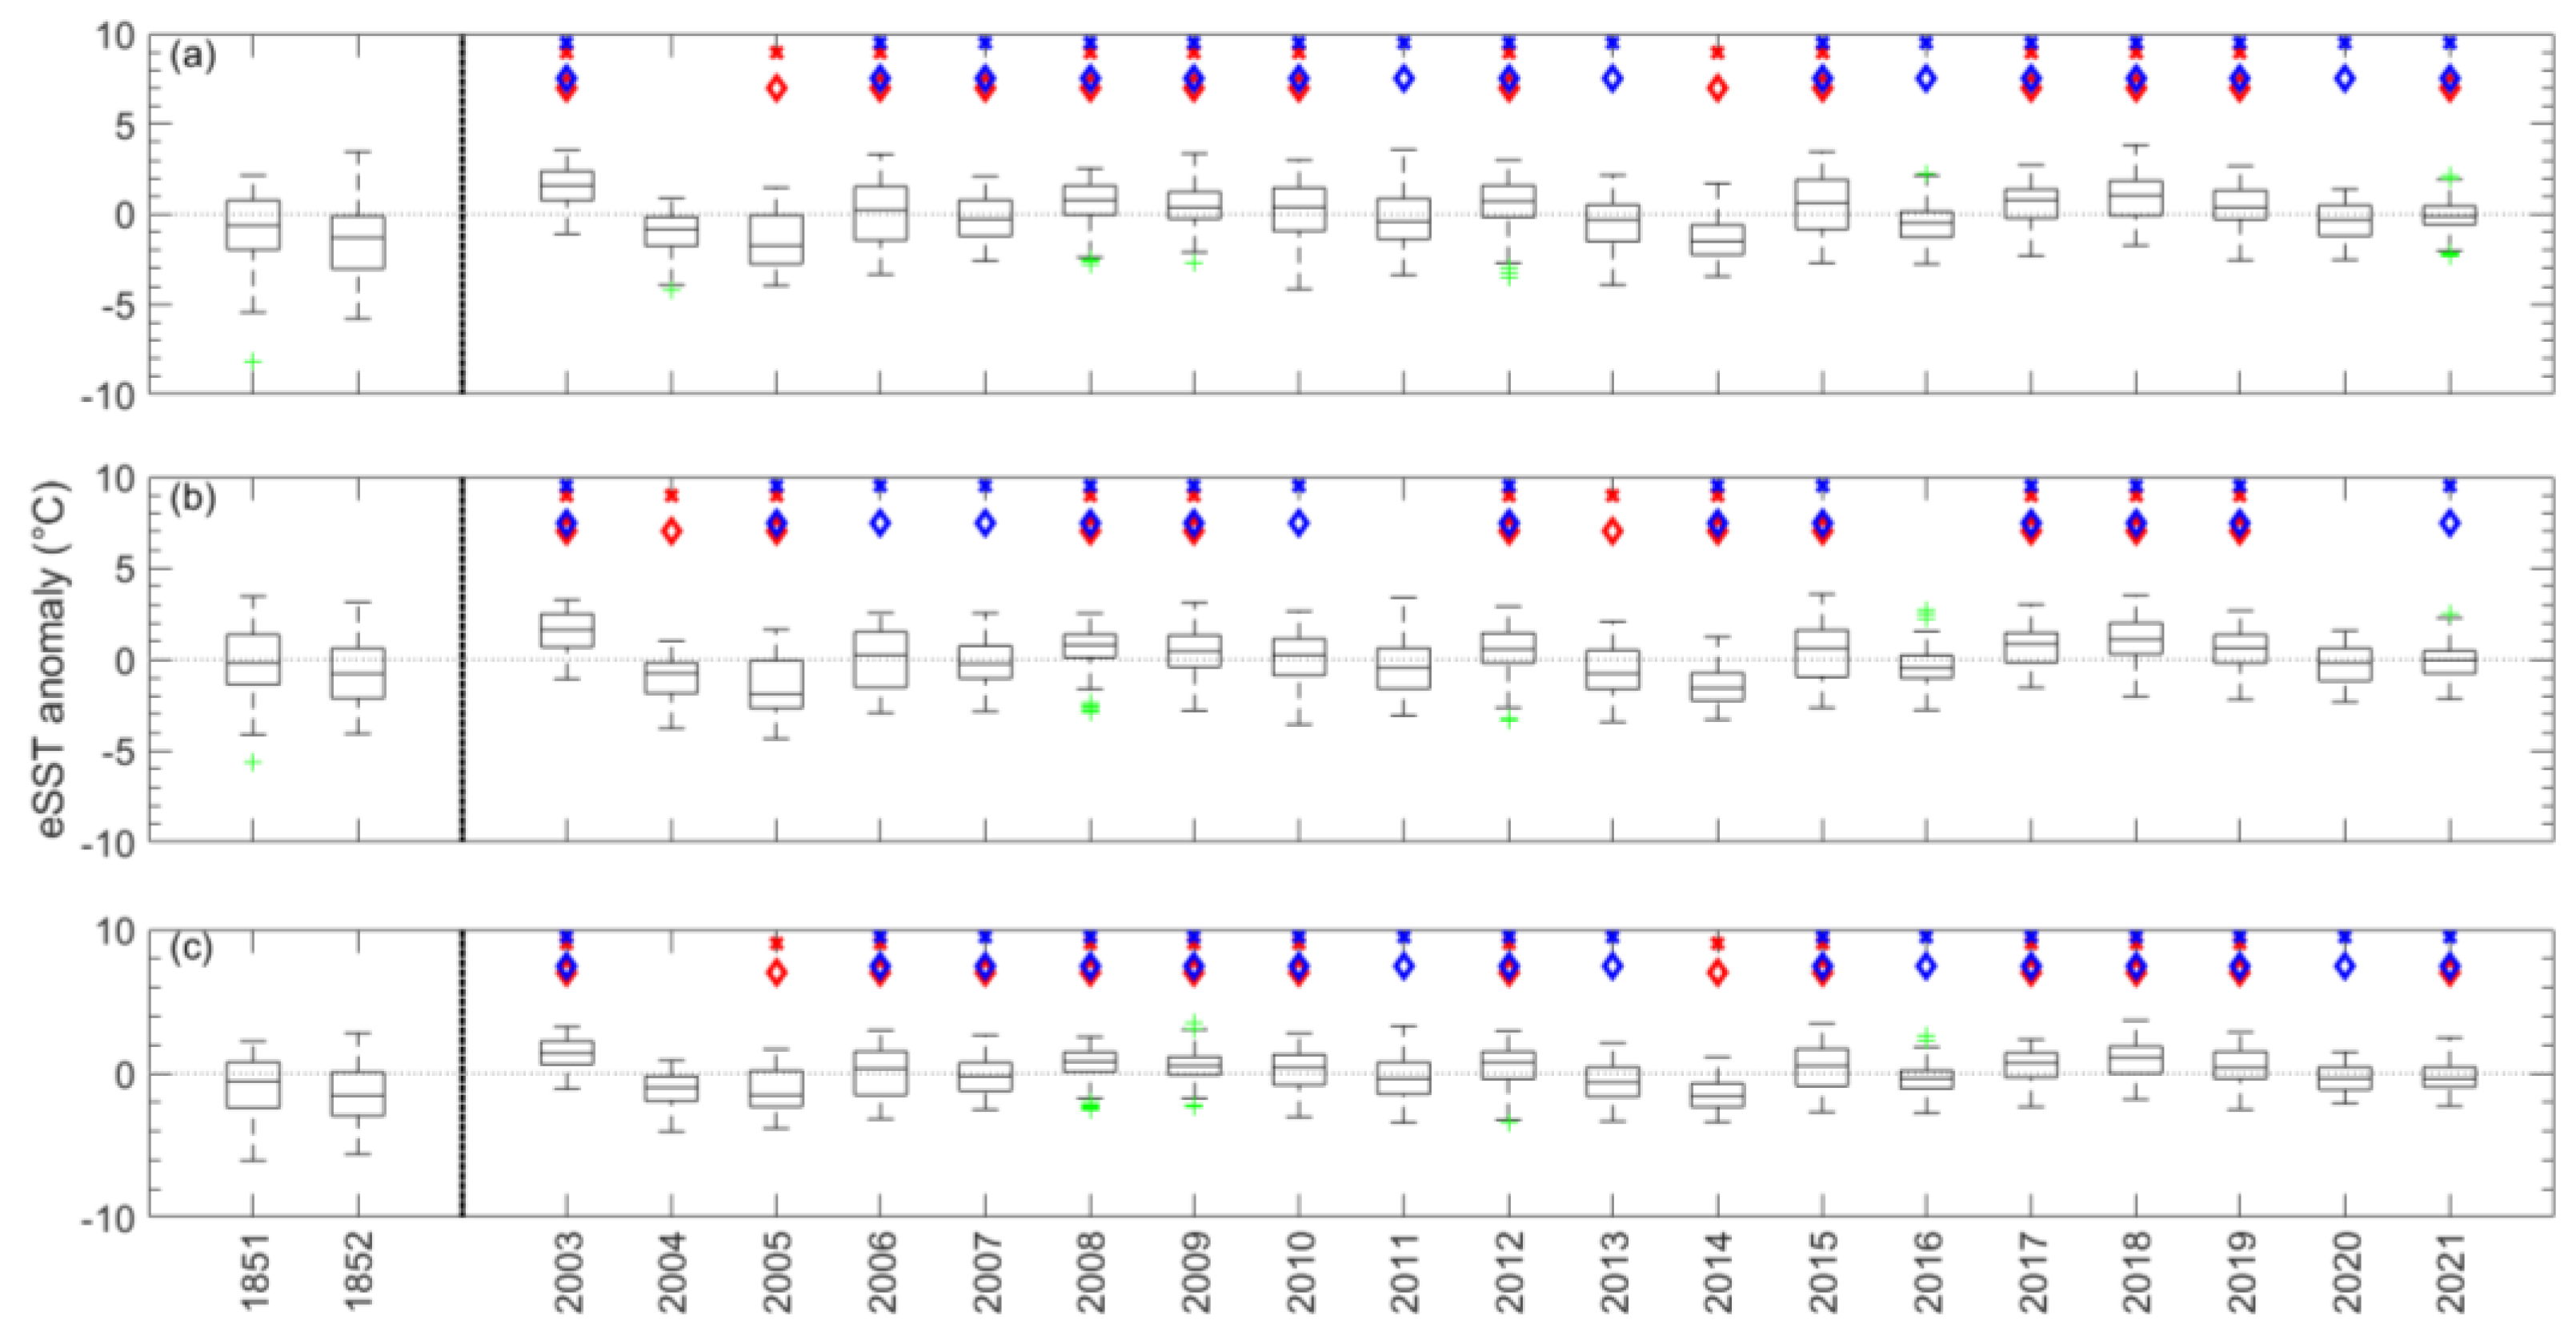
Then anomalies (i.e., deviations from the climatologies computed over the modern decades, dashed curves in
Figure 2b)) are considered in the qualitative comparison between old and modern data. The summary of the basic statistics of the eSST anomalies is reported in
Figure 3, where the boxplots for each June–August period and time are shown. In most cases, the anomalies are normally distributed around zero (α = 5%). Most significant exceptions are represented by the years 2005 and 2006. The lowest eSST values were recorded in 2005 (medians equal to −1.7, −1.9, and −1.5 °C) and 2014 (−1.5, −1.5, and −1.6 °C); 2014 is also characterized by the smallest variance.
The Wilcoxon rank-sum test for equal medians [
17,
18] was applied between old and modern eSST anomalies to test if their distributions are distinguishable according to their medians (α = 5%). The results show a disagreement between the distributions of old and modern data, especially concerning the 1851 case (red crosses in
Figure 3). Fewer cases of disagreement were derived from the distributions measured at noon (
Figure 3b). Similar results were obtained considering the two-sample
t-test ([
19], red and blue diamonds in
Figure 3) for equal means, under the hypothesis that the distributions have equal (but unknown) variance.
Therefore, modern eSST values present a significant increase for most years within the 2003–2021 period with respect to the mid-XIX century values. The summer temperatures in 2003 present the largest increase, consistent with the intense heat wave that affected the Italian peninsula and the whole of Europe in that period [
20]. Moreover, an interannual/decadal periodicity is detectable, explaining the temperature minima in 2005 and 2014, whose values are comparable to or even lower than those recorded in 1851 and 1852.
4. Discussion and Conclusions
In this work, we presented the first sea surface temperature time series of the Mediterranean Sea, which corresponds to the oldest of the world’s ocean to the best of our knowledge. Estuary SST data were derived from two-year measurements performed thrice a day in the Venice lagoon during summer. The data were retrieved from the book Guida ai Bagni di Mare nella Laguna di Venezia by Dr. C. Barzilai. They refer to the lagoon’s first meters of depth. We also presented a first qualitative comparison between them and modern measurements, retrieved in a location close to the resort where the old data were collected. It indicates an increase through time of median and mean summer values, in particular for morning and evening temperatures. Few exceptions were identified: in particular, in 2005 and 2014, the eSST average anomalies were indistinguishable or even lower than those recorded in the mid-XIX century. Further studies are required to verify how the conversion from °R to °C applied here without detailed knowledge of how the instrumental calibration affects the results. Moreover, possible changes in the lagoon topography and circulation could affect the comparison between the old and the recent measurements.
However, the time series presented in this study constitutes a precious archive of information in an iconic area characterized by a strong exposure to natural hazards: it complements the longest sea level time series of the Mediterranean Sea, which has been recorded since 1872 at the
Punta della Salute ([
21] and references therein), very close to the location of the
Bagni Galleggianti. However, the location inside the lagoon limits the representativeness of this record over a large area. It has to be taken into account that only sporadic measurements from ships are available for the same period.
Despite several limitations of the temperature data presented here, including missing information about the exact water depth where the measurements were retrieved and the calibration of the thermometer, their significance is undeniable: they put many decades backwards the development of a fundamental aspect of oceanographic observations and allow for a comparison of the eSST within the Lagoon of Venice across three centuries. The old data are now available online as
Supplementary Materials for further investigations.


