
On the Intercontinental Transferability of Regional Climate Model Response to Severe Forestation

 , , , , , and
Abstract
:1. Introduction
2. Materials and Methods
2.1. Model Ensemble
2.2. Land Cover
3. Results
3.1. CRCM5 over North America and Europe
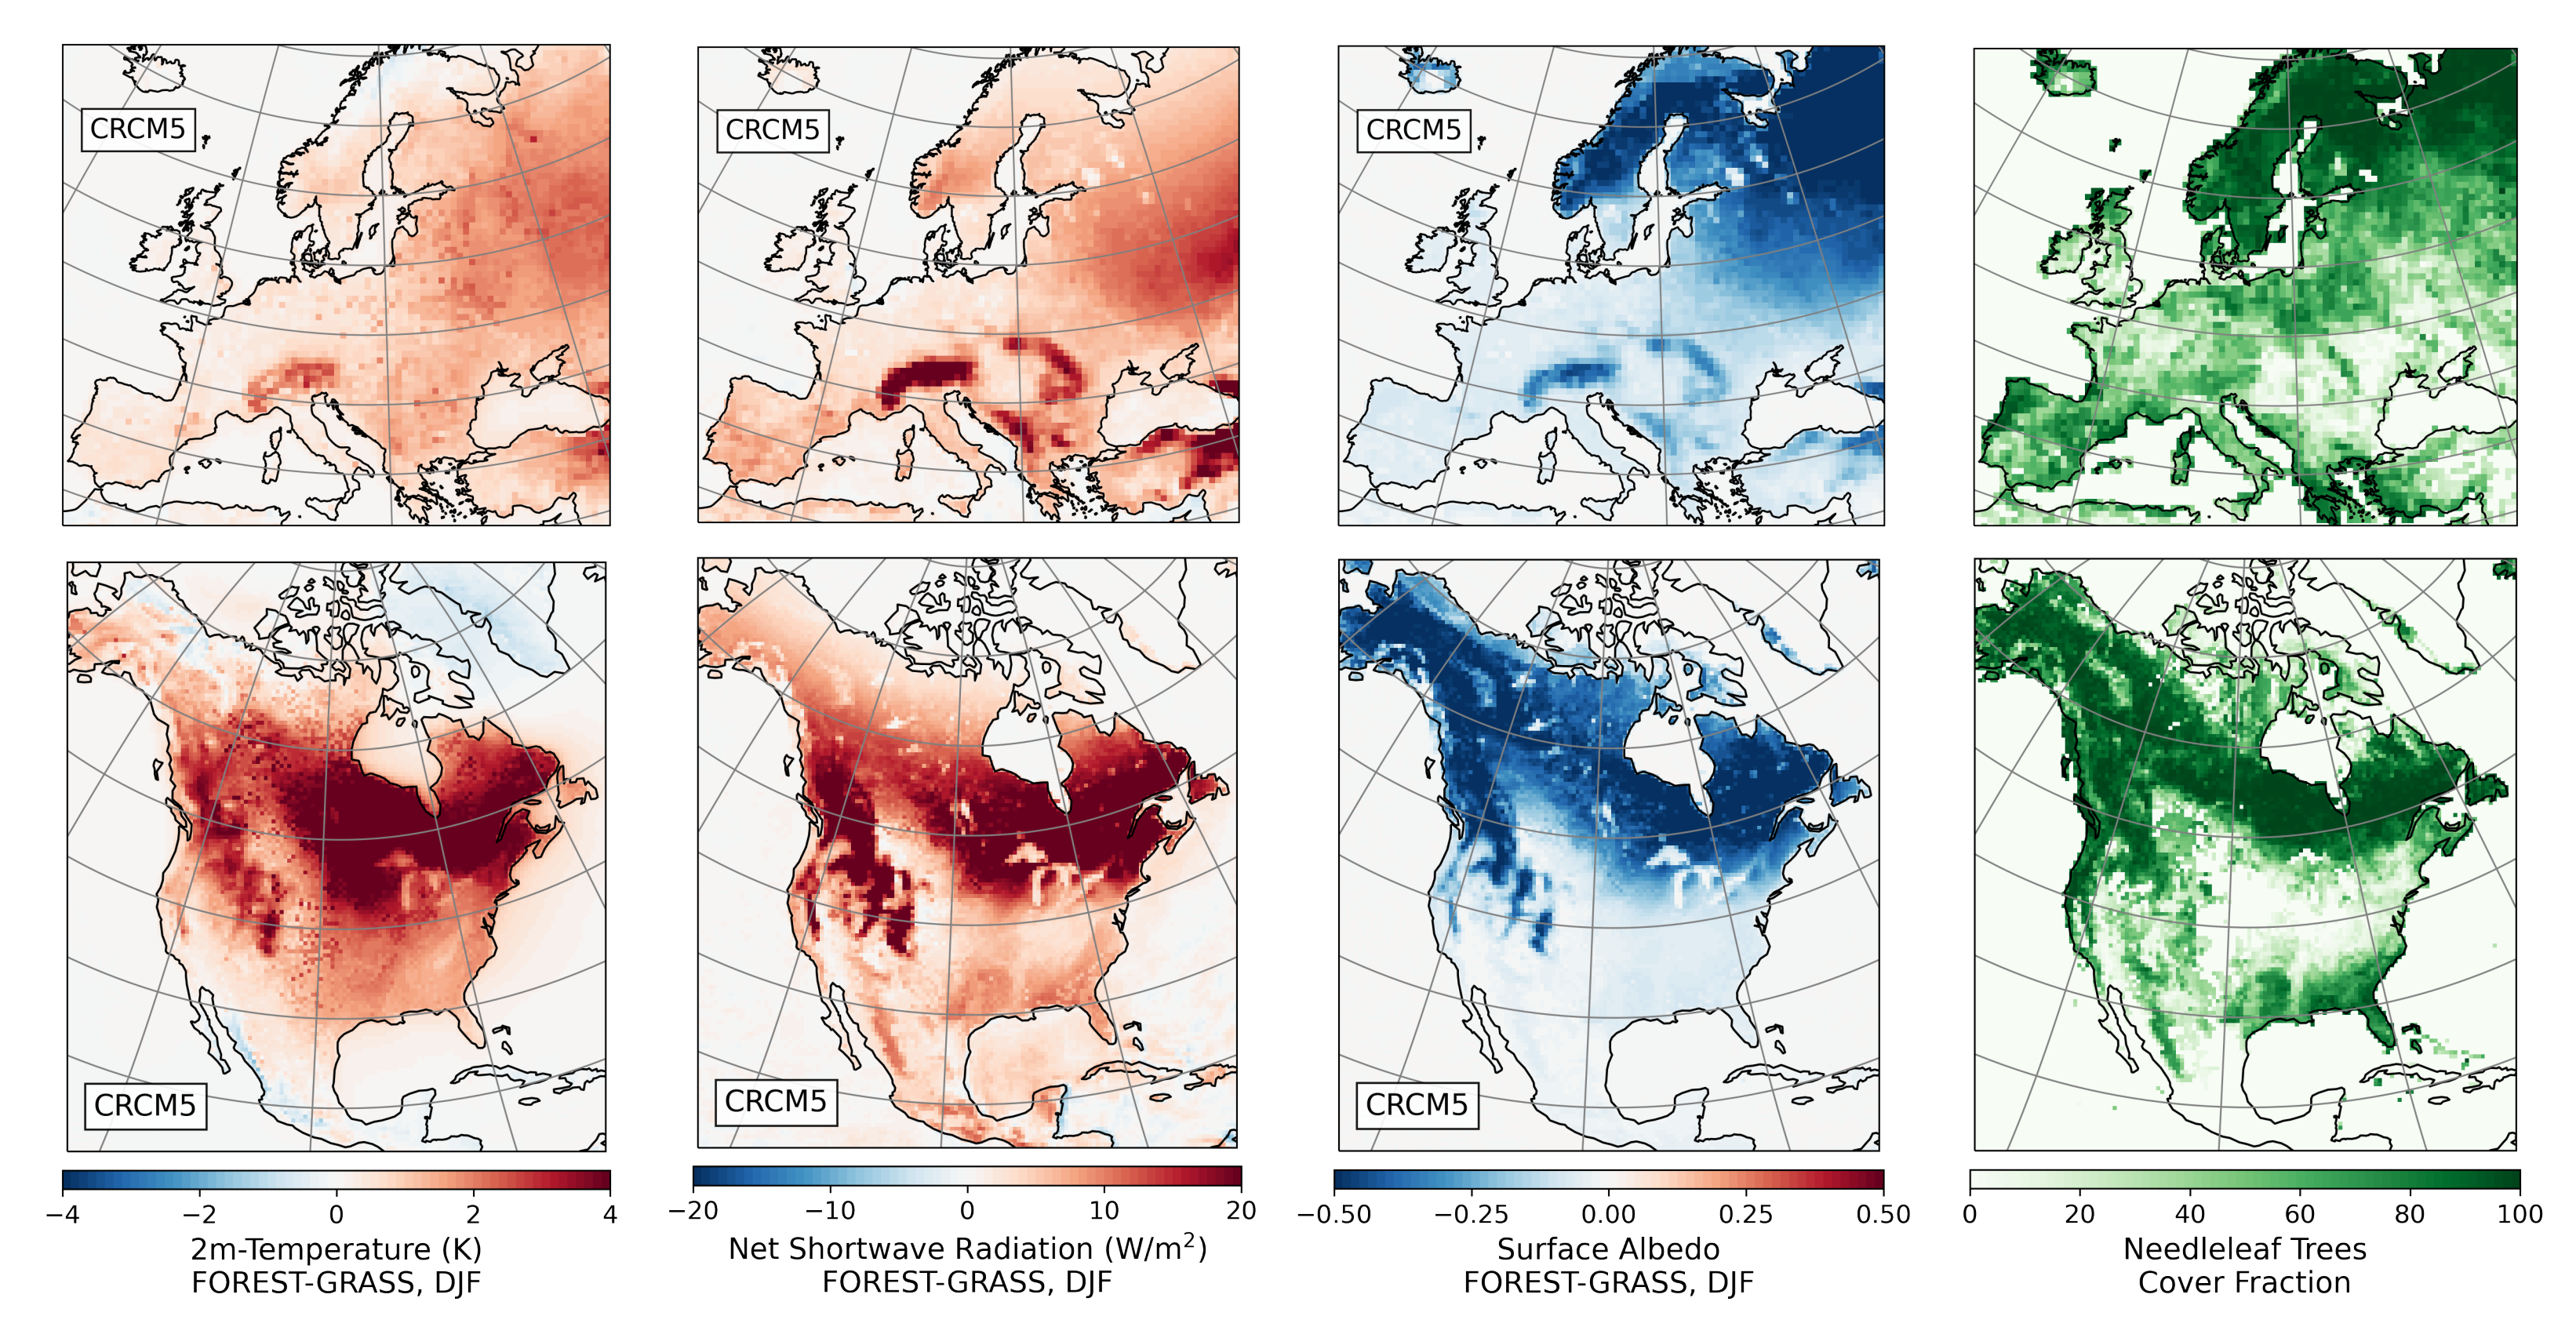
3.1.1. Winter
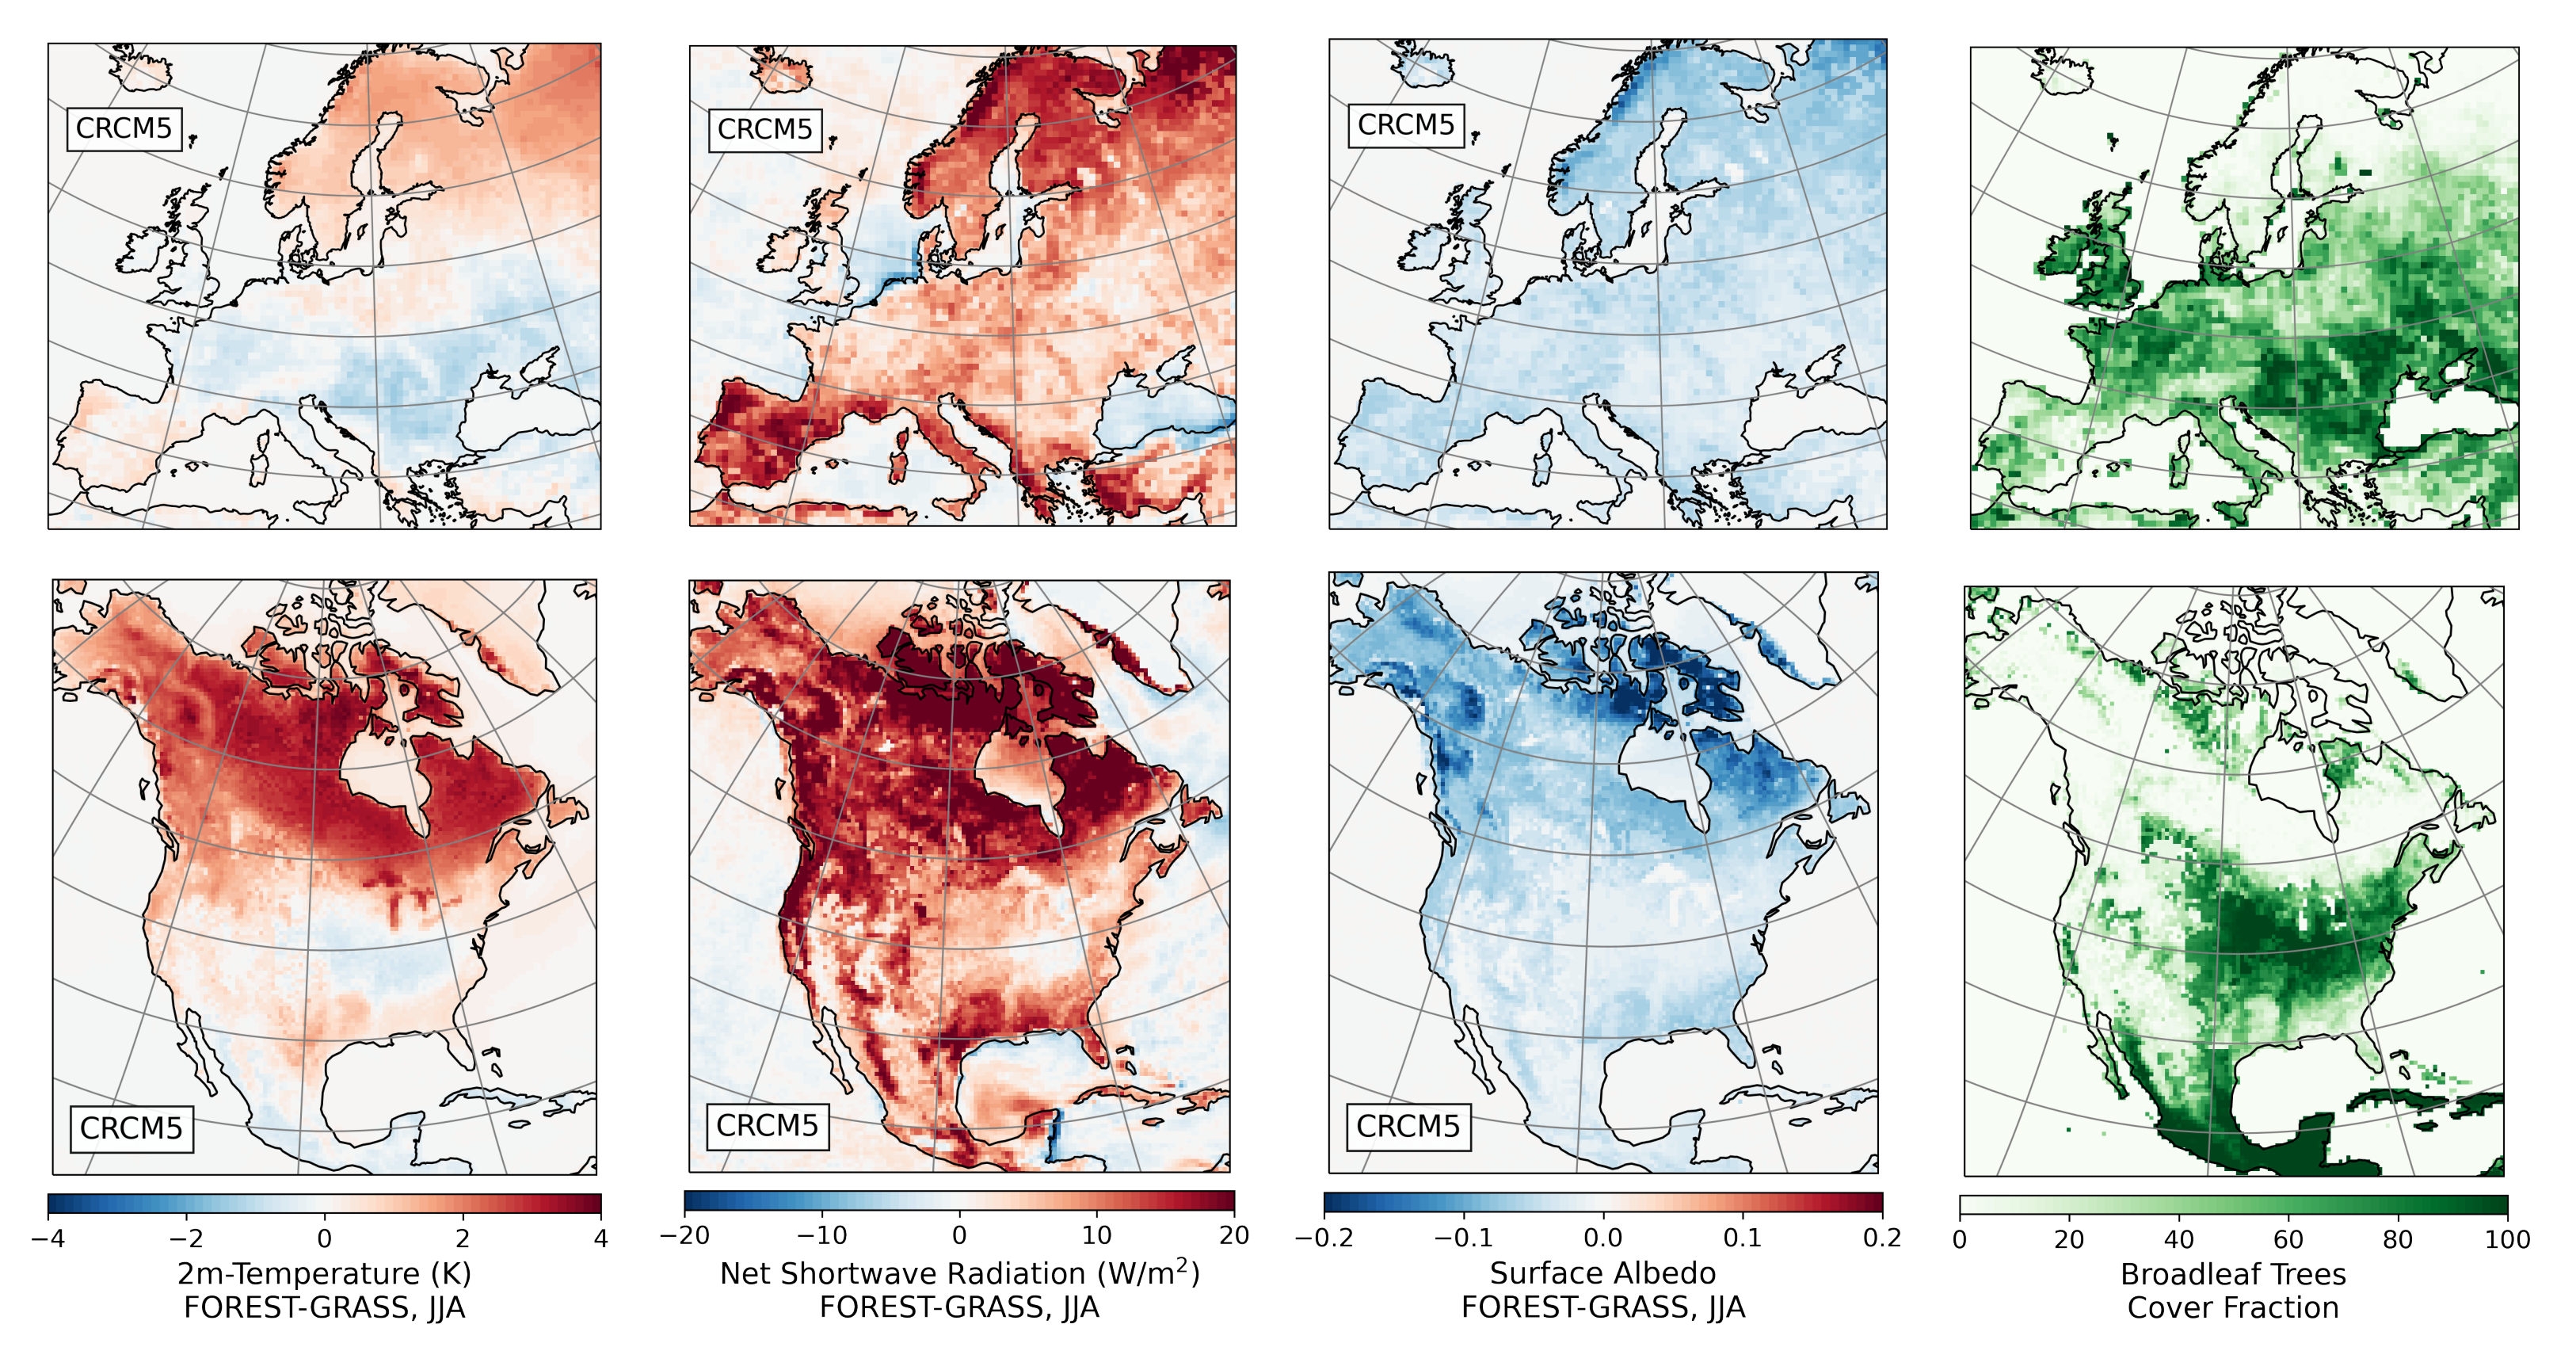
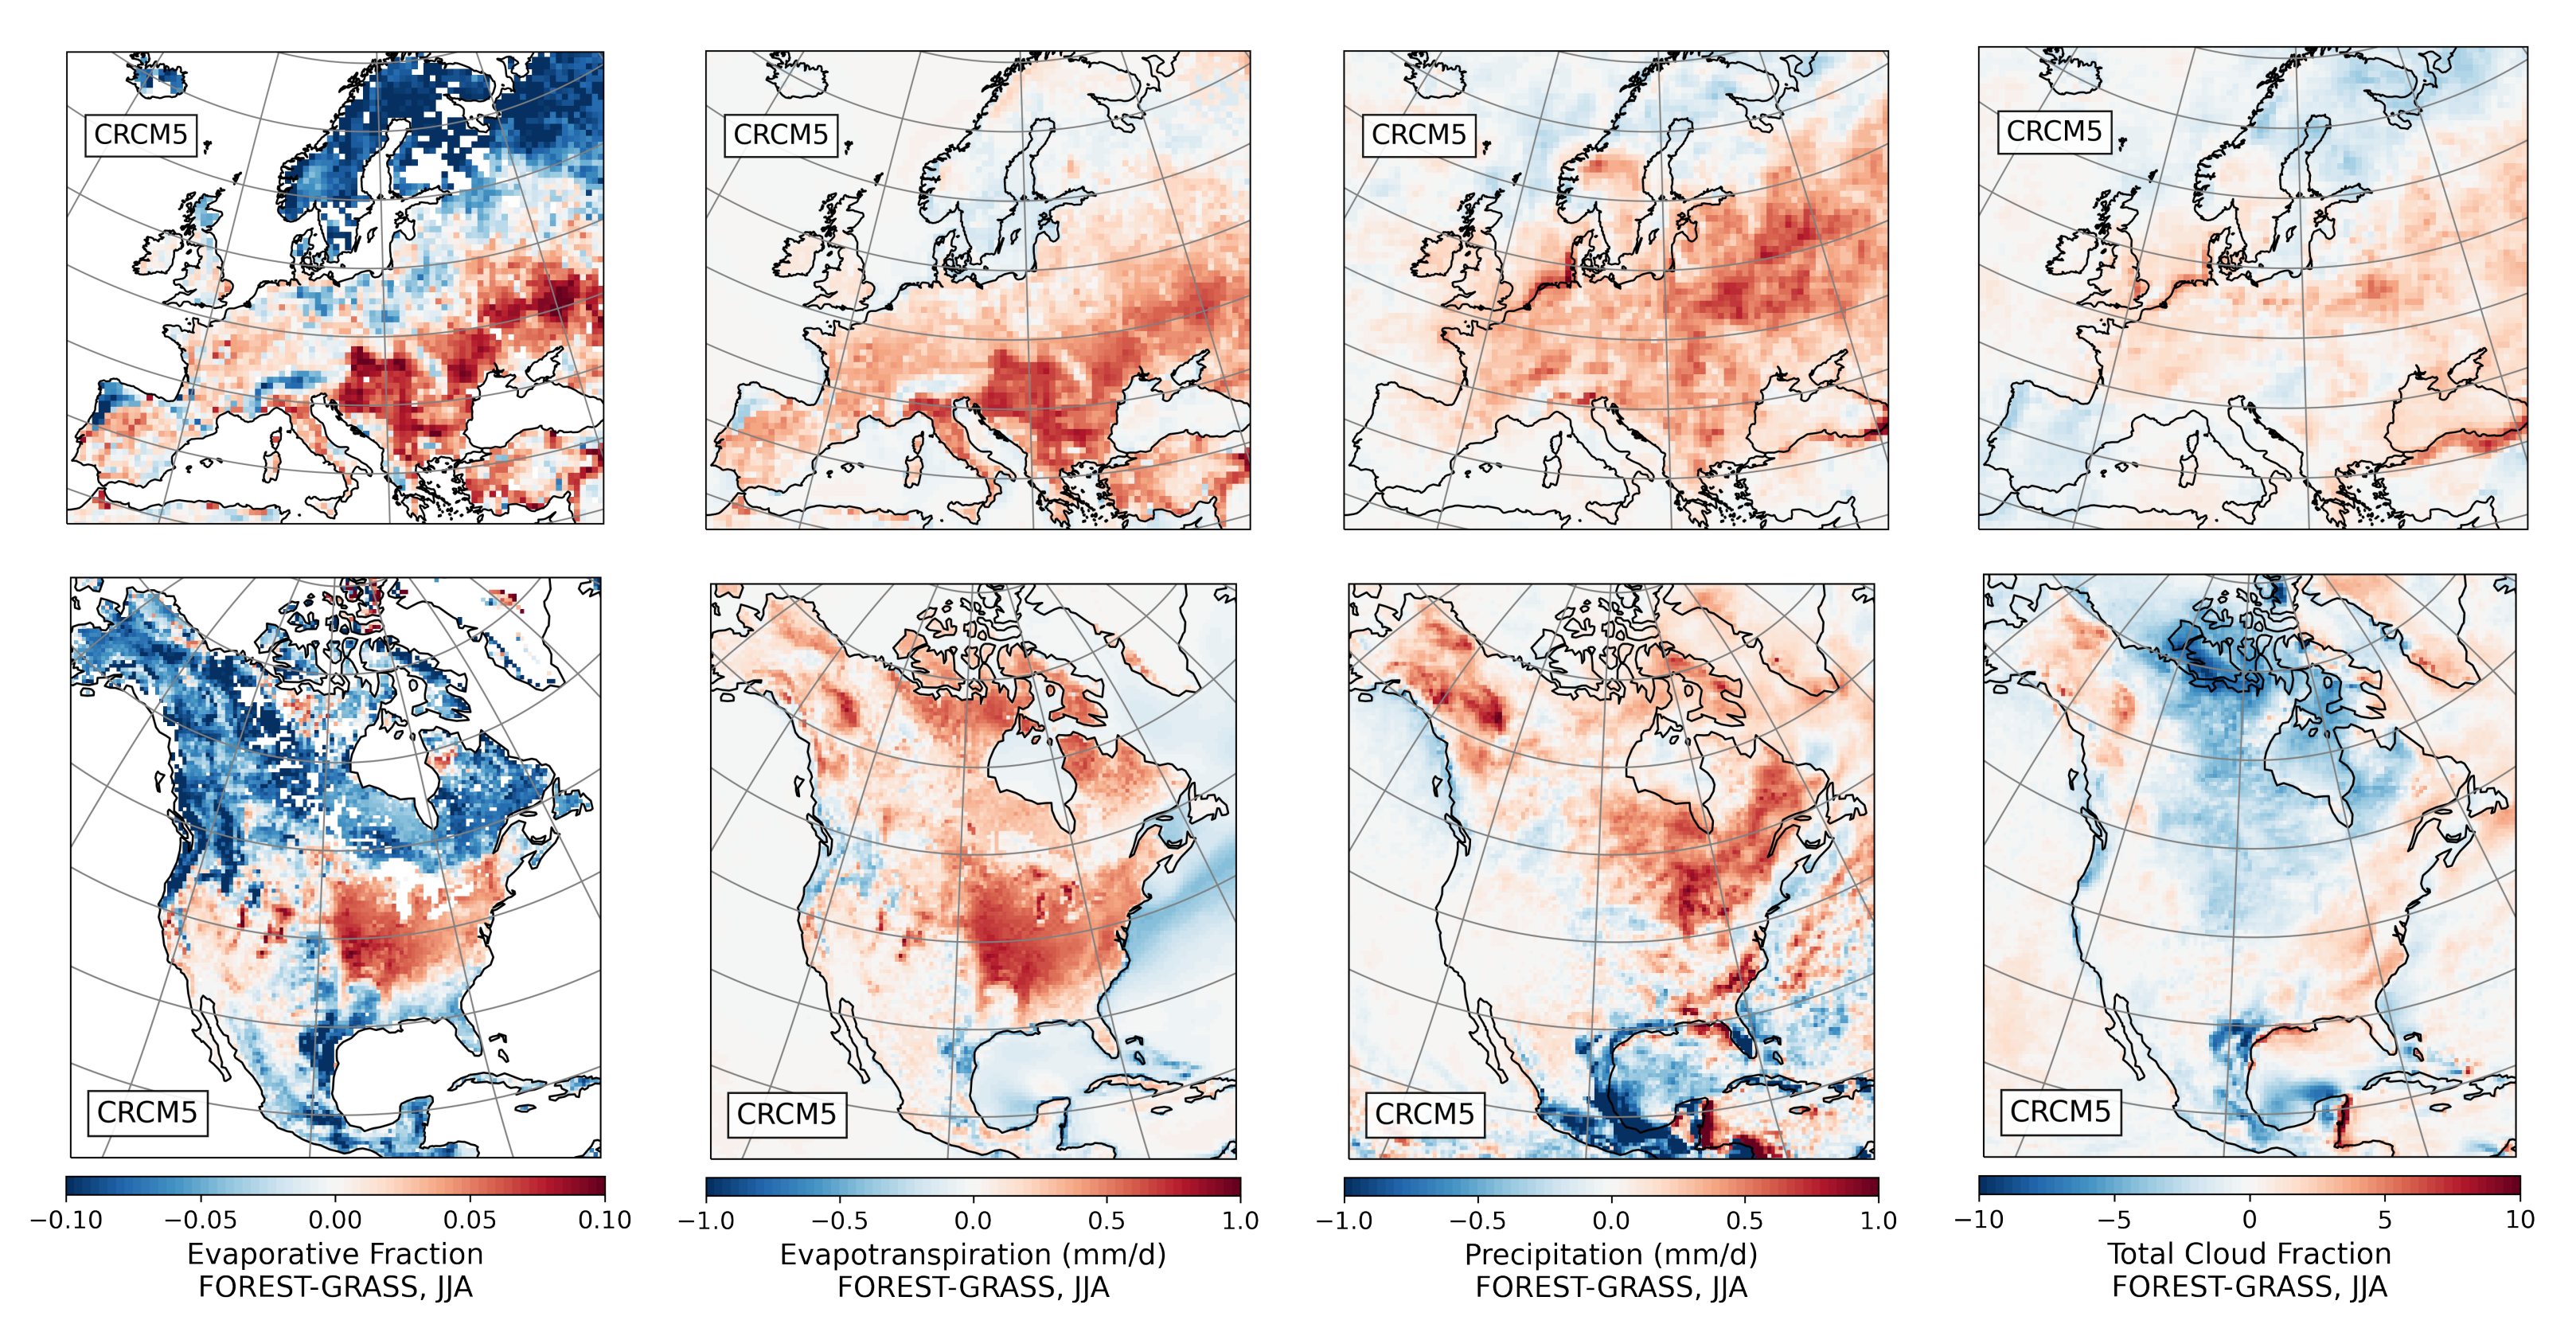
3.1.2. Summer
3.2. Model Intercomparison over North America
3.2.1. Winter
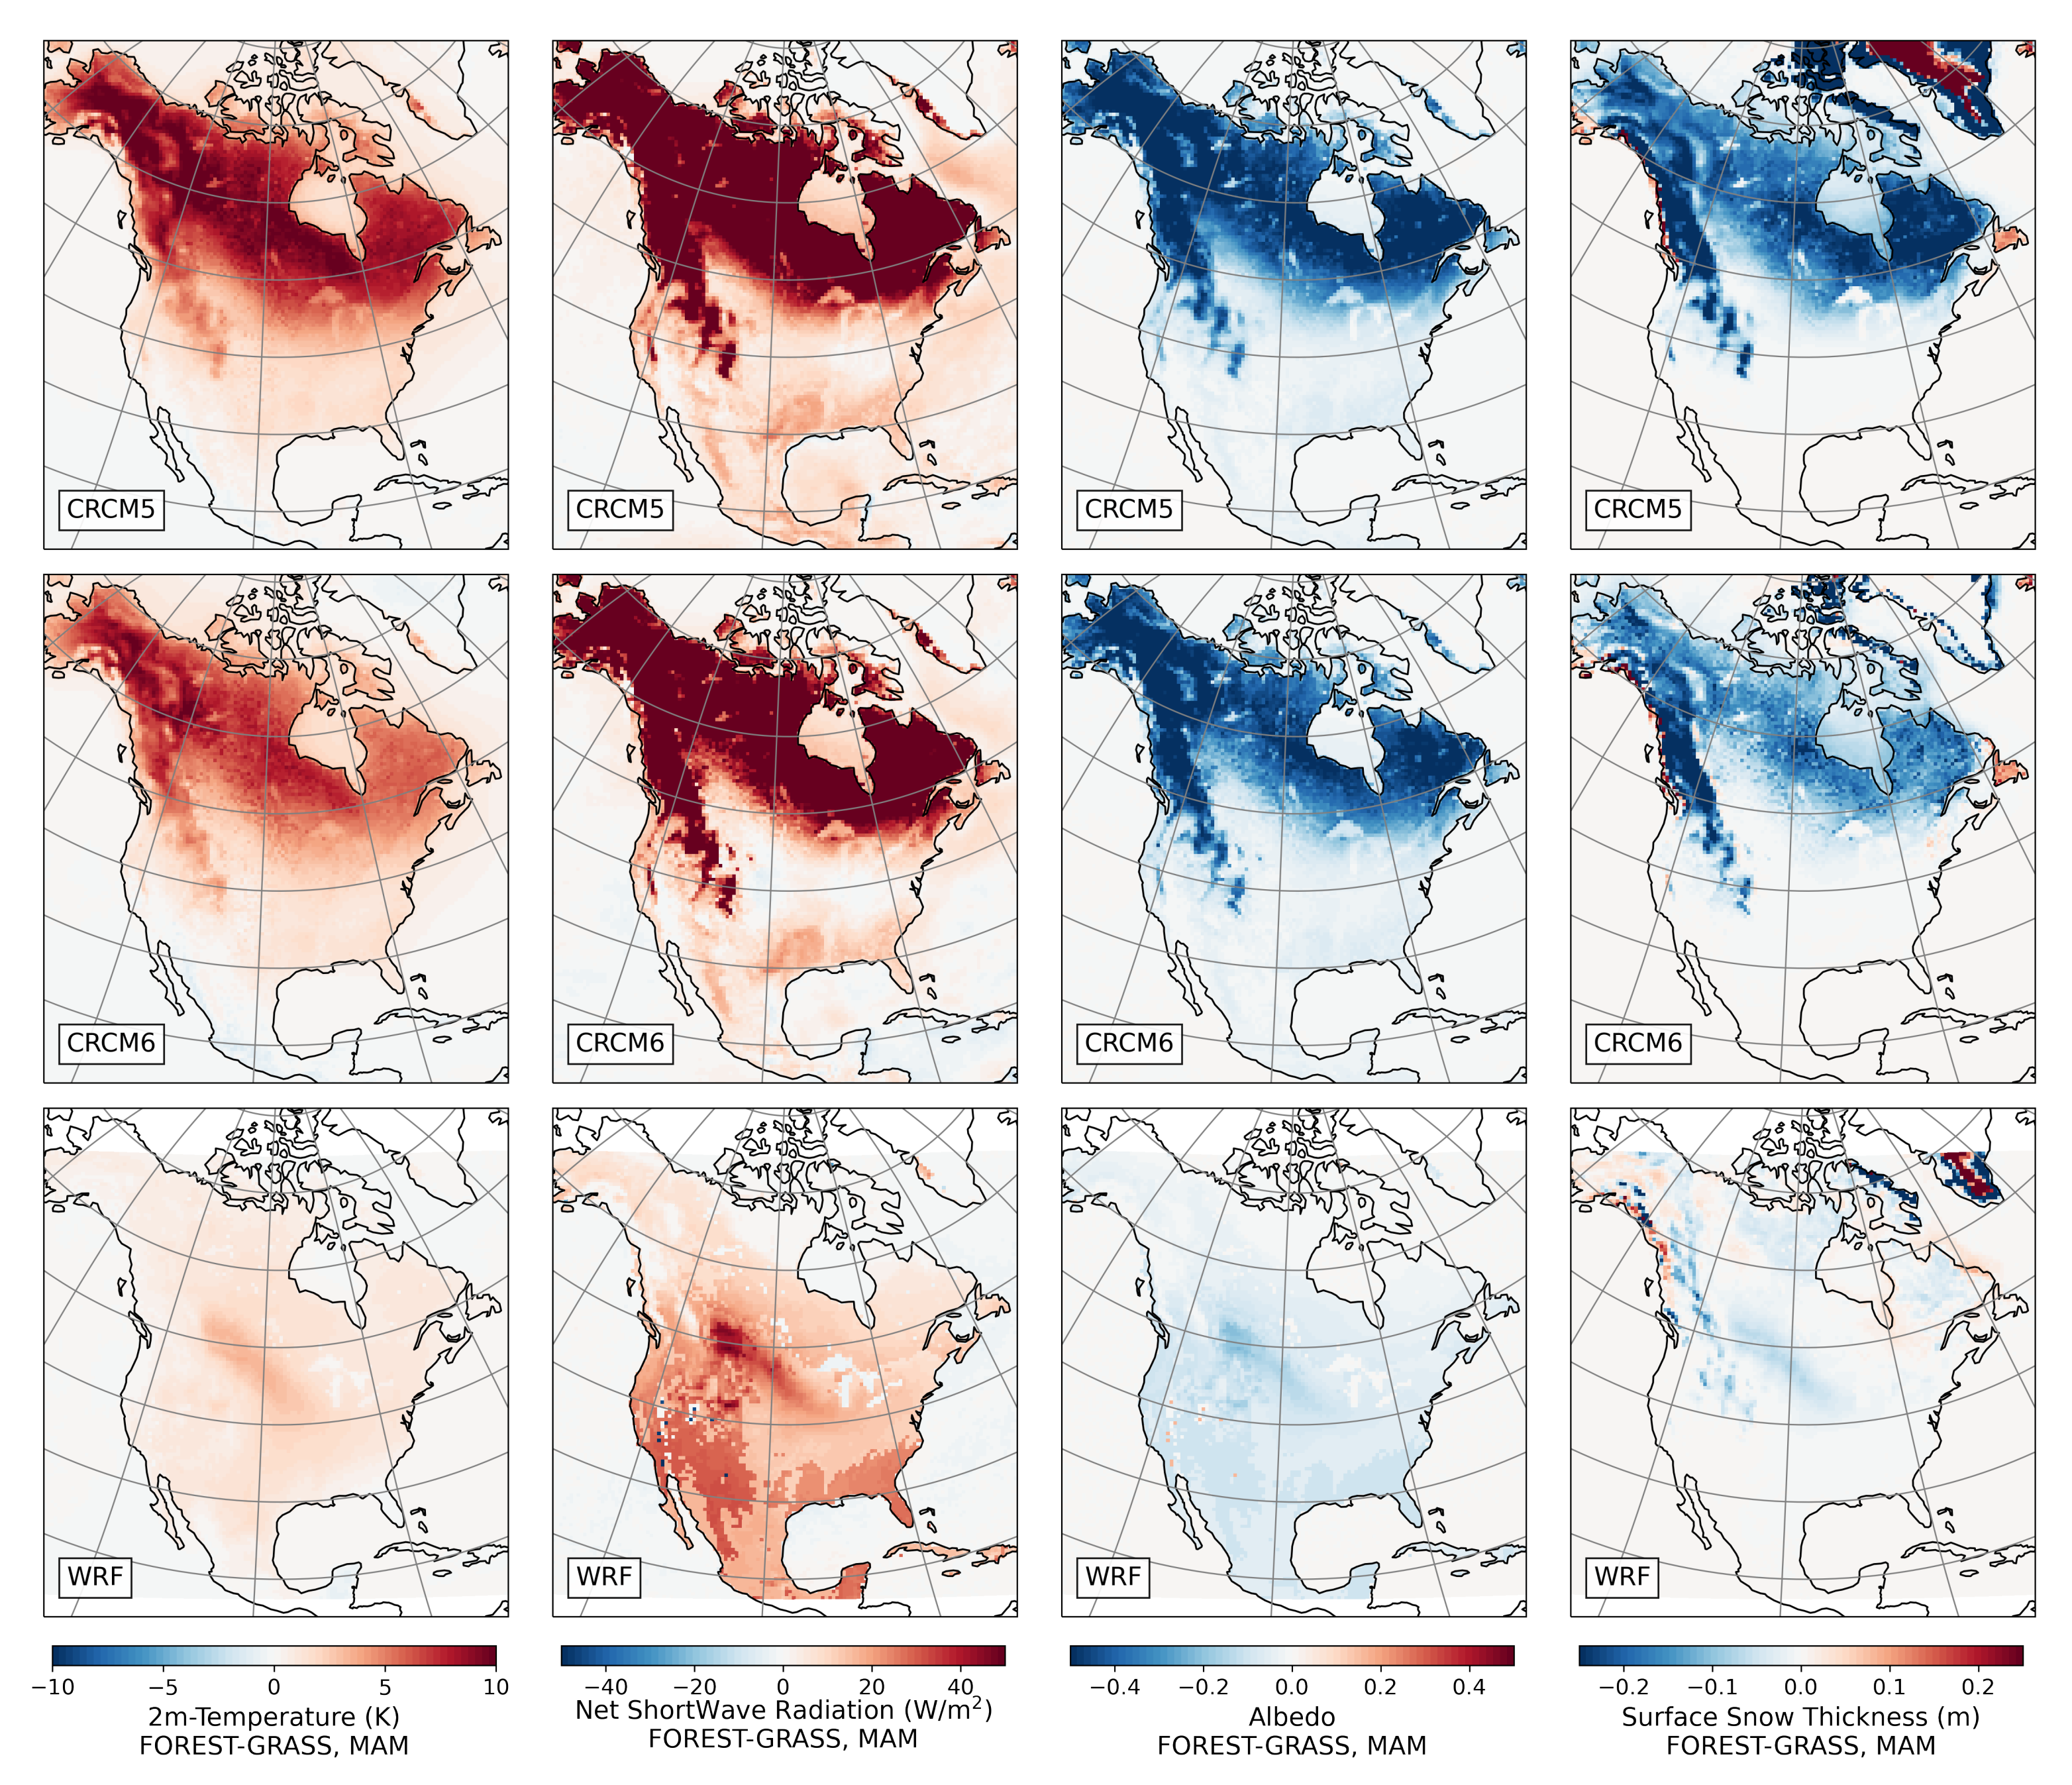
3.2.2. Spring
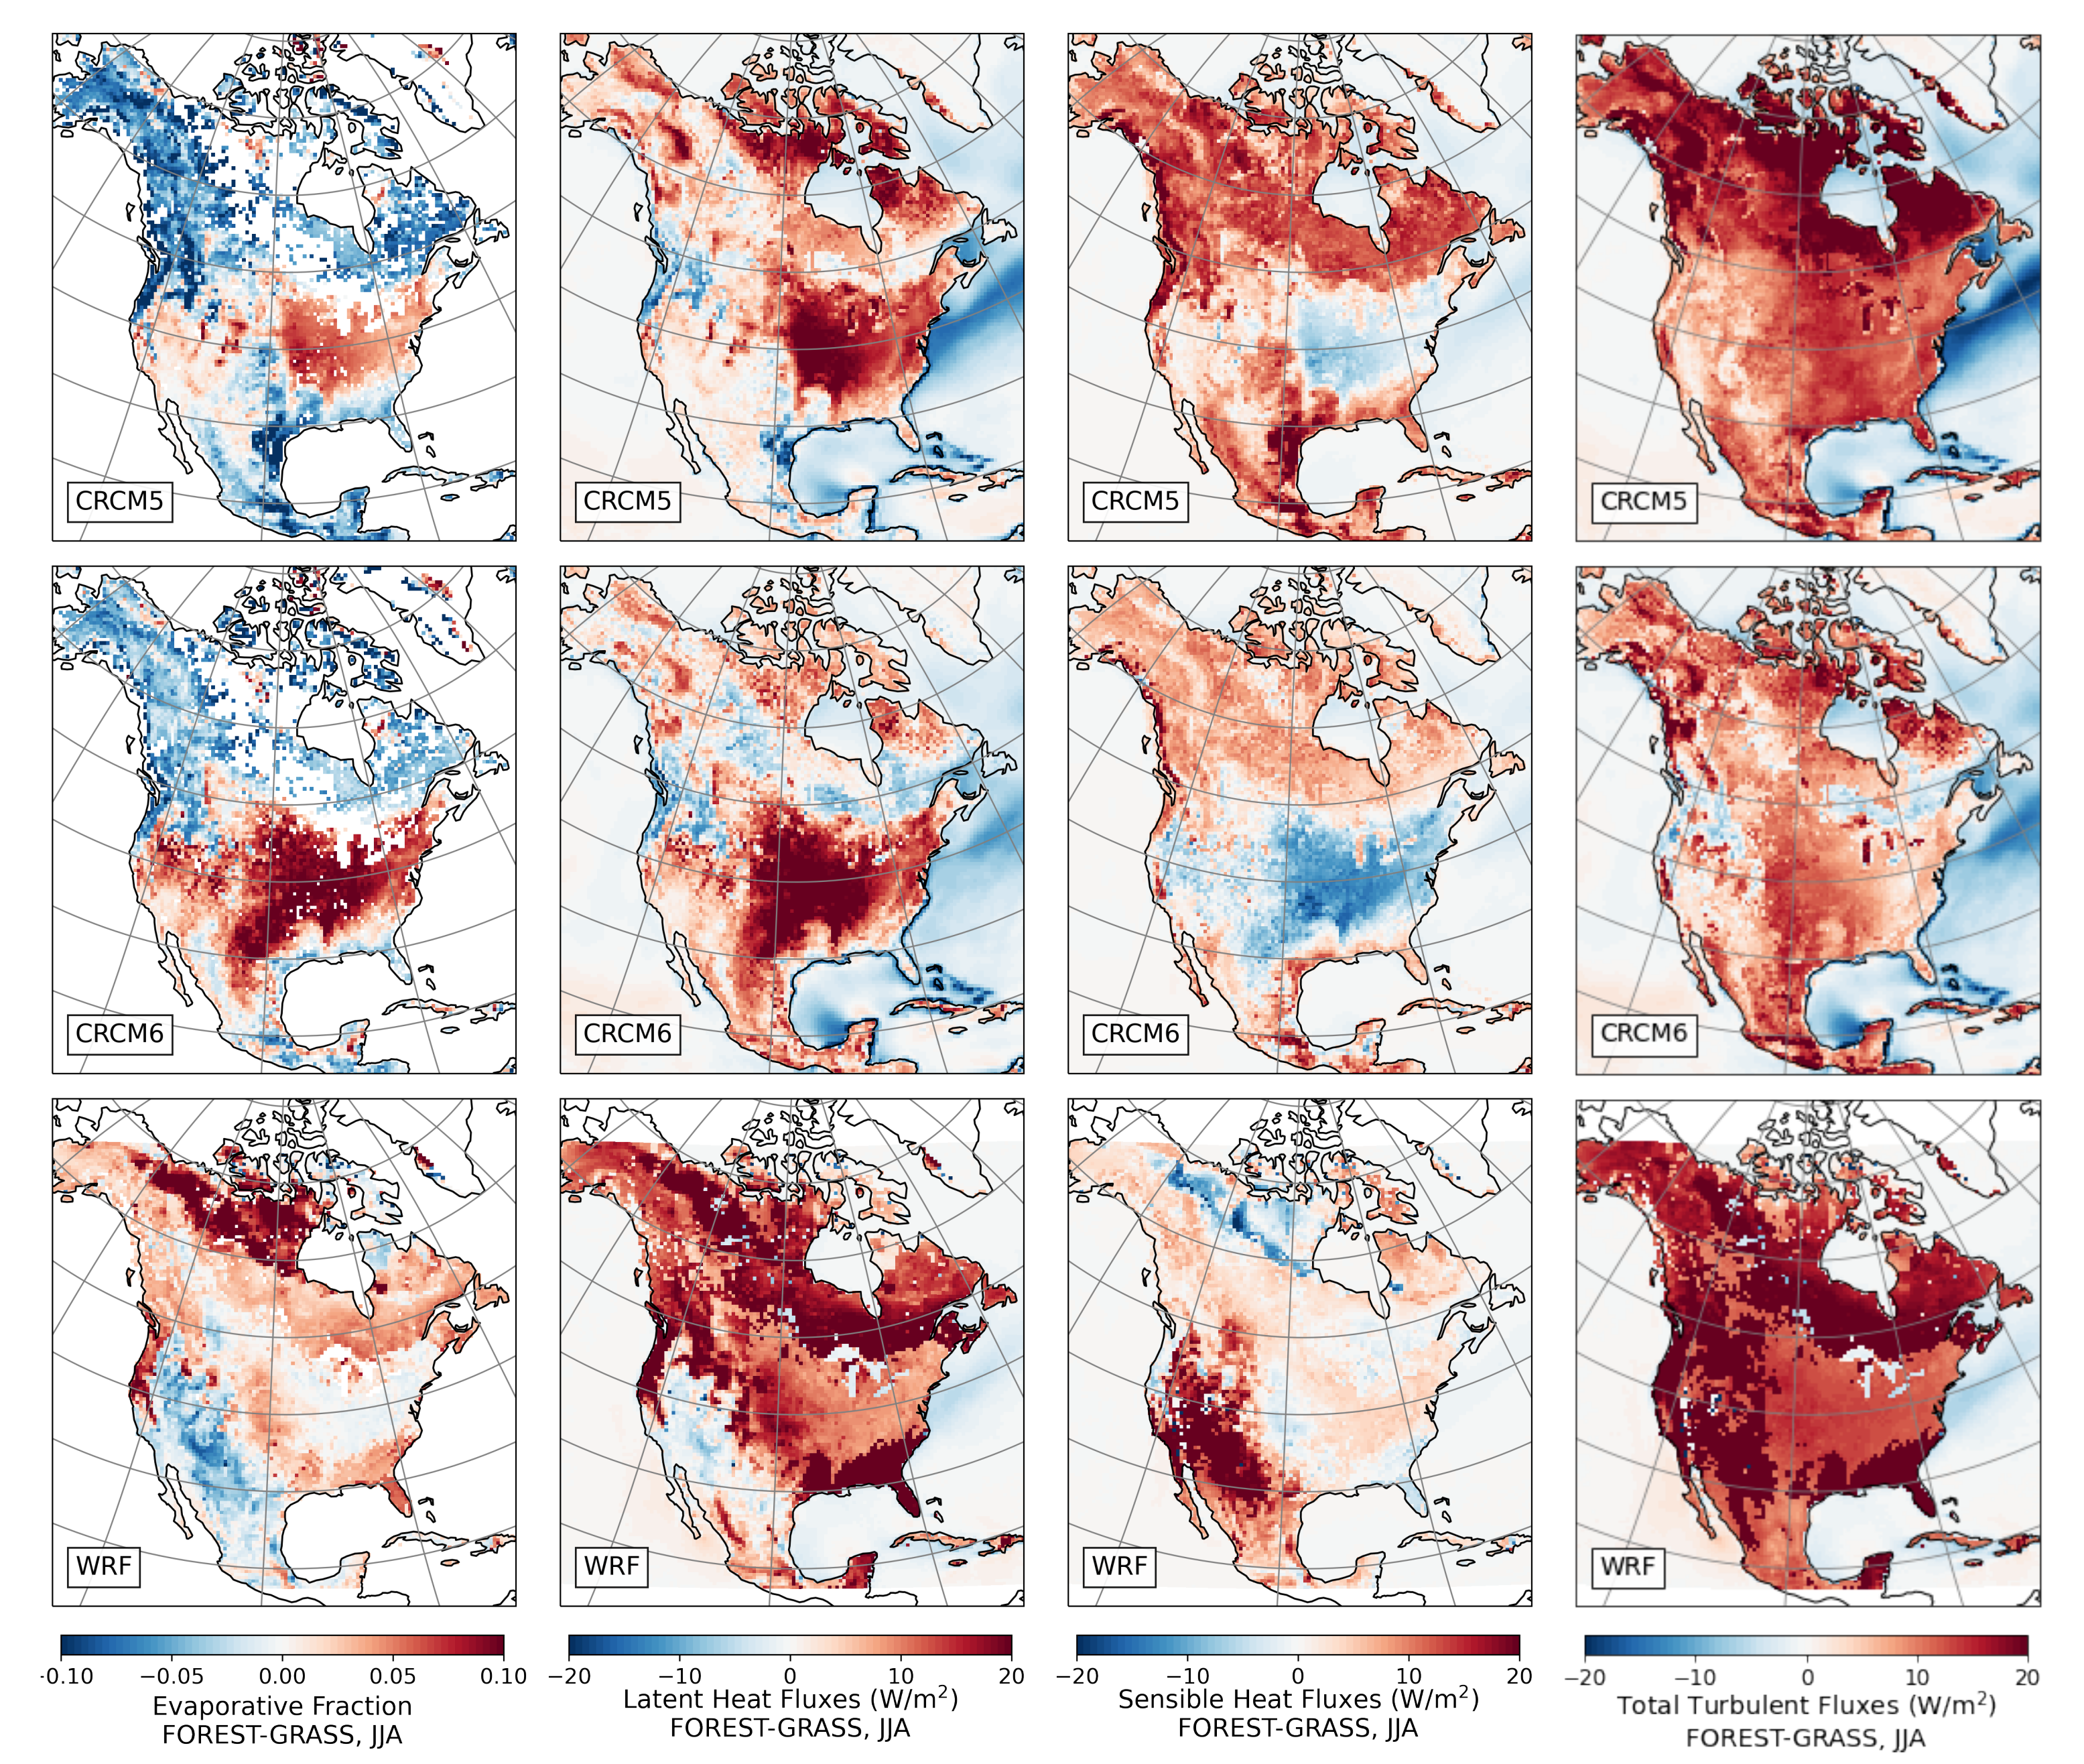
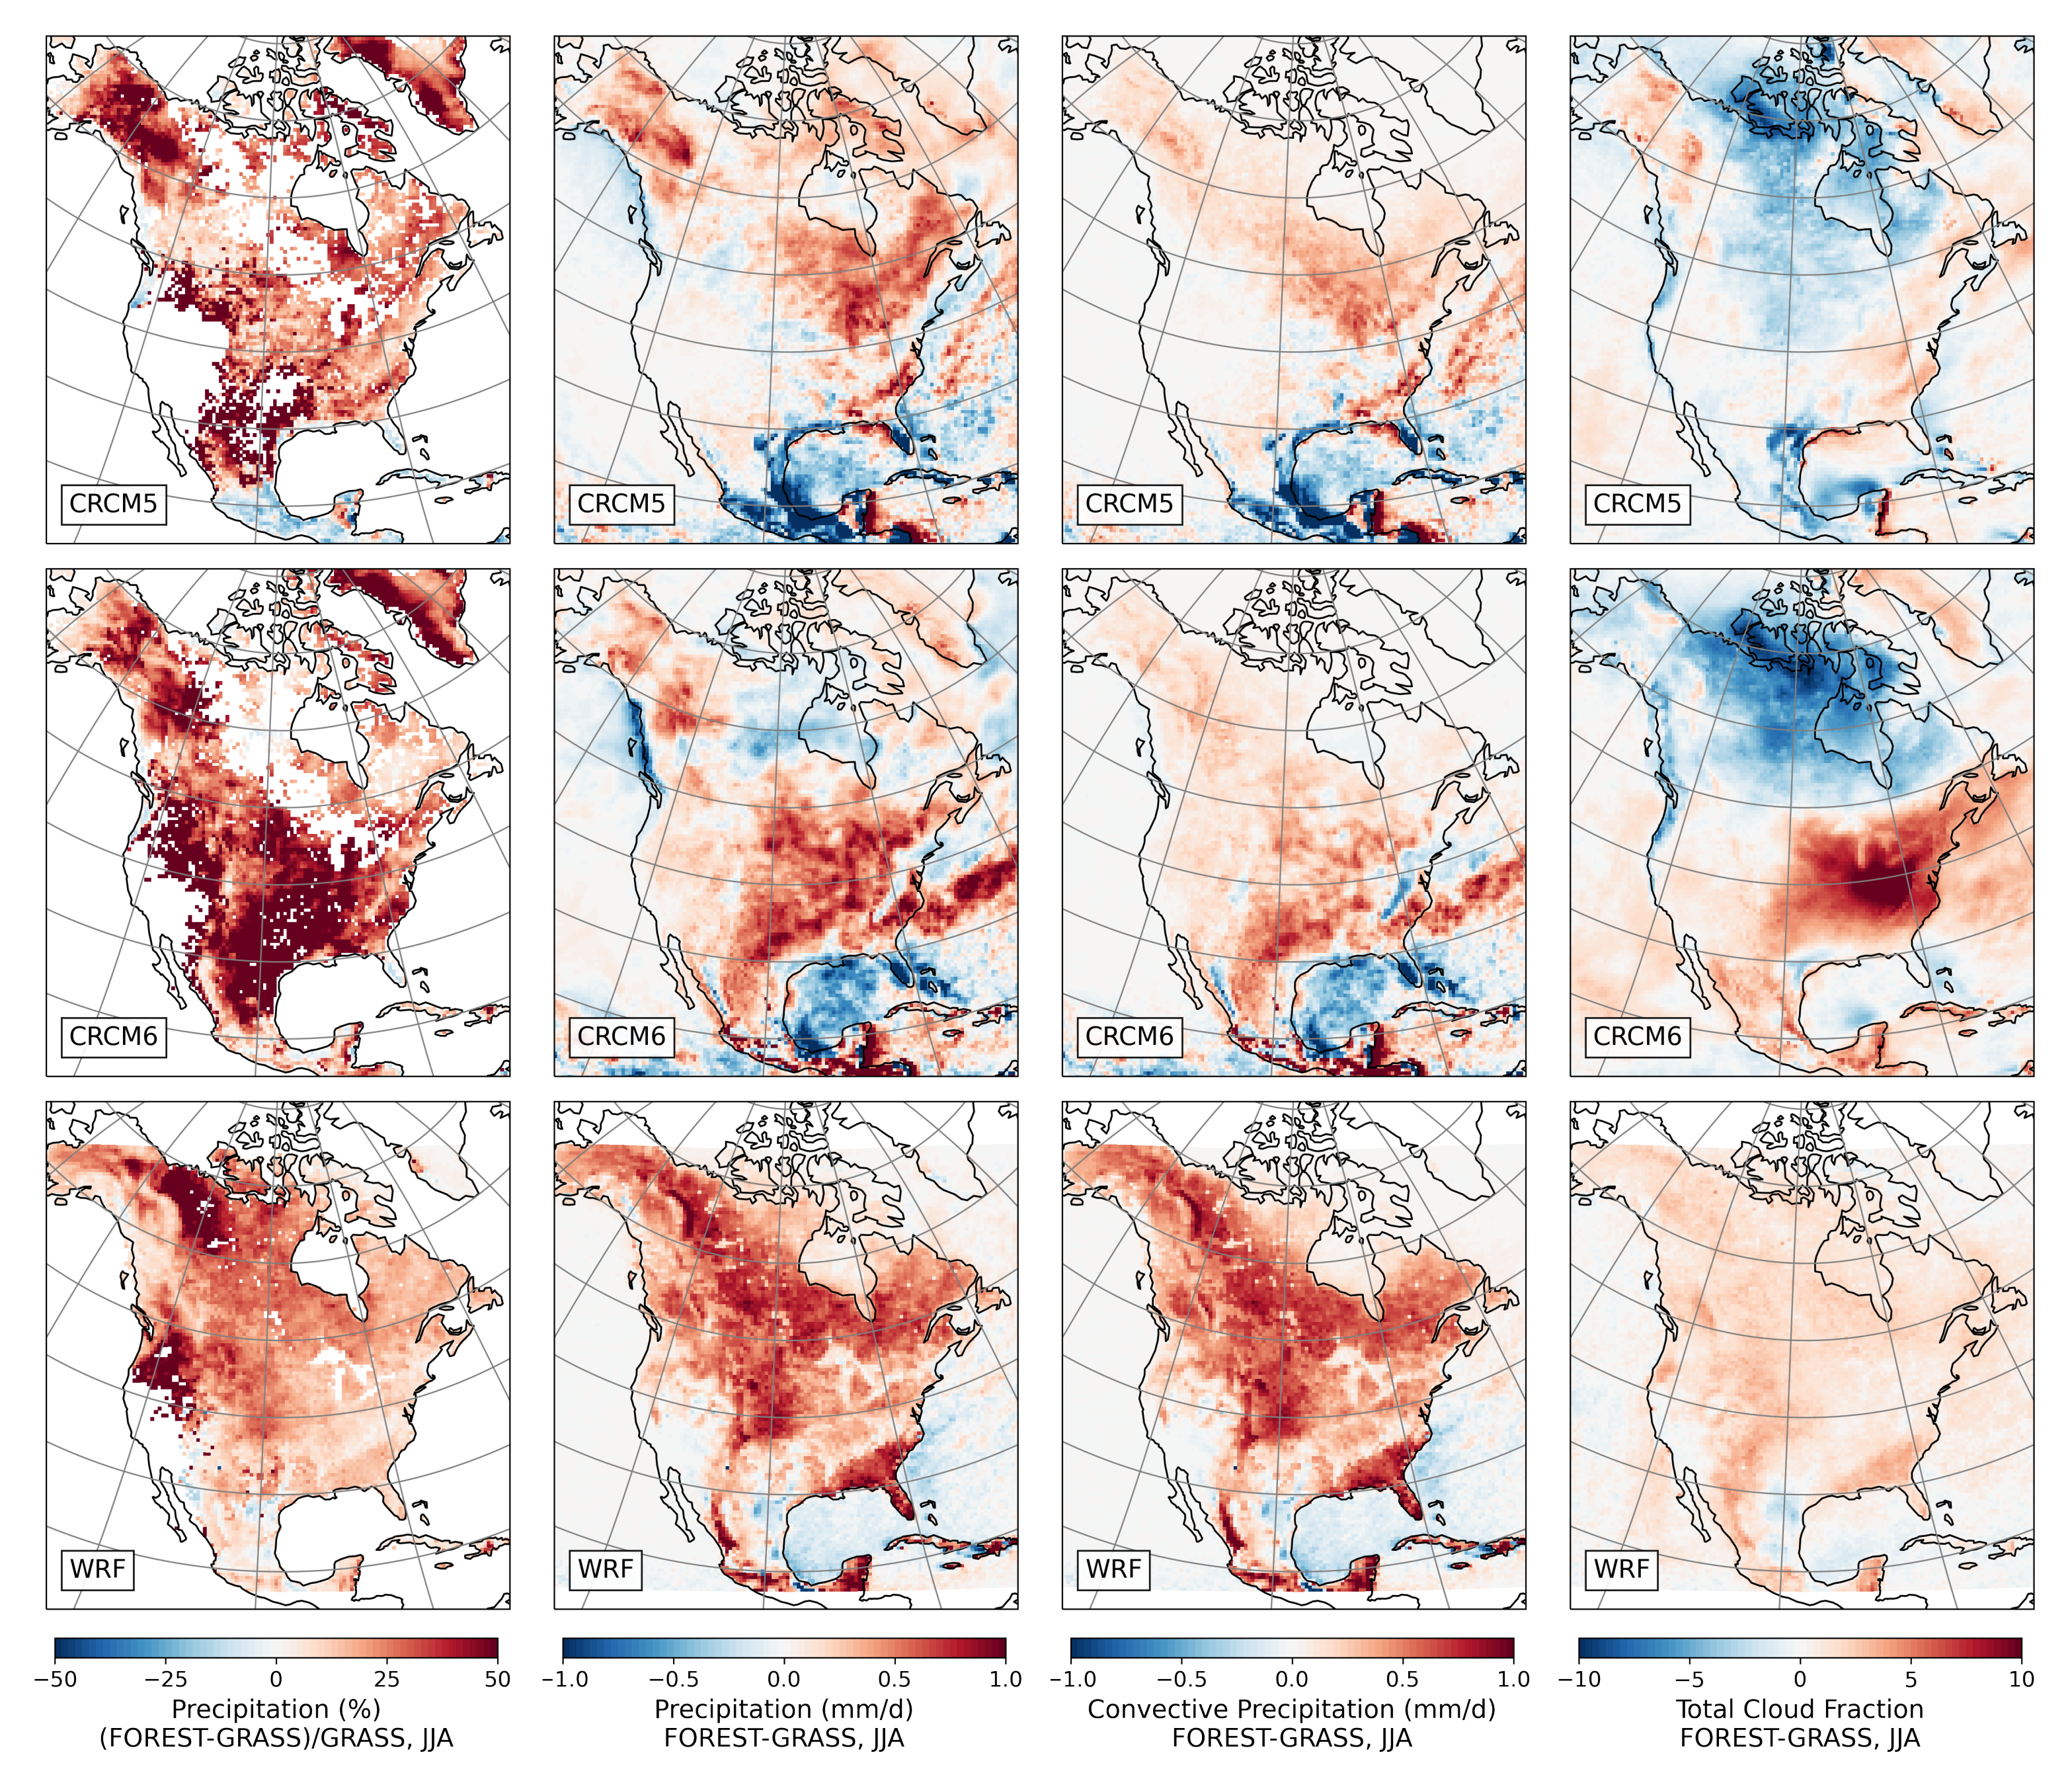
3.2.3. Summer
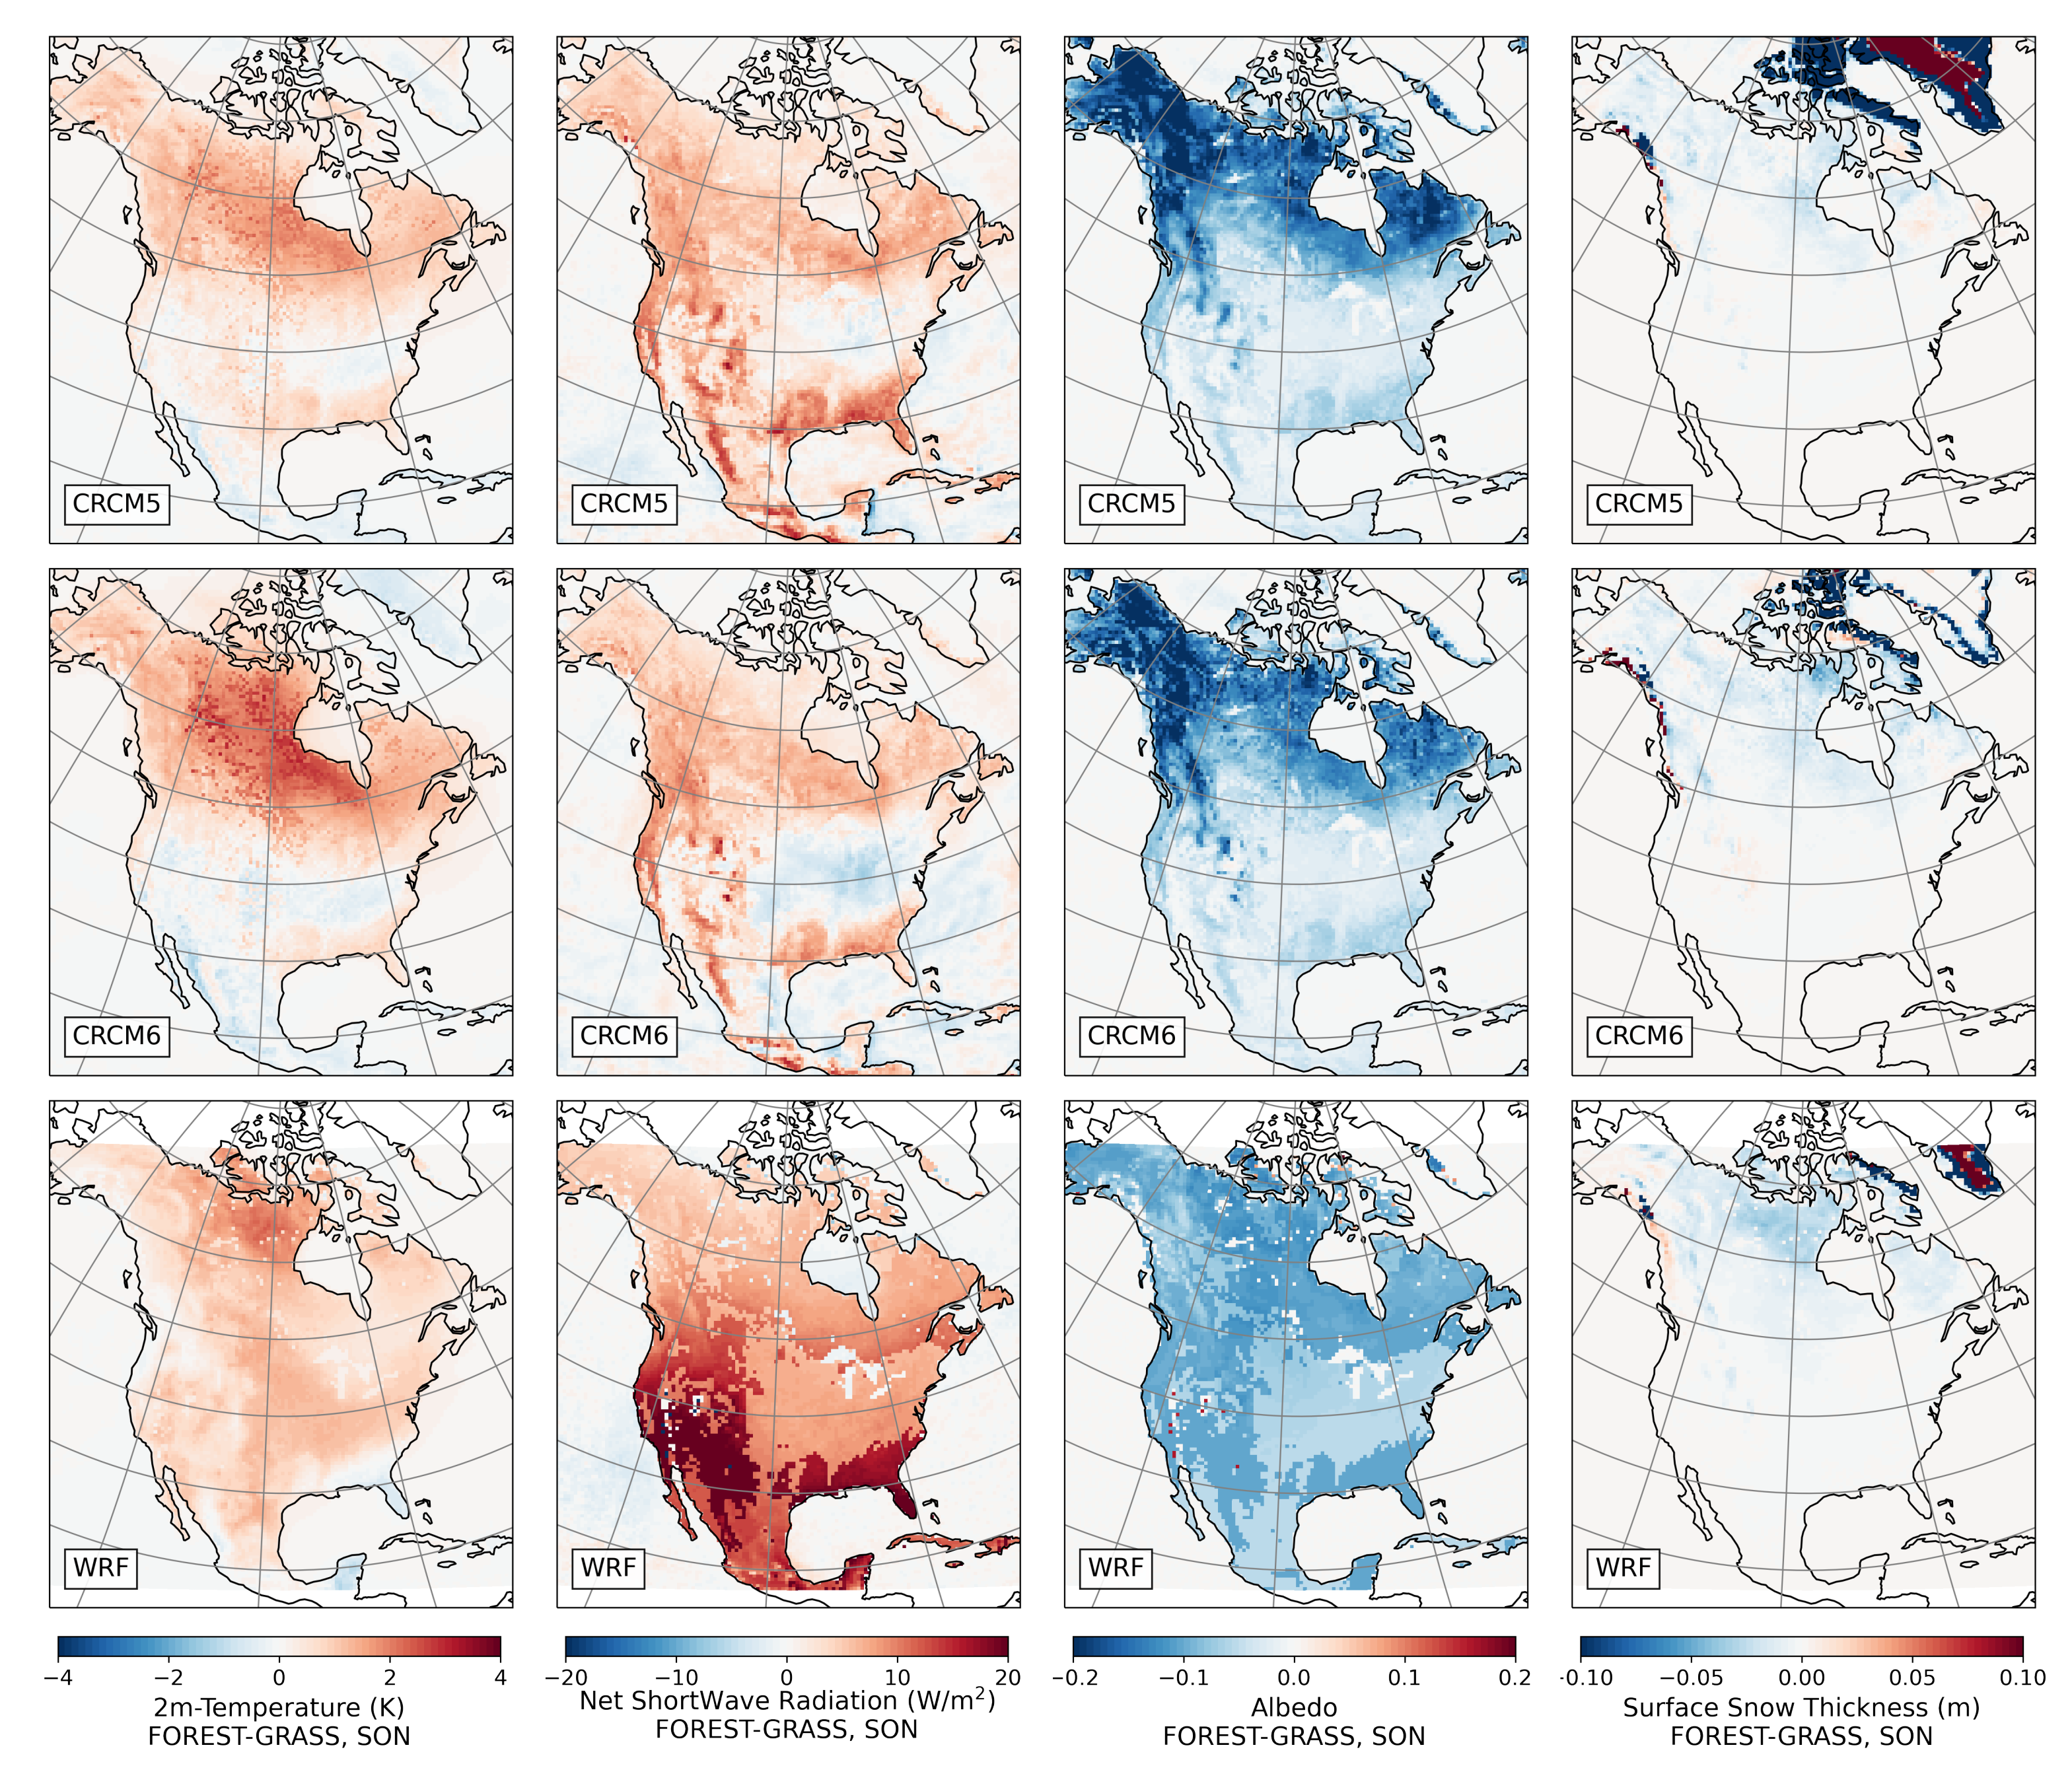
3.2.4. Fall
3.3. Energy Fluxes over Needleleaf and Broadleaf Forests
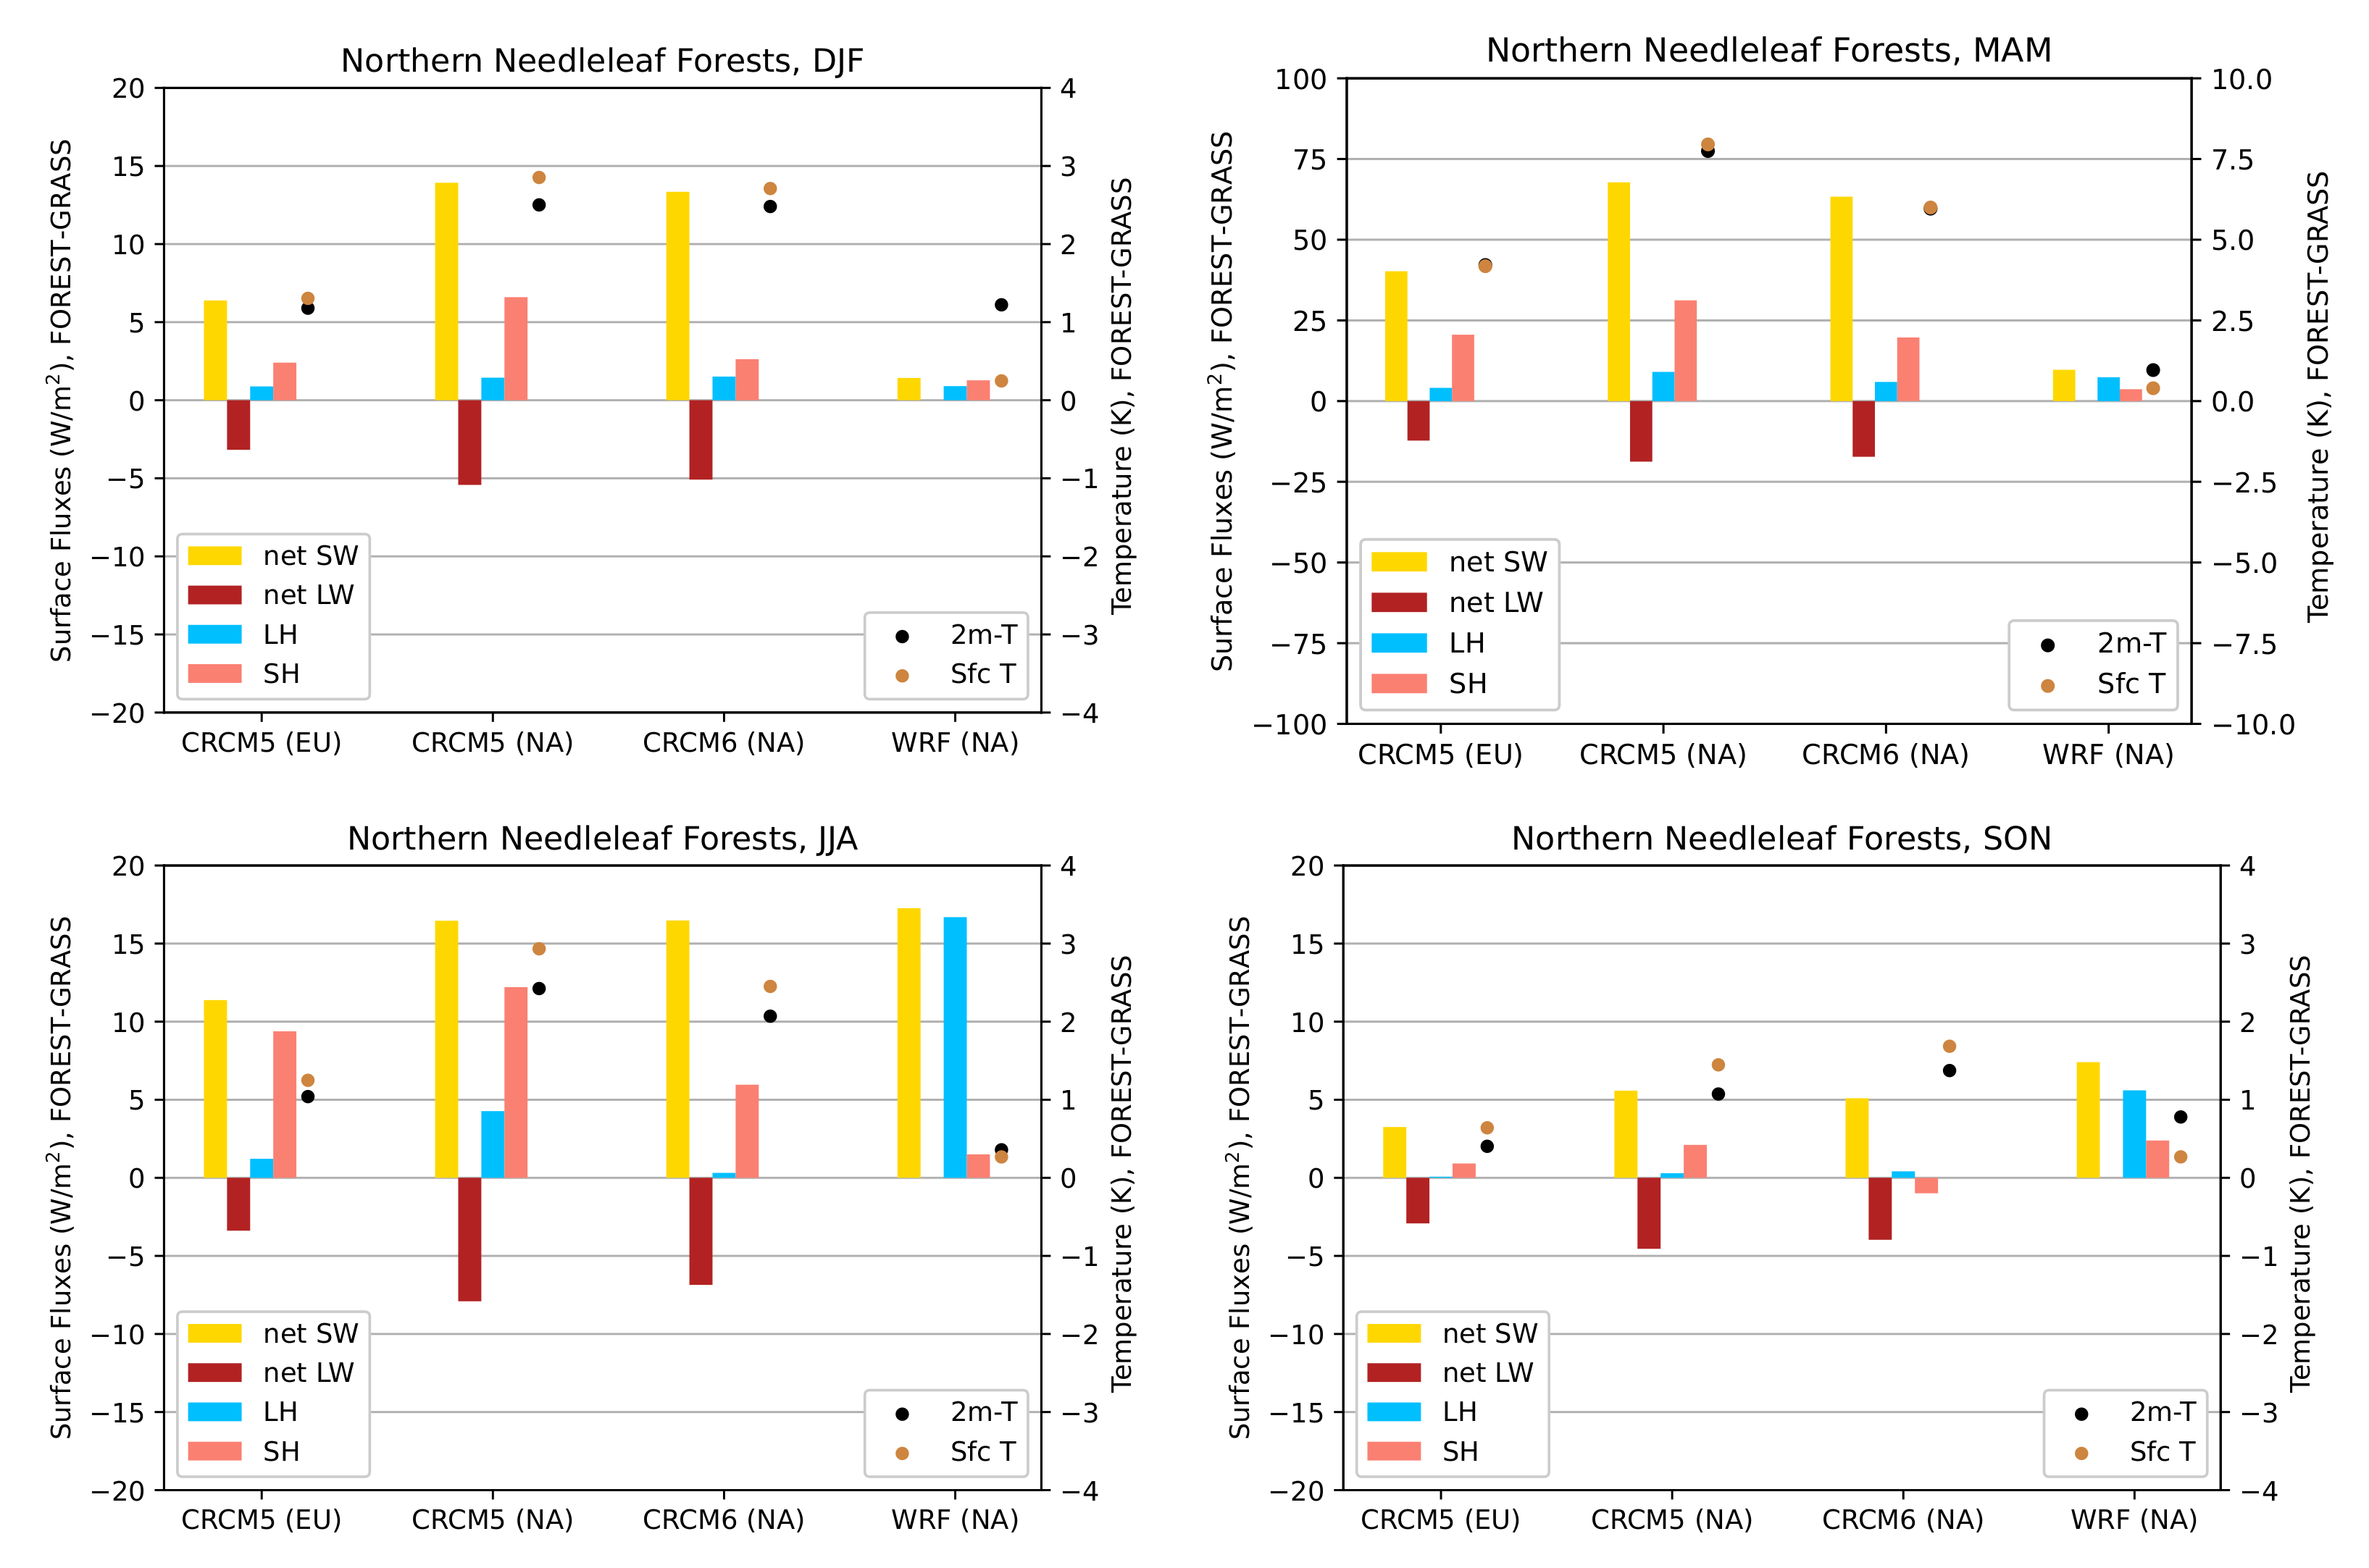
3.3.1. Northern Needleleaf Forests
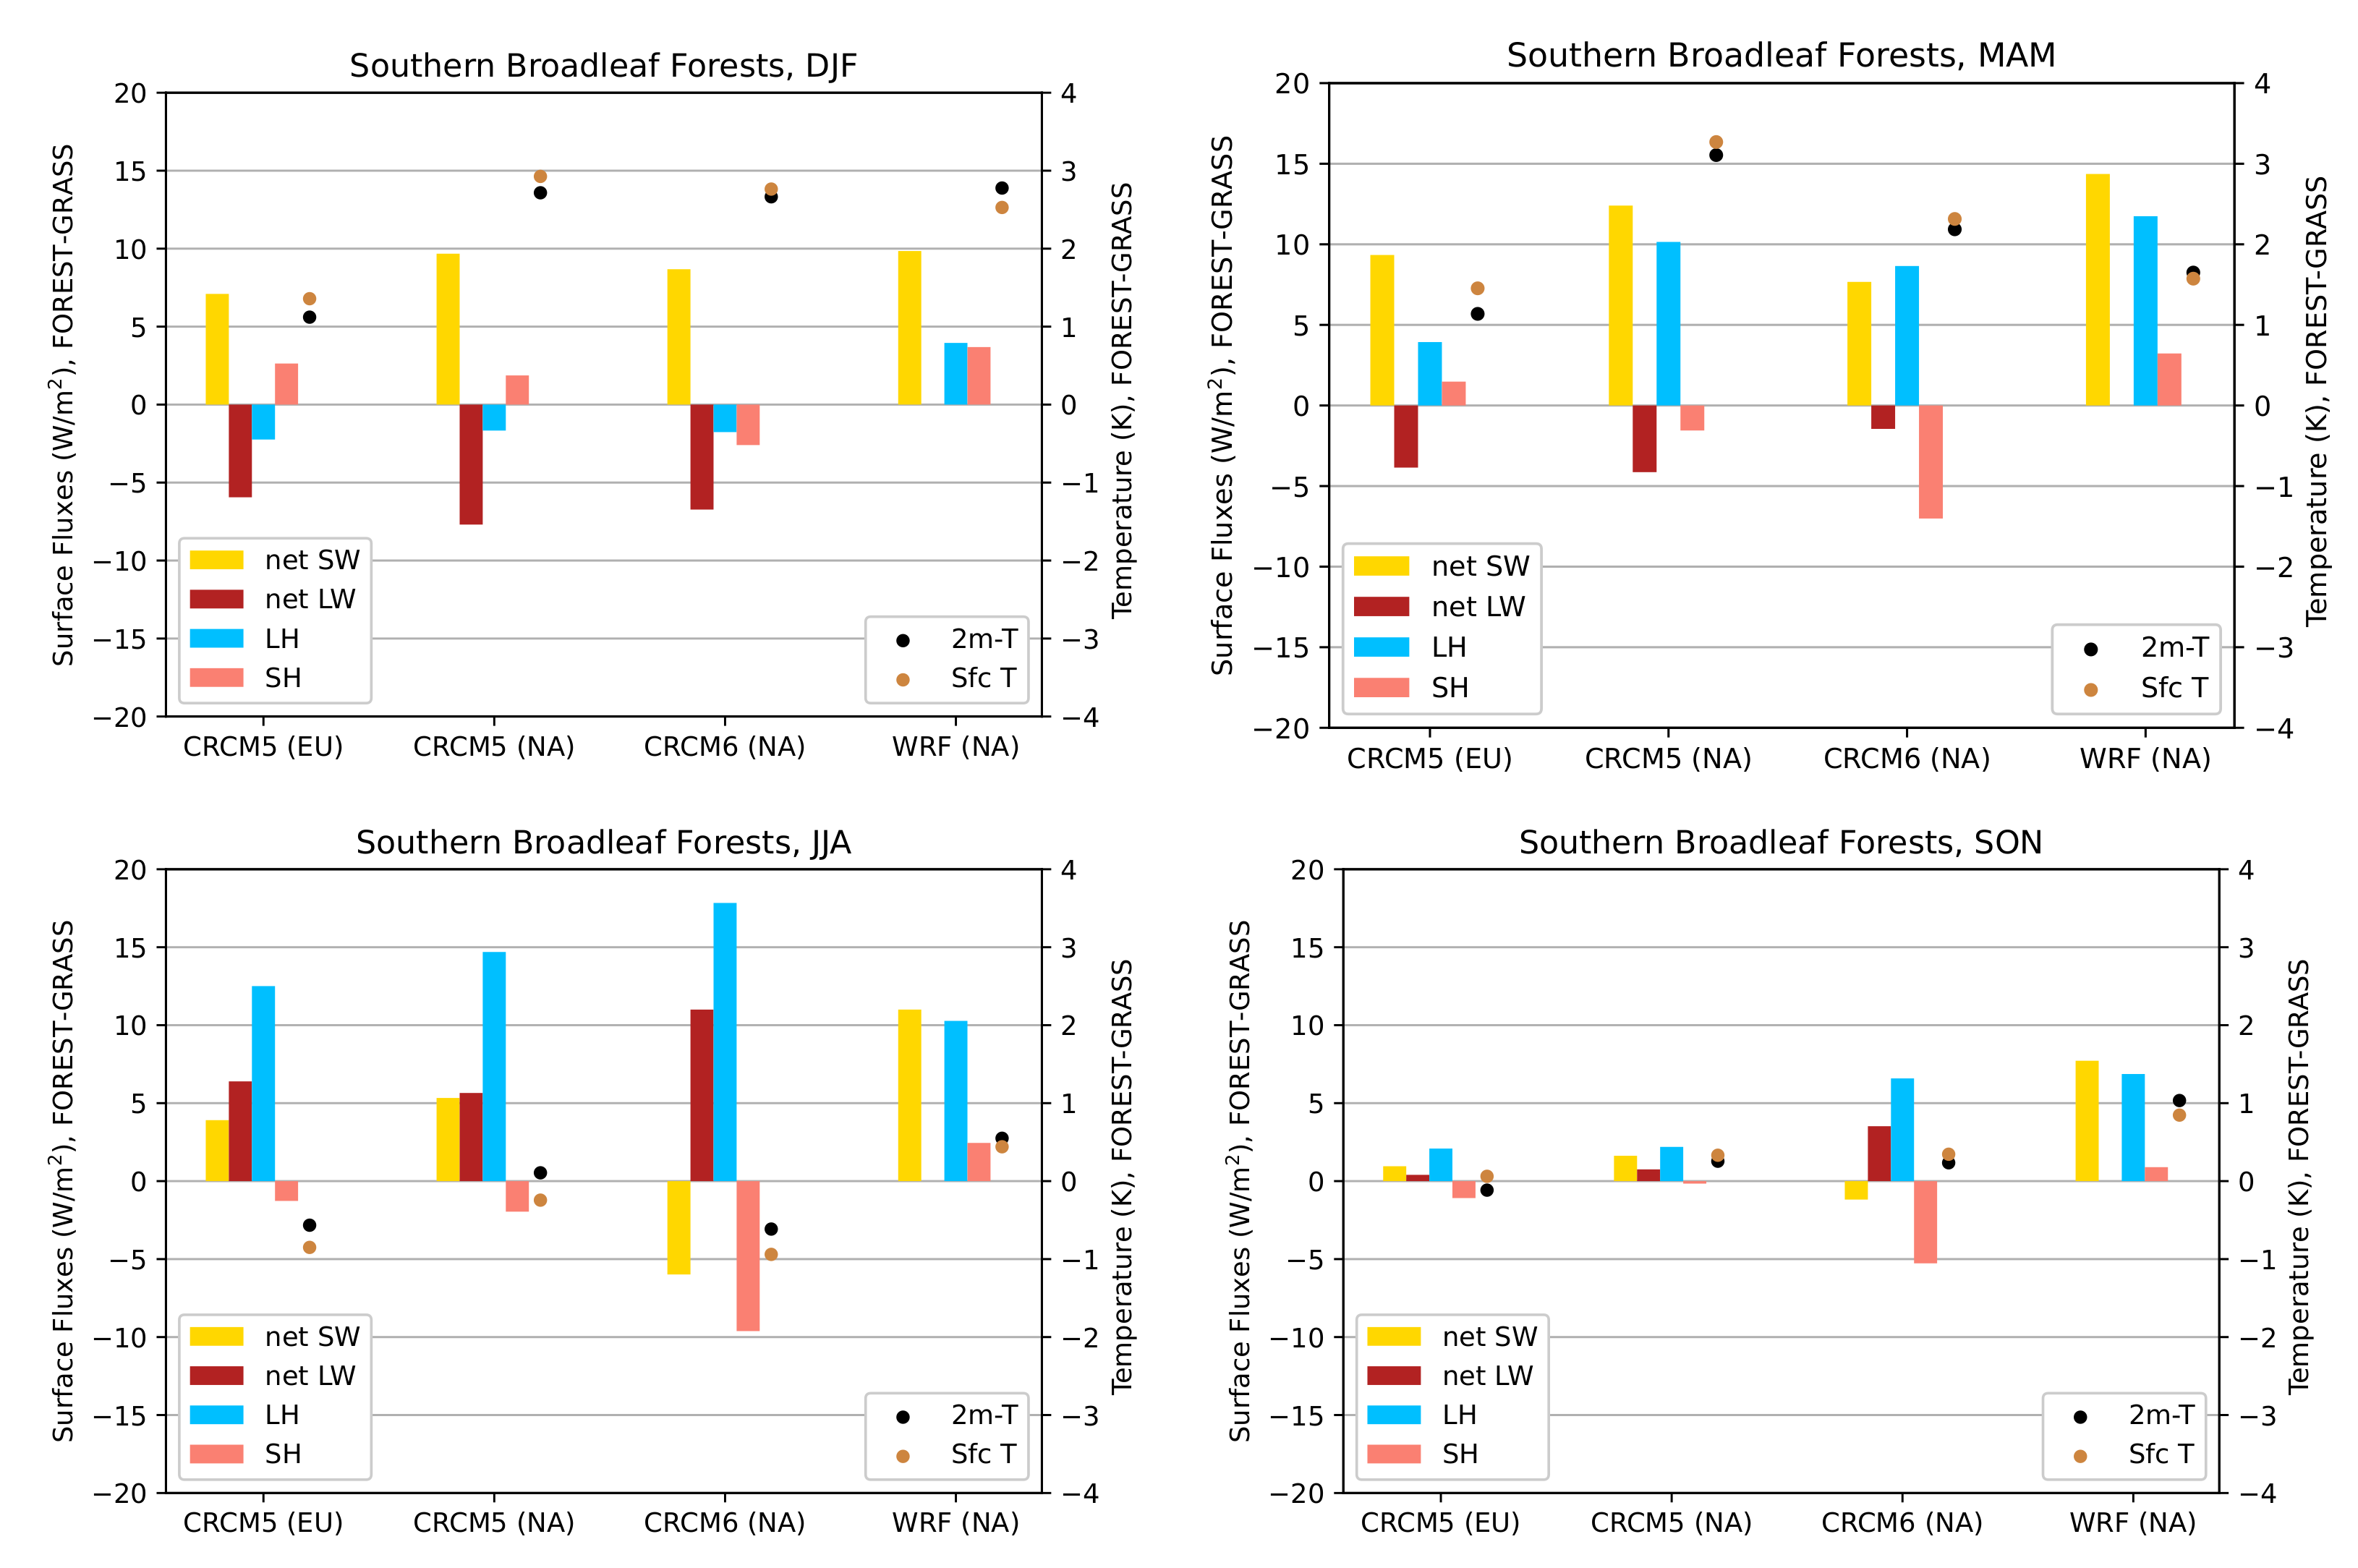
3.3.2. Southern Broadleaf Forests
3.3.3. General Remarks
4. Discussion
5. Conclusions
- The extreme forestation considered in this study has profound biogeophysical effects on the climate of North America and Europe. The response to forestation mainly depends on the season, latitude, vegetation distribution, and the models used to assess it.
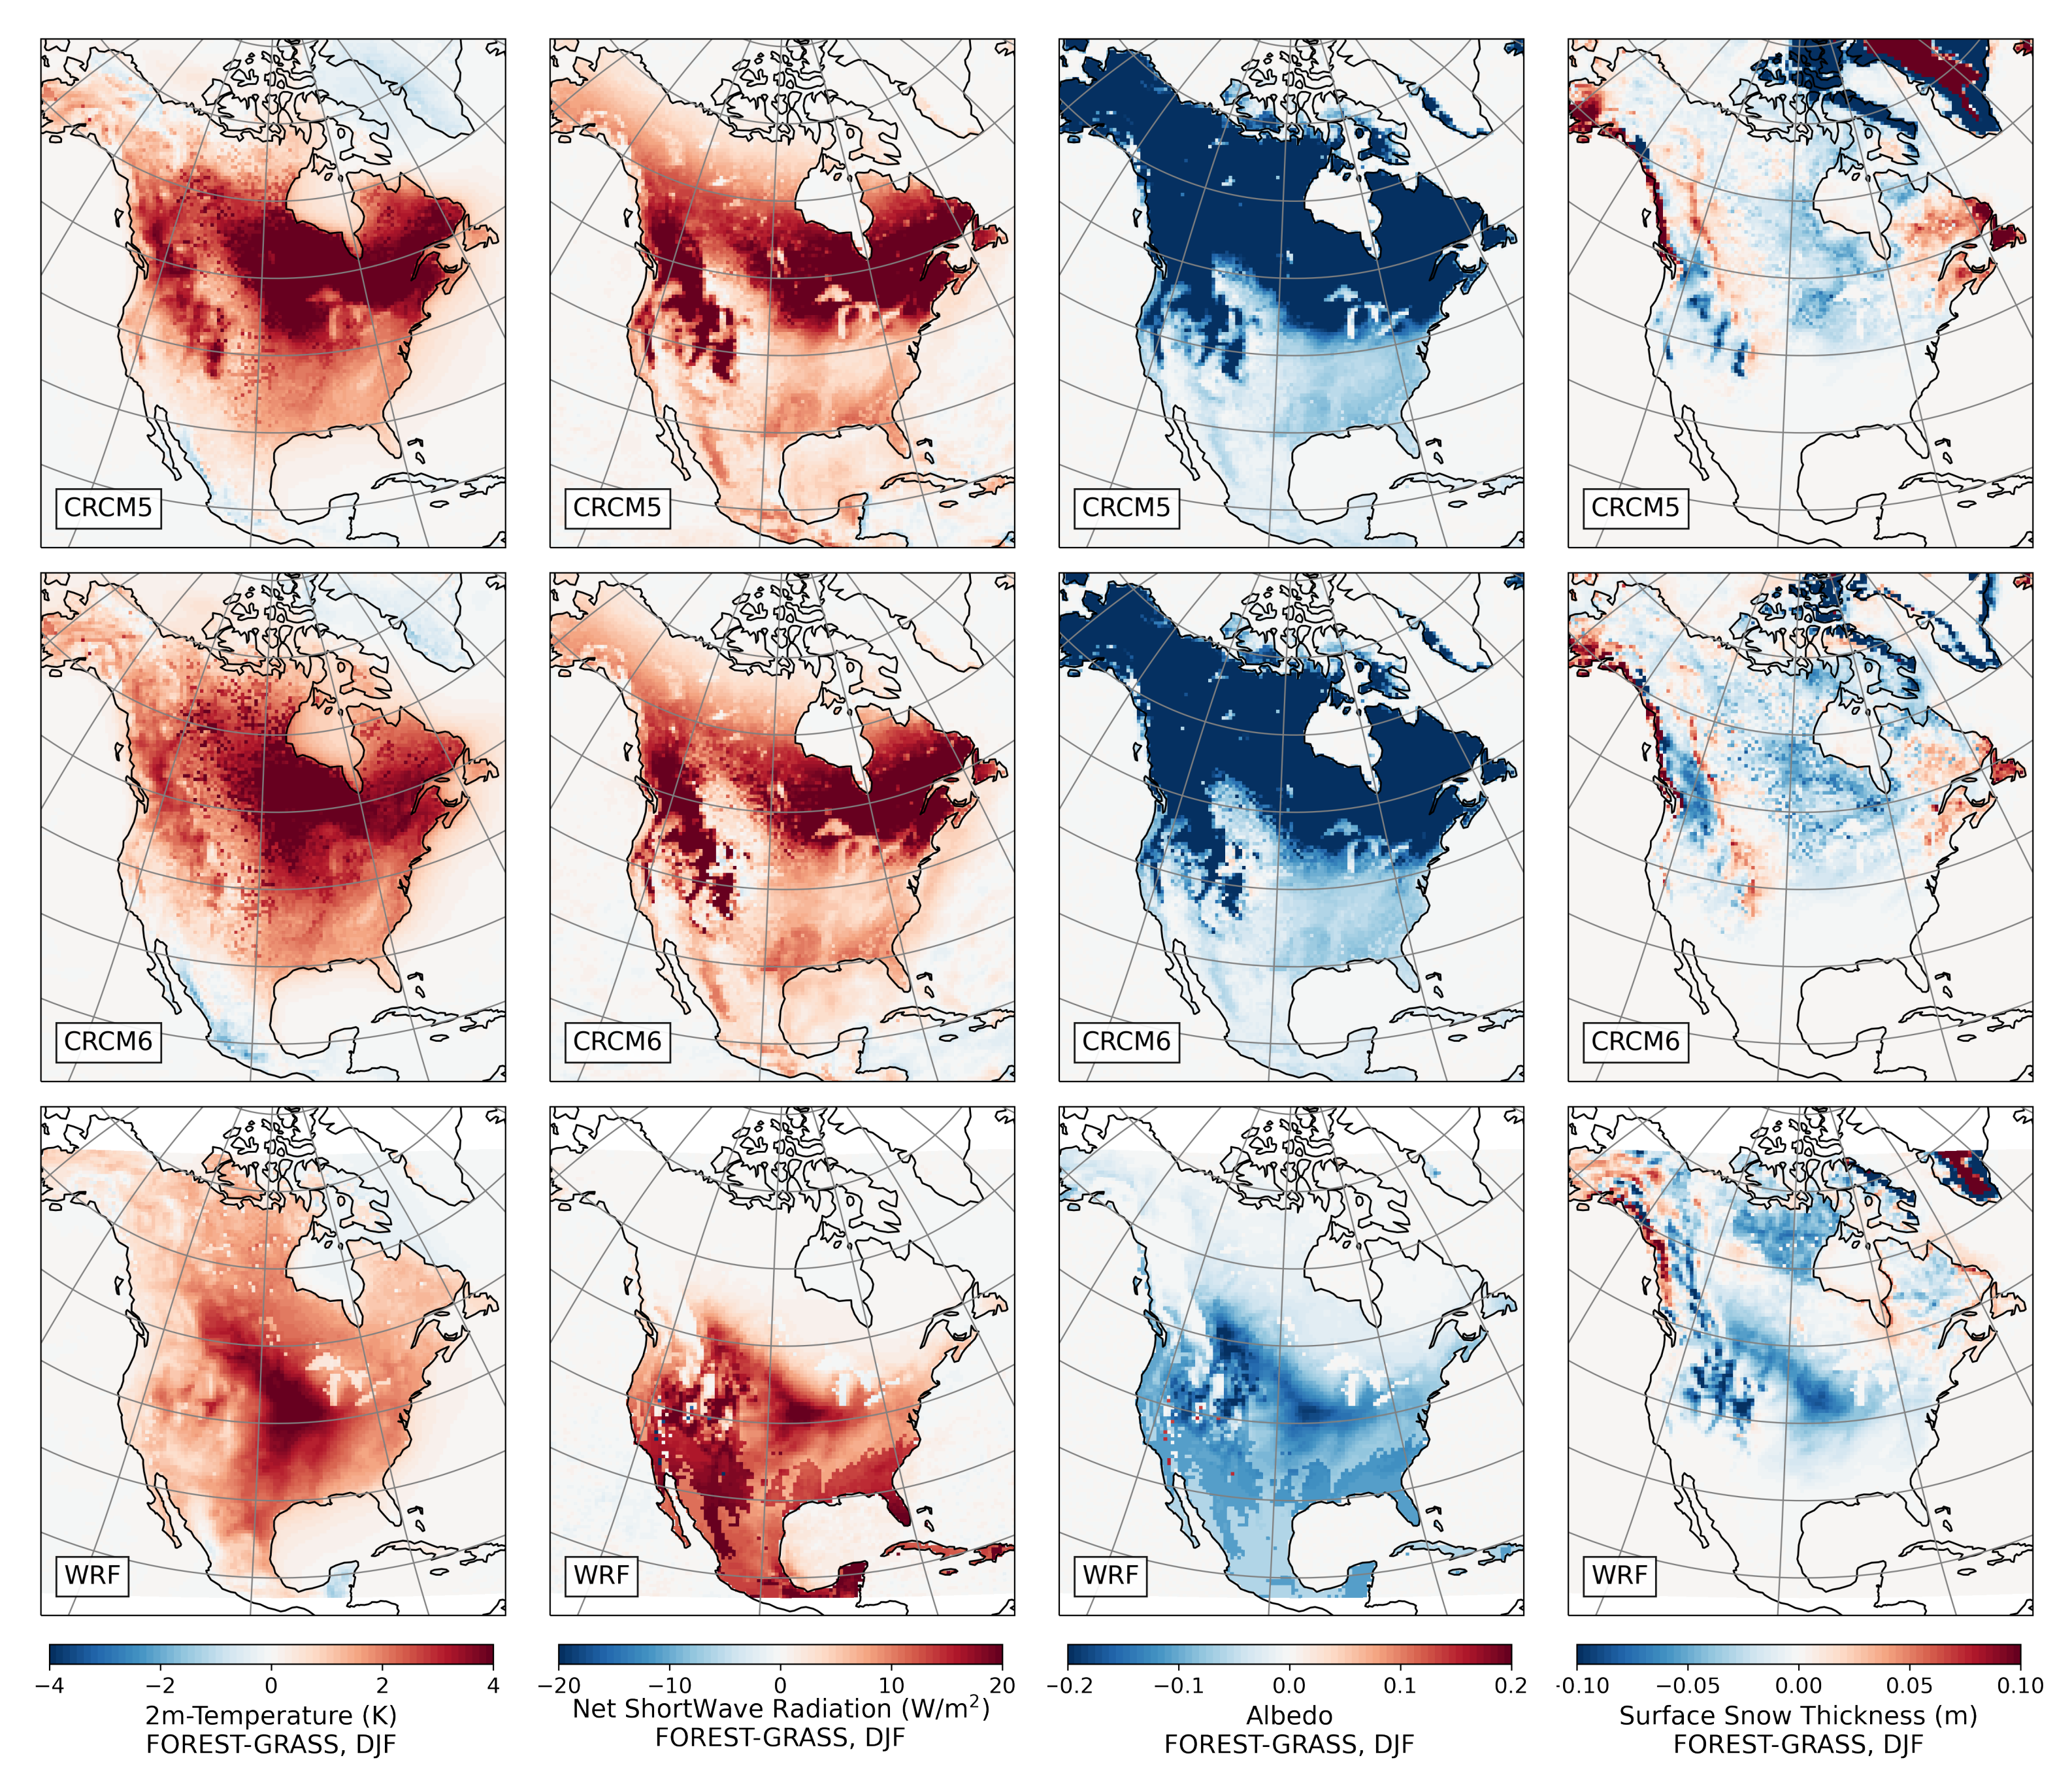
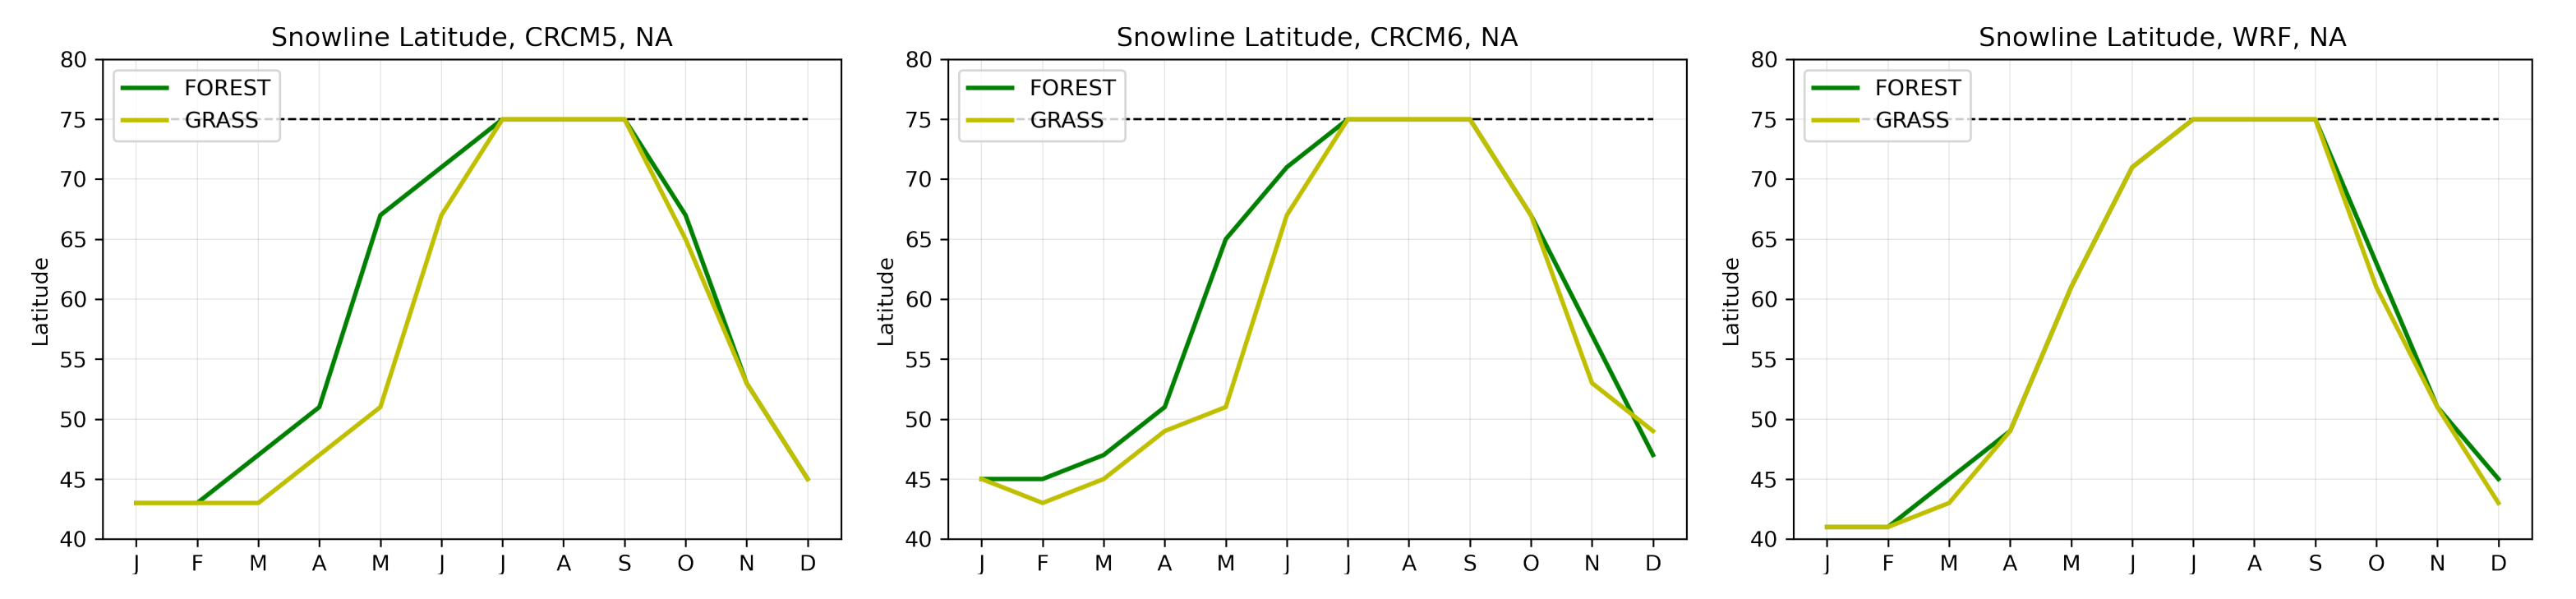
- During winter and spring, forestation causes widespread biogeophysical warming in all models (Figure 6 and Figure 7). Consistent with LUCAS, the warming hotspots occur over snow-masking northern needleleaf forests (except in WRF, which does not represent properly this phenomenon). Snow masking decreases the surface albedo, which increases net shortwave radiation and causes warming.
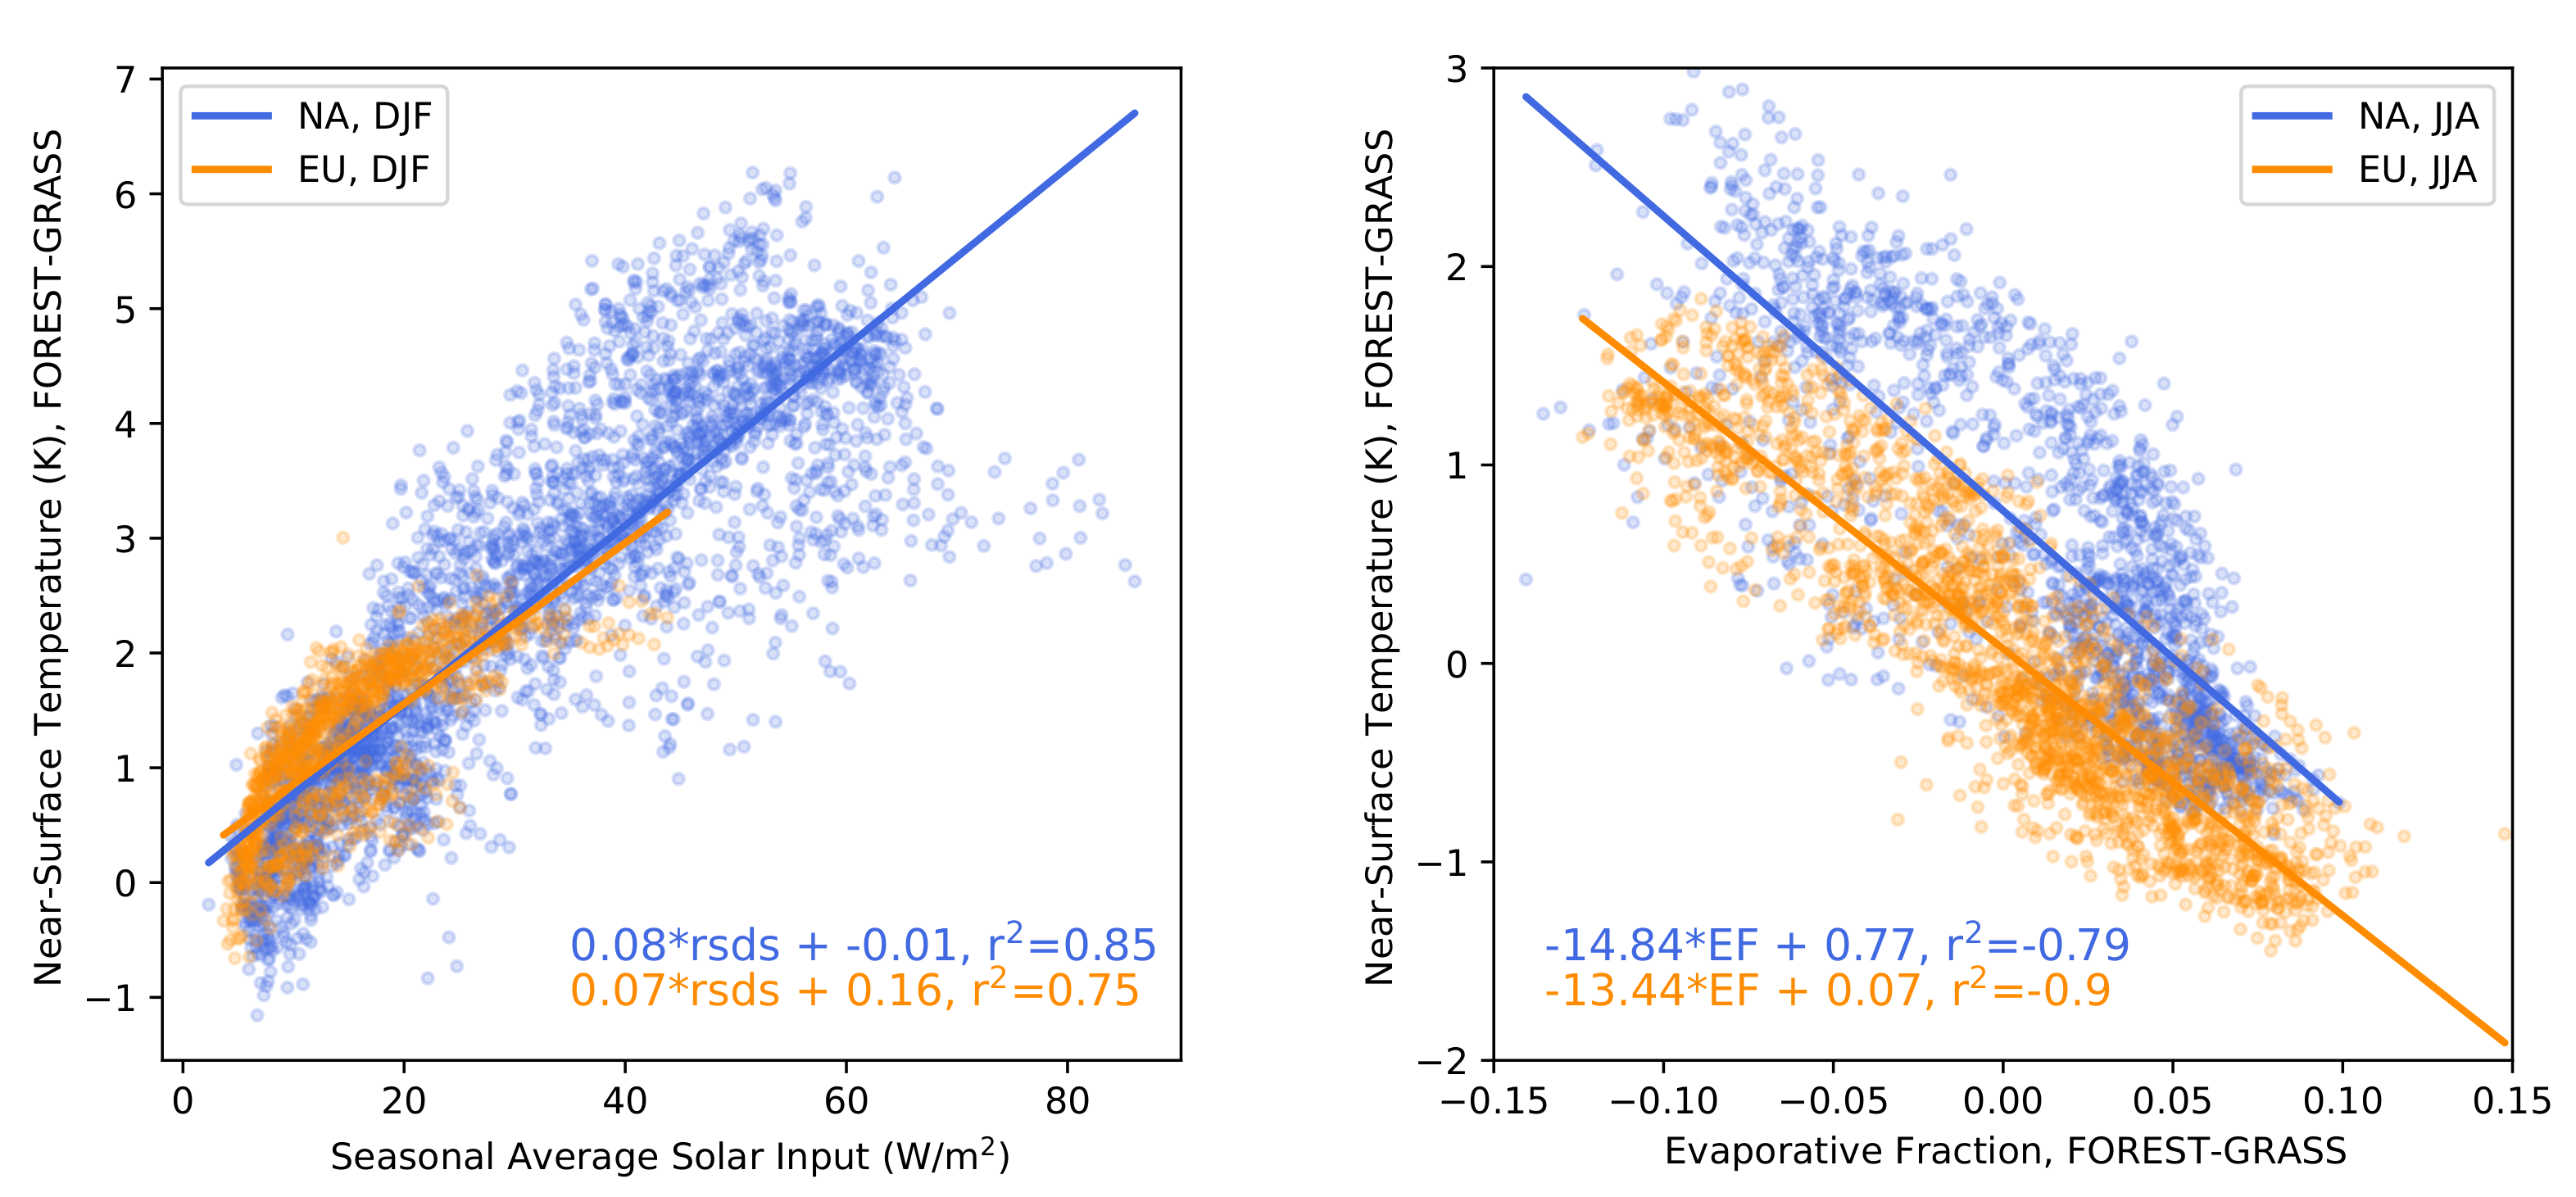
- The warming effect of snow masking is proportional to insolation (left panel of Figure 3). Snow-masking reduces albedo uniformly, but its effect on net shortwave excess and warming is magnified at low latitudes and during spring.
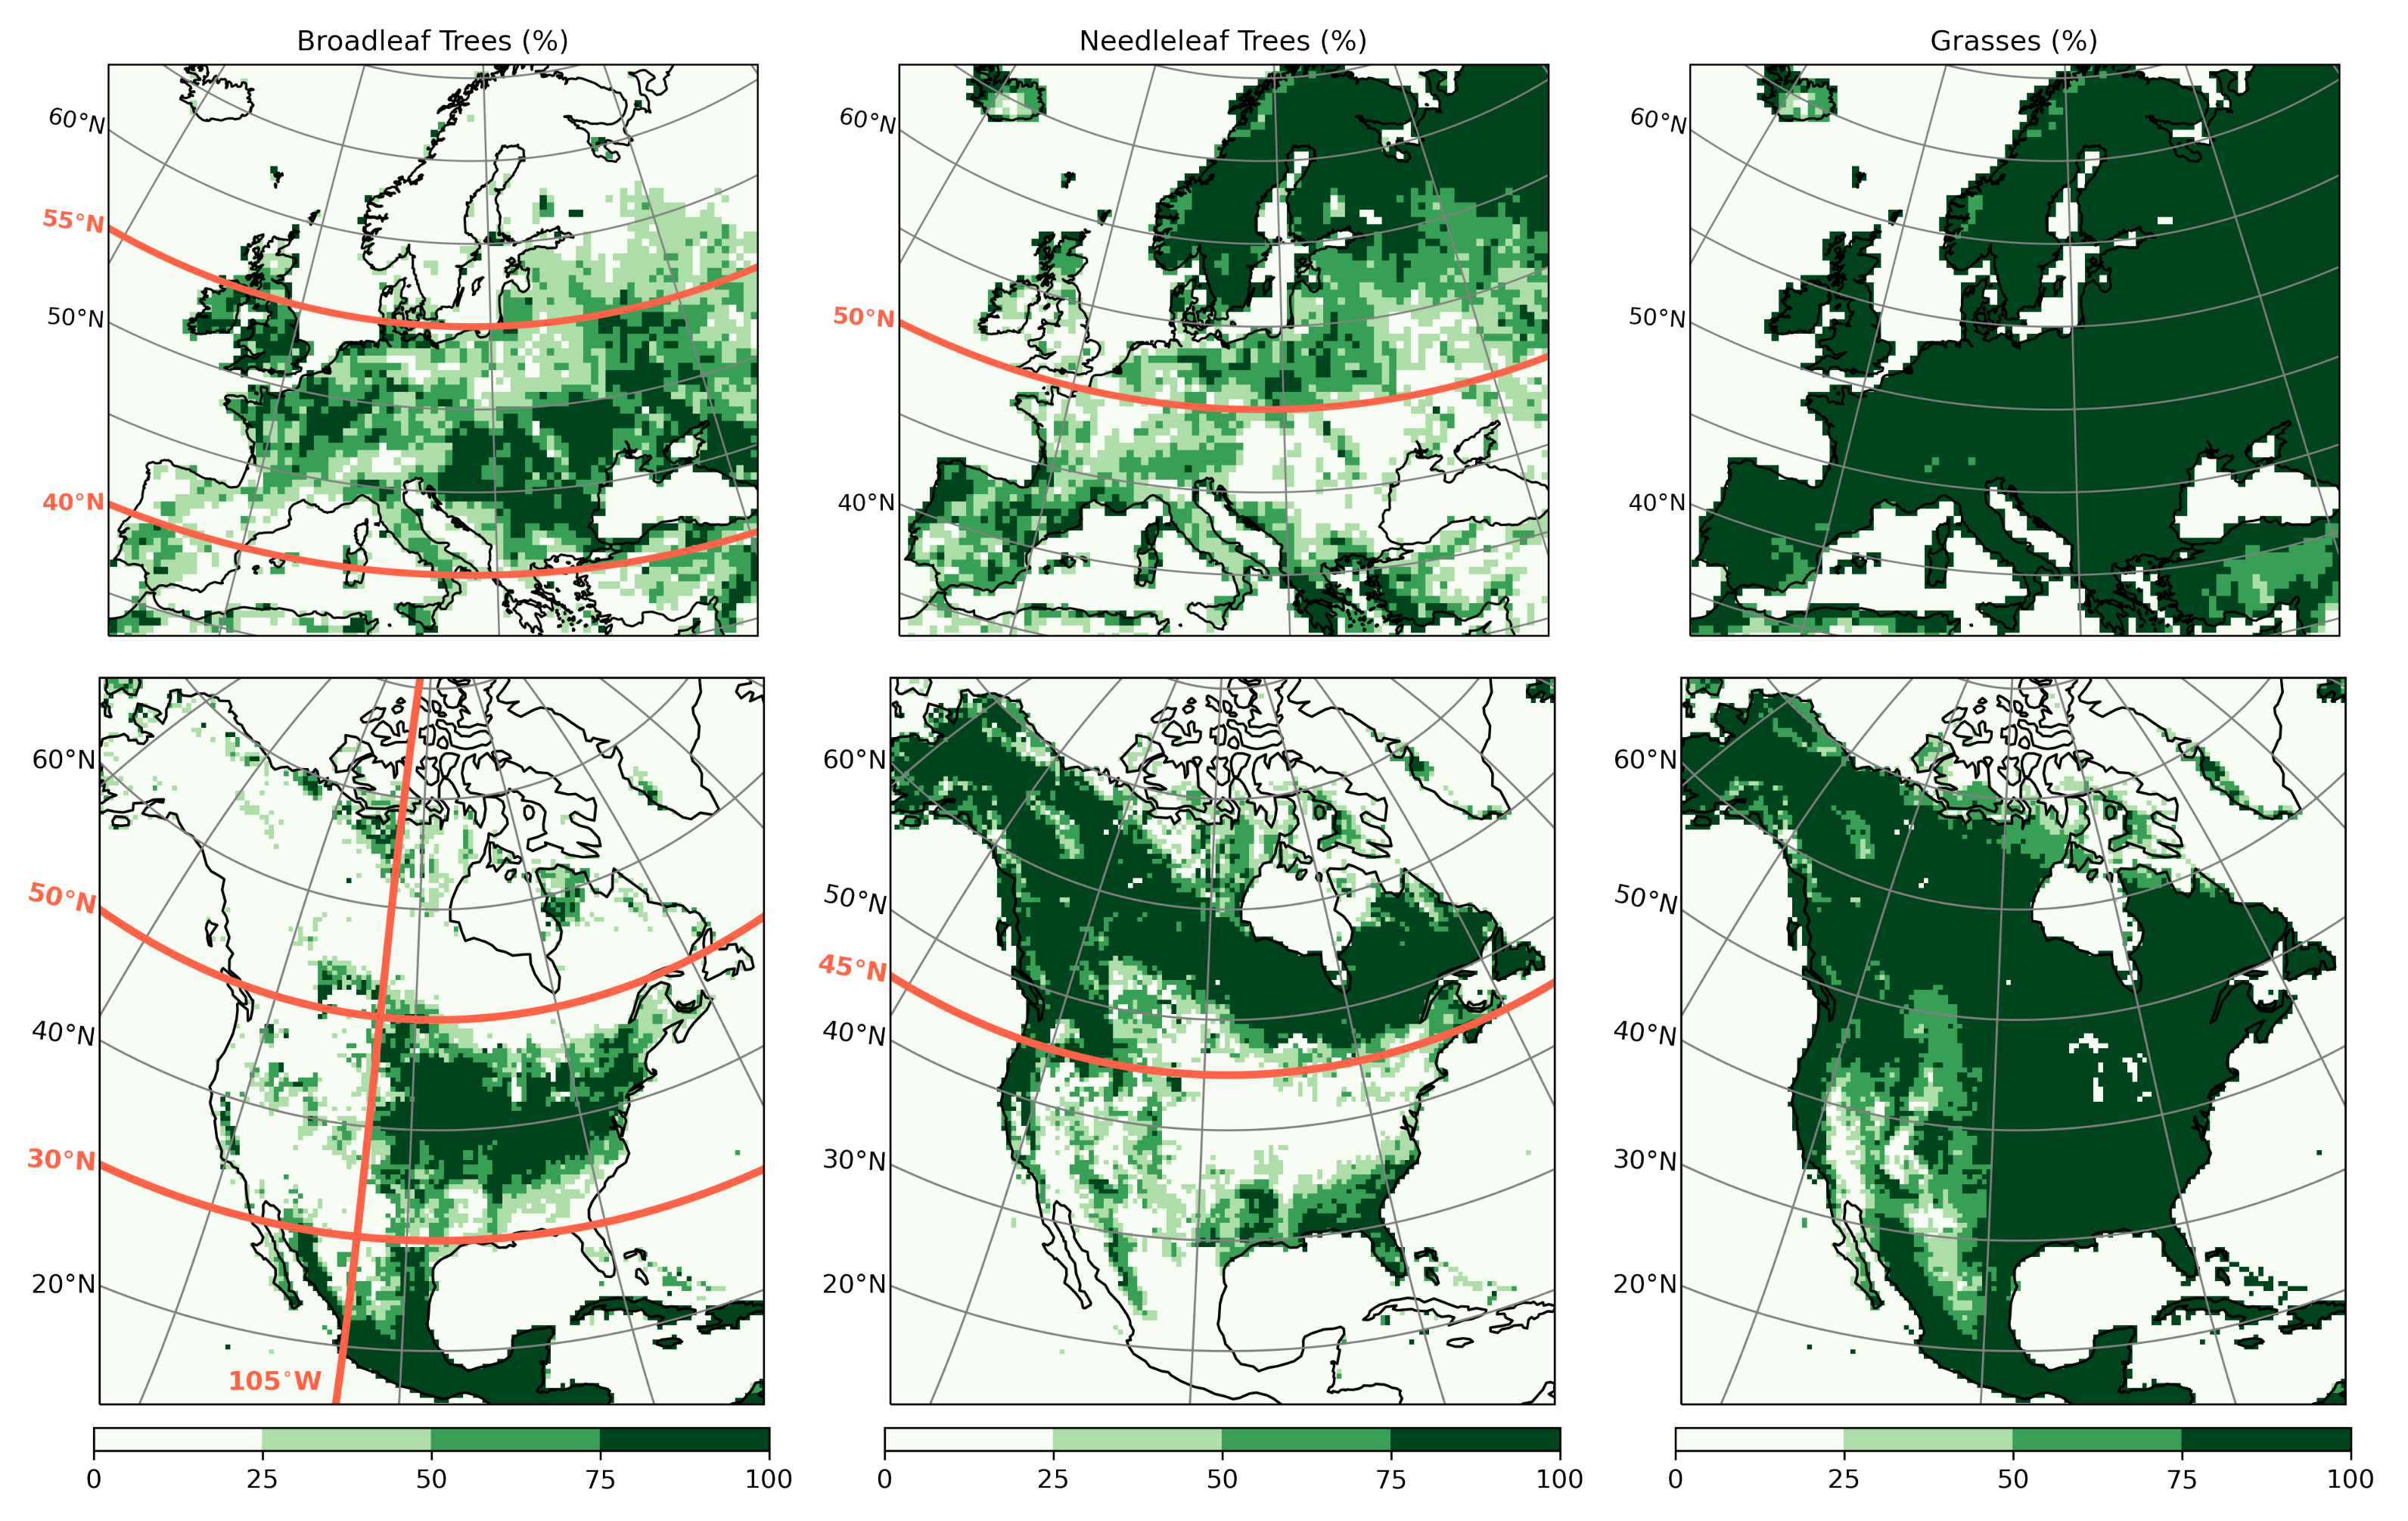
- Since northern needleleaf forests populate lower, hence sunnier, latitudes in North America than in Europe (Figure 1), the snow-masking effect causes more warming there. In other words, a needleleaf tree planted where it grows naturally may cause more biogeophysical warming in North America than in Europe.
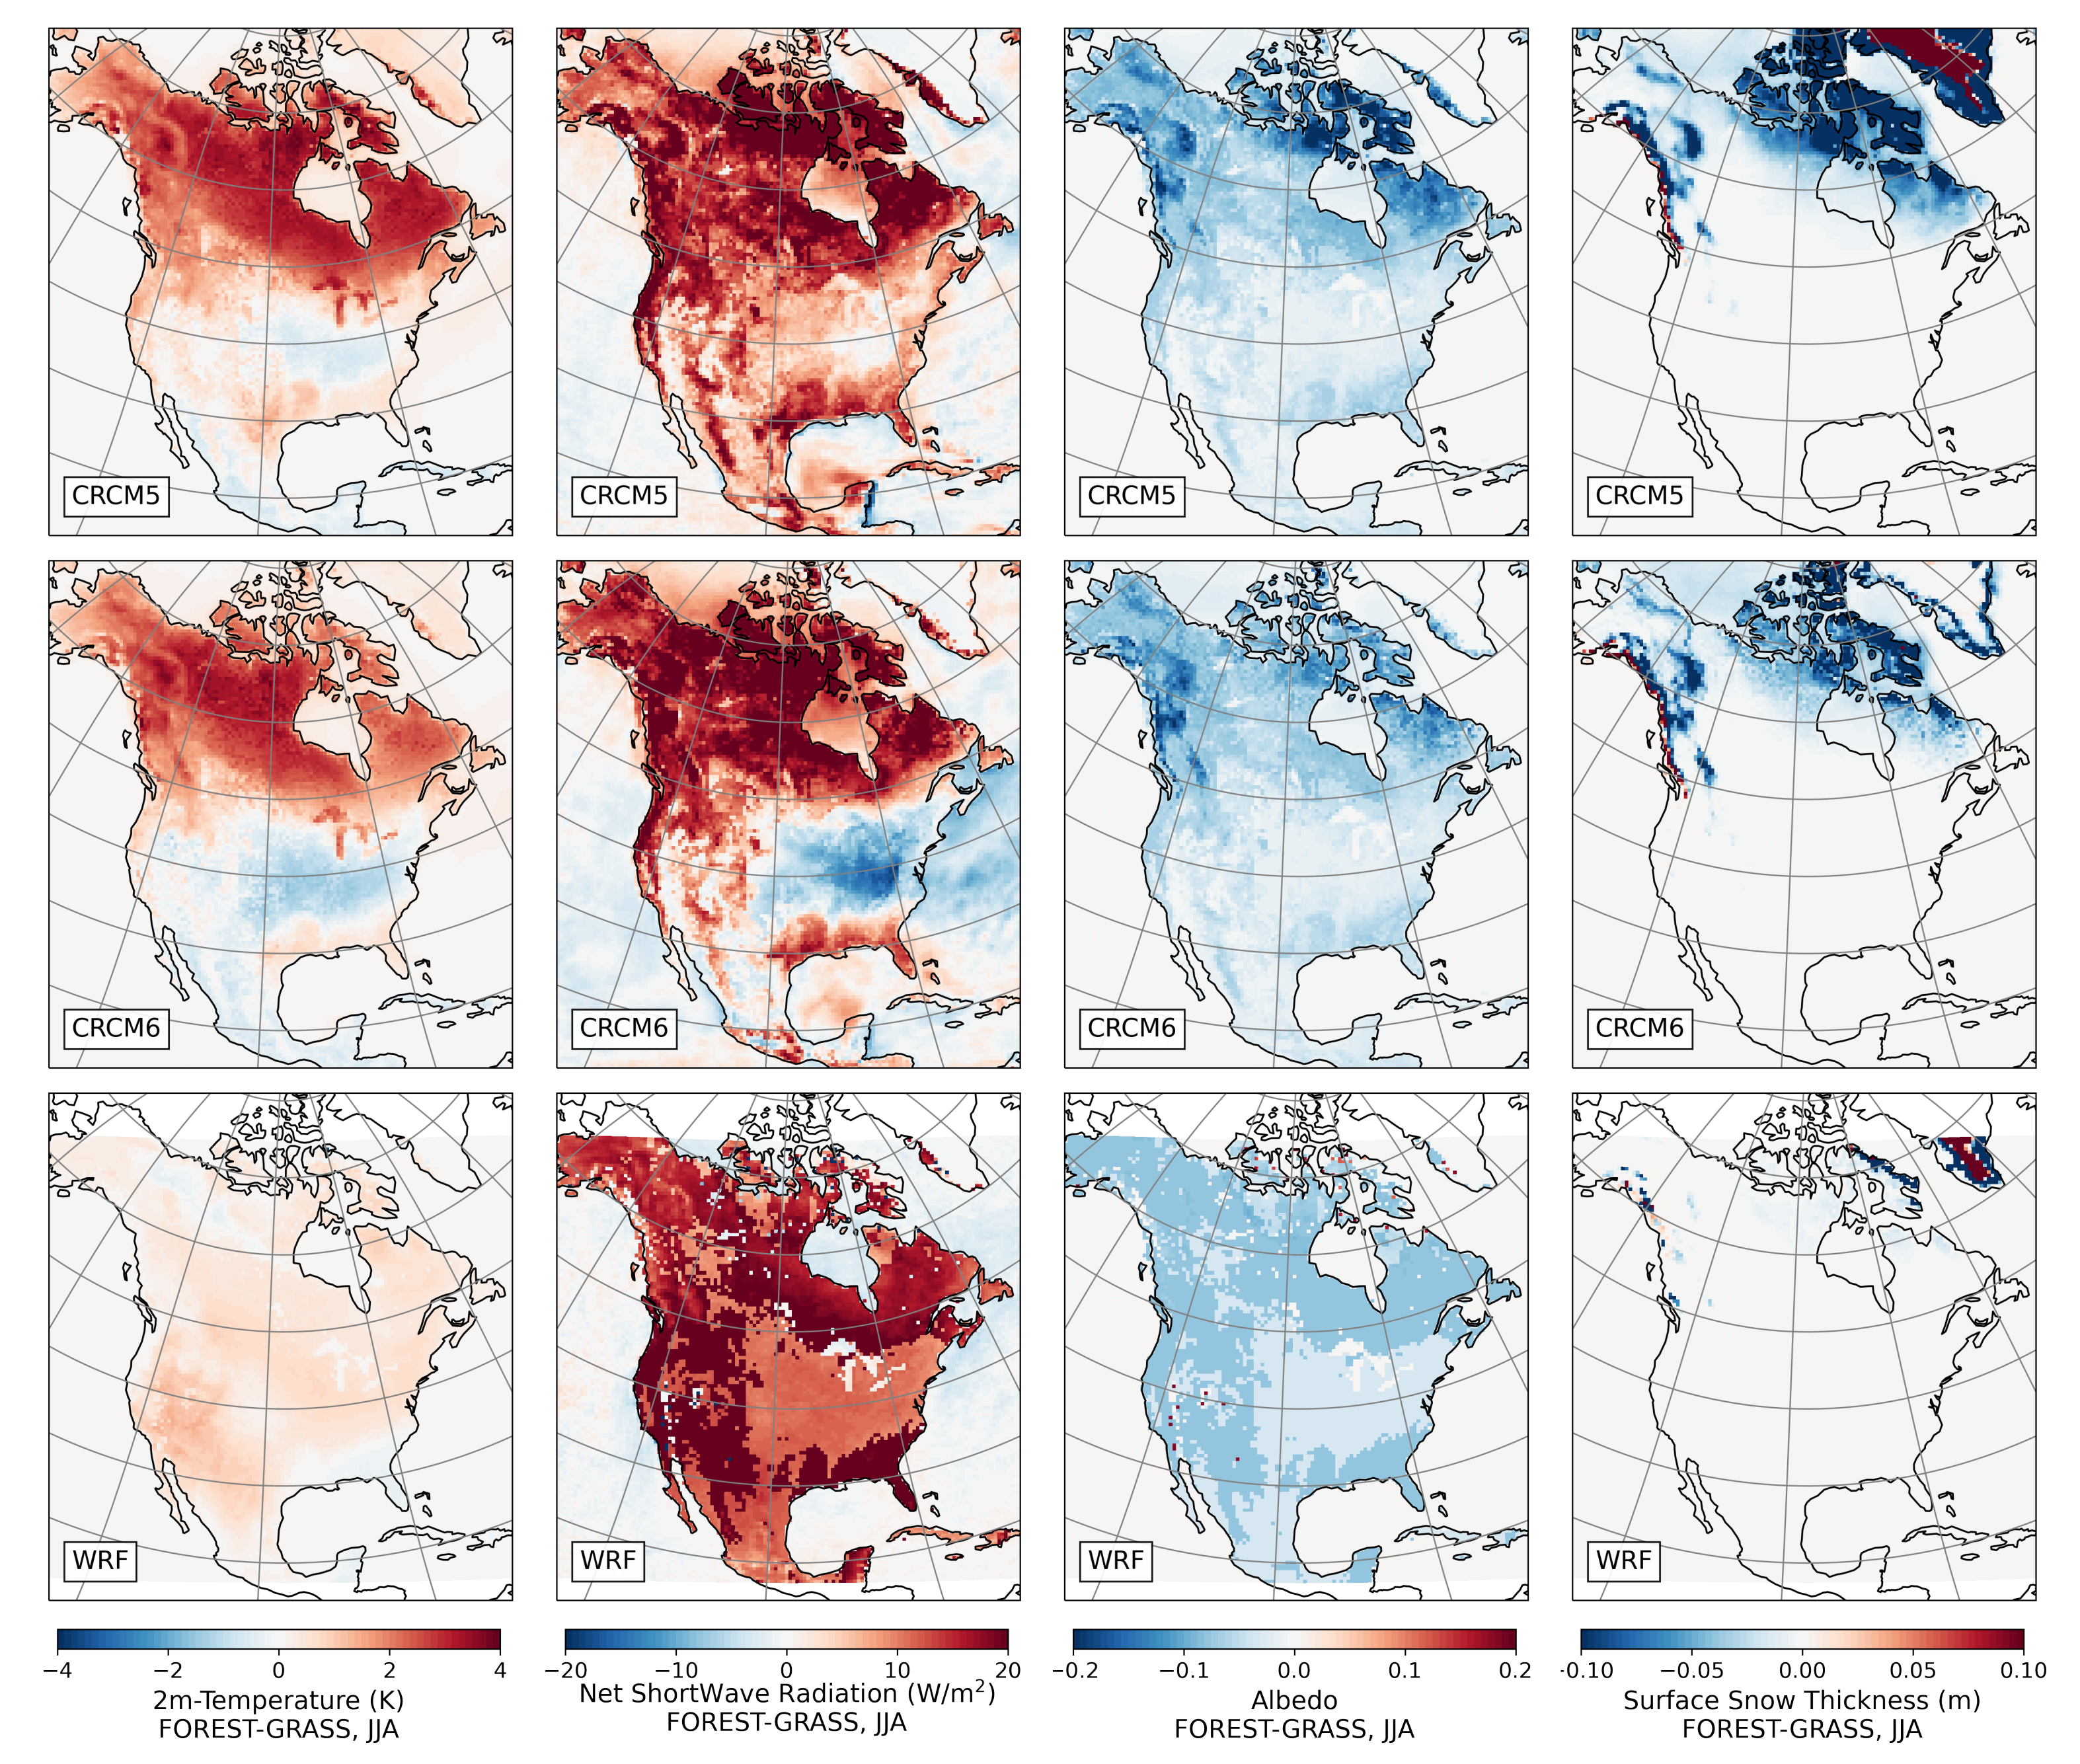
- During the summer and fall, the biogeophysical effects of forestation are more complex and less consistent across models (Figure 9 and Figure 10). The same difficulty appeared in LUCAS and LUCID. The main source of inter-model divergence is the vegetation’s impact on the partitioning of turbulent heat fluxes.
- Consistent with previous investigations, we find an inverse relationship between the summertime near-surface temperature and evaporative fraction (ratio of latent heat fluxes to total turbulent heat fluxes) responses to forestation (right panel of Figure 3). In other words, cooling tends to occur where forestation promotes evapotranspiration at the expense of sensible heat fluxes.
- Overall, we find that the main mechanisms driving the biogeophysical response to forestation—snow-masking in winter/spring and changes in the turbulent heat flux partition in summer/fall—are the same in North America and Europe.
- However, because both forest families (northern needleleaf and southern broadleaf forests) appear at lower latitudes in North America than in Europe, forestation implies more net shortwave radiation excess over North America. The surface ‘spends’ this energy, (that is, distributes it among the other energy fluxes such as longwave radiation and turbulent heat fluxes), in a similar manner over the two continents (Figure 13 and Figure 14).
- As such, the biophysical effects of extreme forestation are largely transferable between Europe and North America after correcting for differences in the distribution of vegetation.
Supplementary Materials
Author Contributions
Funding
Data Availability Statement
Acknowledgments
Conflicts of Interest
Abbreviations
| CLASS | Canadian Land Surface Scheme |
| CORDEX | Coordinated Regional Climate Downscaling Experiment |
| CRCM5 | Canadian Regional Climate Model, version 5 |
| CRCM6 | Canadian Regional Climate Model, version 6 |
| EF | Evaporative fraction |
| FPS | Flagship pilot study |
| MODIS | Moderate-resolution imaging spectroradiometer |
| WRF | Weather research and forecast |
| LUCAS | Land-Use and Climate Across Scales |
| LUCID | Land-Use and Climate, Identification of Robust Impacts |
| RCM | Regional climate model |
| WCRP | World Climate Research Program |
References
- Roe, S.; Streck, C.; Obersteiner, M.; Frank, S.; Griscom, B.; Drouet, L.; Fricko, O.; Gusti, M.; Harris, N.; Hasegawa, T.; et al. Contribution of the land sector to a 1.5 C world. Nat. Clim. Chang. 2019, 9, 817–828. [Google Scholar] [CrossRef]
- Shukla, P.; Skea, J.; Calvo Buendia, E.; Masson-Delmotte, V.; Pörtner, H.; Roberts, D.; Zhai, P.; Slade, R.; Connors, S.; Van Diemen, R.; et al. IPCC, 2019: Climate Change and Land: An IPCC Special Report on Climate Change, Desertification, Land Degradation, Sustainable Land Management, Food Security, and Greenhouse Gas Fluxes in Terrestrial Ecosystems; Intergovernmental Panel on Climate Change: Geneva, Switzerland, 2019. [Google Scholar]
- Perugini, L.; Caporaso, L.; Marconi, S.; Cescatti, A.; Quesada, B.; de Noblet-Ducoudre, N.; House, J.I.; Arneth, A. Biophysical effects on temperature and precipitation due to land cover change. Environ. Res. Lett. 2017, 12, 053002. [Google Scholar] [CrossRef]
- Pongratz, J.; Schwingshackl, C.; Bultan, S.; Obermeier, W.; Havermann, F.; Guo, S. Land Use Effects on Climate: Current State, Recent Progress, and Emerging Topics. Curr. Clim. Chang. Rep. 2021, 7, 99–120. [Google Scholar] [CrossRef]
- Duveiller, G.; Hooker, J.; Cescatti, A. The mark of vegetation change on Earth’s surface energy balance. Nat. Commun. 2018, 9, 679. [Google Scholar] [CrossRef]
- Windisch, M.G.; Davin, E.L.; Seneviratne, S.I. Prioritizing forestation based on biogeochemical and local biogeophysical impacts. Nat. Clim. Chang. 2021, 11, 867–871. [Google Scholar] [CrossRef]
- Pitman, A.J.; de Noblet-Ducoudré, N.; Cruz, F.; Davin, E.L.; Bonan, G.; Brovkin, V.; Claussen, M.; Delire, C.; Ganzeveld, L.; Gayler, V.; et al. Uncertainties in climate responses to past land cover change: First results from the LUCID intercomparison study. Geophys. Res. Lett. 2009, 36. [Google Scholar] [CrossRef]
- De Noblet-Ducoudré, N.; Boisier, J.P.; Pitman, A.; Bonan, G.; Brovkin, V.; Cruz, F.; Delire, C.; Gayler, V.; Van den Hurk, B.; Lawrence, P.; et al. Determining robust impacts of land-use-induced land cover changes on surface climate over North America and Eurasia: Results from the first set of LUCID experiments. J. Clim. 2012, 25, 3261–3281. [Google Scholar] [CrossRef]
- Lejeune, Q.; Seneviratne, S.I.; Davin, E.L. Historical land-cover change impacts on climate: Comparative assessment of LUCID and CMIP5 multimodel experiments. J. Clim. 2017, 30, 1439–1459. [Google Scholar] [CrossRef]
- Mearns, L.O.; Arritt, R.; Biner, S.; Bukovsky, M.S.; McGinnis, S.; Sain, S.; Caya, D.; Correia, J.; Flory, D.; Gutowski, W.; et al. The North American regional climate change assessment program: Overview of phase I results. Bull. Am. Meteorol. Soc. 2012, 93, 1337–1362. [Google Scholar] [CrossRef]
- Solman, S.A.; Sanchez, E.; Samuelsson, P.; da Rocha, R.P.; Li, L.; Marengo, J.; Pessacg, N.L.; Remedio, A.; Chou, S.; Berbery, H.; et al. Evaluation of an ensemble of regional climate model simulations over South America driven by the ERA-Interim reanalysis: Model performance and uncertainties. Clim. Dyn. 2013, 41, 1139–1157. [Google Scholar] [CrossRef]
- Jacob, D.; Petersen, J.; Eggert, B.; Alias, A.; Christensen, O.B.; Bouwer, L.M.; Braun, A.; Colette, A.; Déqué, M.; Georgievski, G.; et al. EURO-CORDEX: New high-resolution climate change projections for European impact research. Reg. Environ. Chang. 2014, 14, 563–578. [Google Scholar] [CrossRef]
- Alexandru, A.; Sushama, L. Impact of land-use and land-cover changes on CRCM5 climate projections over North America for the twenty-first century. Clim. Dyn. 2016, 47, 1197–1209. [Google Scholar] [CrossRef]
- Mooney, P.; Sobolowski, S.; Lee, H. Designing and evaluating regional climate simulations for high latitude land use land cover change studies. Tellus Dyn. Meteorol. Oceanogr. 2020, 72, 1–17. [Google Scholar] [CrossRef]
- Mooney, P.; Lee, H.; Sobolowski, S. Impact of Quasi-Idealized Future Land Cover Scenarios at High Latitudes in Complex Terrain. Earth’s Future 2021, 9, e2020EF001838. [Google Scholar] [CrossRef]
- Bukovsky, M.S.; Gao, J.; Mearns, L.O.; O’Neill, B.C. SSP-Based Land-Use Change Scenarios: A Critical Uncertainty in Future Regional Climate Change Projections. Earth’s Future 2021, 9, e2020EF001782. [Google Scholar] [CrossRef]
- Li, W.; Li, L.; Chen, J.; Lin, Q.; Chen, H. Impacts of land use and land cover change and reforestation on summer rainfall in the Yangtze River basin. Hydrol. Earth Syst. Sci. 2021, 25, 4531–4548. [Google Scholar] [CrossRef]
- Rechid, D.; Davin, E.; de Noblet-Ducoudré, N.; Katragkou, E.; The LUCAS Team. CORDEX Flagship Pilot Study “LUCAS-Land Use & Climate Across Scales”—A new initiative on coordinated regional land use change and climate experiments for Europe. In Proceedings of the 19th EGU General Assembly Conference Abstracts, EGU2017, Vienna, Austria, 23–28 April 2017; p. 13172. [Google Scholar]
- Davin, E.L.; Rechid, D.; Breil, M.; Cardoso, R.M.; Coppola, E.; Hoffmann, P.; Jach, L.L.; Katragkou, E.; de Noblet-Ducoudré, N.; Radtke, K.; et al. Biogeophysical impacts of forestation in Europe: First results from the LUCAS (Land Use and Climate Across Scales) regional climate model intercomparison. Earth Syst. Dyn. 2020, 11, 183–200. [Google Scholar] [CrossRef]
- Daloz, A.S.; Schwingshackl, C.; Mooney, P.; Strada, S.; Rechid, D.; Davin, E.L.; Katragkou, E.; de Noblet-Ducoudré, N.; Belda, M.; Halenka, T.; et al. Land-atmosphere interactions in sub-polar and alpine climates in the CORDEX FPS LUCAS models: I. Evaluation of the snow-albedo effect. Cryosphere Discuss. 2021, 16, 2403–2419. [Google Scholar] [CrossRef]
- Mooney, P.A.; Rechid, D.; Davin, E.L.; Katragkou, E.; de Noblet-Ducoudré, N.; Breil, M.; Cardoso, R.M.; Daloz, A.S.; Hoffmann, P.; Lima, D.C.; et al. Land-atmosphere interactions in sub-polar and alpine climates in the CORDEX FPS LUCAS models: Part II. The role of changing vegetation. Cryosphere Discuss. 2021, 16, 1383–1397. [Google Scholar] [CrossRef]
- Breil, M.; Rechid, D.; Davin, E.; de Noblet-Ducoudré, N.; Katragkou, E.; Cardoso, R.; Hoffmann, P.; Jach, L.; Soares, P.; Sofiadis, G.; et al. The opposing effects of reforestation and afforestation on the diurnal temperature cycle at the surface and in the lowest atmospheric model level in the European summer. J. Clim. 2020, 33, 9159–9179. [Google Scholar] [CrossRef]
- Sofiadis, G.; Katragkou, E.; Davin, E.L.; Rechid, D.; de Noblet-Ducoudre, N.; Breil, M.; Cardoso, R.M.; Hoffmann, P.; Jach, L.; Meier, R.; et al. Afforestation impact on soil temperature in regional climate model simulations over Europe. Geosci. Model Dev. Discuss. 2021, 15, 1–35. [Google Scholar] [CrossRef]
- Breil, M.; Davin, E.L.; Rechid, D. What determines the sign of the evapotranspiration response to afforestation in European summer? Biogeosciences 2021, 18, 1499–1510. [Google Scholar] [CrossRef]
- Jach, L.; Warrach-Sagi, K.; Ingwersen, J.; Kaas, E.; Wulfmeyer, V. Land Cover Impacts on Land-Atmosphere Coupling Strength in Climate Simulations With WRF Over Europe. J. Geophys. Res. Atmos. 2020, 125, e2019JD031989. [Google Scholar] [CrossRef]
- Jach, L.; Schwitalla, T.; Branch, O.; Warrach-Sagi, K.; Wũlfmeyer, V. Sensitivity of land–atmosphere coupling strength to changing atmosphe ric temperature and moisture over Europe. Earth Syst. Dyn. 2022, 13, 109–132. [Google Scholar] [CrossRef]
- Martynov, A.; Laprise, R.; Sushama, L.; Winger, K.; Šeparović, L.; Dugas, B. Reanalysis-driven climate simulation over CORDEX North America domain using the Canadian Regional Climate Model, version 5: Model performance evaluation. Clim. Dyn. 2013, 41, 2973–3005. [Google Scholar] [CrossRef]
- Šeparović, L.; Alexandru, A.; Laprise, R.; Martynov, A.; Sushama, L.; Winger, K.; Tete, K.; Valin, M. Present climate and climate change over North America as simulated by the fifth-generation Canadian regional climate model. Clim. Dyn. 2013, 41, 3167–3201. [Google Scholar] [CrossRef]
- Skamarock, W.C.; Klemp, J.B.; Dudhia, J.; Gill, D.O.; Barker, D.M.; Wang, W.; Powers, J.G. A Description of the Advanced Research WRF, version 2; Technical Report; National Center For Atmospheric Research Boulder Co Mesoscale and Microscale Meteorology DIV: Boulder, CO, USA, 2005. [Google Scholar]
- Verseghy, D.L. CLASS—A Canadian land surface scheme for GCMs. I. Soil model. Int. J. Climatol. 1991, 11, 111–133. [Google Scholar] [CrossRef]
- Verseghy, D.; McFarlane, N.; Lazare, M. CLASS—A Canadian land surface scheme for GCMs, II. Vegetation model and coupled runs. Int. J. Climatol. 1993, 13, 347–370. [Google Scholar] [CrossRef]
- Côté, J.; Gravel, S.; Méthot, A.; Patoine, A.; Roch, M.; Staniforth, A. The operational CMC–MRB global environmental multiscale (GEM) model. Part I: Design considerations and formulation. Mon. Weather. Rev. 1998, 126, 1373–1395. [Google Scholar] [CrossRef]
- Girard, C.; Plante, A.; Desgagné, M.; McTaggart-Cowan, R.; Côté, J.; Charron, M.; Gravel, S.; Lee, V.; Patoine, A.; Qaddouri, A.; et al. Staggered vertical discretization of the Canadian Environmental Multiscale (GEM) model using a coordinate of the log-hydrostatic-pressure type. Mon. Weather. Rev. 2014, 142, 1183–1196. [Google Scholar] [CrossRef]
- McTaggart-Cowan, R.; Vaillancourt, P.; Zadra, A.; Chamberland, S.; Charron, M.; Corvec, S.; Milbrandt, J.; Paquin-Ricard, D.; Patoine, A.; Roch, M.; et al. Modernization of atmospheric physics parameterization in Canadian NWP. J. Adv. Model. Earth Syst. 2019, 11, 3593–3635. [Google Scholar] [CrossRef]
- Dee, D.P.; Uppala, S.M.; Simmons, A.J.; Berrisford, P.; Poli, P.; Kobayashi, S.; Andrae, U.; Balmaseda, M.; Balsamo, G.; Bauer, D.P.; et al. The ERA-Interim reanalysis: Configuration and performance of the data assimilation system. Q. J. R. Meteorol. Soc. 2011, 137, 553–597. [Google Scholar] [CrossRef]
- Janjić, Z.I. The step-mountain eta coordinate model: Further developments of the convection, viscous sublayer, and turbulence closure schemes. Mon. Weather. Rev. 1994, 122, 927–945. [Google Scholar] [CrossRef]
- Beljaars, A.; Holtslag, A. Flux parameterization over land surfaces for atmospheric models. J. Appl. Meteorol. Climatol. 1991, 30, 327–341. [Google Scholar] [CrossRef]
- Sundqvist, H.; Berge, E.; Kristjánsson, J.E. Condensation and cloud parameterization studies with a mesoscale numerical weather prediction model. Mon. Weather. Rev. 1989, 117, 1641–1657. [Google Scholar] [CrossRef]
- Delage, Y. Parameterising sub-grid scale vertical transport in atmospheric models under statically stable conditions. Bound.-Layer Meteorol. 1997, 82, 23–48. [Google Scholar] [CrossRef]
- Blackadar, A.K. The vertical distribution of wind and turbulent exchange in a neutral atmosphere. J. Geophys. Res. 1962, 67, 3095–3102. [Google Scholar] [CrossRef]
- Mlawer, E.J.; Taubman, S.J.; Brown, P.D.; Iacono, M.J.; Clough, S.A. Radiative transfer for inhomogeneous atmospheres: RRTM, a validated correlated-k model for the longwave. J. Geophys. Res. Atmos. 1997, 102, 16663–16682. [Google Scholar] [CrossRef]
- Chou, M.D.; Suarez, M.J. An efficient Thermal Infrared Radiation Parameterization for Use in General Circulation Models; National Aeronautics and Space Administration, Goddard Space Flight Center: Washington, DC, USA, 1994. [Google Scholar]
- Li, J.; Barker, H. A radiation algorithm with correlated-k distribution. Part I: Local thermal equilibrium. J. Atmos. Sci. 2005, 62, 286–309. [Google Scholar] [CrossRef]
- Kain, J.S.; Fritsch, J.M. A one-dimensional entraining/detraining plume model and its application in convective parameterization. J. Atmos. Sci. 1990, 47, 2784–2802. [Google Scholar] [CrossRef]
- Kain, J.S. The Kain–Fritsch convective parameterization: An update. J. Appl. Meteorol. 2004, 43, 170–181. [Google Scholar] [CrossRef]
- Bechtold, P.; Bazile, E.; Guichard, F.; Mascart, P.; Richard, E. A mass-flux convection scheme for regional and global models. Q. J. R. Meteorol. Soc. 2001, 127, 869–886. [Google Scholar] [CrossRef]
- Hong, S.Y.; Dudhia, J.; Chen, S.H. A revised approach to ice microphysical processes for the bulk parameterization of clouds and precipitation. Mon. Weather. Rev. 2004, 132, 103–120. [Google Scholar] [CrossRef]
- Kuo, H.L. On formation and intensification of tropical cyclones through latent heat release by cumulus convection. J. Atmos. Sci. 1965, 22, 40–63. [Google Scholar] [CrossRef]
- Bourgouin, P. A method to determine precipitation types. Weather. Forecast. 2000, 15, 583–592. [Google Scholar] [CrossRef]
- Lawrence, P.J.; Chase, T.N. Representing a new MODIS consistent land surface in the Community Land Model (CLM 3.0). J. Geophys. Res. Biogeosci. 2007, 112. [Google Scholar] [CrossRef]
- Li, Y.; Zhao, M.; Motesharrei, S.; Mu, Q.; Kalnay, E.; Li, S. Local cooling and warming effects of forests based on satellite observations. Nat. Commun. 2015, 6, 6603. [Google Scholar] [CrossRef]
- Betts, R.A. Offset of the potential carbon sink from boreal forestation by decreases in surface albedo. Nature 2000, 408, 187–190. [Google Scholar] [CrossRef]
- Chen, L.; Dirmeyer, P.A.; Guo, Z.; Schultz, N.M. Pairing FLUXNET sites to validate model representations of land-use/land-cover change. Hydrol. Earth Syst. Sci. 2018, 22, 111–125. [Google Scholar] [CrossRef]
- Meier, R.; Davin, E.L.; Lejeune, Q.; Hauser, M.; Li, Y.; Martens, B.; Schultz, N.M.; Sterling, S.; Thiery, W. Evaluating and improving the Community Land Model’s sensitivity to land cover. Biogeosciences 2018, 15, 4731–4757. [Google Scholar] [CrossRef] [Green Version]
- Teuling, A.J. A forest evapotranspiration paradox investigated using lysimeter data. Vadose Zone J. 2018, 17, 1–7. [Google Scholar] [CrossRef]
- Diro, G.; Sushama, L. Contribution of snow cover decline to projected warming over North America. Geophys. Res. Lett. 2020, 47, e2019GL084414. [Google Scholar] [CrossRef]
- Duveiller, G.; Forzieri, G.; Robertson, E.; Li, W.; Georgievski, G.; Lawrence, P.; Wiltshire, A.; Ciais, P.; Pongratz, J.; Sitch, S.; et al. Biophysics and vegetation cover change: A process-based evaluation framework for confronting land surface models with satellite observations. Earth Syst. Sci. Data 2018, 10, 1265–1279. [Google Scholar] [CrossRef] [Green Version]


| Model Name | WRF | CRCM5 | CRCM6 |
|---|---|---|---|
| Institution | NCAR | Ouranos | UQAM |
| Land Surface Scheme | Unified NOAH | CLASS v3.5c | CLASS v3.6 |
| Land cover classes (principal classes used in FOREST or GRASS are in bold, classes used but with a minor impact are italiziced) | 1: Urban and Built-up Land | 1: Evergreen Needleleaf Trees | 1: Evergreen Needleleaf Trees |
| 2: Dryland Cropland and Pasture | 2: Evergreen Broadleaf Trees | 2: Evergreen Broadleaf Trees | |
| 3: Irrigated Cropland and Pasture | 3: Deciduous Needleleaf Trees | 3: Deciduous Needleleaf Trees | |
| 4: Mixed Dryland/Irrigated Cropland and Pasture | 4: Deciduous Broadleaf Trees | 4: Deciduous Broadleaf Trees | |
| 5. Cropland/Grassland Mosaic | 5: Tropical Broadleaf Trees | 5: Tropical Broadleaf Trees | |
| 6. Cropland/Woodland Mosaic | 6: Drought Deciduous Trees | 6: Drought Deciduous Trees | |
| 7. Grassland | 7: Evergreen Broadleaf Shrub | 7: Evergreen Broadleaf Shrub | |
| 8. Shrubland | 8: Deciduous Shrubs | 8: Deciduous Shrubs | |
| 9. Mixed Shrubland/Grassland | 9: Thorn Shrubs | 9: Thorn Shrubs | |
| 10. Savanna | 10: Short Grass & Forbs | 10: Short Grass & Forbs | |
| 11. Deciduous Broadleaf Forest | 11: Long Grass | 11: Long Grass | |
| 12. Deciduous Needleleaf Forest | 12: Crops | 12: Crops | |
| 13. Evergreen Broadleaf | 13: Rice | 13: Rice | |
| 14. Evergreen Needleleaf | 14: Sugar | 14: Sugar | |
| 15. Mixed Forest | 15: Maize | 15: Maize | |
| 16. Water Bodies | 16: Cotton | 16: Cotton | |
| 17. Herbacious Wetland | 17: Irrigated Crops | 17: Irrigated Crops | |
| 18. Wooden Wetland | 18: Urban | 18: Urban | |
| 19. Barren or Sparlsely Vegetated | 19: Tundra | 19: Tundra | |
| 20. Herbaceous Tundra | 20: Swamp | 20: Swamp | |
| 21. Wooded Tundra | 21: Desert | 21: Desert | |
| 22. Mixed Tundra | 22: Mixed Wood Forests | 22: Mixed Wood Forests | |
| 23. Bare Ground Tundra | 23: Mixed Shrubs | 23: Mixed Shrubs | |
| 24. Snow or Ice | |||
| Conversion method to implement the vegetation maps (FOREST and GRASS) | bare soil = 19 | bare soil = 21 | bare soil = 21 |
| Needleleaf Evergreen Temperate = 14 | Needleleaf Evergreen Temperate = 1 | Needleleaf Evergreen Temperate = 1 | |
| Needleleaf Evergreen Boreal = 14 | Needleleaf Evergreen Boreal = 1 | Needleleaf Evergreen Boreal = 1 | |
| Needleleaf Deciduous Boreal = 12 | Needleleaf Deciduous Boreal = 3 | Needleleaf Deciduous Boreal = 3 | |
| Broadleaf Evergreen Tropical = 13 | Broadleaf Evergreen Tropical = 2 | Broadleaf Evergreen Tropical = 2 | |
| Broadleaf Evergreen Temperate = 13 | Broadleaf Evergreen Temperate = 2 | Broadleaf Evergreen Temperate = 2 | |
| Broadleaf Deciduous Tropical = 11 | Broadleaf Deciduous Tropical = 4 | Broadleaf Deciduous Tropical = 4 | |
| Broadleaf Deciduous Temperate = 11 | Broadleaf Deciduous Temperate = 4 | Broadleaf Deciduous Temperate = 4 | |
| Broadleaf Deciduous Boreal = 11 | Broadleaf Deciduous Boreal = 4 | Broadleaf Deciduous Boreal = 4 | |
| C3 Arctic Grass = 7 | C3 Arctic Grass = 10 | C3 Arctic Grass = 10 | |
| C3 Grass = 7 | C3 Grass = 10 | C3 Grass = 10 | |
| C4 Grass = 7 | C4 Grass = 10 | C4 Grass = 10 | |
| Representation of sub-grid scale vegetation heterogeneity | The dominant class sets the surface properties, other class properties ignored | The surface properties are averaged over the different classes present on a given tile | The surface properties are averaged over the different classes present on a given tile |
| Leaf area index | Estimated using seasonally varying green vegetation coverage fraction (FVEG) and the minimum and maximum values for LAI (LAIMIN and LAIMAX, respectively) prescribed for each vegetation type. LAI = ((1.0 − FVEG) * LAIMIN) + (FVEG * LAIMAX) | Seasonal cycle with the onset of spring budburst and fall senescence triggered by near-zero values of the air temperature and the first soil layer temperature. | Seasonal cycle with the onset of spring budburst and fall senescence triggered by near-zero values of the air temperature and the first soil layer temperature. |
| Total soil depth and number of hydrologically/thermally active soil layers | 4 thermally and hydrologically active soil layers with a maximum depth of 2 m | 17 thermally and hydrologically active soil layers with maximum depth of 5 m. | 17 thermally and hydrologically active soil layers with maximum depth of 5 m. |
| Initialization and spin-up | Initialization with ERA-Interim | Initialization with ERA-Interim | Initialization with ERA-Interim |
| Lateral boundary formulation | linear relaxation | 10 semi-lag departure points | 10 semi-lag departure points |
| Buffer (no. of grid cells) | 5 | 20 grid cells lateral sponge zone | grid cells lateral sponge zone: 10 in longitude, 15 in latitude |
| No. of vertical levels | 28 | 56 | 71 |
| Turbulence and planetary boundary layer scheme | [36] | 1.5-order closure based on prognostic turbulence kinetic energy [37]. Mixing length based on [38]. Stability functions from [39] | 1.5-order closure based on prognostic turbulence kinetic energy [37]. Mixing length based on [38], except in laminar conditions where [40] is used. Stability functions from [37]. |
| Radiation scheme | Longwave: RRTM [41]; Shortwave: Goddard [42] | [43] | [43], with a few updates described in [34] |
| Deep Convection scheme | Kain-Fritsch w/ETA trigger [44] | [45] | [44], with a few updates described in [34] |
| Shallow Convection scheme | n/a | [45] transient | [46] |
| Microphysics scheme | WSM3 [47] | [48,49] | [38,49] |
| Greenhouse gases | Historical | Historical + RCP4.5 | Historical + RCP8.5 |
| Aerosols | Prescribed Observed, Uniform | Prescribed Observed | Hardcoded: higher values ove land than ove ocean; higher values at the equator than at the poles |
| CRCM-CLASS | Needleleaf | Broadleaf | Grasses |
|---|---|---|---|
| Min. Stomatal Resistance (s/m) | 250 | 130 | 150 |
| Albedo (visible/near-IR) | 0.03/0.19 | 0.05/0.29 | 0.05/0.31 |
| LAI (min–max) | 1.6–2 | 0.5–6 | 4 |
| Root Depth (m) | 1 | 2 | 1.2 |
| Roughness Length (m) | 1.5 | 2 | 0.08 |
| WRF-NOAH | Needleleaf | Broadleaf | Grasses |
| Min. Stomatal Resistance (s/m) | 125 | 100 | 40 |
| Albedo (min–max) | 0.12 | 0.16–0.17 | 0.19–0.23 |
| LAI (min–max) | 5–6.4 | 1.85–3.31 | 0.52–2.90 |
| Root Depth (n layers) | 4 | 4 | 3 |
| Roughness Length (m) | 0.5 | 0.5 | 0.1 |
Publisher’s Note: MDPI stays neutral with regard to jurisdictional claims in published maps and institutional affiliations. |
© 2022 by the authors. Licensee MDPI, Basel, Switzerland. This article is an open access article distributed under the terms and conditions of the Creative Commons Attribution (CC BY) license (https://creativecommons.org/licenses/by/4.0/).
Share and Cite
Asselin, O.; Leduc, M.; Paquin, D.; Di Luca, A.; Winger, K.; Bukovsky, M.; Music, B.; Giguère, M. On the Intercontinental Transferability of Regional Climate Model Response to Severe Forestation. Climate 2022, 10, 138. https://doi.org/10.3390/cli10100138
Asselin O, Leduc M, Paquin D, Di Luca A, Winger K, Bukovsky M, Music B, Giguère M. On the Intercontinental Transferability of Regional Climate Model Response to Severe Forestation. Climate. 2022; 10(10):138. https://doi.org/10.3390/cli10100138
Chicago/Turabian StyleAsselin, Olivier, Martin Leduc, Dominique Paquin, Alejandro Di Luca, Katja Winger, Melissa Bukovsky, Biljana Music, and Michel Giguère. 2022. "On the Intercontinental Transferability of Regional Climate Model Response to Severe Forestation" Climate 10, no. 10: 138. https://doi.org/10.3390/cli10100138
APA StyleAsselin, O., Leduc, M., Paquin, D., Di Luca, A., Winger, K., Bukovsky, M., Music, B., & Giguère, M. (2022). On the Intercontinental Transferability of Regional Climate Model Response to Severe Forestation. Climate, 10(10), 138. https://doi.org/10.3390/cli10100138