Article

Intensity, Duration and Spatial Coverage of Aridity during Meteorological Drought Years over Northeast Thailand

by
Tenanile Dlamini
1,2,
Veeranun Songsom
1,*,
Werapong Koedsin
1 and
Raymond J. Ritchie
1
1
Faculty of Technology and Environment, Prince of Songkla University, Phuket Campus, Phuket 83120, Thailand
2
Eswatini Meteorological Services, Mbabane M200, Eswatini
*
Author to whom correspondence should be addressed.
Climate 2022, 10(10), 137; https://doi.org/10.3390/cli10100137
Submission received: 5 August 2022 / Revised: 19 September 2022 / Accepted: 19 September 2022 / Published: 23 September 2022
(This article belongs to the Special Issue Natural Disasters and Extreme Hazards under Changing Climate)

Abstract

:
Gaps in drought monitoring result in insufficient preparation measures for vulnerable areas. This paper employed the standardized precipitation index (SPI) to identify meteorological drought years and the Thornthwaite aridity index (TAI) to evaluate aridity in three provinces of northeast Thailand growing cassava and sugarcane at massive scales. Precipitation and temperature data were sourced from Global Land Data Assimilation System-2 (GLDAS-2) Noah Model products at 0.25 degree resolution and used for calculating the drought indices. This study was conducted for the period of 2004 to 2015. The SPI was computed for 1, 3 and 6 months scales to measure short- to medium-term moisture. The results indicated major meteorological drought years as 2004, 2005, 2010, 2012, 2014 and 2015. A range of 1 to 3 months of extreme rainfall shortage was experienced during each of these years, including the growing season of 2004, 2012 and 2015. TAI-based results indicated that the area experiences an average of 7 to 8 months of aridity during drought periods, compared to the historical overall average of 6 months. The spatial TAI for the major drought years indicated delayed onset, intermittency or early cut-off of the rainy season. The year 2004 was the most intense in terms of aridity. The longest duration of aridness for some areas was between 9 and 10 months in 2012 and 2014, respectively. In terms of spatial coverage, all meteorological drought years had out-of-season aridity. Based on the region’s historical records, this highlighted an increase in the frequency of droughts and duration of aridity. A disturbance in the growing season has the potential to affect crop yields, hence, the need to improve and strengthen existing adaptive measures for agriculture as the main source of food and income in the northeast.

Graphical Abstract

1. Introduction

Drought is an environmental disaster which is globally identified as the second most geographically extensive hazard after floods [1]. Monitoring of drought helps in identifying emerging drought and its dynamics [2]. Frequent re-evaluation of drought is important for the purposes of preparing for risks [3]. Apart from an increase in the frequency of occurrence of droughts, global warming has the potential to lead to changes in regional aridity as moisture conditions are affected [4]. Aridity is considered to be permanent and is linked to the following climatic elements: strong insolation, high temperatures, low air humidity and strong evapotranspiration [5]. Drought, on the other hand, is temporary and is linked to natural water deficit. The common denominator between aridity and drought is desertification; however, the common cause of desertification is drought and repeated crop failures (dust bowls). Aridity indices can delineate areas that are prone to desertification or drylands, characterized by low rainfall and high temperatures [5].
As climate change persists, changes in aridity patterns could differ among regions [4], resulting in impacts on arid land resources [5]. This includes a decrease in the quantity and quality of available water, land degradation and crop and genetic changes, all of which threaten food security [5]. Research shows that even though global agricultural productivities have increased, the growth has slowed down over the past 50 years with negative impacts in mid- and low-latitude regions [6]. As the world population increases, the demand for agricultural water also increases. Projections in water cycle changes indicate an increase in some semi-arid regions. However, the increasing groundwater demand worldwide could result in the depletion of non-renewable water storage [6]. As water is the main limiting factor in arid regions, this implies that there is a heavy reliance on rainfall [7]. In northeast Thailand, the lowlands depend on irrigation water from large water reservoirs. Paddy fields depend on rainfall and excess runoff from nearby fields, public canals and streams. Upland crops mainly rely on rainwater or what is termed as ‘green water’ [8]. A large portion of agricultural areas in the mountains is used for growing field crops, with maize occupying the largest share, followed by cassava and sugarcane, respectively [9]. Water resource stress is caused by the agricultural sector as the highest water consumer and industries supporting agriculture such as sugarcane which are becoming more prevalent [10]. As such, interventions are necessary to ensure sustainable agricultural productions.
This study evaluated meteorological drought and aridity in cassava and sugarcane growing areas. Sugarcane and cassava are globally regarded as potential energy crops for bio-ethanol production in an endeavor to curb the energy crisis and reduce greenhouse gas emissions [11]. Global industry trends for 2021 indicated that a majority of the populations in Africa, Asia and Latin America depend on cassava as a source of food and as an occupation to farmers and traders [12]. Nigeria is the largest producer, followed by Thailand, Indonesia, Brazil and Congo. Brazil is the largest producer of sugarcane, followed by India, Thailand, China and Pakistan [13]. The crops are highly favored for the multiple uses of their final products which can be classified as food, feed and industrial, making them high-value products. The cassava market is projected to grow even further in the period of 2021 to 2026 [13]. Although cassava is classified as a drought-tolerant crop, insufficient rainfall has the potential to significantly reduce its productivity [14]. Results on drought tolerance of cassava genotypes in Kenya showed that on average, drought stress reduced yields by 59%, the number of edible storage roots by 49% and leaf retention by 50%. Moisture stress during the first three to four months after planting can result in the death of the irrigated cassava system [15]. In Uganda, early period drought resulted in the loss of 82.47% of cassava plants. This was also caused by low-nutrient soils and traditional farming methods [15]. Sugarcane is also significantly affected by water shortage during vegetative growth. A reduction of up to 60% in accumulation of sugarcane stock biomass can occur as a result of extreme water deficit [16]. The long growth cycle of sugarcane (10 to 14 months) and cassava (9 to 12 months) [17] makes the crops susceptible to variations in seasonal weather patterns in the northeast, which are characterized by hot and dry summers as well as irregular rainfall with high variance [9]. Therefore, climate change related studies in cassava and sugarcane growing regions are necessary so as to be able to project productivity and breed for enhanced tolerance.
The forecasting of drought and drought-related hazards is an essential component in providing early warning systems [18]. However, drought prediction is still in its infant stage and more research is necessary to overcome the challenges inhibiting its advancement. There are still a lack of measures to sufficiently assess drought in terms of onset, severity, development and recovery [18]. Thorough measurement and monitoring of meteorological drought are crucial elements to the improvement of forecasting other types of droughts. This is based on the fact that hydrological drought and agricultural drought are non-linear developments from meteorological drought, known as drought propagation [19]. Spatiotemporal analysis of aridity is useful in the clarification of landscape and ecology characteristics [20]. Aridity that occurs as result of climatic conditions can be exacerbated by poor soil properties and land use by humans [7]. Climate indices are used as indicators for climate vulnerability and risk [21]. However, their pros and cons differ based on approach and complexity. As much as simpler indices may fail to represent interactions, complex indices are prone to errors. Therefore, this results in the bargaining of reliability and relevance [21]. As rainfall and temperature are the most important climatic factors, this study utilized the less complex precipitation index (SPI) and the water balance index (TAI) which integrated both rainfall and temperature. There are fewer studies conducted in the northeast in comparison to other regions, yet it is the agricultural hub of the country and resides the most economically disadvantaged populations [9], hence, the necessity to conduct agriculture and environmental-related studies in the area.

2. Study Area

2.1. Cassava and Sugarcane Farming
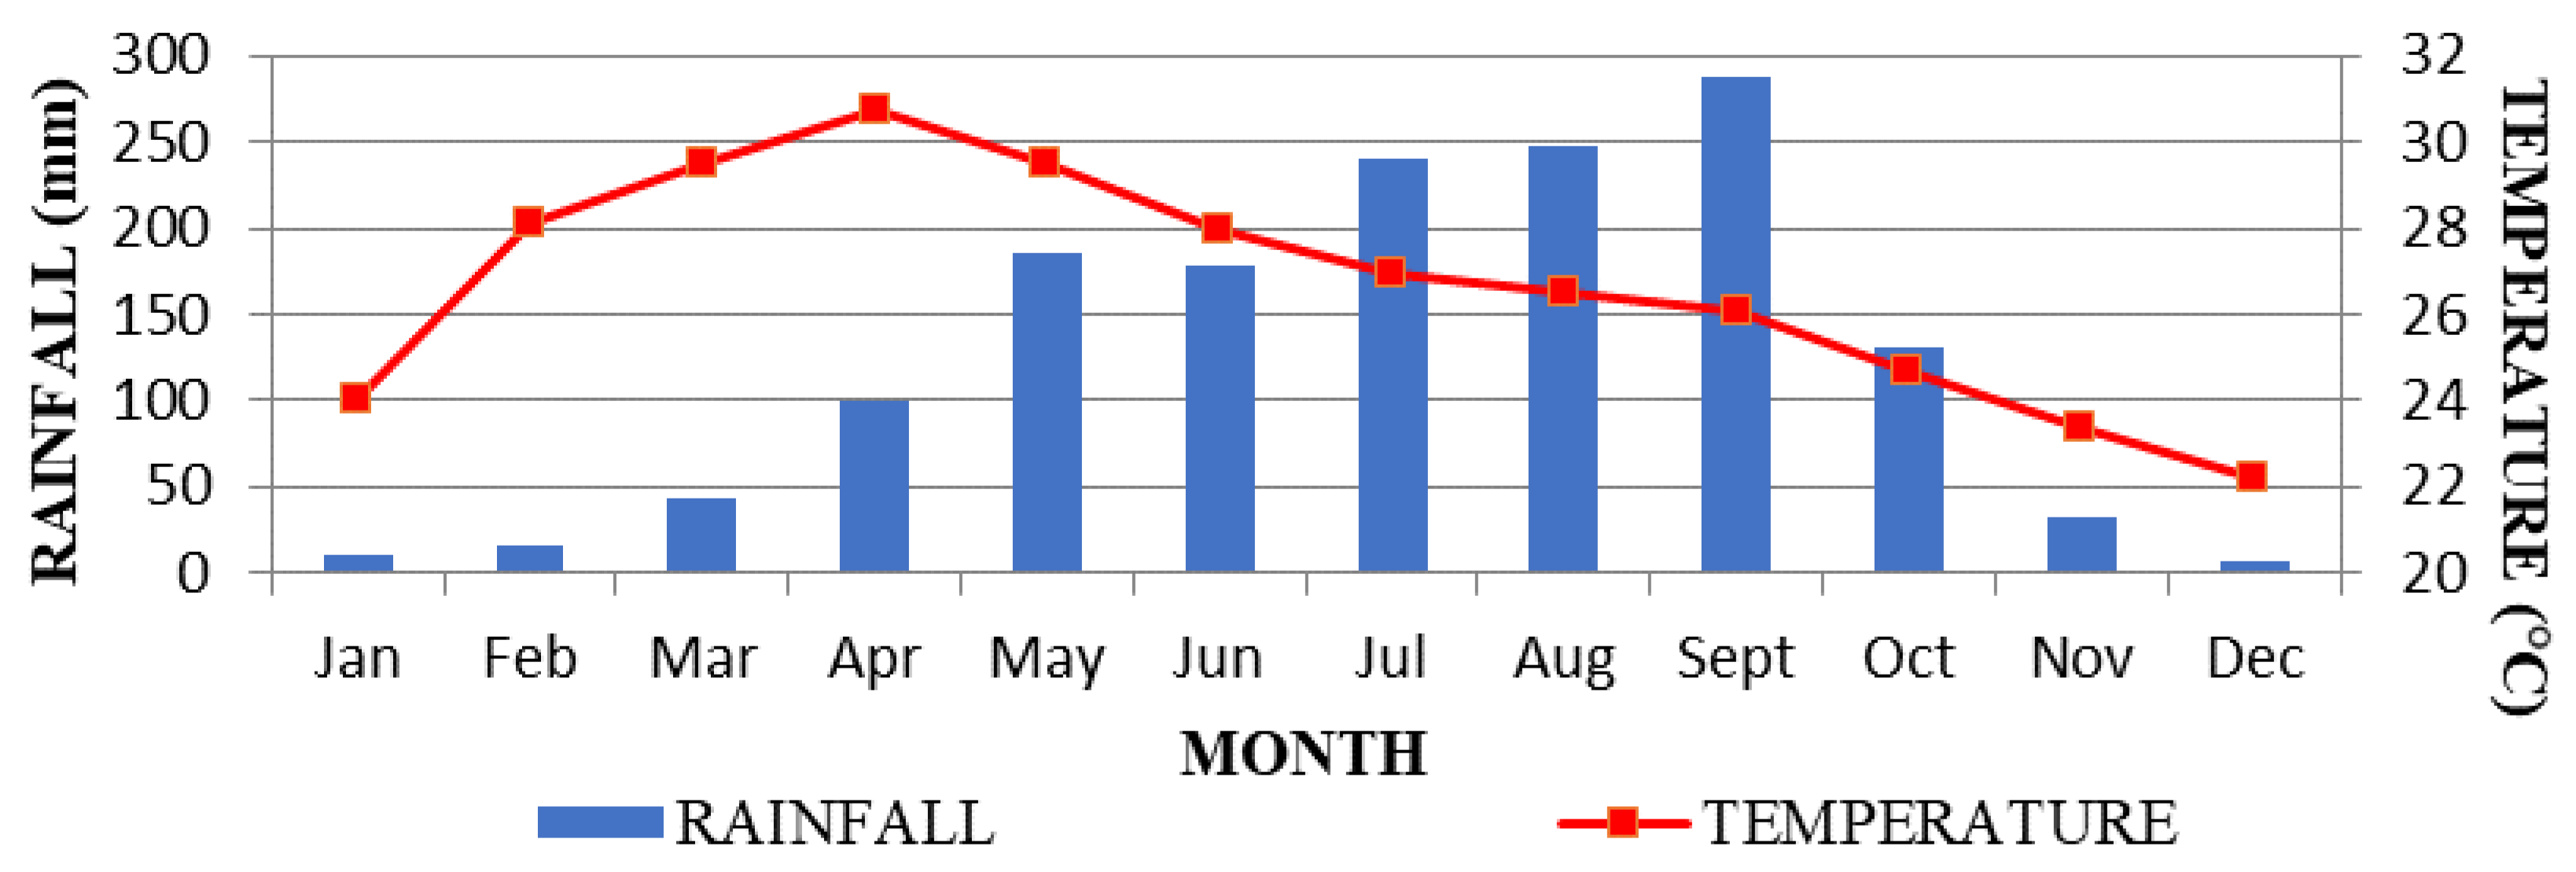
The northeast of Thailand is the major contributor of agricultural products, particularly cereals, compared to other regions in the country. Khon Kaen, Chaiyaphum and Nakhon Ratchasima are also amongst the leading producers of cassava and sugarcane in terms of scale when compared to other provinces [17,22,23,24]. Figure 1 shows the distribution of cassava (Manihot esculenta, C3 photosynthesis) and sugarcane (Saccharum officinarum, C4 photosynthesis) cropping in 2017 for the three provinces. Monoculture is the main cropping system practiced for these two crops extending over large field units [9], and farming in the area is mainly dependent on rainfall rather than irrigation [25]. Cassava is an industrial tropical root crop which ranks at the sixth position in terms of GDP contribution when compared to other crops in Thailand [22]. It is a cash crop mainly produced by small farmers. An equivalent of 60% of the total area that is used to grow cassava in Thailand is located in the northeast [26]. Sugarcane also ranks high in GDP contribution amongst other crops as it is in the top five, with the northeast region being the highest producer in the country [17]. It is grown in 16 of the provinces in the region, including Khon Kaen, Chaiyaphum and Nakhon Ratchasima. Its popularity is based upon a secure market, as there are widespread sugar mills in the region, and has the potential to give farmers a stable income. The sugarcane by-products also have a high value [17].

2.2. Climate

The climate of the northeast is classified by two major seasons consisting of the southwest monsoon and northeast monsoon, and two transitional periods [27]. The southwest monsoon is characterized by southwest prevailing winds which bring heavy rainfall between May and early October. On the contrary, the northeasterly winds of the northeast monsoon contribute to dry weather conditions between November and March with occasional light showers. When analyzing the rainfall distribution of northeast Thailand, results from study [27] found that monthly rainfall for the region has a high variability from year to year and on a day-to-day basis as well; a dry day is more likely to be followed by another dry day than a wet day, throughout the whole year. Thus, benefits of fortuitous occasional rainfall is frequently lost by later evaporation. December and January are the driest months of the year, whilst August and September are the wettest. Mean annual temperatures in the northeast range between 18.7 °C and 35.2 °C, with April being the hottest month [28] (Figure 2).
Based on data from 1980 to 2009, the percentage of people affected by droughts in Thailand was 69%, whilst those affected by floods was 31% [29]. Illustrations of climate change impacts for the country showed an increase in the average annual temperature of 0.95 °C between 1955 and 2009 when compared to the world average increase of 0.69 °C. From November 2009 to August 2010, Thailand experienced a devastating drought with temperatures exceeding 40 °C, bringing agriculture to a standstill [30]. In 2011, the country was exposed to the worst and most extensive flooding events within the 60 years period [31] including provinces in the northeastern region. These extreme events exposed gaps in the preparedness measures of the country when it comes to unusual and dramatic changes in weather and overall climate [30]. Between 2015 and 2016, the country experienced what was termed as one of the worst droughts in decades [32], which caused critical low water levels in reservoirs throughout the country, with the central and northeastern areas being the most affected [33]. Climate projections for the northeast for 2021 to 2050 indicate a more than double increase in the annual number of hot days, a 2–8% increase in precipitation during the rainy season and a 6–11% decrease during the pre-rainy season [34]. Rainfall is also expected to become more erratic [34].

3. Materials and Methods

The aim of this study was to identify and evaluate the severity of meteorological drought years which occurred between 2004 and 2015, using the SPI and the TAI as remote sensing indices. Monthly rainfall and temperature data were obtained from the National Aeronautics and Space Administration (NASA) archives, GLDAS-2 Noah Land Surface Model data products [35]. Selected data from 2004 to 2015 had a spatial resolution of 0.25 degrees. NetCDF files were transformed into GeoTIFF files for the purposes of generating raster data and processing. Rainfall (Rainf_tavg) and temperature (AvgSurfT_inst) were chosen as variables. The raster data for the respective GeoTIFF files for all months from 2004 to 2015 were clipped using the Thailand boundary map as the output extent. Thereafter, rainfall and temperature values were extracted in table format, whereby the clipped files and the created point shapefile were used as input rasters and location, respectively. The tables were produced as *.dbf files. Batch processing was performed for each of the years considering the twelve points, and the resultant tables were transferred to an excel spreadsheet for the purpose of analyzing the data. Land-use land-cover maps acquired from the Land Development Department (Thailand Government) for the period under study were layered using GIS software to identify sugarcane and cassava growing areas and select individual pixels or points.

3.1. Standardized Precipitation Index

The standardized precipitation index (SPI) is a precipitation index which measures relative deviation of precipitation from normality [36]. This makes it a suitable drought indicator as meteorological drought is characterized by rainfall deficit. Compared to other indices, it is less complex as it only applies one parameter [37] and is effective in analyzing both wet and dry periods whilst highlighting variability. In agricultural applications, it has the advantage of being flexible in selecting time periods that correspond to farming seasons or other seasons that may be required [38].
The SPIs were computed using the SPI Generator application, with monthly precipitation values from 2004 to 2015 used as input datasets and temporal scales of 1, 3 and 6 months used as output datasets. This incorporated the SPI formula [27] shown in the Appendix A. The statistical distributions of the different time scales were represented by the gamma distribution, which is a two parameter (shape and scale) continuous probability distribution. The shape parameter β (Equation (A6)) and scale parameter α (Equation (A7)) were fitted into the frequency distribution of the historical non-zero rainfall accumulations using the approximation of the maximum likelihood estimator (Equation (A8)). The cumulative probability (Equation (A9)) was derived for any observed rainfall accumulation, using the gamma distribution parameters and algorithms. Thereafter, adjustment for the probability of zero rainfall accumulation was conducted, followed by the converting of the cumulative probability of observed rainfall to the standard normal random variable Z (Equations (A10) and (A11)), using an approximation, with a mean of zero and a variance of one [36].
Different time scales were suitable for measuring drought for different phenomenon, as shown in Table 1. The main meteorological drought years were identified based on very low SPI values within the time scales, as shown in Table 2.

3.2. Thornthwaite Aridity Index
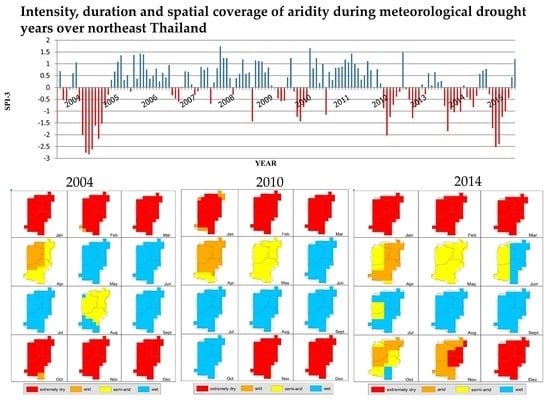
The Thornthwaite aridity index (TAI) is classified as a water balance index [41] as it incorporates water and temperature. The two parameters are considered as the main indicators of climate. Temperature is also the main factor of evaporation, rendering the TAI as applicable for agrometeorological research [42] which was the basis of this study. Precipitation and temperature values were used to calculate the TAI using the following formula [41]:
TAI = 1.65 ( P T + 12.2 ) 10 9
where P was the precipitation sum and T was the temperature in degrees Celsius based on averaged monthly values. Wetter/dryer conditions were distinguished by increasing/decreasing TAI trends, as shown in Table 3. The temporal TAI was displayed for the duration of this study. The spatial TAI was also displayed for the SPI-based meteorological drought years.

4. Results

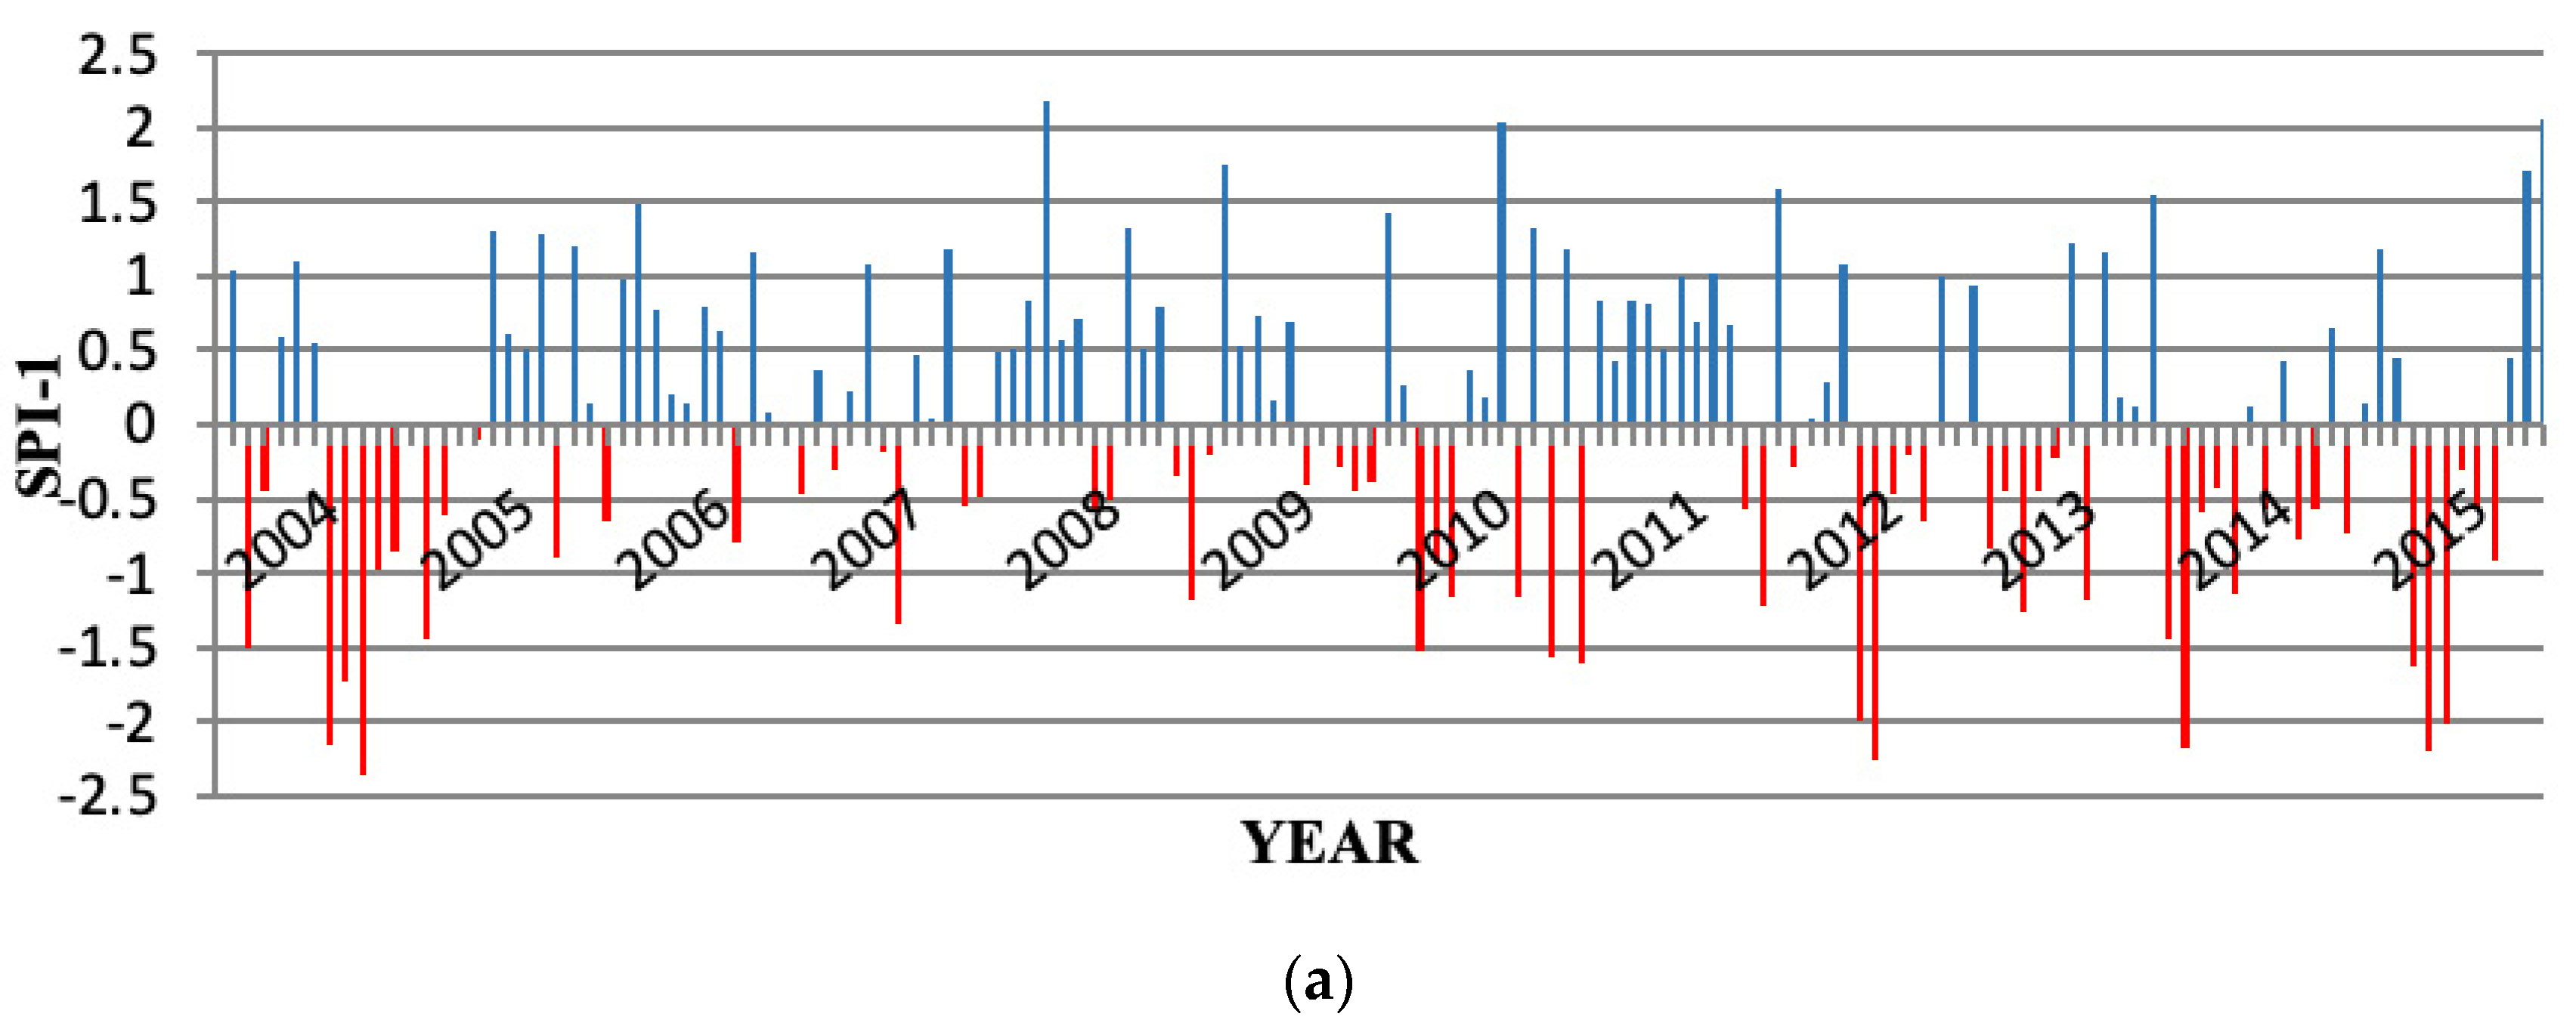
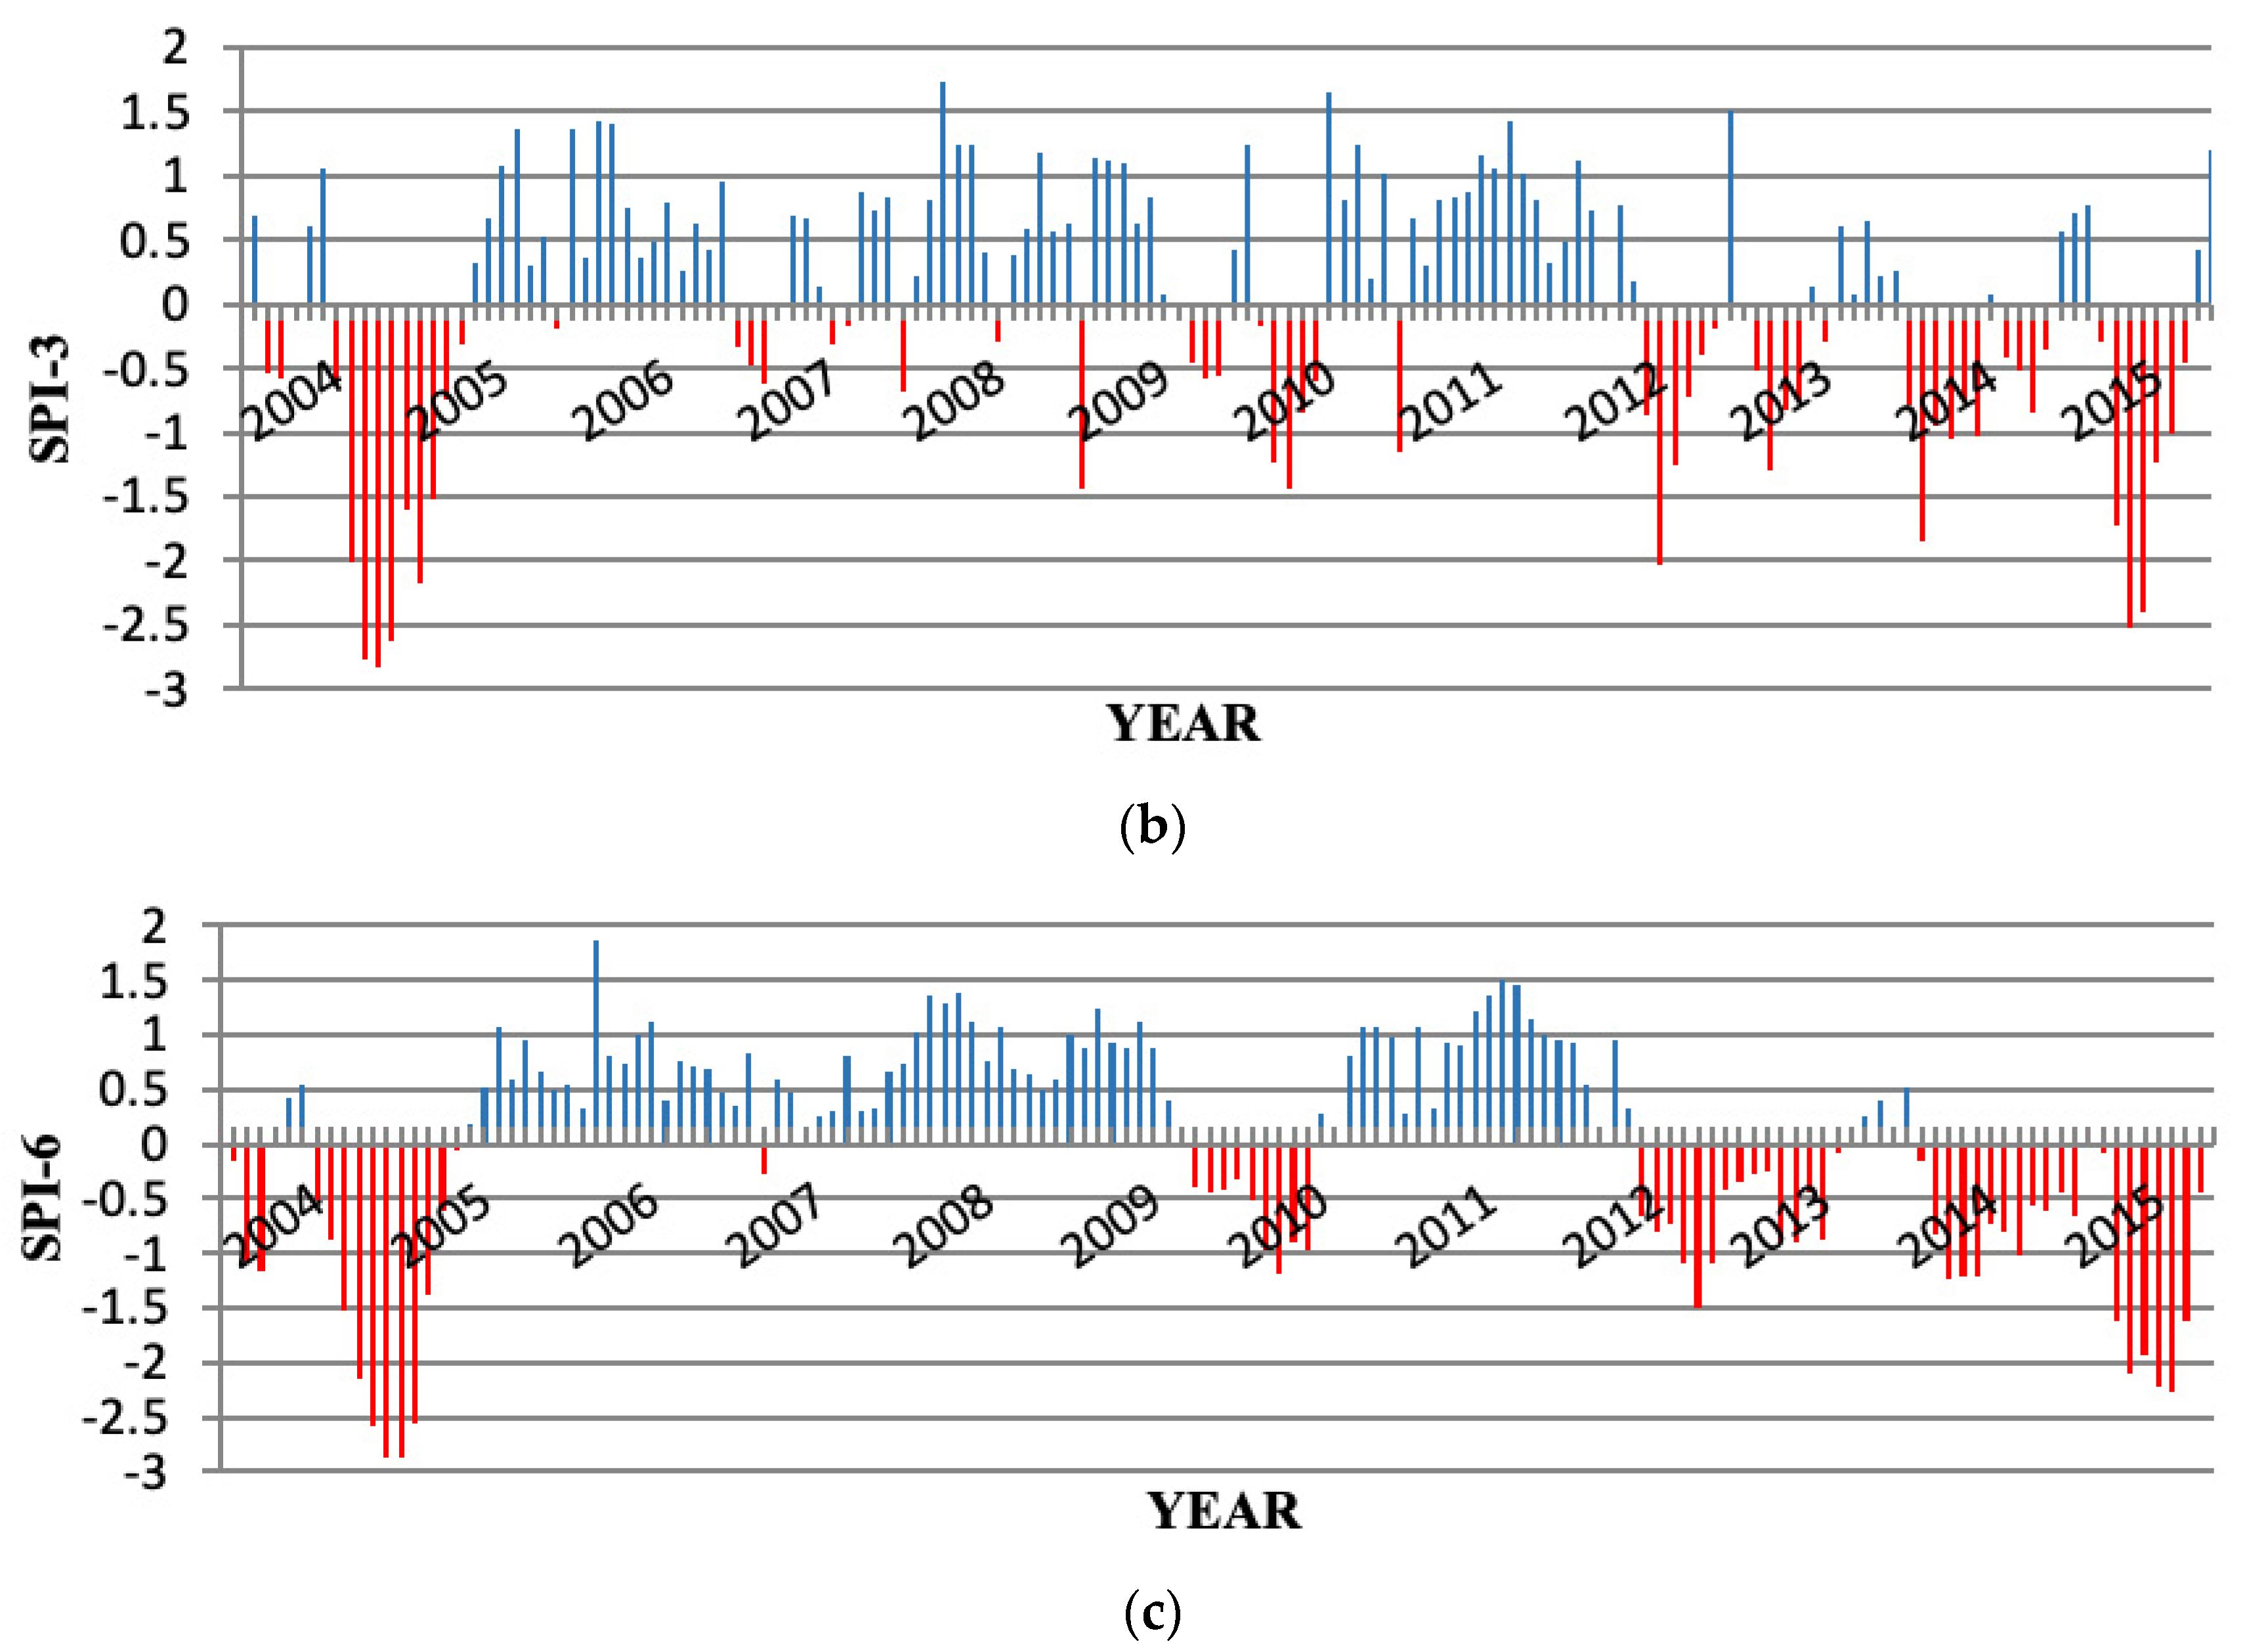
4.1. Temporal Variation in the Standardized Precipitation Index

Phenomena reflected by the SPI with 1 month duration reflected short-term moisture and crop stress; hence, it was very applicable during the growing season [43]. Figure 3a showed evidence of dryness during the period of study. The area had bouts of severe to extreme shortage of rainfall during the period of March and August to September 2004, February 2005, April and November 2010, January 2011, June to July 2012, January to February 2014 and April to June 2015. For 2004, 2012 and 2015 there was extreme dryness during some months of the wet season (May to October) which was also the main growing season in the northeast. Erratic dry spells during growing seasons were particularly damaging to crops. Generally, it was clear that in almost every year, it was normal for the area to undergo some periods of moderate dryness outside the dry season.
The SPI with 3 months duration reflected short- and medium-term moisture which was applicable to seasonal precipitation [43]. Similarly, it was seen from Figure 3b that from September 2004 to March 2005 there were 7 consecutive months of severe to extreme dry episodes which clearly indicated drought and, hence, severe crop stress. This was followed by moderately dry conditions, with episodes of severe dryness in 2010, 2012, 2013 and 2014. The rainy season of 2015 (May to September 2015) had moderate to extremely dry conditions with June and June being the driest.
The SPI with a duration of 6 months reflected medium-term trends in precipitation and was more applicable to showing precipitation for different seasons [43]. With reference to Figure 3c, seasonal precipitation was at its lowest from late 2004 to early 2005 and in 2015, making these the worst droughts within the study period. The years 2010, 2012 and 2014 also indicated droughts due to the general moderate dryness shown in the figure. Even though the year 2013 exhibited periods of short-term dryness, according to the season precipitation scale, it had near-normal conditions. This indicated the weakness of the longer time scales in capturing short periods of dryness, which could adversely affect crops. There was often little or no recovery from such events.

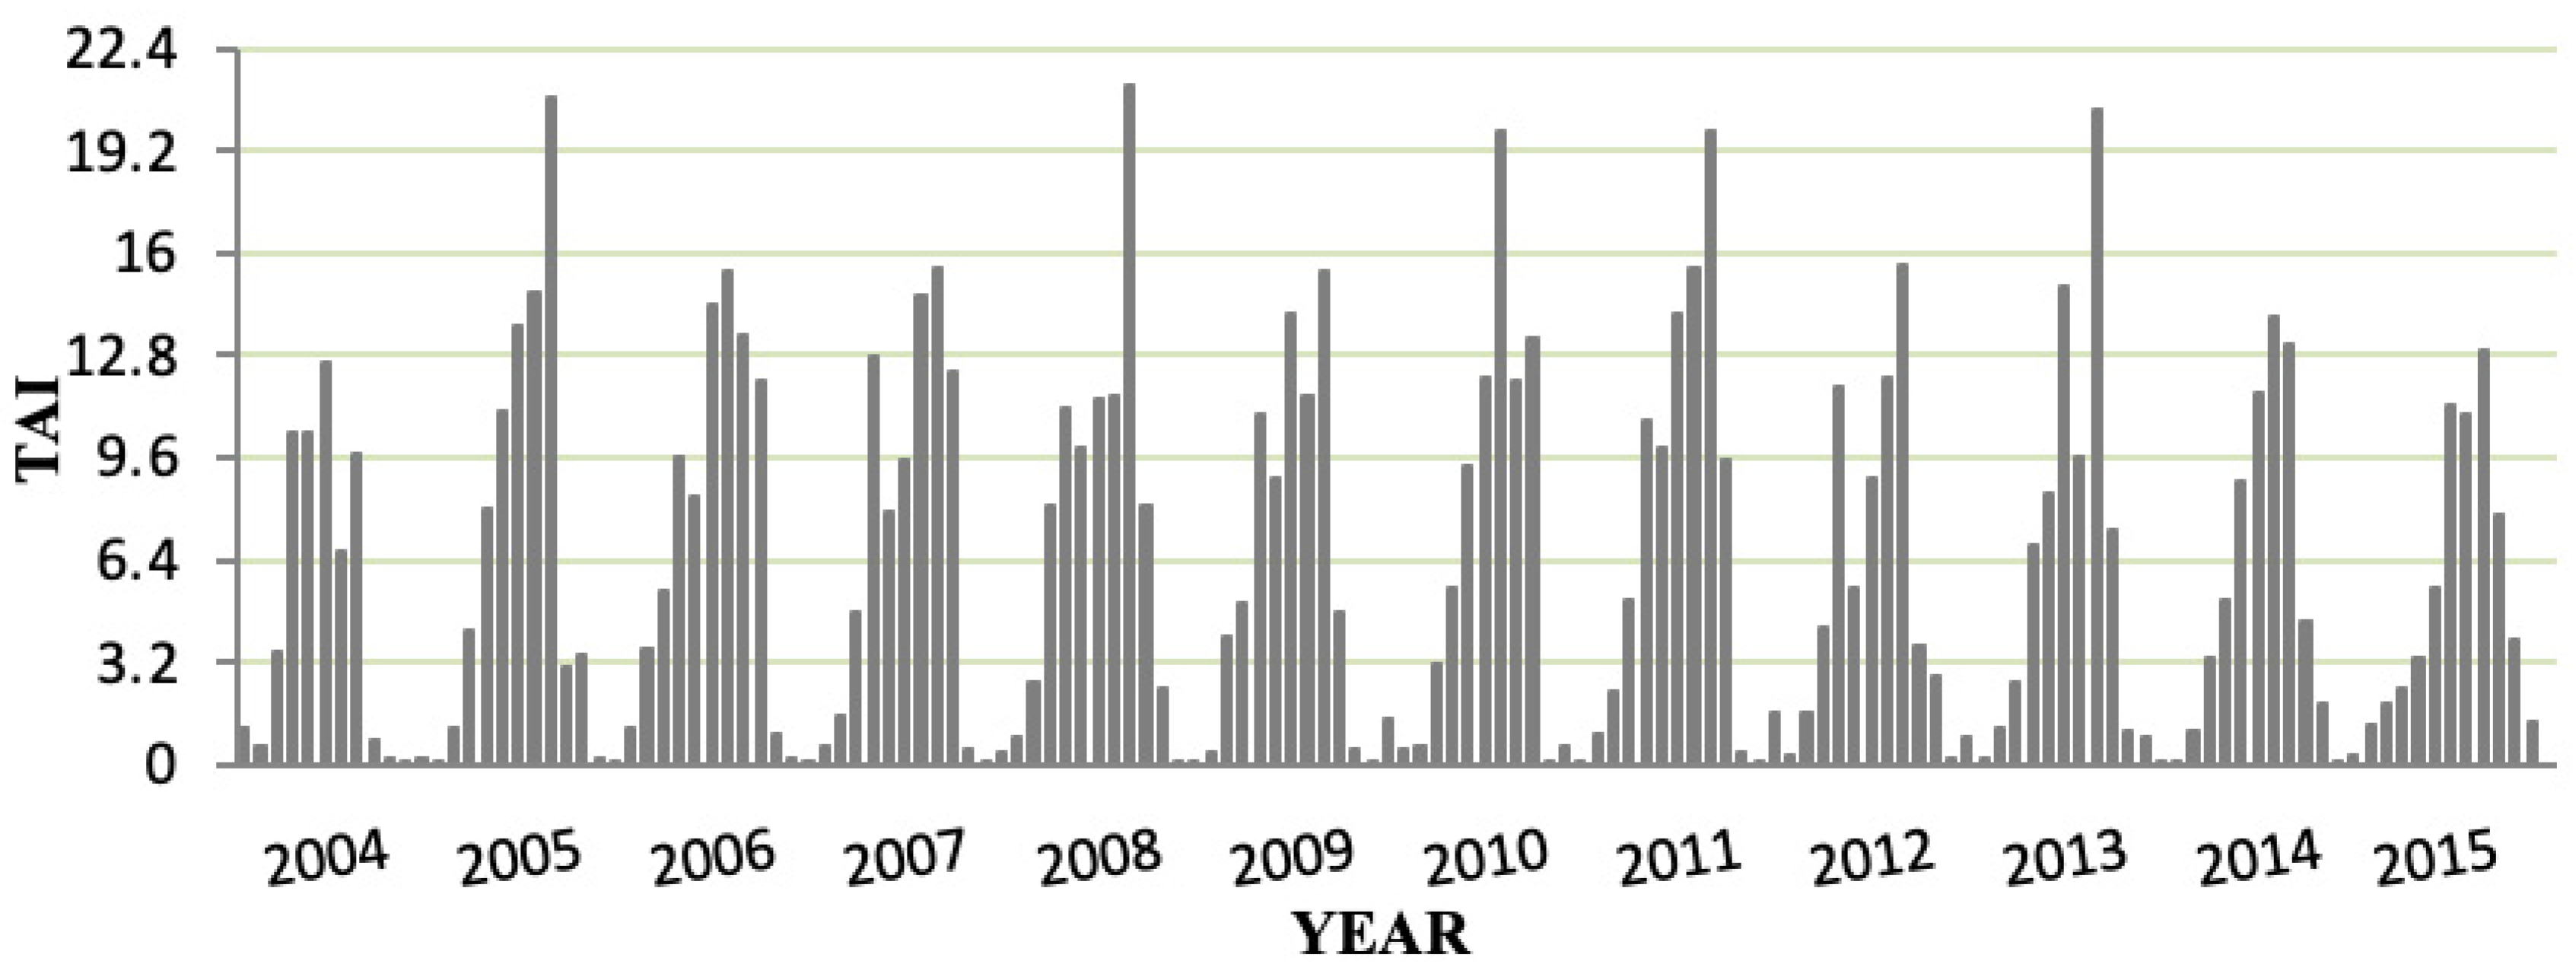
4.2. Temporal Variation in the Thornthwaite Aridity Index

TAI values below 6.4 were an indication of aridity. A pattern of dryness was seen from Figure 4 for the period of study. Extremely dry conditions were experienced during the earlier months of each year (January, February and March) and towards the end of the year (October, November and December). Values greater than 6.4 indicated wet conditions; hence, high peaking values on the graph were an indication of floods as the area was also prone to such events. These occurred mainly during the month of August for the years 2005, 2008, 2011 and 2013, and July 2010. The year 2015 encountered the longest dry period. From January to June and November to December, values were below 6.4. Other years which had a substantial number of dry months included 2004, 2012 and 2014, which was evidence of aridness. Cassava is a root crop and so is vulnerable to waterlogging.

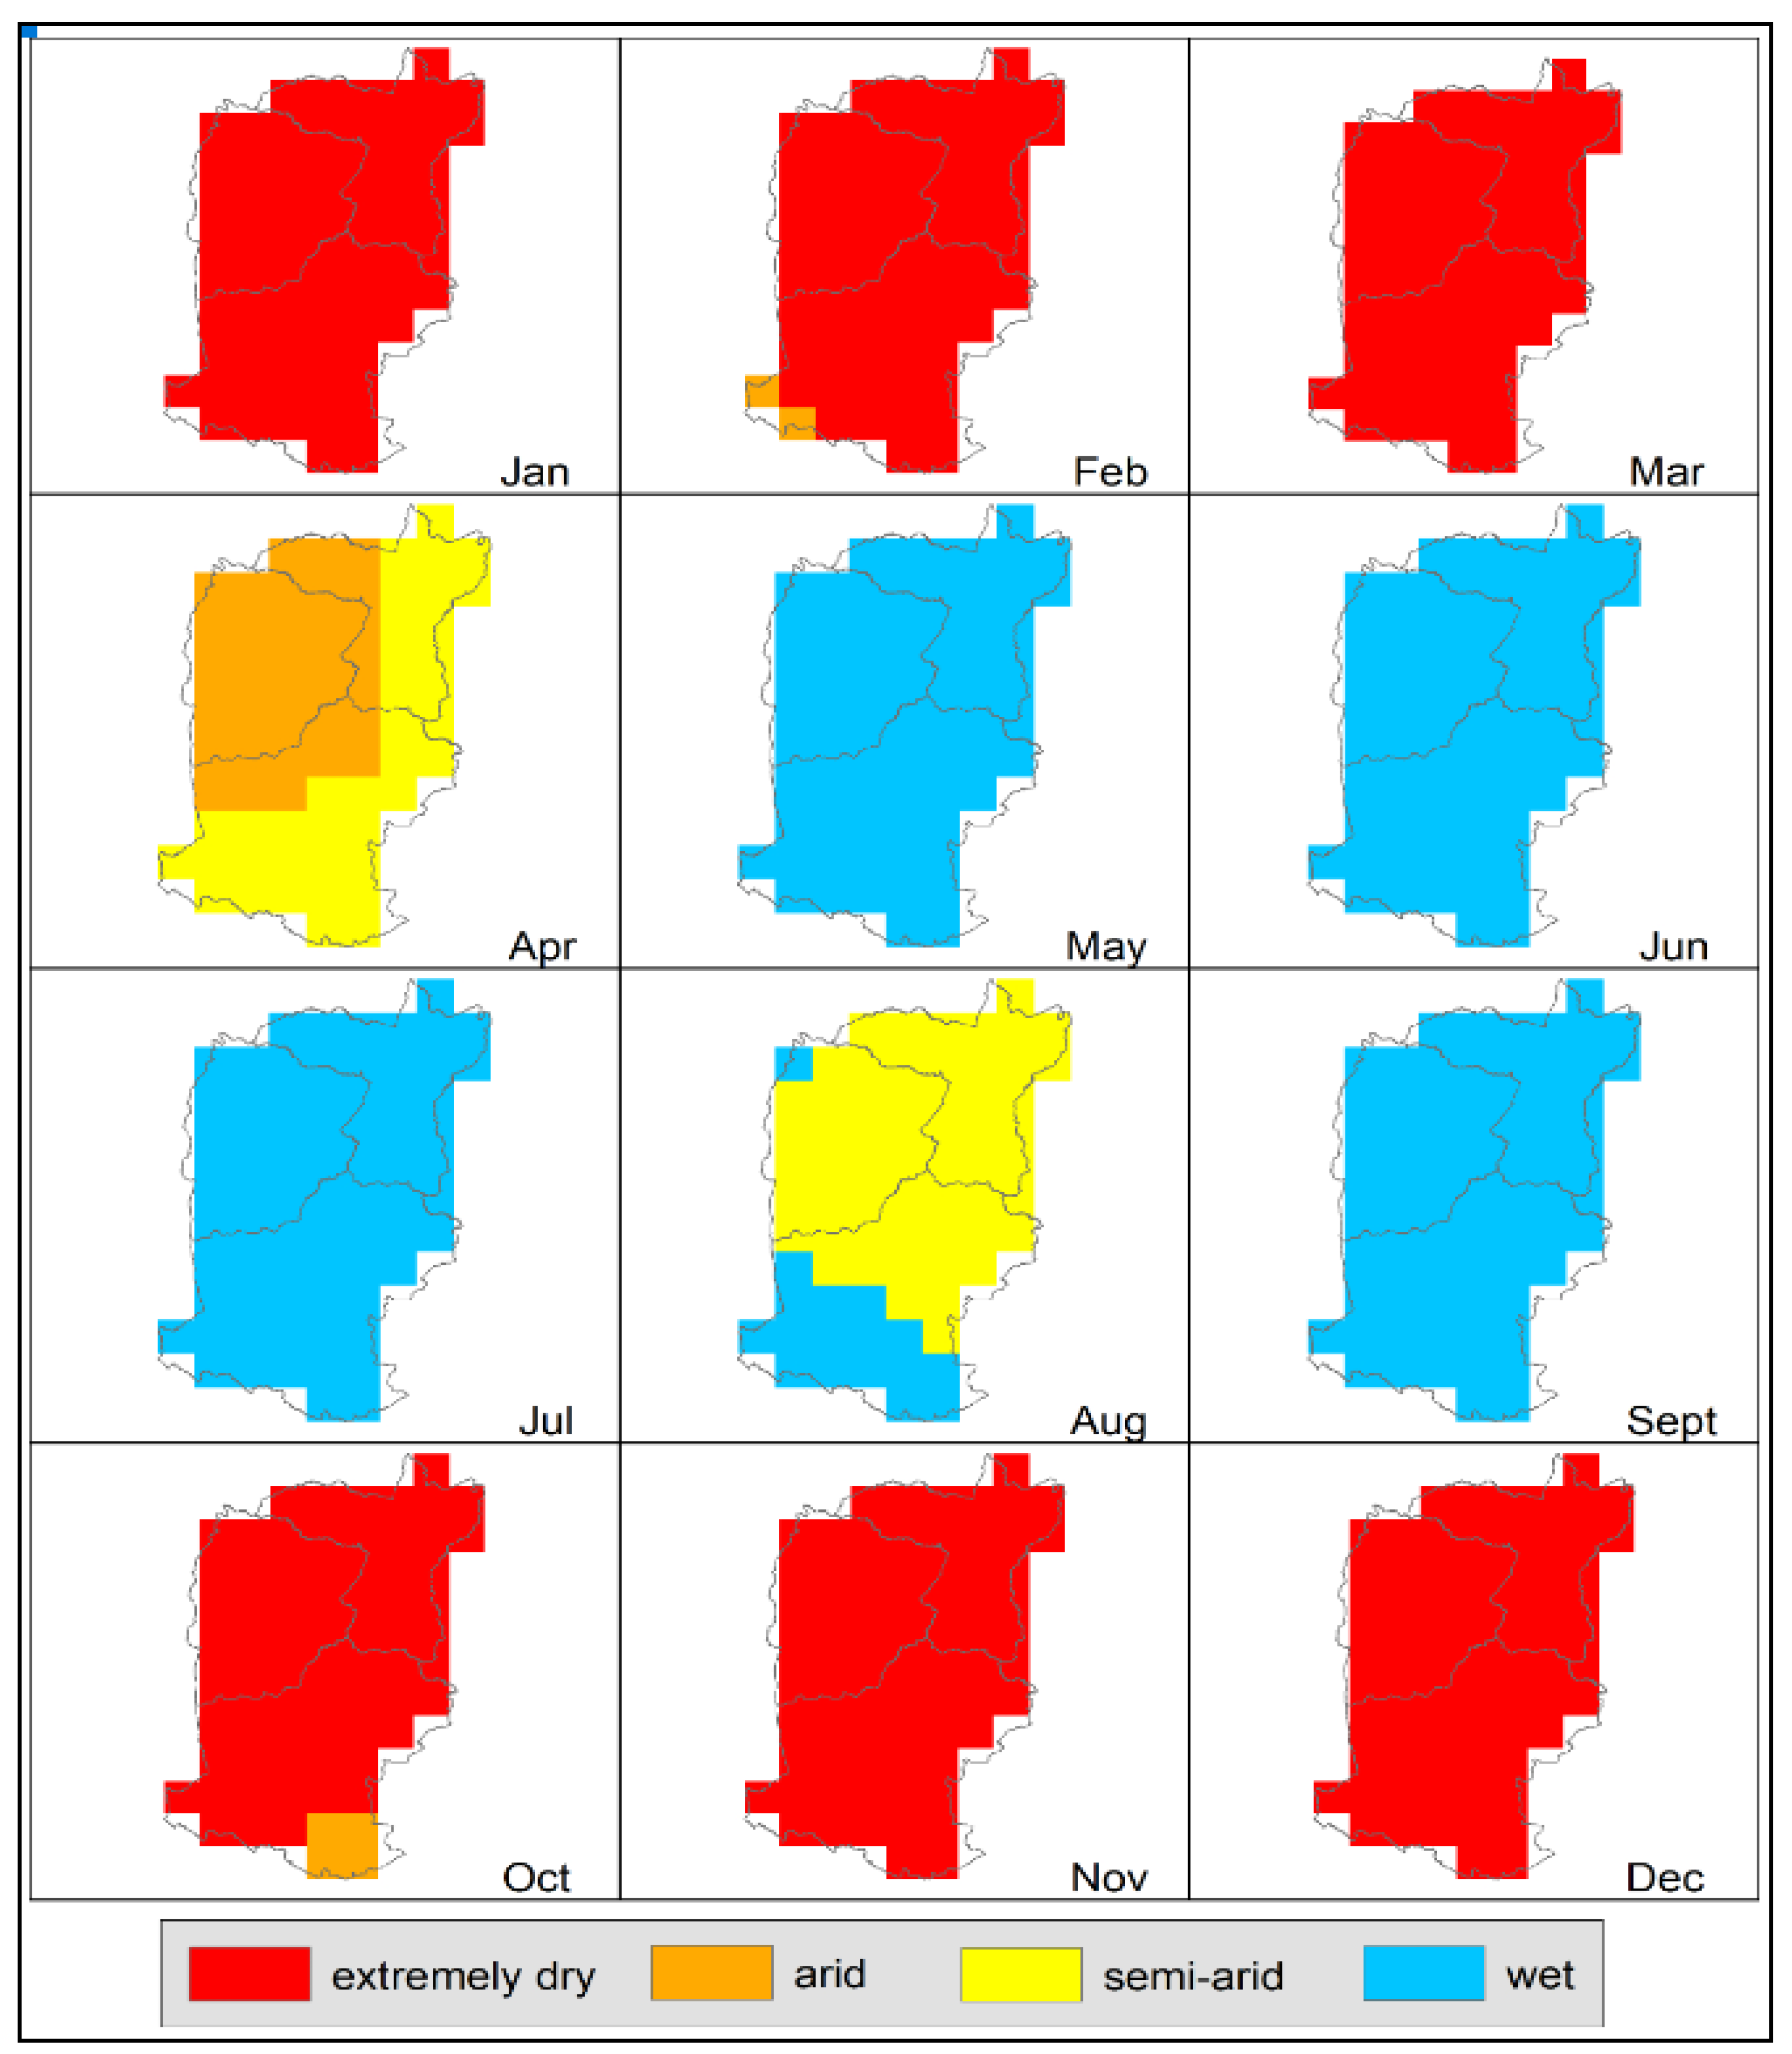
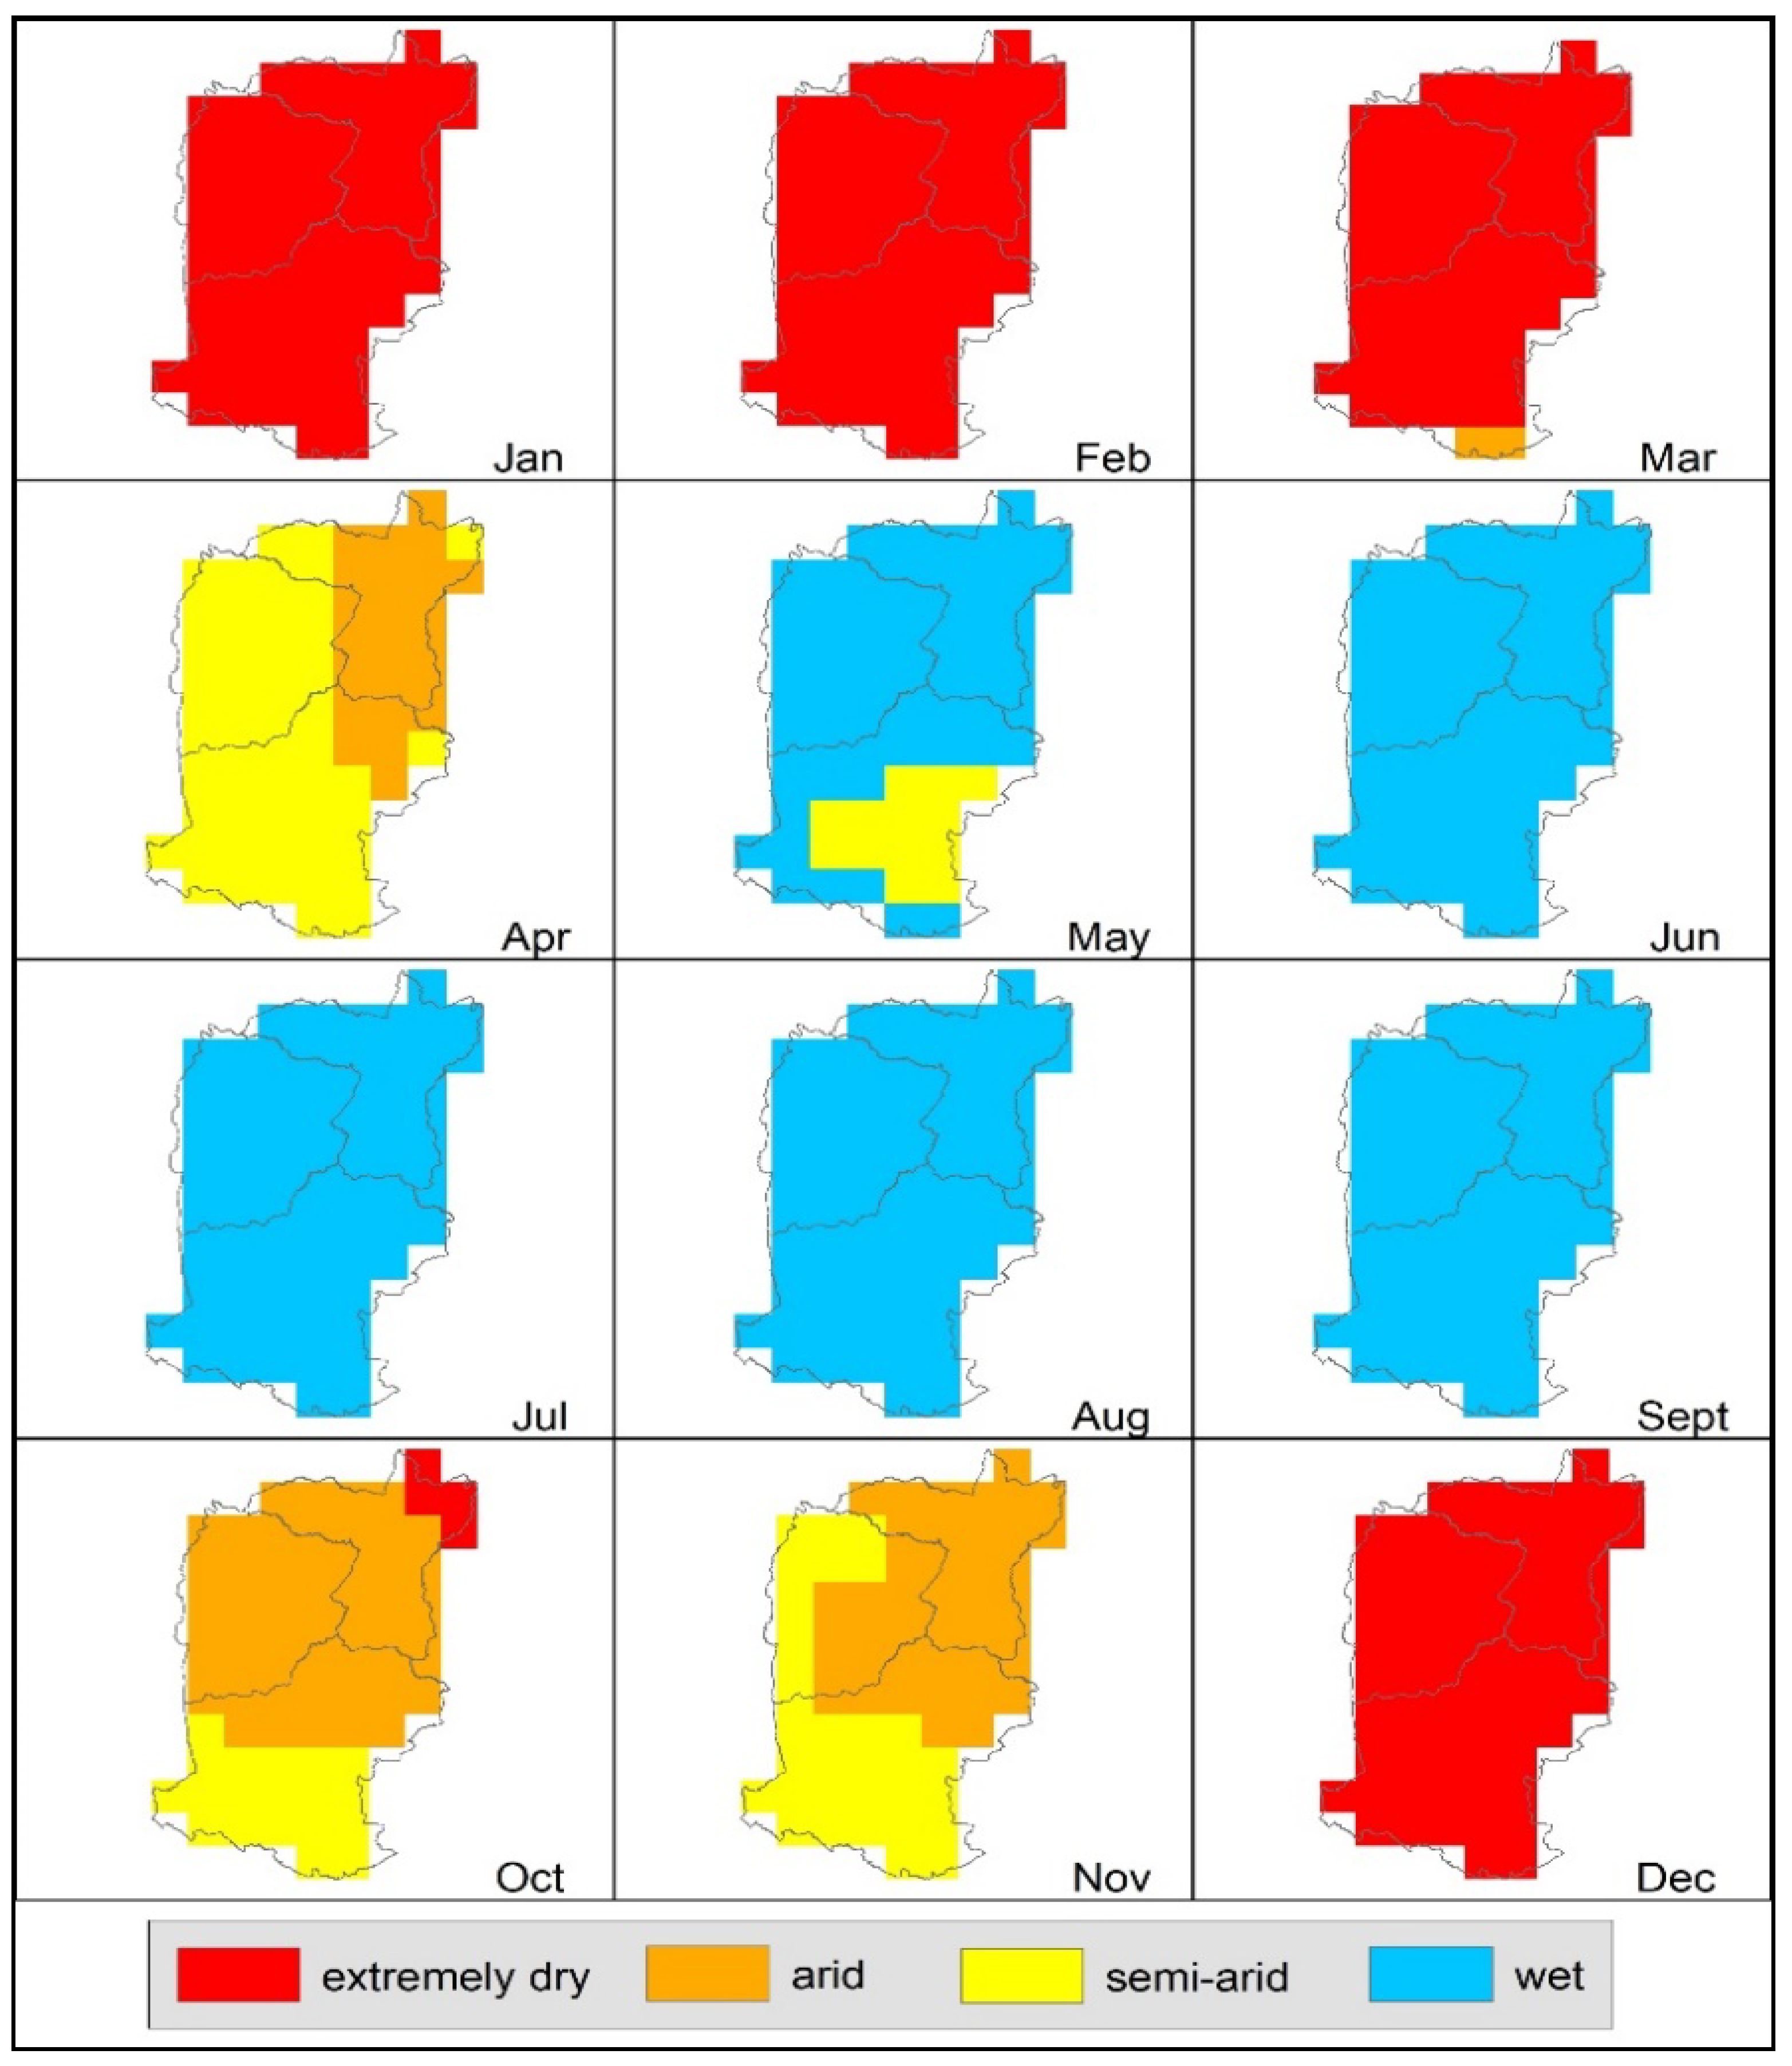
4.3. Spatial Variation in the TAI for Meteorological Drought Years

A comparison between meteorological drought years in terms of aridity, as shown in Figure 5, Figure 6, Figure 7, Figure 8, Figure 9 and Figure 10, indicated that dryness was experienced for a majority of the months each year. During drought periods, the area experienced up to 8 months of (dry season) aridity within a year and only a mere 4 months of growing season, where almost the whole area experienced wet conditions and even flooding. The years 2004 (Figure 5), 2012 (Figure 8), 2014 (Figure 9) and 2015 (Figure 10) mainly had 8 arid months, whilst 2005 (Figure 6) and 2010 (Figure 7) had 7 arid months. Under historically normal conditions, the wet season lasts approximately 6 months (from May to early October). Specifically, during 2012 (Figure 8) some areas within the provinces experienced up to 9 months of aridity, and the situation worsened, with other parts being dry for up to 10 months in 2014 (Figure 9). Though that was the case, the year 2004 was hard hit as 6 out of the 8 months were extremely dry. This was followed by 2010 (Figure 7) and 2015 (Figure 10) with 5 months of extreme aridity. The rest of the drought years had approximately 4 months of extreme aridity. Notably, these aridity events occurred between January and March, and October and December, which covered both the summer and winter seasons when rainfall was both expected and needed for successful cropping.
As the rainy season normally begins in May, there was a delay in the onset of rains of one month for all the provinces during 2010 (Figure 7) and for 2014 (Figure 9), with up to 3 months delay for some areas covering the provinces of Chaiyaphum and Nakhon Ratchasima. A delay of two months was experienced in 2015 (Figure 10) as all areas were still semi-arid even in June when the wet season should have already started. Regular rains were also disrupted in August 2004 and June 2012. Unseasonal rain cut-offs at the end of the growing season also occurred during some years. Once again, in 2004, rains ended early, as per the extreme dryness in October 2004. Arid conditions were prominent during the same month of 2005 in Khon Kaen, Chaiyaphum and northern parts of Nakhon Ratchasima. There was a combination of mild to semi-arid conditions in October 2012 and 2014.

5. Discussion

SPI evaluations showed evidence that in almost every year, the area underwent some periods of moderate dryness outside the dry season, and so adversely affected the growth of crops in the growing season. In general, there was a consensus between the SPI values at different time scales. Major meteorological drought periods occurred during 2004, 2005, 2010, 2012, 2014 and 2015. This corresponded to the spatial patterns of the VCI (vegetation condition index) in a study conducted for the same period, which indicated the worst effect on vegetation for the years 2004, 2005 and 2010 [44]. What was of note in all cases of SPIs was that the occurrence frequency of intense levels of dryness increased with time over the course of the study. This applied between the years 2012 and 2015, whereby, each year encountered significant dryness. What was also noted was the fact that the shorter the time scale, the more distinct the display in dryness, which might otherwise have been overlooked when considering longer time scales only. This is of importance because a lack of short-term moisture can have an effect (and a lasting effect) on crop agriculture based on annual crops [45]. Dry periods during the growing season can affect annual crop yields very severely.
The most suitable time for planting cassava in the northeast is May, June and July when the soil was usually wet [26,46]. Unfortunately, during the drought years there was a delay in rainfall onset which could have led to delayed planting or failure of the crop. Although the crop has the advantage of being drought tolerant, planting after July results in a substantial yield reduction [26]. Similarly, early or late harvesting has the potential to reduce root yields and root starch contents [47]. Drought conditions can also reduce sugarcane productivity as water stress affects leaf growth and root development [48]. In the northeast, sugarcane is planted between October and November which is the start of the dry season. The stem elongation phase, which requires more water, starts 4 months after planting and lasts up to 9 months [49]. This implies that the stem elongation phase is meant to coincide with the whole wet season. A delay in the wet season has dire implications at the most sensitive initial stage of sugarcane growth. The shortage of water can lead to up to 60% losses [50]. It is also important to differentiate between dry spells and drought as the northeast region also experiences some dry spells [51]. Misidentifying the two can result in the application of inappropriate adaptation and mitigation measures, depletion of resources and, consequently, increased vulnerability [52].
Pertaining to temporal variations in the TAI, August 2005 and July 2010 indicated very wet conditions with the possibility of flooding. Although, these were meteorological drought years, there was a consensus between the TAI and the SPI time scales which indicated moderately wet to extremely wet conditions during these months. As the TAI encompasses both temperature and precipitation [53], it is most commonly related to agrometeorological conditions [33]. Extremely dry and wet conditions are not favorable to agriculture, as too much and too little water is capable of crop destruction, drowning of crops, toxic soil anoxia (waterlogging) and reduced yields. Cassava as a root crop is particularly vulnerable to the adverse effects of waterlogging. Furthermore, aridity indices have little value in water management but more value in tracking climate change effects on local water resources [52]. Higher aridity values imply greater variability in water resources [38]. In this study, TAI results showed an increase in the duration of aridity as time progressed, when considering the latter period of this study.
In the case of the spatial TAI, off-growing-season drought was prominent for all the years. Off-season drought refers to the interruption of the wet (growing) season with dry-season drought [54]. As the climate changes, shifts in seasons are likely to be witnessed. However, analysis of trends in climatic data and long-term observations of changes in spatial patterns of aridity are required to reach such conclusions. Another contributing factor to aridity is that the geology of the area is mainly characterized by sandy sedimentary rock [55]. Salt formation also occurs extensively over the region and as a result the soils contain salt and are also sandy with very low clay content, ranging from poorly developed to well-developed [55]. This sandiness is averse to water retention over intermittent dry spells during the growing season. Quaternary alluvium is limited to the boundaries of river valleys. Approximately 80% of the northeast region is covered by sandy soils [56]. The study [55] on the properties, environment and fertility capability of the sandy soils in the northeast plateau further discovered that in terms of basic fertility parameters, the sandy soils in the region have low pH values (pH ≤ 6.5) and, hence, are regarded as acidic. Tropical acid soils are often perceived as infertile, but the underlying reason is often undiagnosed aluminum toxicity because acids mobilize Al2O3. Aluminum toxicity stunts root growth and interferes with nutrient uptake, stunting root growth and interfering with nutrient uptake. Their organic matter content is also very low, as well as the phosphorus and potassium contents. These parameters give the conclusion of the soils as having low nutrient levels when considering crop cultivation, but their acidity values have no adverse effects, with the exception of sensitive crops [23].
Arid regions are more exposed to droughts and potentially suffer severe impacts. Information on spatial variability of aridity can be very useful in assessing vulnerability levels of different areas, hence, the adequate distribution of resources, more specifically irrigation infrastructure. Irrigation of the northeast is still considered a critical issue at the government level [57]. With regards to agriculture, it is also important to comprehend the phenological growth phases of the crops for effective timing of rescue irrigation for crop recovery and yield improvement. Analysis of the climatic, physical and social conditions are crucial to selecting the best irrigation methods. Considering the frequent and intense water shortages in the area, sub-surface drip irrigation is the best method to use for crop growth because it conserves water as runoff is eliminated and there is less evaporation [58]. The social conditions of the northeast are such that farm management has been left in the hands of the elderly as the youth migrate for better opportunities in urban areas, hence, reducing the agricultural labor force [58]. Sub-surface irrigation requires less labor. Weed germination and weed growth is reduced in drier regions. This method is also well suited for small irrigation events such as during the germination stage, making it convenient for helping successful cassava planting in case of intermittent drought [57]. In terms of physical conditions, salt formation due to rising water tables also occurs extensively over the region, and soils have low nutrient levels [55]. Deep percolation of sub-surface drip irrigation greatly reduces nutrient leaching. Light and frequent irrigation has the ability to reduce the soil matric potential which, in turn, reduces hazards related to salinity [55].

6. Conclusions

The standardized precipitation index (SPI) proved to be efficient in identifying meteorological drought years. The variability in wet and dry periods was prominent, although the shorter time cycles of 1 and 3 months exhibited more strength compared to the 6 months cycles. The SPI results generally indicated that the climate conditions in the region are becoming worse in terms of drought occurring more frequently as time progresses and the wet season becoming more intermittent. Periods of drought were characterized by severe to extremely dry conditions, lasting longer by up to approximately 2 months or 4 months for the worst cases than the normal duration of the dry season based on long-term records. Temporal Thornthwaite aridity index results indicated very high index values for most of the years during the month of August, resulting from the area being exposed to floods. In terms of the spatial TAI, all three provinces experienced arid to extremely dry conditions for an average of 6 months from October to March during the meteorological drought years. Both indices were in agreement in regard to the disturbance of the rainy season during these years. This implies that frequent and prolonged droughts, combined with the unfavorable geological conditions of the area, could potentially lead to increased spatial aridity, which has the potential to reduce the area of arable land in the northeast. It is a known fact that droughts are rife in the northeast, but a deeper analysis into the levels of aridity, duration, distribution and the erratic unreliable nature of the wet season, would give more insight and would be more interpretative of the conditions. The usage of two or more indices to analyze a single event is more desirable as it caters for the weaknesses of one single index over another and provides more detailed information. The spatial and temporal information on drought and aridity can be useful in supplementing drought monitoring gaps and can be incorporated in water resource planning and land resource evaluation, mainly for the region’s agricultural areas. Due to the regions’ high level of vulnerability, the need for continuous monitoring cannot be overemphasized as it is a crucial aspect in identifying emerging droughts and monitoring climate change effects.

Author Contributions

Conceptualization, T.D. and V.S.; formal analysis, T.D.; writing—original draft preparation, T.D.; writing—review and editing, W.K. and R.J.R. All authors have read and agreed to the published version of the manuscript.

Funding

This research was funded by the Thailand International Cooperation Agency and the Faculty of Technology and Environment, Prince of Songkla University, Phuket Campus.

Institutional Review Board Statement

Not applicable.

Informed Consent Statement

Not applicable.

Data Availability Statement

The rainfall and temperature data were downloaded for free from the NASA product (GLDAS Noah Land Surface Model L4 monthly 0.25 × 0.25 degree V2.1) website https://disc.gsfc.nasa.gov/datasets/GLDAS_NOAH025_M_2.1/summary. (accessed on 22 July 2022). Land Use/Land Cover data are the property of the Land Development Department, Thailand.

Acknowledgments

Acknowledgment is due to the Faculty of Technology and Environment, Prince of Songkla University, Phuket Campus for academic support and the Land Development Department, Thailand Government for LULC maps. Special thanks to the Thailand International Cooperation Agency for academic funding.

Conflicts of Interest

The authors declare no conflict of interest.

Appendix A

Appendix A.1. Computation of the SPI

i.
Mean of precipitation:
Mean = X ¯ = X N
where N is the number of precipitation observations.
ii.
Standard deviation for the precipitation:
s = ( X X ¯ ) 2 N
iii.
Skewness of precipitation:
skew = N ( N 1 ) ( N 2 ) ( X X ¯ s ) 3
iv.
Conversion of precipitation to lognormal values and the statistics U:
log   mean = X ¯ ln = ln ( X ¯ )
U = X ¯ ln ln ( X ) N
shape   parameter = β = 1 + ( 1 + 4 U 3 ) 4 U  
scale   parameter = α = X ¯ β
v.
Shape and scale parameters of Gamma distribution:
vi.
Cumulative probability of an observed precipitation event (based on shape and scale parameters):
G ( X ) = 0 x X α 1 e X β dx β α Γ ( α )
vii.
As the gamma function is undefined for x = 0 and the distribution of precipitation has a possibility of having zeros, the cumulative probability becomes:
H ( x ) = q + ( 1 q ) G ( x )
where q is the probability of zero.
viii.
The cumulative probability is transformed to the standard normal variable with a mean of zero and a variance of one, and that is the SPI (using approximate conversion):
Z = SPI = ( t c 0 + c 1 t + c 2 t 2 1 + d 1 t + d 2 t 2 + d 3 t 3 ) , 0 < H ( x ) 0.5
Z = SPI = + ( t c 0 + c 1 t + c 2 t 2 1 + d 1 t + d 2 t 2 + d 3 t 3 ) , 0.5 < H ( x ) 1
where,
t = ln ( 1 H 2 ( x ) ) , 0 < H ( x ) 0.5
t = ln ( 1 ( 1 H ( x ) ) 2 ) , 0.5 < H ( x ) 1
c0 = 2.51557, c1 = 0.802583, c2 = 0.010328, d1 = 1.432788, d2 = 0.189269 and d3 = 0.001308, all being constants utilized in the computation of the SPI.

References

  1. Belal, A.A.; El-Ramady, H.R.; Mohamed, E.S.; Saleh, A.M. Drought risk assessment using remote sensing and GIS techniques. Arab. J. Geosci. 2014, 7, 35–53. [Google Scholar] [CrossRef]
  2. National Drought Mitigation Centre. Why Is Drought Important? (Fact Sheet); University of Nebraska: Lincoln, NE, USA, 2006; Available online: http://drought.unl.edu/ (accessed on 5 May 2019).
  3. Byun, H.-R.; Wilhite, D.A. Objective Quantification of Drought Severity and Duration. J. Clim. 1999, 32, 2747–2756. [Google Scholar] [CrossRef]
  4. Wang, F.; Zhang, J. Arid/humid patterns over Asia in response to national committed emission reductions under the Paris Agreement. Prog. Earth Planet. Sci. 2020, 7, 11. [Google Scholar] [CrossRef]
  5. Adel, E.; Magdy, M. Impact of climate change on arid lands agriculture. Agric. Food Secur. 2012, 1, 3. [Google Scholar] [CrossRef]
  6. Intergovernmental Panel on Climate Change. Technical Summary. In Climate Change 2022: Impacts, Adaptation and Vulnerability. Contribution of Working Group II to the Sixth Assessment Report of the Intergovernmental Panel on Climate Change; Pörtner, H.-O., Roberts, D.C., Tignor, M., Poloczanska, E.S., Mintenbeck, K., Alegría, A., Craig, M., Langsdorf, S., Löschke, S., Möller, V., et al., Eds.; Cambridge University Press: Cambridge, UK; New York, NY, USA, 2022; pp. 37–118. [Google Scholar] [CrossRef]
  7. Vieux, B.T.; Mamadou, L.N.; Ramatoulaye, M.N.; Saïdou, D.; Mariama, N.K.; Amadou, T.D.; Aboubaker, C.B. Spatialization of the climate using aridity indices: Case of agro ecological zone of peanut basin, Senegal. J. Mater. Environ. Sci. 2020, 11, 2106–2122. [Google Scholar]
  8. Penning de Vries, F.; Ruaysoongnern, S. Multiple Sources of Water for Multiple Purposes in Northeast Thailand; International Water Management Institute: Colombo, Sri Lanka, 2010. [Google Scholar] [CrossRef]
  9. Choenkwan, S.; Fox, J.M.; Rambo, A.T. Agriculture in the Mountains of Northeastern Thailand: Current Situation and Prospects for Development. Mt. Res. Dev. 2014, 34, 95–106. [Google Scholar] [CrossRef]
  10. World Bank. Thailand Environment Monitor: Integrated Water Resources Management—A Way Forward. 2011. Available online: http://documents.worldbank.org/curated/en/2011/06/14600150/thailand-environment-monitor-integrated-water-resources-management-way-forward (accessed on 5 February 2019).
  11. Yu, Z.; Jianhong, N.; Sizhu, Z. Sustainability of Sugarcane and Cassava-based Fuel-ethanol Production in China. Int. J. Agric. Res. 2012, 7, 457–469. [Google Scholar] [CrossRef]
  12. IMARC Group. Cassava Processing Market: Global Industry Trends, Share, Size, Growth, Opportunity and Forecast 2021–2026. 2021. Available online: https://www.imarcgroup.com/cassava-processing-plant (accessed on 18 September 2022).
  13. Expert Market Research. Global Cassava Processing Market Outlook (2017–2027). Available online: https://www.expertmarketresearch.com/reports/cassava-processing-market/toc (accessed on 18 September 2022).
  14. Charles, O.; Wilhelm, G.; Morag, F.; Hervé, V. Morpho-physiological and molecular evaluation of drought tolerance in 504 cassava (Manihot esculenta Crantz). Field Crops Res. 2020, 255, 107861. [Google Scholar] [CrossRef]
  15. Samwel, K.M.; Valentine, O.N.; Leena, T.; Jaindra, N.T. Mechanisms and approaches towards enhanced drought tolerance in cassava (Manihot esculenta). Curr. Plant Biol. 2021, 28, 100227. [Google Scholar] [CrossRef]
  16. Qi, L.; Sasa, X.; Xiaowen, Z.; Yue, L.; Yuanjun, X.; Jicao, D.; Beilei, W.; Yunchang, P.; Weixing, D.; Ziting, W. Drought Sensitivity of Sugarcane Cultivars Shapes Rhizosphere Bacterial Community Patterns in Response to Water Stress. Front. Microbiol. 2020, 2, 732989. [Google Scholar] [CrossRef]
  17. Ekasingh, B.; Sungkapitux, C.; Kitchaicharoen, J.; Suebpongsang, P. Cassava and Sugarcane. In The Development of Competitive Commercial Agriculture in the Northeast of Thailand, 1950–2006: A Review; The Multiple Cropping Centre, Faculty of Agriculture, Chiang Mai University: Chiang Mai, Thailand, 2007; pp. 63–93. [Google Scholar]
  18. Hao, Z.; Singh, V.P.; Xia, Y. Seasonal Drought Prediction: Advances, Challenges, and Future Prospects. Rev. Geophys. 2018, 56, 108–141. [Google Scholar] [CrossRef]
  19. Van Loon, A.F.; Van Lanen, H.A.J. A process-based typology of hydrological drought. Hydrol. Earth Syst. Sci. 2012, 16, 1915–1946. [Google Scholar] [CrossRef]
  20. Moral, F.J.; Paniagua, L.L.; Rebollo, F.J. Spatial analysis of the annual and seasonal aridity trends in Extremadura, 518 southwestern Spain. Appl. Clim. 2017, 130, 917–932. [Google Scholar] [CrossRef]
  21. Wiréhn, L. Climate indices for the tailoring of climate information—A systematic literature review of Swedish forestry and agriculture. Clim. Risk Manag. 2021, 34, 100370. [Google Scholar] [CrossRef]
  22. Sriroth, K.; Rojanaridpiched, C.; Vichukit, V.; Suriyapan, P.; Oates, C. Present Situation and Future Potential of Cassava in Thailand in Cassava’s potential in Asia in the 21st Century: Present situation and future research and development needs. In Proceedings of the Sixth Regional Workshop, Ho Chi Minh City, Vietnam, 21–25 February 2000; Howeler, R.H., Tan, S.L., Eds.; Centro Internacional de Agricultura Tropical (CIAT): Rome, Italy; Cassava Office for Asia: Hong Kong, 2001; pp. 25–46. [Google Scholar]
  23. Barnaud, C.; Trebuil, G.; Dufumier, M.; Suphanchaimart, N. Rural poverty and diversification of farming systems in upper northeast Thailand. Soc. Sci. Res. Southeast Asia 2006, 9, 157–187. [Google Scholar] [CrossRef]
  24. Martin, S.A.; Ritchie, R.J. Sourcing Thai Geography Literature for ASEAN and International Education. Singap. J. Trop. Geogr. 2019, 41, 61–85. [Google Scholar] [CrossRef]
  25. Rayasawath, C. Factors Affecting the Household Succession in Agricultural Occupation in Nakhon Ratchasima Province, Thailand. Agriculture 2018, 8, 109. [Google Scholar] [CrossRef]
  26. Ratanawahara, C.; Senanarong, N.; Suriyapan, P. Status of Cassava in Thailand: Implication for Future Research and Development, in Cassava in Asia; Ministry of Agriculture and Cooperatives: Bangkok, Thailand, 2000. [Google Scholar]
  27. Phien, H.N.; Arbhabhirama, A.; Sunchindah, A. Rainfall distribution in northeastern Thailand. Hydrol. Sci. Bull. 2019, 25, 167–182. [Google Scholar] [CrossRef]
  28. Thailand Meteorological Department. The Climate of Thailand (1981–2010). Available online: https://www.tmd.go.th/en/archive/thailand_climate.pdf (accessed on 10 April 2019).
  29. Regional Climate Change Assessment Knowledge Platform for Asia. Assessment of Capacity Gaps and Needs of South East Asia Countries in Addressing Impacts, Vulnerability and Adaptation to Climate Variability and Climate Change: Bangkok, Thailand. 2011. Available online: www.asiapacificadapt.net (accessed on 20 April 2019).
  30. Thai Health. Severe Drought Followed by Devastating Floods: Preparedness for Climate Change. 2011. Available online: http://www.hiso.or.th/hiso/picture/reportHealth/ThaiHealth2011/eng2011_15.pdf (accessed on 5 February 2019).
  31. Limsakul, A.; Singhruck, P. Long-term trends and variability of total and extreme precipitation in Thailand. Atmos. Res. 2006, 169, 301–317. [Google Scholar] [CrossRef]
  32. Interrisk Asia. Drought Report, Thailand 2016; InterRisk Asia (Thailand) Co., Ltd.: Bangkok, Thailand, 2016; Available online: http://www.interriskthai.co.th/wp-content/uploads/2017/12/16-005-Drought-20160318.pdf (accessed on 5 February 2019).
  33. Naruchaikusol, S. Climate Change and Its Impact in Thailand: A Short Overview on Actual and Potential Impacts of the Changing Climate in Southeast Asia (Fact Sheet); TransRe: Bonn, Germany, 2016; Available online: http://www.transre.org/files/3114/6522/5151/Climate_Change_in_Thailand_TransRe_Fact_Sheet_No.2.pdf (accessed on 20 April 2019).
  34. Dibesh, K.; Mukand, S.B.; Matthew, C.; Sangam, S.; Salvatore, G.P.V.; Albert, S.C. Projected changes in the near-future mean climate and extreme climate events in northeast Thailand. Int. J. Climatol. 2021, 42, 2470–2492. [Google Scholar] [CrossRef]
  35. Beaudoing; Hiroko; Rodell, M. NASA/GSFC/HSL, GLDAS Noah Land Surface Model L4 Monthly 0.25 × 0.25 Degree V2.1; Goddard Earth Sciences Data and Information Services Center (GES DISC): Greenbelt, MD, USA, 2016. [Google Scholar] [CrossRef]
  36. Kumar, M.N.; Murthy, C.S.; Sesha Sai, M.V.R.; Roy, P.S. On the use of Standardized Precipitation Index (SPI) for drought intensity assessment. Meteorol. Appl. 2009, 16, 381–389. [Google Scholar] [CrossRef]
  37. Svoboda, M.D.; Fuchs, B.A. Handbook of Drought Indicators and Indices; Integrated Drought Management Programme (IDMP), Drought Mitigation Center Faculty Publications, University of Nebraska: Lincoln, NE, USA, 2016. [Google Scholar]
  38. Gebremedhin, M.A.; Kahsay, G.H.; Fanta, H.G. Assessment of spatial distribution of aridity indices in Raya valley, northern Ethiopia. Appl. Water Sci. 2018, 8, 217. [Google Scholar] [CrossRef]
  39. Zargar, A.; Sadiq, R.; Naser, B.; Khan, F.I. A review of drought indices. Environ. Rev. 2011, 19, 333–349. [Google Scholar] [CrossRef]
  40. Xia, L.; Zhao, F.; Mao, K.; Yuan, Z.; Zuo, Z.; Xu, T. SPI-Based Analyses of Drought Changes over the Past 60 Years in China’s Major Crop-Growing Areas. Remote Sens. 2018, 10, 171. [Google Scholar] [CrossRef]
  41. Sábitz, J.; Pongrácz, R.; Bartholy, J. Estimated changes of drought tendency in the Carpathian Basin. Hung. Geogr. Bull. 2014, 63, 365–378. [Google Scholar] [CrossRef]
  42. Thornthwaite, C.W. An approach towards a rational classification of climate. Geogr. Rev. 1948, 38, 55–94. [Google Scholar] [CrossRef]
  43. McKee, T.B.; Doesken, N.J.; Kleist, J. The relationship of drought frequency and duration to time scales. In Proceedings of the 8th Conference on Applied Climatology, Anaheim, CA, USA, 17–22 January 1993; pp. 179–184. [Google Scholar]
  44. Dlamini, T.; Songsom, V. Landsat-based drought phenomenon evaluation of cassava and sugar cane in northeast Thailand. J. Eng. Sci. Res. 2019, 3, 6–13. [Google Scholar] [CrossRef]
  45. Dutta, D.; Kundu, A.; Patel, N.R.; Saha, S.K.; Siddiqui, A.R. Assessment of agricultural drought in Rajasthan (India) using remote sensing derived Vegetation Condition Index (VCI) and Standardized Precipitation Index (SPI). Egypt. J. Remote Sens. Space Sci. 2015, 18, 53–63. [Google Scholar] [CrossRef] [Green Version]
  46. Grandstaff, T.B.; Grandstaff, S.; Limpinuntana, V.; Suphanchaimat, N. Rainfed revolution in Northeast Thailand. Southeast Asian Stud. 2008, 46, 289–376. [Google Scholar]
  47. Rojanaridpiched, C.; Sriroth, K. Present situation and future potential of cassava in Thailand. In Proceedings of the Regional Cassava Stakeholders Consultation Meeting, Bangkok, Thailand, 23–25 November 1998. [Google Scholar]
  48. Inman-Bamber, N.; Smith, D. Water relations in sugarcane and response to water deficits. Field Crops Res. 2005, 92, 185–202. [Google Scholar] [CrossRef]
  49. Cock, J.H. Sugarcane growth and development. Int. Sugar J. 2003, 105, 540–552. [Google Scholar]
  50. Ferreira, T.; Tsunada, M.S.; Bassi, D.; Araújo, P.; Mattiello, L.; Guidelli, G.V.; Menossi, M. Sugarcane Water Stress Tolerance Mechanisms and Its Implications on Developing Biotechnology Solutions. Front. Plant Sci. 2017, 8, 1077. [Google Scholar] [CrossRef]
  51. Ouyyanont, P. Rural Thailand: Change and Continuity. In Trends in Southeast Asia; Tiong, T.N., Oh, S., Beng, O.K., Chong, T., Hutchinson, F.E., Singh, D., Nair, V., Li, K.P.J., Eds.; ISEAS-Yusof Ishak Institute: Singapore, 2016; Volume 8, pp. 12–20. [Google Scholar]
  52. Robert, M.; Thomas, M. Aridity and drought. In Arid Lands, Water Evaluation and Management: Environmental Science and Engineering; Springer: Berlin/Heidelberg, Germany, 2012; pp. 21–39. [Google Scholar] [CrossRef]
  53. Mandakh, N.; Qi, F.; Ravinesh, D. A comparative Study of temperature and precipitation-based aridity indices and their trends in Mongolia. Int. J. Environ. Res. 2018, 12, 887–899. [Google Scholar] [CrossRef]
  54. Thaiturapaisan, T. Drought, a Worrying Situation for Thai Agriculture. Available online: https://www.scbeic.com/en/detail/product/1429 (accessed on 10 April 2019).
  55. Kheoruenromne, I.; Suddhiprakarn, A.; Kanghae, P. Properties, Environment and Fertility Capability of Sandy Soils in Northeast Plateau, Thailand. Kasetsart J. Nat. Sci. 1998, 32, 355–373. [Google Scholar]
  56. Nobe, A.D.; Ruaysoongnern, S. Soil Degradation under Long-Term Rice Production in Northeast Thailand. 2019. Available online: http://www.mcc.cmu.ac.th/Seminar/pdf/1361.pdf (accessed on 20 February 2020).
  57. Floch, P.; Molle, F. Irrigated agriculture and rural change in northeastern Thailand: Reflections on present developments. In Governing the Mekong: Engaging in the Politics of Knowledge; Daniel, R., Lebel, L., Manorom, K., Eds.; Strategic Information and Research Development Center (SRID): Petaling Jaya, Malaysia, 2013; pp. 185–198. [Google Scholar]
  58. Lamm, R.F. Advantages and disadvantages of subsurface drip irrigation. In Proceedings of the International Meeting on Advances in Drip/Micro Irrigation, Puerto de La Cruz, Tenerife, Spain, 2–5 December 2002; Instituto Canario de Investigaciones Agrarias: Tenerife, Spain, 2002. [Google Scholar]
Figure 1. ArcGIS-generated land-use map of the study area for 2017 showing cassava and sugarcane fields with Thailand map (inset).
Climate 10 00137 g001
Figure 2. Average monthly rainfall and temperatures for the study area from 2004 to 2015.
Climate 10 00137 g002
Figure 3. Standardized precipitation index (SPI): (a) 1 month, (b) 3 months and (c) 6 months scale.
Climate 10 00137 g003aClimate 10 00137 g003b
Figure 4. Thornthwaite aridity index (TAI); average monthly values for all 3 provinces.
Climate 10 00137 g004
Figure 5. Thornthwaite aridity index map for 2004.
Climate 10 00137 g005
Figure 6. Thornthwaite aridity index map for 2005.
Climate 10 00137 g006
Figure 7. Thornthwaite aridity index map for 2010.
Climate 10 00137 g007
Figure 8. Thornthwaite aridity index map for 2012.
Climate 10 00137 g008
Figure 9. Thornthwaite aridity index map for 2014.
Climate 10 00137 g009
Figure 10. Thornthwaite aridity index map for 2015.
Climate 10 00137 g010
Table 1. Phenomena reflected by specific-duration standardized precipitation indices (SPIs) and their application [39].
SPI DurationPhenomena ReflectedApplication
1 month Short-term conditionsShort-term moisture and crop stress
3 monthsShort- and medium-term moisture conditionsSeasonal estimation of precipitation
6 monthsMedium-term trends in precipitationPrecipitation for different seasons
Table 2. Standardized precipitation index (SPI) values and relative drought conditions [40].
SPILevel
≥−2Extremely wet
1.50 to 1.99Very wet
1.00 to 1.49Moderately wet
−0.99 to 0.99Near normal
−1.49 to −1.00Moderately dry
−1.99 to −1.50Severely dry
≤−2Extremely dry
Table 3. Thornthwaite aridity index (TAI) values and corresponding aridity levels [41].
TAI ScaleLevel
>6.4Wet
3.2 to 6.4Semi-arid
1.6 to 3.2Arid
<1.6Extremely dry
Publisher’s Note: MDPI stays neutral with regard to jurisdictional claims in published maps and institutional affiliations.

