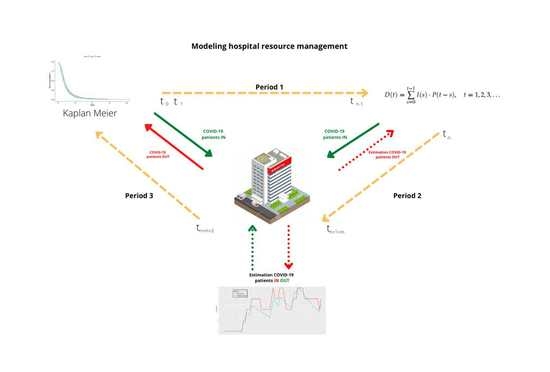
Modeling Hospital Resource Management during the COVID-19 Pandemic: An Experimental Validation
Abstract
:1. Introduction
- 1.
- It should be borne in mind that this is essentially an extrapolation, so the results should be interpreted with the greatest of reservations.
- 2.
- It should also be noted that, since data input was closed on that day, it is assumed that on August 31 the number of patients admitted for COVID-19 was zero.
- 3.
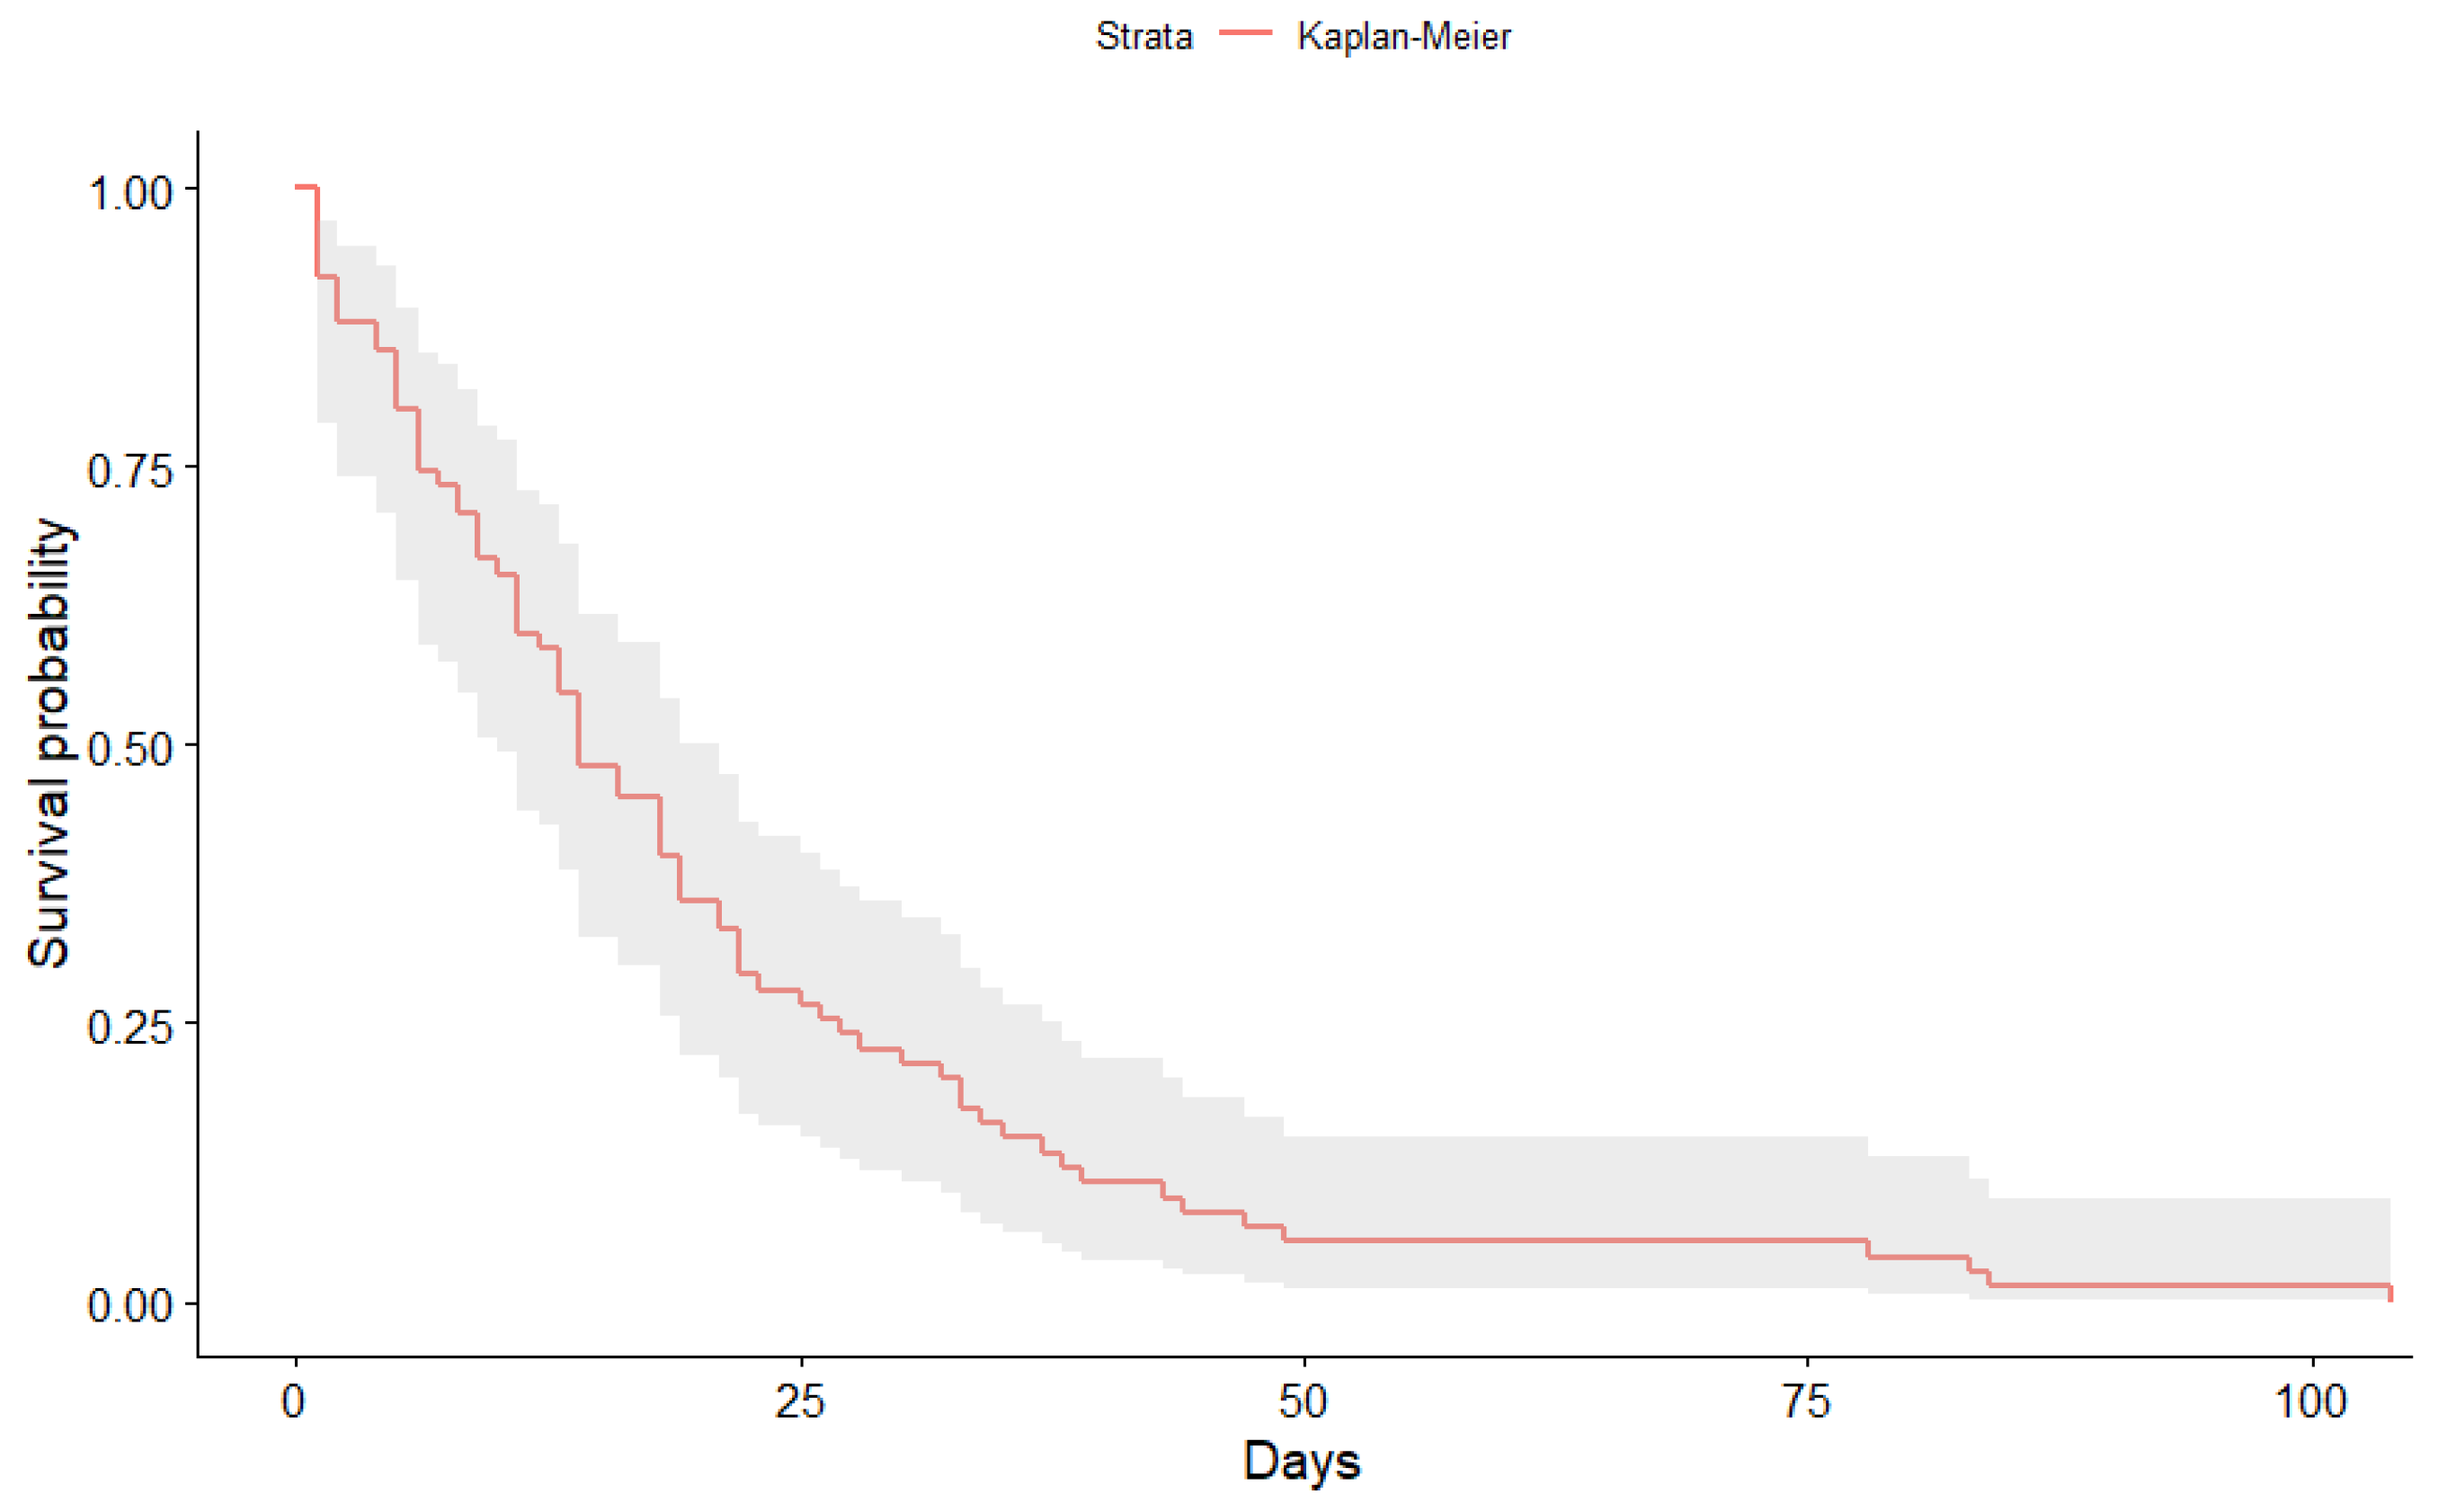
- All patients are considered to complete their hospital stay, i.e., there are no cases that are not followed up. This has relevance within the classic Kaplan-Meier model (empty set of censored population).
- 4.
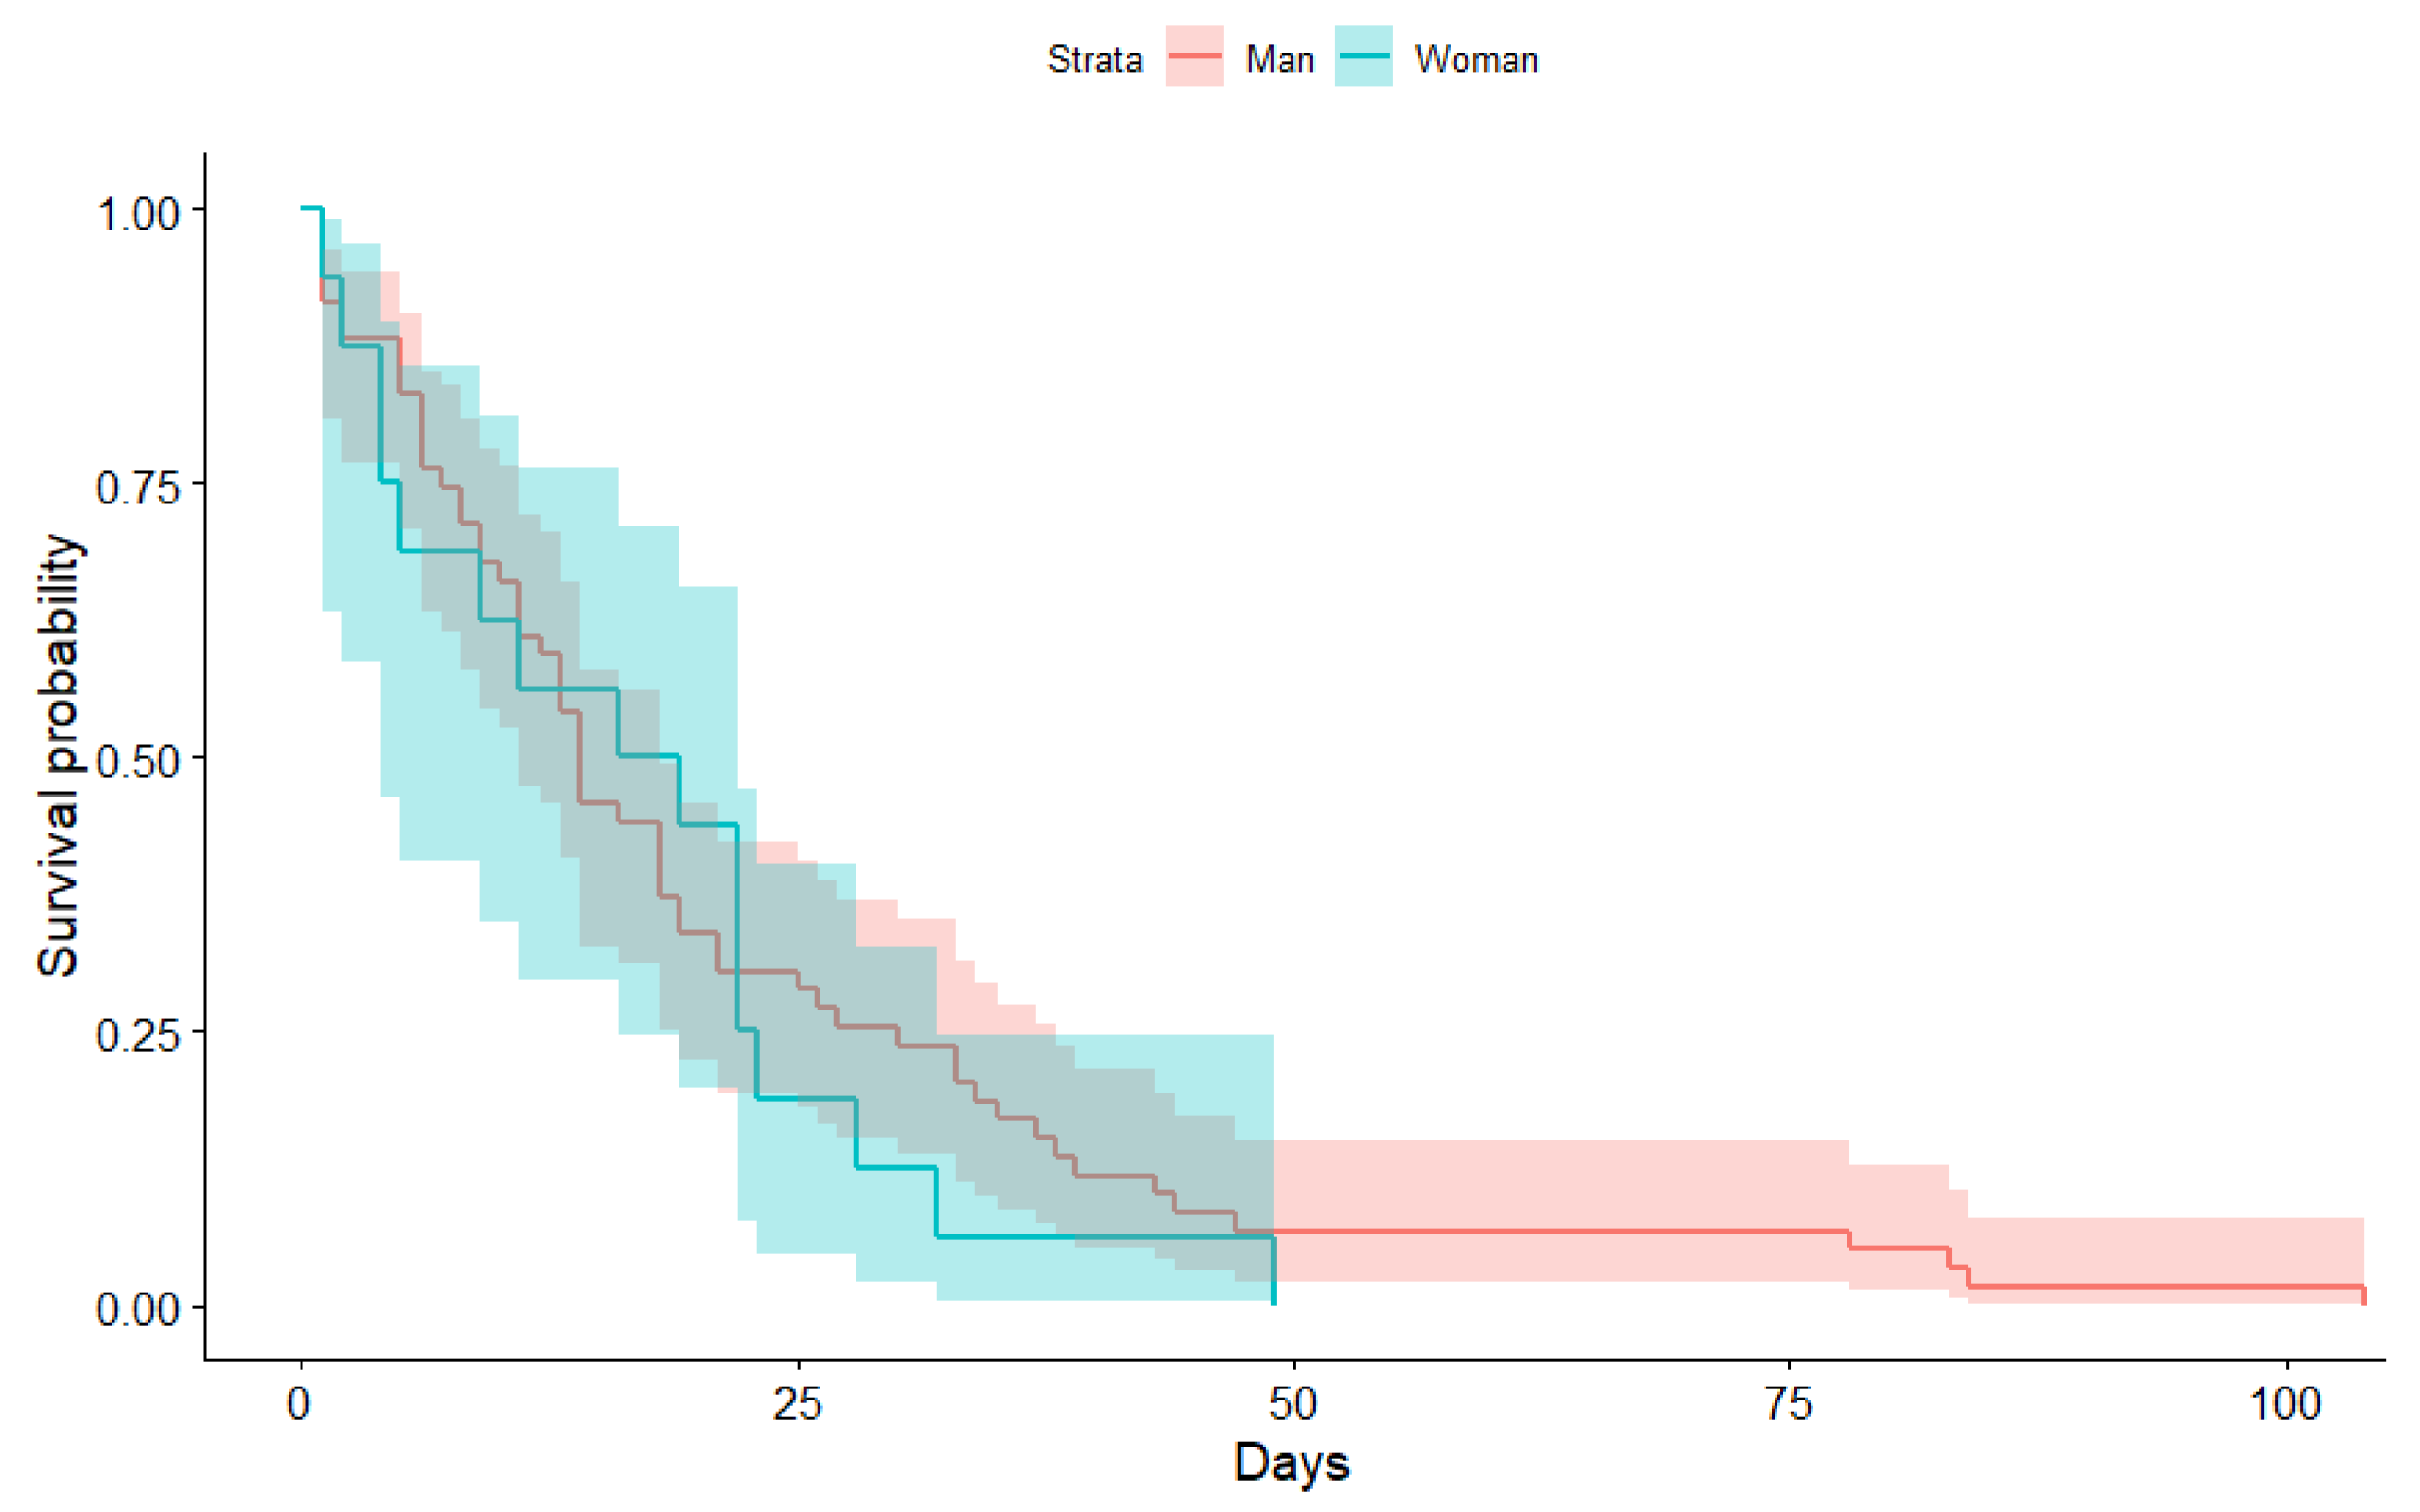
- Some statistical aspects related to the reliability of the solution (error bars, expected deviations, etc.) are only partially presented, since we intend to convey the most relevant information of the solution of this complex problem. This information can be found in part in the tables presented at the end of the paper.
2. Materials and Methods
2.1. Method
2.2. Material
3. Results
3.1. Kaplan-Meier Curves Obtained
3.2. Occupancy in Intensive Care Units
3.3. Estimated Hospital Occupancy
4. Conclusions
Author Contributions
Funding
Institutional Review Board Statement
Informed Consent Statement
Data Availability Statement
Acknowledgments
Conflicts of Interest
| 1 | By convolution we mean the mathematical operator that transforms the input function and the Kaplan-Meier (KM) function into a third function, which represents quantitatively how the inputs accumulate in the system and progressively leave it after a certain period of time. |
| 2 | In the case we are dealing with we assume that there is only one risk, the risk that a patient leaves a bed free for any reason. Thus, the risk is interpreted as being P the probability corresponding to the Kaplan-Meier distribution. |
References
- Bhandari, Sudhir, Tak Amit, Singhal Sanjay, Shukla Jyotsna, Shaktawat Ajit Singh, Gupta Jitendra, Patel Bhoopendra, Kakkar Shivankan, Dube Amitabh, Dia Sunita, and et al. 2020. Patient Flow Dynamics in Hospital Systems During Times of COVID-19: Cox Proportional Hazard Regression Analysis. Frontiers in Public Health 8: 820. [Google Scholar] [CrossRef] [PubMed]
- Calabuig, Jose M., Luís M. García-Raffi, Albert García-Valiente, and Enrique A. Sánchez-Pérez. 2020. Kaplan-Meier type survival curves for COVID-19: A health data based decision-making tool. Frontiers in Public Health. [Google Scholar] [CrossRef]
- Cooper, Ian, Argha Mondal, and Chris G. Antonopoulos. 2020. A SIR model assumption for the spread of COVID-19 in different communities. Chaos, Solitons & Fractals 139: 110057. [Google Scholar]
- Cox, David Roxbee, and David Oakes. 1984. Analysis of Survival Data. London: Chapman & Hall. [Google Scholar]
- Dennis, John M., Andrew P. McGovern, Sebastian J. Vollmer, and Bilal A. Mateen. 2021. Improving Survival of Critical Care Patients with Coronavirus Disease 2019 in England: A National Cohort Study, March to June 2020. Critical Care Medicine 49: 209–14. [Google Scholar] [CrossRef] [PubMed]
- Domínguez-Olmedo, Juan L., Alvaro Gragera-Martínez, Jacinto Mata, and Victoria Pachón Alvarez. 2021. Machine Learning Applied to Clinical Laboratory Data in Spain for COVID-19 Outcome Prediction: Model Development and Validation. Journal of Medical Internet Research 23: e26211. [Google Scholar] [CrossRef] [PubMed]
- Eurostat. 2020. Available online: https://ec.europa.eu/eurostat/statistics-explained/index.php/Healthcare_resource_statistics_-_beds (accessed on 1 June 2021).
- García-Basteiro, Alberto L., Carlos Chaccour, Caterina Guinovart, Anna Llupià, Joe Brew, Antoni Trilla, and Antoni Plasencia. 2020. Monitoring the COVID-19 epidemic in the context of widespread local transmission. The Lancet Respiratory Medicine 8: 440–42. [Google Scholar] [CrossRef]
- Garcia-Vicuña, Daniel Laida Esparza, and Fermin Mallor. 2020. Hospital preparedness in epidemics by using simulation. The case of COVID-19. medRxiv. [Google Scholar] [CrossRef]
- Goscé, Lara, Andrew Phillips, Paula Spinola, Kishi Gupta, and Ibrahim Abubakar. 2020. Modelling SARS-COV2 Spread in London: Approaches to Lift the Lockdown. Journal of Infection 81: 260–65. [Google Scholar] [CrossRef]
- Imani, Mahdi, and Seyede Fatameh Ghoreishi. 2021. Two-Stage Bayesian Optimization for Scalable Inference in State-Space Models. IEEE Transactions on Neural Networks and Learning Systems. [Google Scholar] [CrossRef] [PubMed]
- Kaplan, Edward L., and Paul Meier. 1958. Nonparametric estimation from incomplete observations. Journal of the American Statistical Association 53: 457–81. [Google Scholar] [CrossRef]
- Lai, P. C., C. M. Wong, A. J. Hedley, S. V. Lo, P. Y. Leung, J. Kong, and G. M. Leung. 2004. Understanding the Spatial Clustering of Severe Acute Respiratory Syndrome (SARS) in Hong Kong. Enviromental Health Perspectives 112: 1550–56. [Google Scholar] [CrossRef] [PubMed] [Green Version]
- Liang, Wenhua, Hengrui Liang, Limin Ou, Binfeng Chen, Ailan Chen, Caichen Li, Yimin Li, Weijie Guan, Ling Sang, Jiatao Lu, and et al. 2020. Development and validation of a clinical risk score to predict the occurrence of critical illness in hospitalized patients with COVID-19. JAMA Internal Medicine 180: 1081–89. [Google Scholar] [CrossRef]
- O’Hagan, Anthomy, and John W. Stevens. 2004. On estimators of medical costs with censored data. Journal of Health Economics 23: 615–25. [Google Scholar] [CrossRef] [PubMed]
- R Core Team. 2020. R: A Language and Environment for Statistical Computing. Vienna: R Foundation for Statistical Computing, Available online: https://www.R-project.org/ (accessed on 1 June 2021).
- Roimi, Michael, Rom Gutman, Jonathan Somer, Asaf Ben Arie, Ido Calman, Yaron Bar-Lavie, Udi Gelbshtein, Sigal Liverant-Taub, Arnona Ziv, Danny Eytan, and et al. 2021. Development and validation of a machine learning model predicting illness trajectory and hospital utilization of COVID-19 patients: A nationwide study. Journal of the American Medical Informatics Association 28: 1188–96. [Google Scholar] [CrossRef] [PubMed]
- Therneau, Terry M., and Patricia M. Grambsch. 2000. Modeling Survival Data: Extending the Cox Model. New York: Springer, ISBN 0-387-98784-3. [Google Scholar]
- Tripathi, Arunabh, and Anant Pandey. 2017. Post-hoc comparison in survival analysis: An easy approach. Journal of Biosciences and Medicines 5: 112–19. [Google Scholar] [CrossRef] [Green Version]
- Vaid, Akhil, Sulaiman Somani, Adam J. Russak, Jessica K. De Freitas, Fayzan F. Chaudhry, Ishan Paranjpe, Kipp W. Johnson, Samuel J. Lee, Riccardo Miotto, Felix Richter, and et al. 2020. Machine Learning to Predict Mortality and Critical Events in a Cohort of Patients With COVID-19 in New York City: Model Development and Validation. Journal of Medical Internet Research 6: e24018. [Google Scholar] [CrossRef] [PubMed]
- Varotsos, Costas, and Vladimir F. Krapivin. 2020. A new model for the spread of COVID-19 and the improvement of safety. Safety Science 132: 104962. [Google Scholar] [CrossRef] [PubMed]
- Vincent, Jean-Louis, and Fabio S. Taccone. 2020. Understanding pathways to death in patients with COVID-19. The Lancet Respiratory Medicine 8: 430–32. [Google Scholar] [CrossRef]
- Wickham, Hadley. 2016. ggplot2: Elegant Graphics for Data Analysis. New York: Springer. [Google Scholar]
- Zhao, Chenkai, Yueqin Xu, Xu Zhang, Yaping Zhong, Li Long, Wenzi Zhan, Tingting Xu, Chen Zhan, Yuehan Chen, Jinghai Zhu, and et al. 2020. Public health initiatives from hospitalized patients with COVID-19, China. Journal of Infection and Public Health 13: 1229–36. [Google Scholar] [CrossRef] [PubMed]
- Zhou, Tianjan, and Yuan Ji. 2020. Semiparametric Bayesian inference for the transmission dynamics of COVID-19 with a state-space model. Contemporary Clinical Trials 97: 106146. [Google Scholar] [CrossRef] [PubMed]


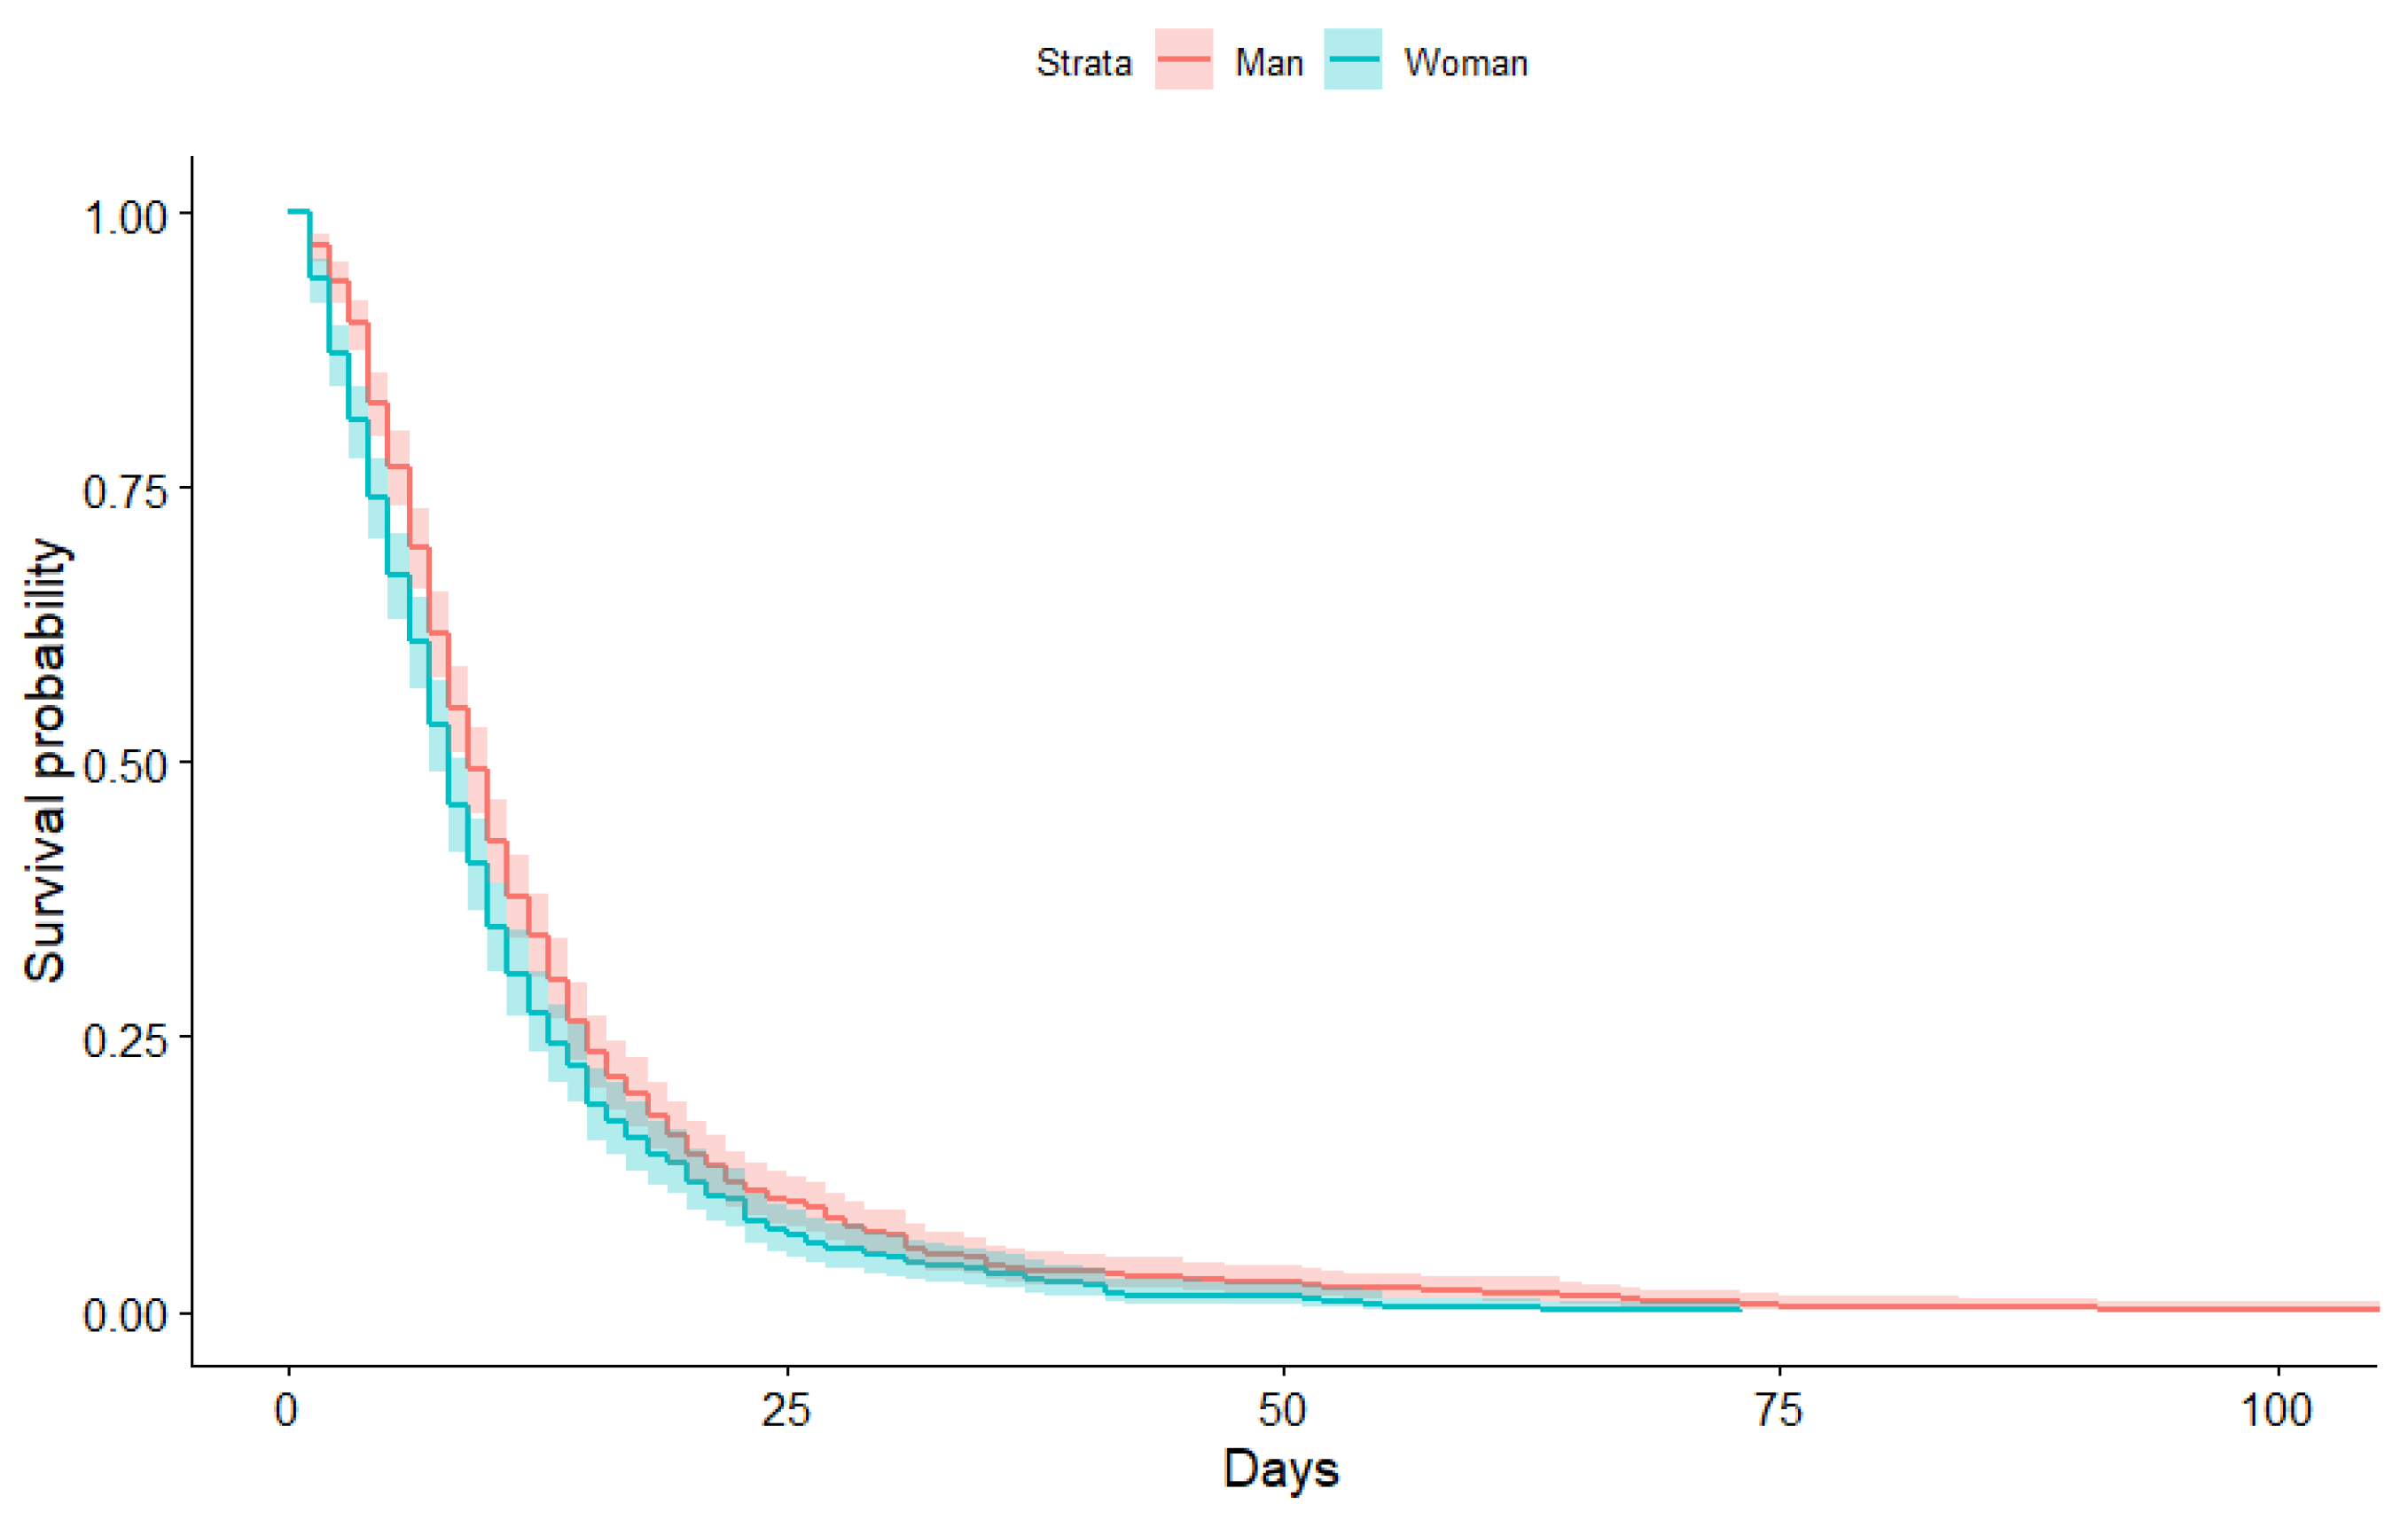





| Min. | 1st Qu. | Median | Mean | 3rd Qu. | Max | |
|---|---|---|---|---|---|---|
| Man | 1.00 | 6.00 | 9.00 | 12.75 | 15.00 | 107.00 |
| Woman | 1.00 | 4.00 | 8.00 | 10.64 | 13.00 | 73.00 |
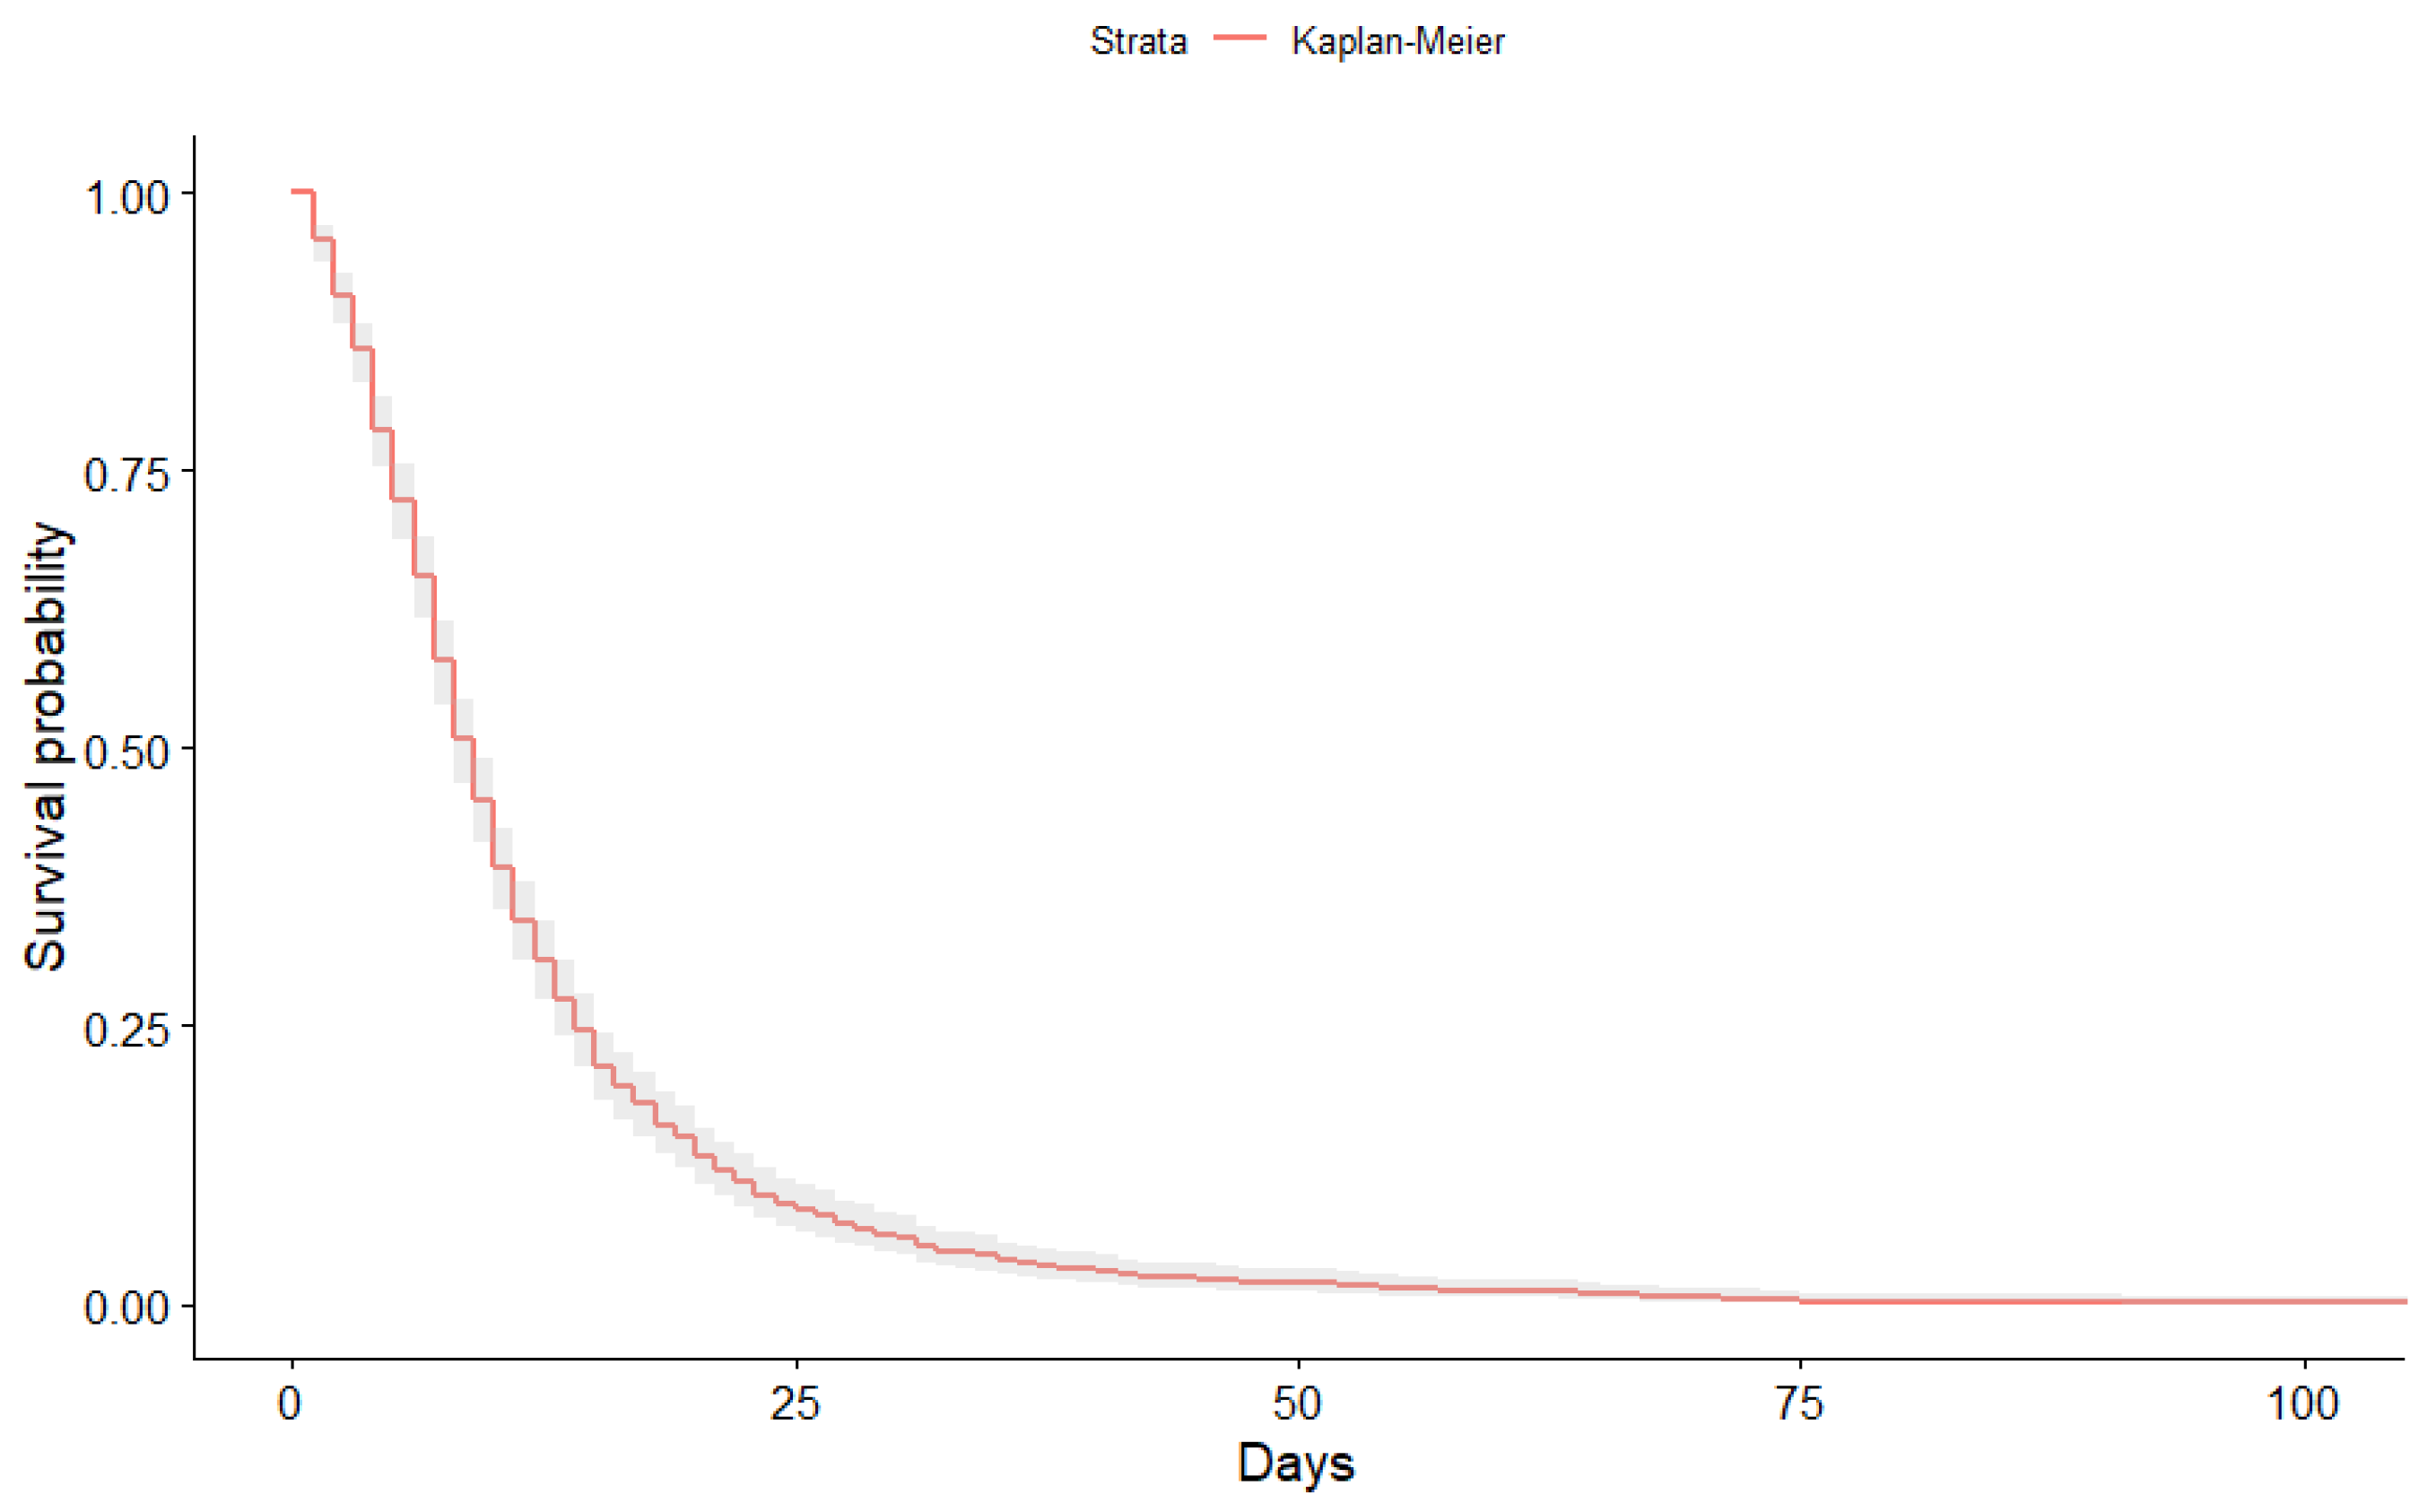
| Time | N.Risk | N.Event | Surv | Std.Err | Lower | Upper |
|---|---|---|---|---|---|---|
| 1 | 1159 | 50 | 0.96 | 0.01 | 0.94 | 0.97 |
| 2 | 1109 | 57 | 0.91 | 0.01 | 0.88 | 0.93 |
| 3 | 1052 | 57 | 0.86 | 0.01 | 0.83 | 0.88 |
| 4 | 995 | 83 | 0.79 | 0.02 | 0.75 | 0.82 |
| 5 | 912 | 74 | 0.72 | 0.02 | 0.69 | 0.76 |
| 6 | 838 | 79 | 0.65 | 0.02 | 0.62 | 0.69 |
| 7 | 759 | 89 | 0.58 | 0.03 | 0.54 | 0.61 |
| 8 | 670 | 82 | 0.51 | 0.03 | 0.47 | 0.54 |
| 9 | 588 | 63 | 0.45 | 0.03 | 0.41 | 0.49 |
| 10 | 525 | 71 | 0.39 | 0.04 | 0.35 | 0.43 |
| 11 | 454 | 55 | 0.34 | 0.04 | 0.31 | 0.38 |
| 12 | 399 | 40 | 0.31 | 0.04 | 0.28 | 0.34 |
| 13 | 359 | 41 | 0.27 | 0.05 | 0.24 | 0.31 |
| 14 | 318 | 34 | 0.25 | 0.05 | 0.21 | 0.28 |
| 15 | 284 | 37 | 0.21 | 0.06 | 0.18 | 0.24 |
| 16 | 247 | 21 | 0.19 | 0.06 | 0.17 | 0.23 |
| 17 | 226 | 18 | 0.18 | 0.06 | 0.15 | 0.21 |
| 18 | 208 | 21 | 0.16 | 0.07 | 0.13 | 0.19 |
| 19 | 187 | 14 | 0.15 | 0.07 | 0.12 | 0.18 |
| 20 | 173 | 20 | 0.13 | 0.08 | 0.11 | 0.16 |
| 21 | 153 | 14 | 0.12 | 0.08 | 0.10 | 0.15 |
| 22 | 139 | 11 | 0.11 | 0.08 | 0.09 | 0.14 |
| 23 | 128 | 15 | 0.10 | 0.09 | 0.08 | 0.12 |
| 24 | 113 | 10 | 0.09 | 0.09 | 0.07 | 0.11 |
| 25 | 103 | 5 | 0.08 | 0.10 | 0.07 | 0.11 |
| 26 | 98 | 6 | 0.08 | 0.10 | 0.06 | 0.10 |
| 27 | 92 | 9 | 0.07 | 0.11 | 0.05 | 0.09 |
| 28 | 83 | 4 | 0.07 | 0.11 | 0.05 | 0.09 |
| 29 | 79 | 7 | 0.06 | 0.11 | 0.05 | 0.08 |
| 30 | 72 | 3 | 0.06 | 0.12 | 0.04 | 0.08 |
| 31 | 69 | 9 | 0.05 | 0.13 | 0.04 | 0.07 |
| 32 | 60 | 5 | 0.05 | 0.13 | 0.03 | 0.07 |
| 33 | 55 | 1 | 0.05 | 0.13 | 0.03 | 0.06 |
| 34 | 54 | 3 | 0.04 | 0.14 | 0.03 | 0.06 |
| 35 | 51 | 6 | 0.04 | 0.15 | 0.03 | 0.06 |
| 36 | 45 | 3 | 0.04 | 0.15 | 0.02 | 0.05 |
| 37 | 42 | 3 | 0.03 | 0.16 | 0.02 | 0.05 |
| 38 | 39 | 2 | 0.03 | 0.16 | 0.02 | 0.05 |
| 39 | 37 | 1 | 0.03 | 0.16 | 0.02 | 0.05 |
| 40 | 36 | 1 | 0.03 | 0.17 | 0.02 | 0.05 |
| 41 | 35 | 5 | 0.03 | 0.18 | 0.02 | 0.04 |
| 42 | 30 | 2 | 0.02 | 0.19 | 0.01 | 0.04 |
| 45 | 28 | 2 | 0.02 | 0.19 | 0.01 | 0.04 |
| 46 | 26 | 1 | 0.02 | 0.20 | 0.01 | 0.03 |
| 47 | 25 | 2 | 0.02 | 0.21 | 0.01 | 0.03 |
| 51 | 23 | 2 | 0.02 | 0.22 | 0.01 | 0.03 |
| 52 | 21 | 2 | 0.02 | 0.23 | 0.01 | 0.03 |
| 53 | 19 | 1 | 0.02 | 0.23 | 0.01 | 0.03 |
| 54 | 18 | 1 | 0.01 | 0.24 | 0.01 | 0.03 |
| 55 | 17 | 2 | 0.01 | 0.26 | 0.01 | 0.02 |
| 57 | 15 | 1 | 0.01 | 0.27 | 0.01 | 0.02 |
| 60 | 14 | 1 | 0.01 | 0.28 | 0.01 | 0.02 |
| 63 | 13 | 1 | 0.01 | 0.29 | 0.00 | 0.02 |
| 64 | 12 | 2 | 0.01 | 0.31 | 0.00 | 0.02 |
| 65 | 10 | 1 | 0.01 | 0.33 | 0.00 | 0.02 |
| 67 | 9 | 1 | 0.01 | 0.35 | 0.00 | 0.02 |
| 68 | 8 | 1 | 0.01 | 0.38 | 0.00 | 0.01 |
| 71 | 7 | 1 | 0.01 | 0.41 | 0.00 | 0.01 |
| 73 | 6 | 2 | 0.00 | 0.50 | 0.00 | 0.01 |
| 75 | 4 | 1 | 0.00 | 0.58 | 0.00 | 0.01 |
| 84 | 3 | 1 | 0.00 | 0.71 | 0.00 | 0.01 |
| 91 | 2 | 1 | 0.00 | 1.00 | 0.00 | 0.01 |
| Time | N.Risk | N.Event | Surv | Std.Err | Lower | Upper |
|---|---|---|---|---|---|---|
| 1 | 75.00 | 6.00 | 0.92 | 0.03 | 0.79 | 0.97 |
| 2 | 69.00 | 3.00 | 0.88 | 0.04 | 0.74 | 0.95 |
| 3 | 66.00 | 2.00 | 0.85 | 0.05 | 0.71 | 0.93 |
| 4 | 64.00 | 4.00 | 0.80 | 0.06 | 0.65 | 0.89 |
| 5 | 60.00 | 4.00 | 0.75 | 0.07 | 0.59 | 0.85 |
| 6 | 56.00 | 1.00 | 0.73 | 0.07 | 0.58 | 0.84 |
| 7 | 55.00 | 2.00 | 0.71 | 0.07 | 0.55 | 0.82 |
| 8 | 53.00 | 3.00 | 0.67 | 0.08 | 0.51 | 0.79 |
| 9 | 50.00 | 1.00 | 0.65 | 0.08 | 0.49 | 0.77 |
| 11 | 49.00 | 4.00 | 0.60 | 0.09 | 0.44 | 0.73 |
| 12 | 45.00 | 1.00 | 0.59 | 0.10 | 0.43 | 0.72 |
| 13 | 44.00 | 3.00 | 0.55 | 0.11 | 0.39 | 0.68 |
| 14 | 41.00 | 5.00 | 0.48 | 0.12 | 0.33 | 0.62 |
| 16 | 36.00 | 2.00 | 0.45 | 0.13 | 0.30 | 0.59 |
| 18 | 34.00 | 4.00 | 0.40 | 0.14 | 0.26 | 0.54 |
| 19 | 30.00 | 3.00 | 0.36 | 0.15 | 0.22 | 0.50 |
| 21 | 27.00 | 2.00 | 0.33 | 0.16 | 0.20 | 0.47 |
| 22 | 25.00 | 3.00 | 0.29 | 0.18 | 0.17 | 0.43 |
| 23 | 22.00 | 1.00 | 0.28 | 0.19 | 0.16 | 0.42 |
| 25 | 21.00 | 1.00 | 0.27 | 0.19 | 0.15 | 0.40 |
| 26 | 20.00 | 1.00 | 0.25 | 0.20 | 0.14 | 0.39 |
| 27 | 19.00 | 1.00 | 0.24 | 0.21 | 0.13 | 0.37 |
| 28 | 18.00 | 1.00 | 0.23 | 0.21 | 0.12 | 0.36 |
| 30 | 17.00 | 1.00 | 0.21 | 0.22 | 0.11 | 0.34 |
| 32 | 16.00 | 1.00 | 0.20 | 0.23 | 0.10 | 0.33 |
| 33 | 15.00 | 2.00 | 0.17 | 0.25 | 0.08 | 0.30 |
| 34 | 13.00 | 1.00 | 0.16 | 0.26 | 0.07 | 0.28 |
| 35 | 12.00 | 1.00 | 0.15 | 0.28 | 0.06 | 0.27 |
| 37 | 11.00 | 1.00 | 0.13 | 0.29 | 0.05 | 0.25 |
| 38 | 10.00 | 1.00 | 0.12 | 0.31 | 0.05 | 0.23 |
| 39 | 9.00 | 1.00 | 0.11 | 0.33 | 0.04 | 0.22 |
| 43 | 8.00 | 1.00 | 0.09 | 0.36 | 0.03 | 0.20 |
| 44 | 7.00 | 1.00 | 0.08 | 0.39 | 0.02 | 0.18 |
| 47 | 6.00 | 1.00 | 0.07 | 0.43 | 0.02 | 0.17 |
| 49 | 5.00 | 1.00 | 0.05 | 0.49 | 0.01 | 0.15 |
| 78 | 4.00 | 1.00 | 0.04 | 0.57 | 0.01 | 0.13 |
| 83 | 3.00 | 1.00 | 0.03 | 0.70 | 0.00 | 0.11 |
| 84 | 2.00 | 1.00 | 0.01 | 0.99 | 0.00 | 0.09 |
Publisher’s Note: MDPI stays neutral with regard to jurisdictional claims in published maps and institutional affiliations. |
© 2021 by the authors. Licensee MDPI, Basel, Switzerland. This article is an open access article distributed under the terms and conditions of the Creative Commons Attribution (CC BY) license (https://creativecommons.org/licenses/by/4.0/).
Share and Cite
Calabuig, J.M.; Jiménez-Fernández, E.; Sánchez-Pérez, E.A.; Manzanares, S. Modeling Hospital Resource Management during the COVID-19 Pandemic: An Experimental Validation. Econometrics 2021, 9, 38. https://doi.org/10.3390/econometrics9040038
Calabuig JM, Jiménez-Fernández E, Sánchez-Pérez EA, Manzanares S. Modeling Hospital Resource Management during the COVID-19 Pandemic: An Experimental Validation. Econometrics. 2021; 9(4):38. https://doi.org/10.3390/econometrics9040038
Chicago/Turabian StyleCalabuig, J. M., E. Jiménez-Fernández, E. A. Sánchez-Pérez, and S. Manzanares. 2021. "Modeling Hospital Resource Management during the COVID-19 Pandemic: An Experimental Validation" Econometrics 9, no. 4: 38. https://doi.org/10.3390/econometrics9040038
APA StyleCalabuig, J. M., Jiménez-Fernández, E., Sánchez-Pérez, E. A., & Manzanares, S. (2021). Modeling Hospital Resource Management during the COVID-19 Pandemic: An Experimental Validation. Econometrics, 9(4), 38. https://doi.org/10.3390/econometrics9040038


