
Article

Jump Variation Estimation with Noisy High Frequency Financial Data via Wavelets
Department of Statistics, University of Wisconsin-Madison, Madison, WI 53706, USA
*
Author to whom correspondence should be addressed.
Econometrics 2016, 4(3), 34; https://doi.org/10.3390/econometrics4030034

Submission received: 29 February 2016 / Revised: 1 June 2016 / Accepted: 27 July 2016 / Published: 16 August 2016
(This article belongs to the Special Issue Financial High-Frequency Data)

Abstract

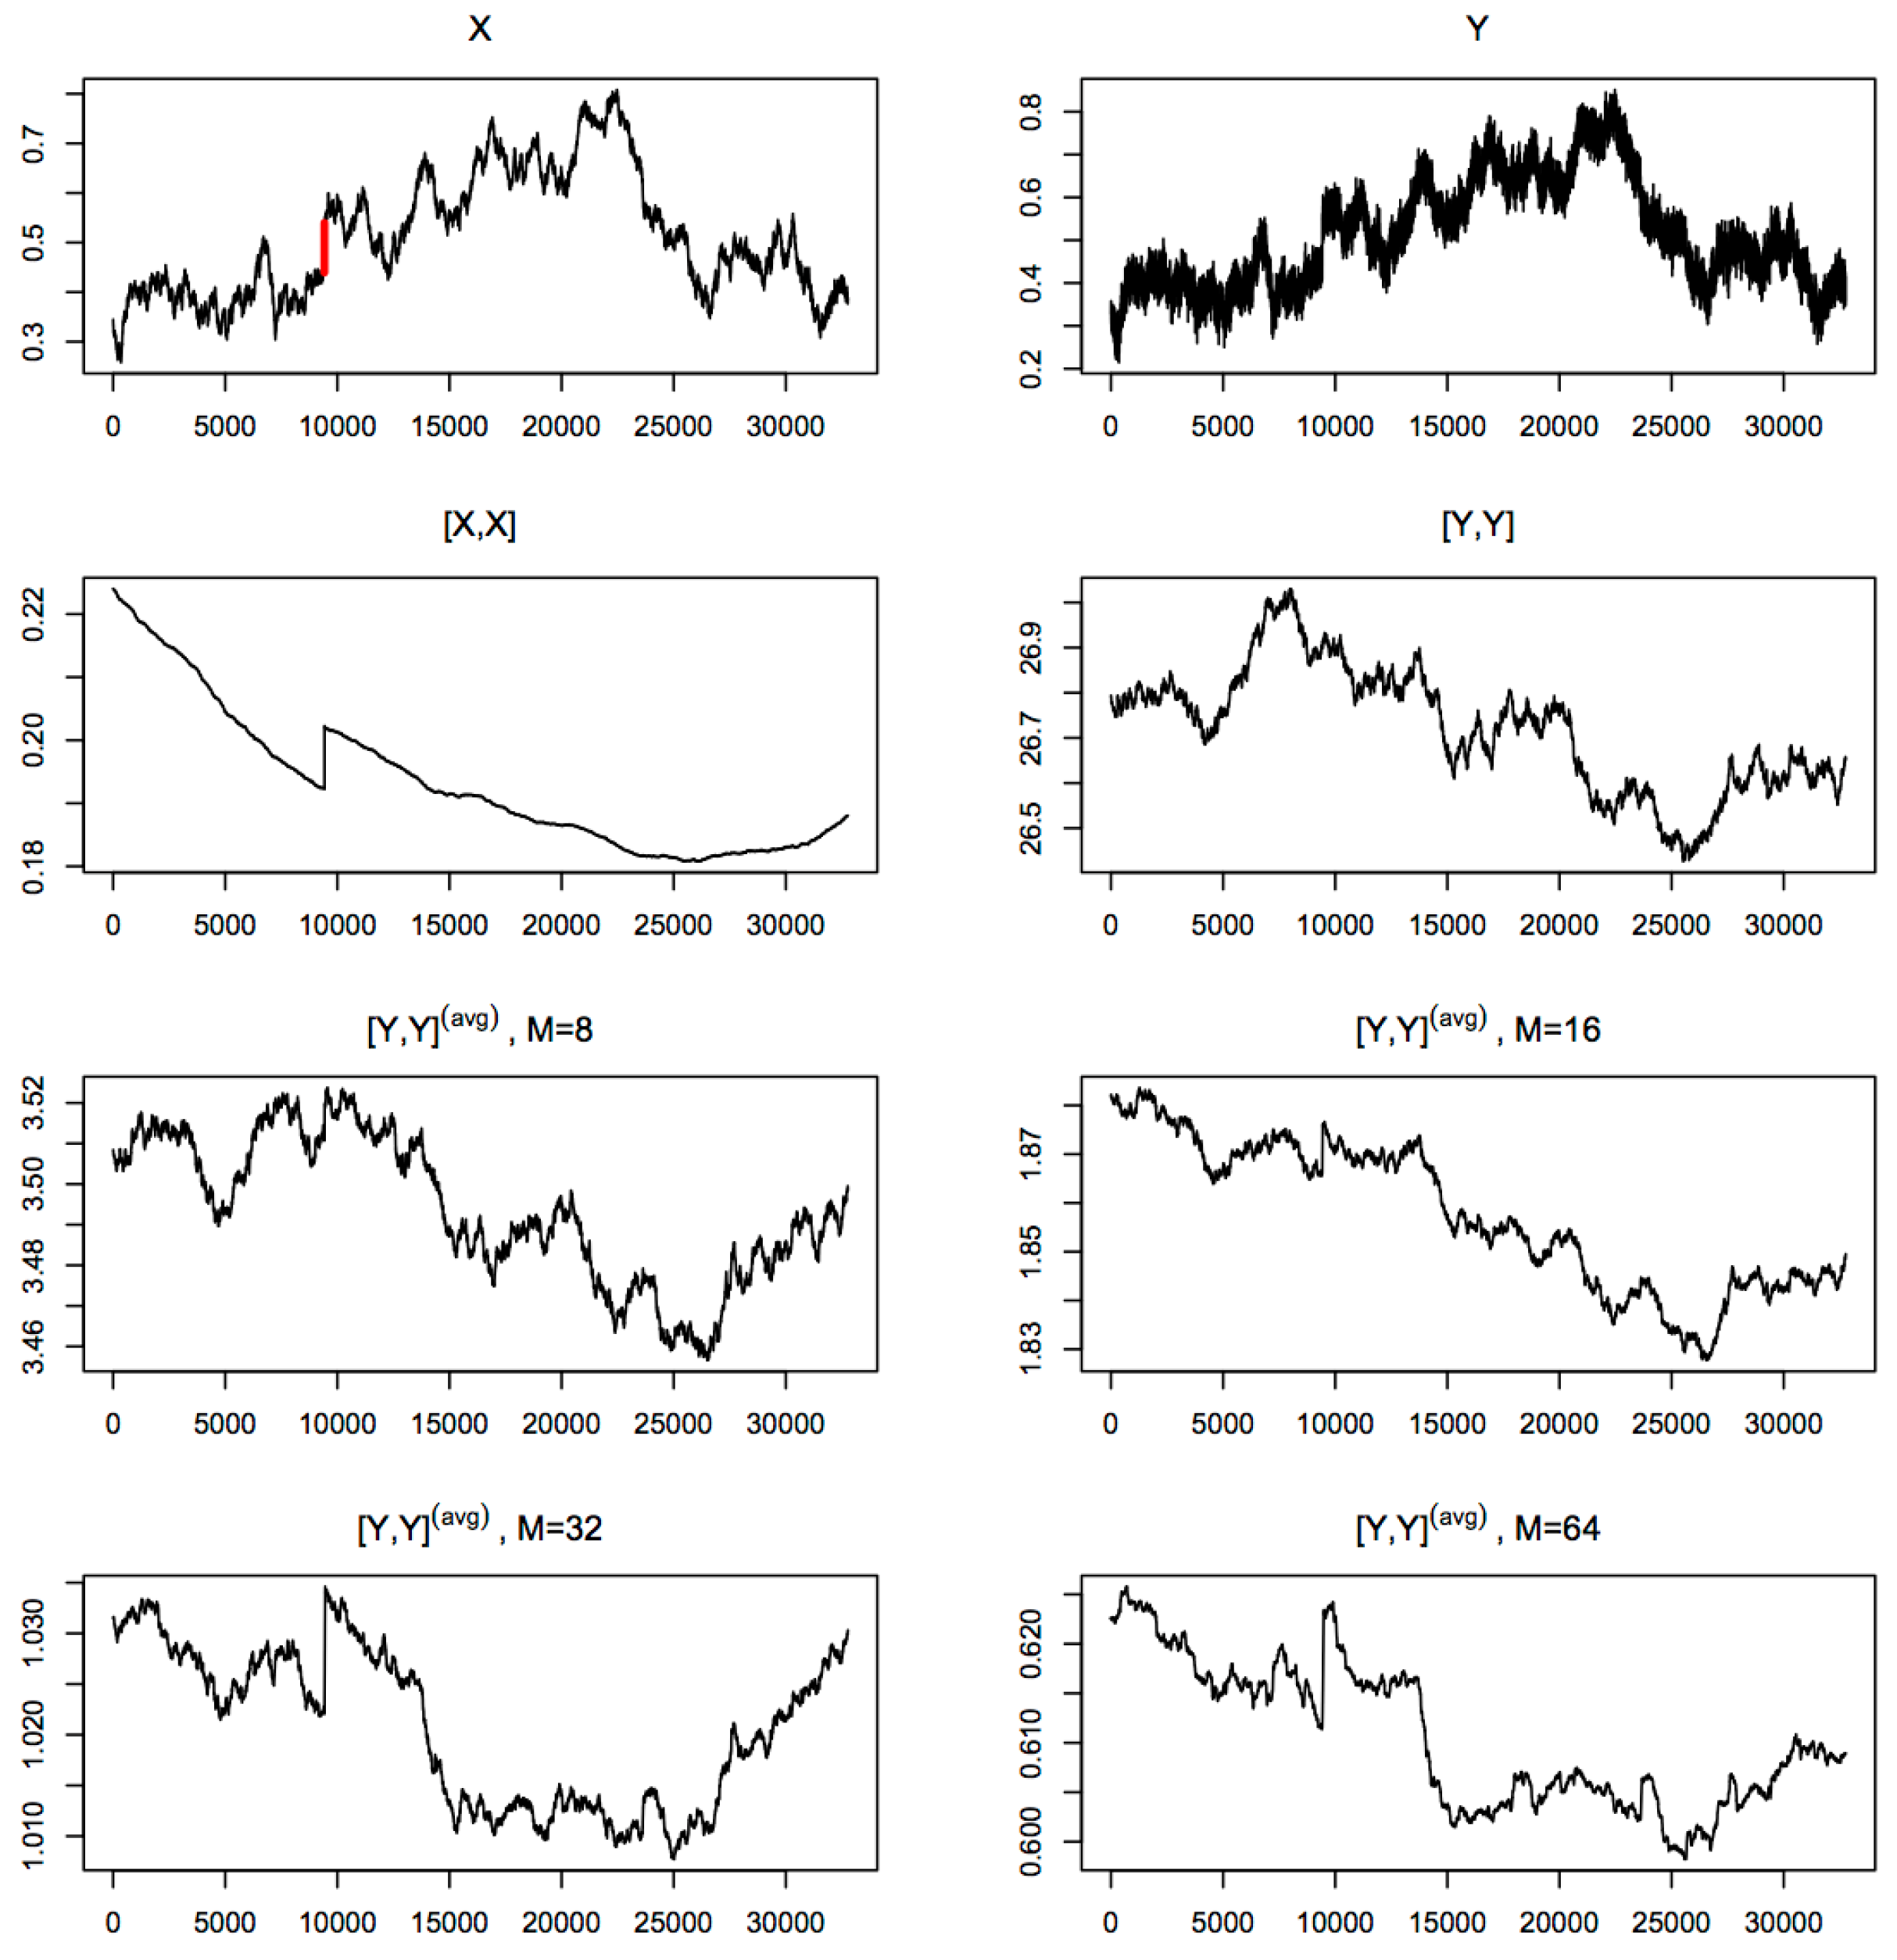
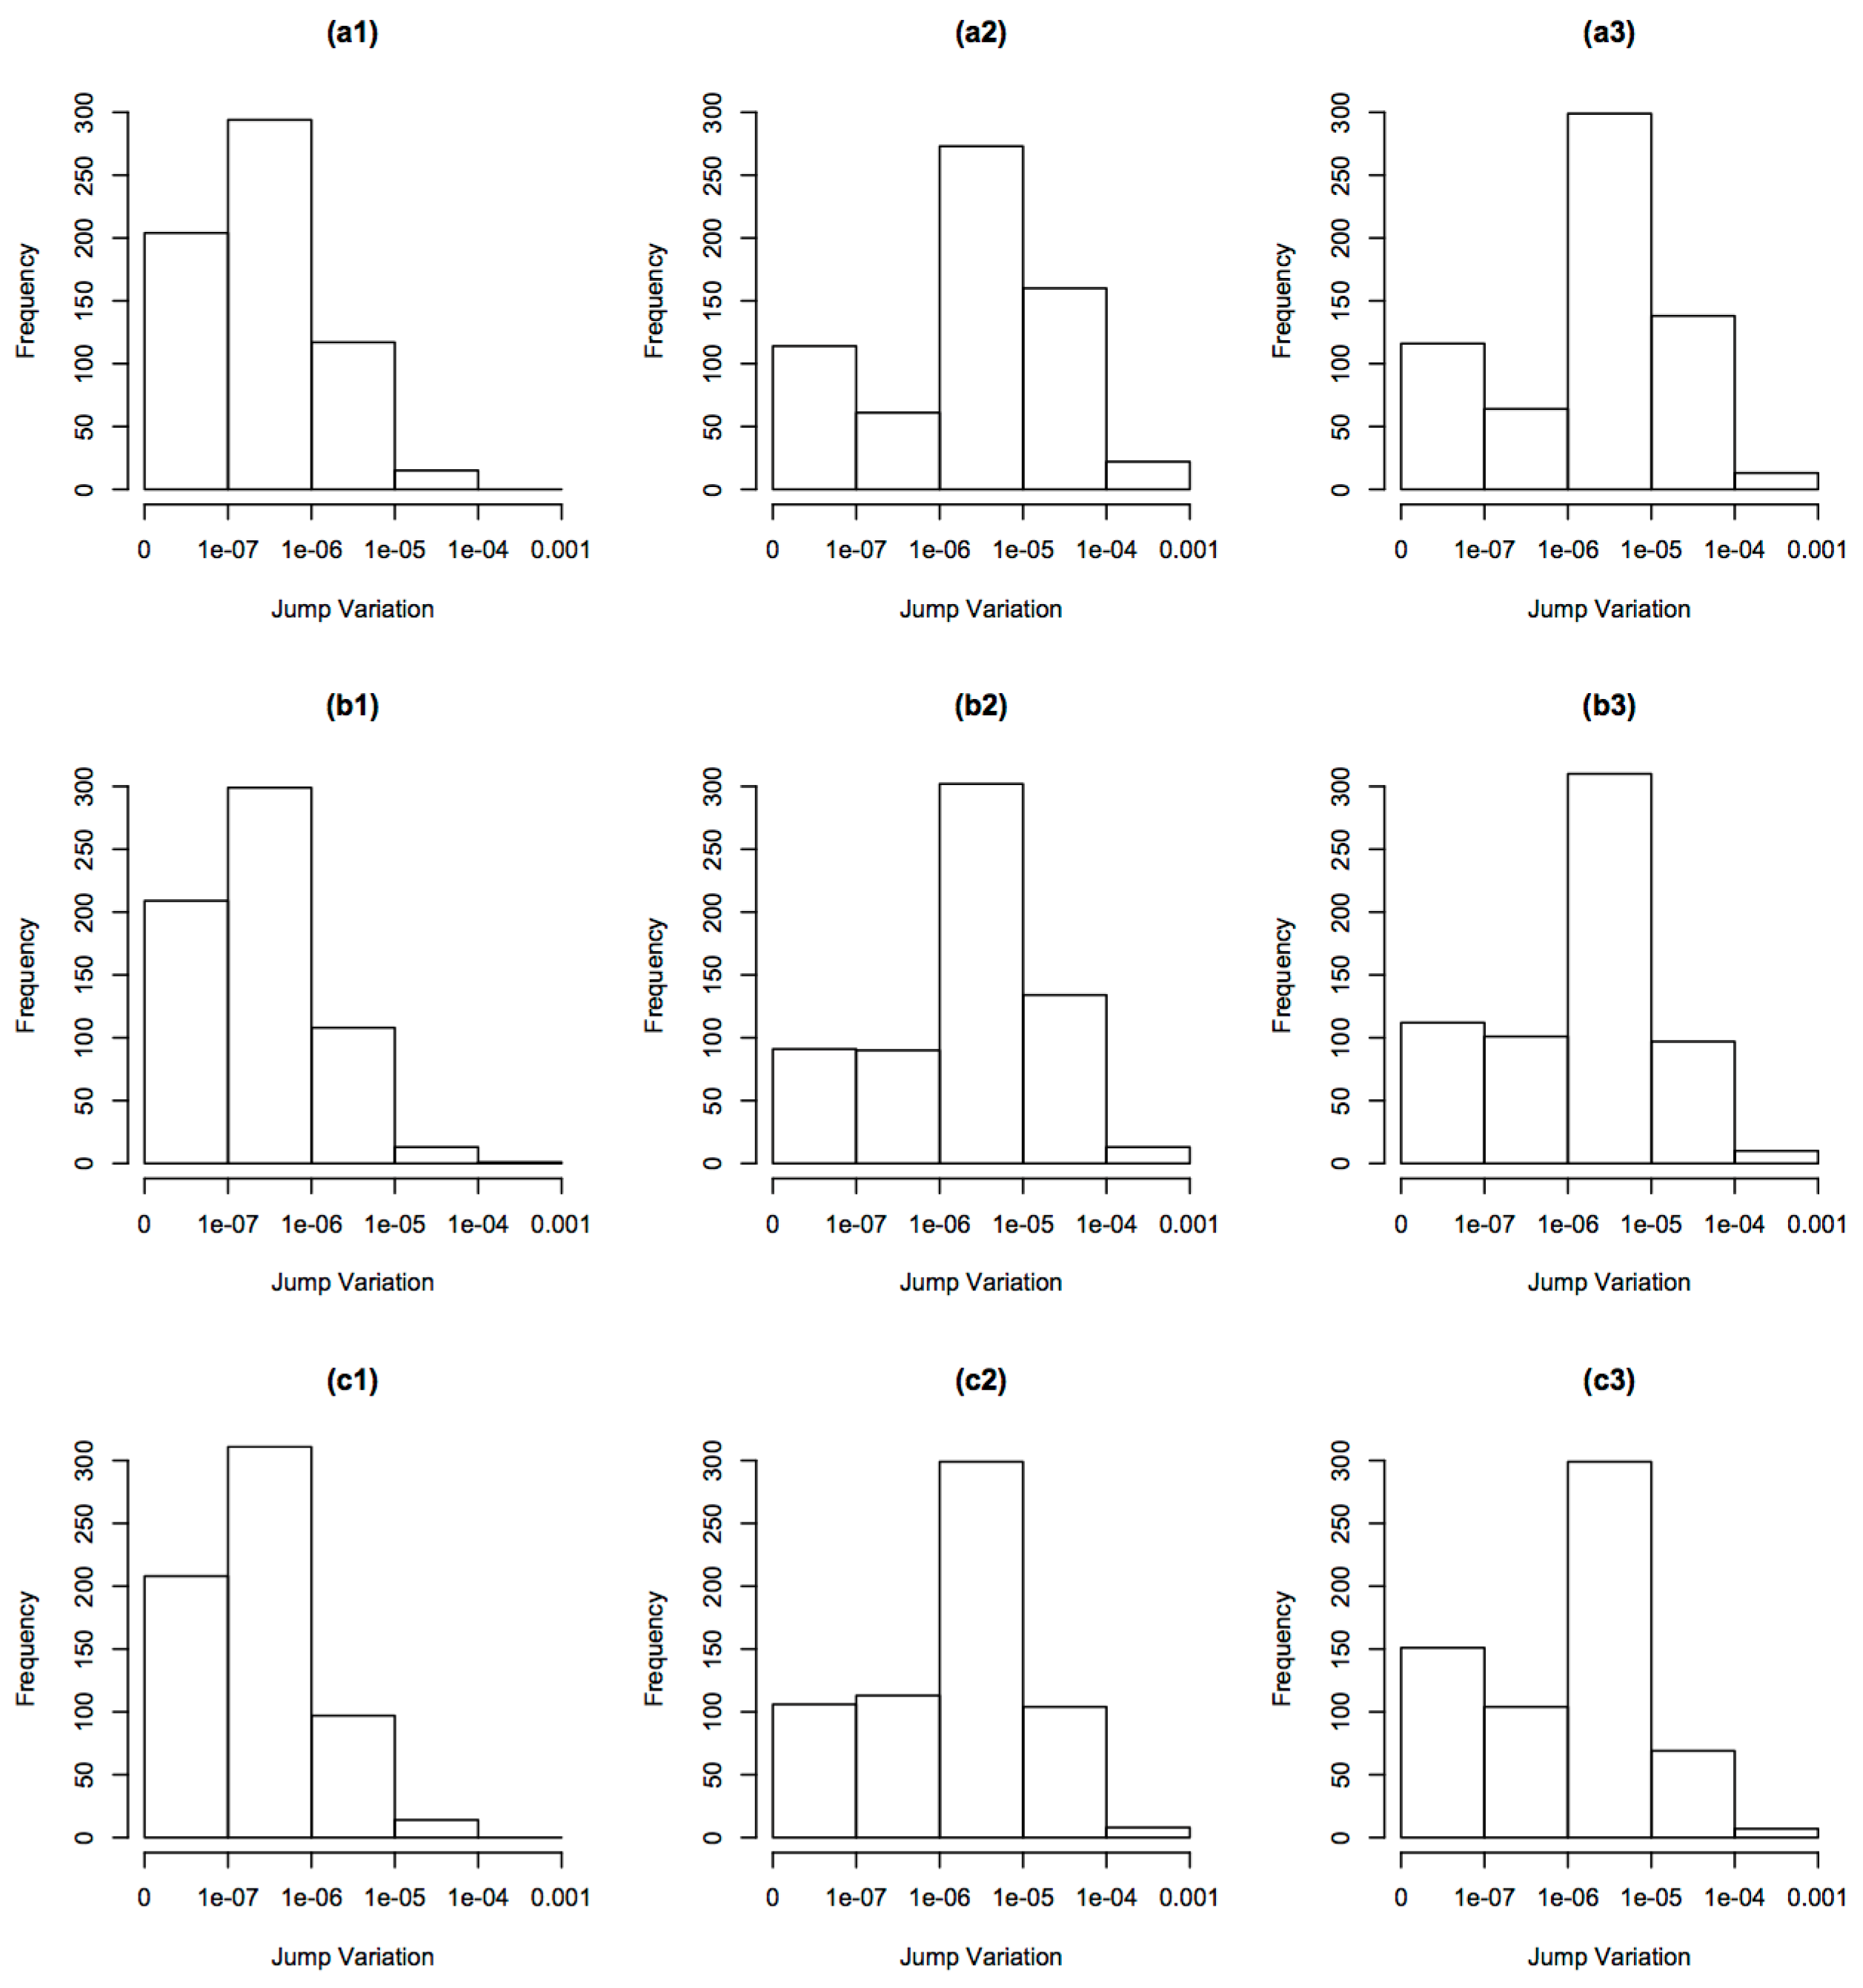
This paper develops a method to improve the estimation of jump variation using high frequency data with the existence of market microstructure noises. Accurate estimation of jump variation is in high demand, as it is an important component of volatility in finance for portfolio allocation, derivative pricing and risk management. The method has a two-step procedure with detection and estimation. In Step 1, we detect the jump locations by performing wavelet transformation on the observed noisy price processes. Since wavelet coefficients are significantly larger at the jump locations than the others, we calibrate the wavelet coefficients through a threshold and declare jump points if the absolute wavelet coefficients exceed the threshold. In Step 2 we estimate the jump variation by averaging noisy price processes at each side of a declared jump point and then taking the difference between the two averages of the jump point. Specifically, for each jump location detected in Step 1, we get two averages from the observed noisy price processes, one before the detected jump location and one after it, and then take their difference to estimate the jump variation. Theoretically, we show that the two-step procedure based on average realized volatility processes can achieve a convergence rate close to O P ( n 4 / 9 ) , which is better than the convergence rate O P ( n 1 / 4 ) for the procedure based on the original noisy process, where n is the sample size. Numerically, the method based on average realized volatility processes indeed performs better than that based on the price processes. Empirically, we study the distribution of jump variation using Dow Jones Industrial Average stocks and compare the results using the original price process and the average realized volatility processes.
Keywords: high frequency financial data; jump variation; realized volatility; integrated volatility; microstructure noise; wavelet methods; nonparametric methods high frequency financial data; jump variation; realized volatility; integrated volatility; microstructure noise; wavelet methods; nonparametric methods