
Article

Internationalization and Financing Decisions of Chinese Enterprises: Evidence from Hong Kong Listings

1
International College, Guangzhou College of Commerce, Guangzhou 511363, China
2
Department of Logistics and Maritime Studies, The Hong Kong Polytechnic University, Hung Hom, Kowloon, Hong Kong
*
Author to whom correspondence should be addressed.
Econometrics 2026, 14(2), 23; https://doi.org/10.3390/econometrics14020023
Submission received: 12 January 2026 / Revised: 8 April 2026 / Accepted: 29 April 2026 / Published: 7 May 2026

Abstract

This study explores the impact of internationalization on the financing decisions and finance costs of Chinese enterprises listed in Hong Kong, extending the pecking order theory to an international context. Utilizing data from 785 companies from 2010 to 2020, the research investigates how the degree of internationalization influences corporate finance strategies, with a focus on the mediating role of the pecking order and the moderating effects of international business factors. The findings reveal that while broader internationalization increases finance costs, deeper internationalization reduces them. Legal distance is found to negatively moderate this relationship, whereas the structure of the financial system positively influences it. The results suggest that multinational enterprises with extensive overseas resource allocation demonstrate greater flexibility in financing decisions, particularly in foreign markets characterized by strong investor protection and efficient direct finance mechanisms. Managers should be cautious about pursuing wide geographic expansion without adequate operating depth because a broad but shallow international presence may increase financing frictions. By contrast, deeper resource commitment abroad can strengthen financing flexibility and improve access to lower-cost funds, especially when institutional conditions in the financing market are favorable.

1. Introduction

Compared to local enterprises, the multinational enterprises (MNEs) face a dual dilemma: unfavorable conditions from their home country (Liability of Origin) (Ramachandran & Pant, 2010) and challenges as outsiders (Liability of Foreignness) (Zaheer, 1995). The MNEs have to decide where to invest (internationalization breadth) and how much to invest (internationalization depth), how to finance the internationalization, as well as examine the results from the decision-making of business internationalization and finance—financial costs. There is a lack of research to bridge international business and finance decision-making. The resource-based view and the institutional theory are commonly applied in studying internationalization and corporate finance. MNE’s international business influences the sourcing of internal and external finance (Kittilaksanawong, 2017; Dau et al., 2021). In a situation where the quality of the domestic institutional environment is significantly lower than that of overseas target markets, there are certain incentives for the cross-border development of the company’s financial resources (Çam & Özer, 2021). The existing resources can be transferred to markets with higher quality institutional environments by enhancing the internationalization degree, thereby expanding the development space for the company’s resource capabilities while also improving the protection of property rights (Boisot & Meyer, 2008).
Expanding business into overseas markets with a quality institution, the MNE’s risk profile becomes attractive to investors and banks with less legal distance in overseas financing markets. This ultimately enhances financial efficiency, cost savings, as well as financial resources and capabilities during the process of internationalization (Reeb et al., 2001; Sun et al., 2015). The selection of a financing strategy is a critical component of an MNE’s broader strategy to secure a competitive advantage from a funding perspective. Over time, the focus has evolved from merely planning and managing capital structure (Gehr, 1984; Sandberg et al., 1987; Simerly & Li, 2000) to achieving financing cost advantages (Randøy et al., 2001), pecking order of capital-structure change (Khan & Adom, 2015).
Financing strategies encompass internal financing as well as external debt and equity financing, with the pecking order theory elucidating the relationships among these financing options. Pecking order theory, initially proposed by Gordon Donaldson in his text book Corporate debt capacity: A study of corporate debt policy and the determination of corporate debt capacity for Harvard Business School, posits that firms prioritize their sources of financing based on the principle of least effort or resistance, preferring internal financing first, followed by debt, and finally equity as a last resort (Donaldson, 1961). This theory has been extensively studied and debated in various contexts, including international finance (Myers, 1984). The following previous studies examined the pecking order theory in the context of internationalization, considering firm-external contextual contingencies, financial crises, cross-border finance, control rights, shareholder structure, and transaction costs (Miller & Puthenpurackal, 2005; Seifert & Gonenç, 2010; Vitali et al., 2011; Eren et al., 2022).
The pecking order theory must consider firm-external contextual contingencies, such as international finance environments (Burlacu, 2000; Seifert & Gonenç, 2010). The firms with foreign equity listings have likely exhausted their debt options and moved down the pecking order to equity markets (Bessler et al., 2011). This suggested that the pecking order extends to the preferred currency denomination of financing, with firms opting for local currency debt first, followed by foreign currency debt, and finally local and foreign equity markets (Allayannis et al., 2003). The pecking order theory also extends to downstream issues such as transaction costs and finance costs (Bagley & Yaari, 1996). The literature has provided a quantitative framework for implementing the pecking order theory as a decision tool, highlighting the importance of dynamic factors in designing and interpreting empirical tests of static tradeoff theories (Bagley & Yaari, 1996).

2. Theoretical Background and Hypotheses

2.1. Internationalization Degree and Finance Costs

The literature suggests two competing views on how internationalization affects finance costs. On the one hand, international expansion can diversify cash flows, improve access to foreign capital, and enable firms to finance in markets with stronger investor protection or lower borrowing costs. Studies on multinational debt financing and international capital access argue that international firms may benefit from larger investor bases, currency matching, and improved debt-market conditions (Jang, 2017; Erel et al., 2023). On the other hand, internationalization can also increase organizational complexity, information asymmetry, agency conflicts, and the liability of foreignness, which may raise monitoring costs and the cost of capital (Brealey et al., 2014).
These competing arguments indicate that the effect of internationalization depends on how it is measured. Internationalization breadth captures the geographic spread of operations. A greater geographic spread may increase coordination costs and informational opacity because firms must manage more jurisdictions and regulatory environments(Chen et al., 1997; Joliet & Muller, 2013). By contrast, internationalization depth captures the extent to which overseas activities are embedded in the firm’s actual operations, such as the share of overseas sales or subsidiaries (Zaheer, 1995; Bell et al., 2012; Ige & Washington, 2023). Deeper engagement may generate learning effects, more stable foreign cash flows, and better alignment between foreign operations and foreign financing (Bagley & Yaari, 1996).
Accordingly, the literature supports two separate expectations. A broader but thinly embedded international footprint may raise finance costs, whereas deeper internationalization may lower them by improving resource allocation and financing flexibility (Chen et al., 1997; Joliet and Muller, 2013).
Hypothesis 1. 
The breadth of internationalization positively influences the financial costs.
Hypothesis 2. 
The depth of internationalization negatively influences the financial costs.

2.2. Pecking Order, Cross-Region Financing and Finance Costs

Pecking order theory predicts that firms prefer internal finance first, debt second, and equity last because financing choices differ in their information costs and ownership implications (Bagley & Yaari, 1996). In an international context, this logic extends beyond domestic markets because firms may sequence internal funds, domestic debt, foreign debt, and equity across jurisdictions in response to differences in information asymmetry, investor protection, and market access (Randøy et al., 2001).
Prior studies show that cross-border financing can reduce costs when firms access deeper capital pools or more competitive debt markets (Fotak et al., 2019; Özer & Çam, 2021). However, the same process can raise costs if investors perceive internationalized firms as more opaque or more difficult to monitor (Oxelheim, 1997). Therefore, pecking order is not merely a capital-structure choice; it is also a mechanism through which firms translate their internationalization profile into observable financing outcomes. If a firm is better able to follow a forward pecking order, it should generally face lower financing frictions and lower finance costs than a firm that relies more heavily on expensive external equity or reverse-order financing (Simerly & Li, 2000).
Hypothesis 3. 
The pecking-order choices positively influence the financial costs.

2.3. Internationalization Pecking-Order Choice

The literature on multinational financing suggests that internationalization changes the feasible set of financing options available to firms. Broader internationalization may enlarge the set of external financing markets but also increase informational complexity, which can weaken the firm’s ability to maintain a low-cost financing order. Deeper internationalization, by contrast, may improve the quality of internal signals sent to creditors and investors because overseas operations become more material, observable, and aligned with financing needs (Mansi & Reeb, 2002; Singh et al., 2003; Shapiro & Hanouna, 2019).
Combining the internationalization literature with the pecking order theory leads to a mechanism-based expectation. Internationalization breadth may push firms toward more complicated or less efficient financing sequences because geographic spread increases monitoring and contracting frictions (Lindner et al., 2018). Internationalization depth may instead support a more efficient pecking order because stronger overseas operating foundations improve financing capacity and signal quality (Akhtar & Oliver, 2009).
Hypothesis 4. 
The breadth of internationalization positively influences the choice of pecking order.
Hypothesis 5. 
The depth of internationalization negatively influences the choice of pecking order.

2.4. Institutional Moderators in Cross-Region Financing

The international business literature emphasizes that cross-border financing outcomes depend on institutional distance. Legal distance matters because firms from weaker institutional environments may need to bond themselves to stronger legal systems when raising funds abroad. Better investor protection and stronger enforcement can lower agency costs, but larger institutional gaps may also increase compliance and information costs. Enterprise’s internationalization encounters cross-border differences mostly in terms of legal distance and cultural distance (Berry et al., 2010; Beugelsdijk et al., 2018; Zámborský & Yan, 2022). Cultural distance refers to the differences in language, norms, and business practices between countries, which can complicate communication and increase the perceived risk of cross-region transactions. The measure of cultural distance is based on scores that reflect country averages of individuals’ attitudes towards inequality, self-orientation, competition, uncertainty, traditions, and indulgence (Harms & Shuvalova, 2020). Legal distance encompasses the variations in legal, regulatory, and governance frameworks across countries, which can affect the ease and cost of doing business internationally. The measure of legal distance is based on the methodology of Djankov, including the Investor Right Index and Creditor Right Index (Özer & Çam, 2021). These factors contribute to the overall information asymmetry that companies face when operating in foreign markets.
Financial system structure matters because market-oriented and bank-oriented systems differ in how they process information, allocate capital, and price risk. The differences in cross-region or cross-country financial system structures primarily stem from the heterogeneity of two predominant financial systems: (1) market-based systems, which are dominated by securities market financing, and (2) bank-based systems, which are dominated by bank loans. These differences arise from factors such as the historical development of financial institutions and markets, regulatory environments, and the relative importance of banks versus capital markets in providing financing (Baum et al., 2011). For instance, in market-based systems, companies may have greater access to equity financing and a more diverse set of financial instruments, whereas in bank-based systems, companies may rely more heavily on relationship banking and debt financing.
For Chinese enterprises listed in Hong Kong, legal distance and financial system differences between mainland China and Hong Kong may shape how internationalization translates into financing behavior and cost. When foreign institutional environments offer stronger investor protection and more efficient pricing, deeper internationalization may produce stronger financing advantages. When institutional distance increases the difficulty of contracting and information transmission, wider internationalization may become more costly.
Hypothesis 6. 
The legal distance between the two regions has a significant negative moderating effect on the relationship between the degree of internationalization and the choice of overseas bank networks.
Hypothesis 7. 
The difference in financial system structures between the two regions has a significant positive moderating effect on the relationship between the degree of internationalization and the choice of overseas bank networks.

2.5. Theoretical Framework

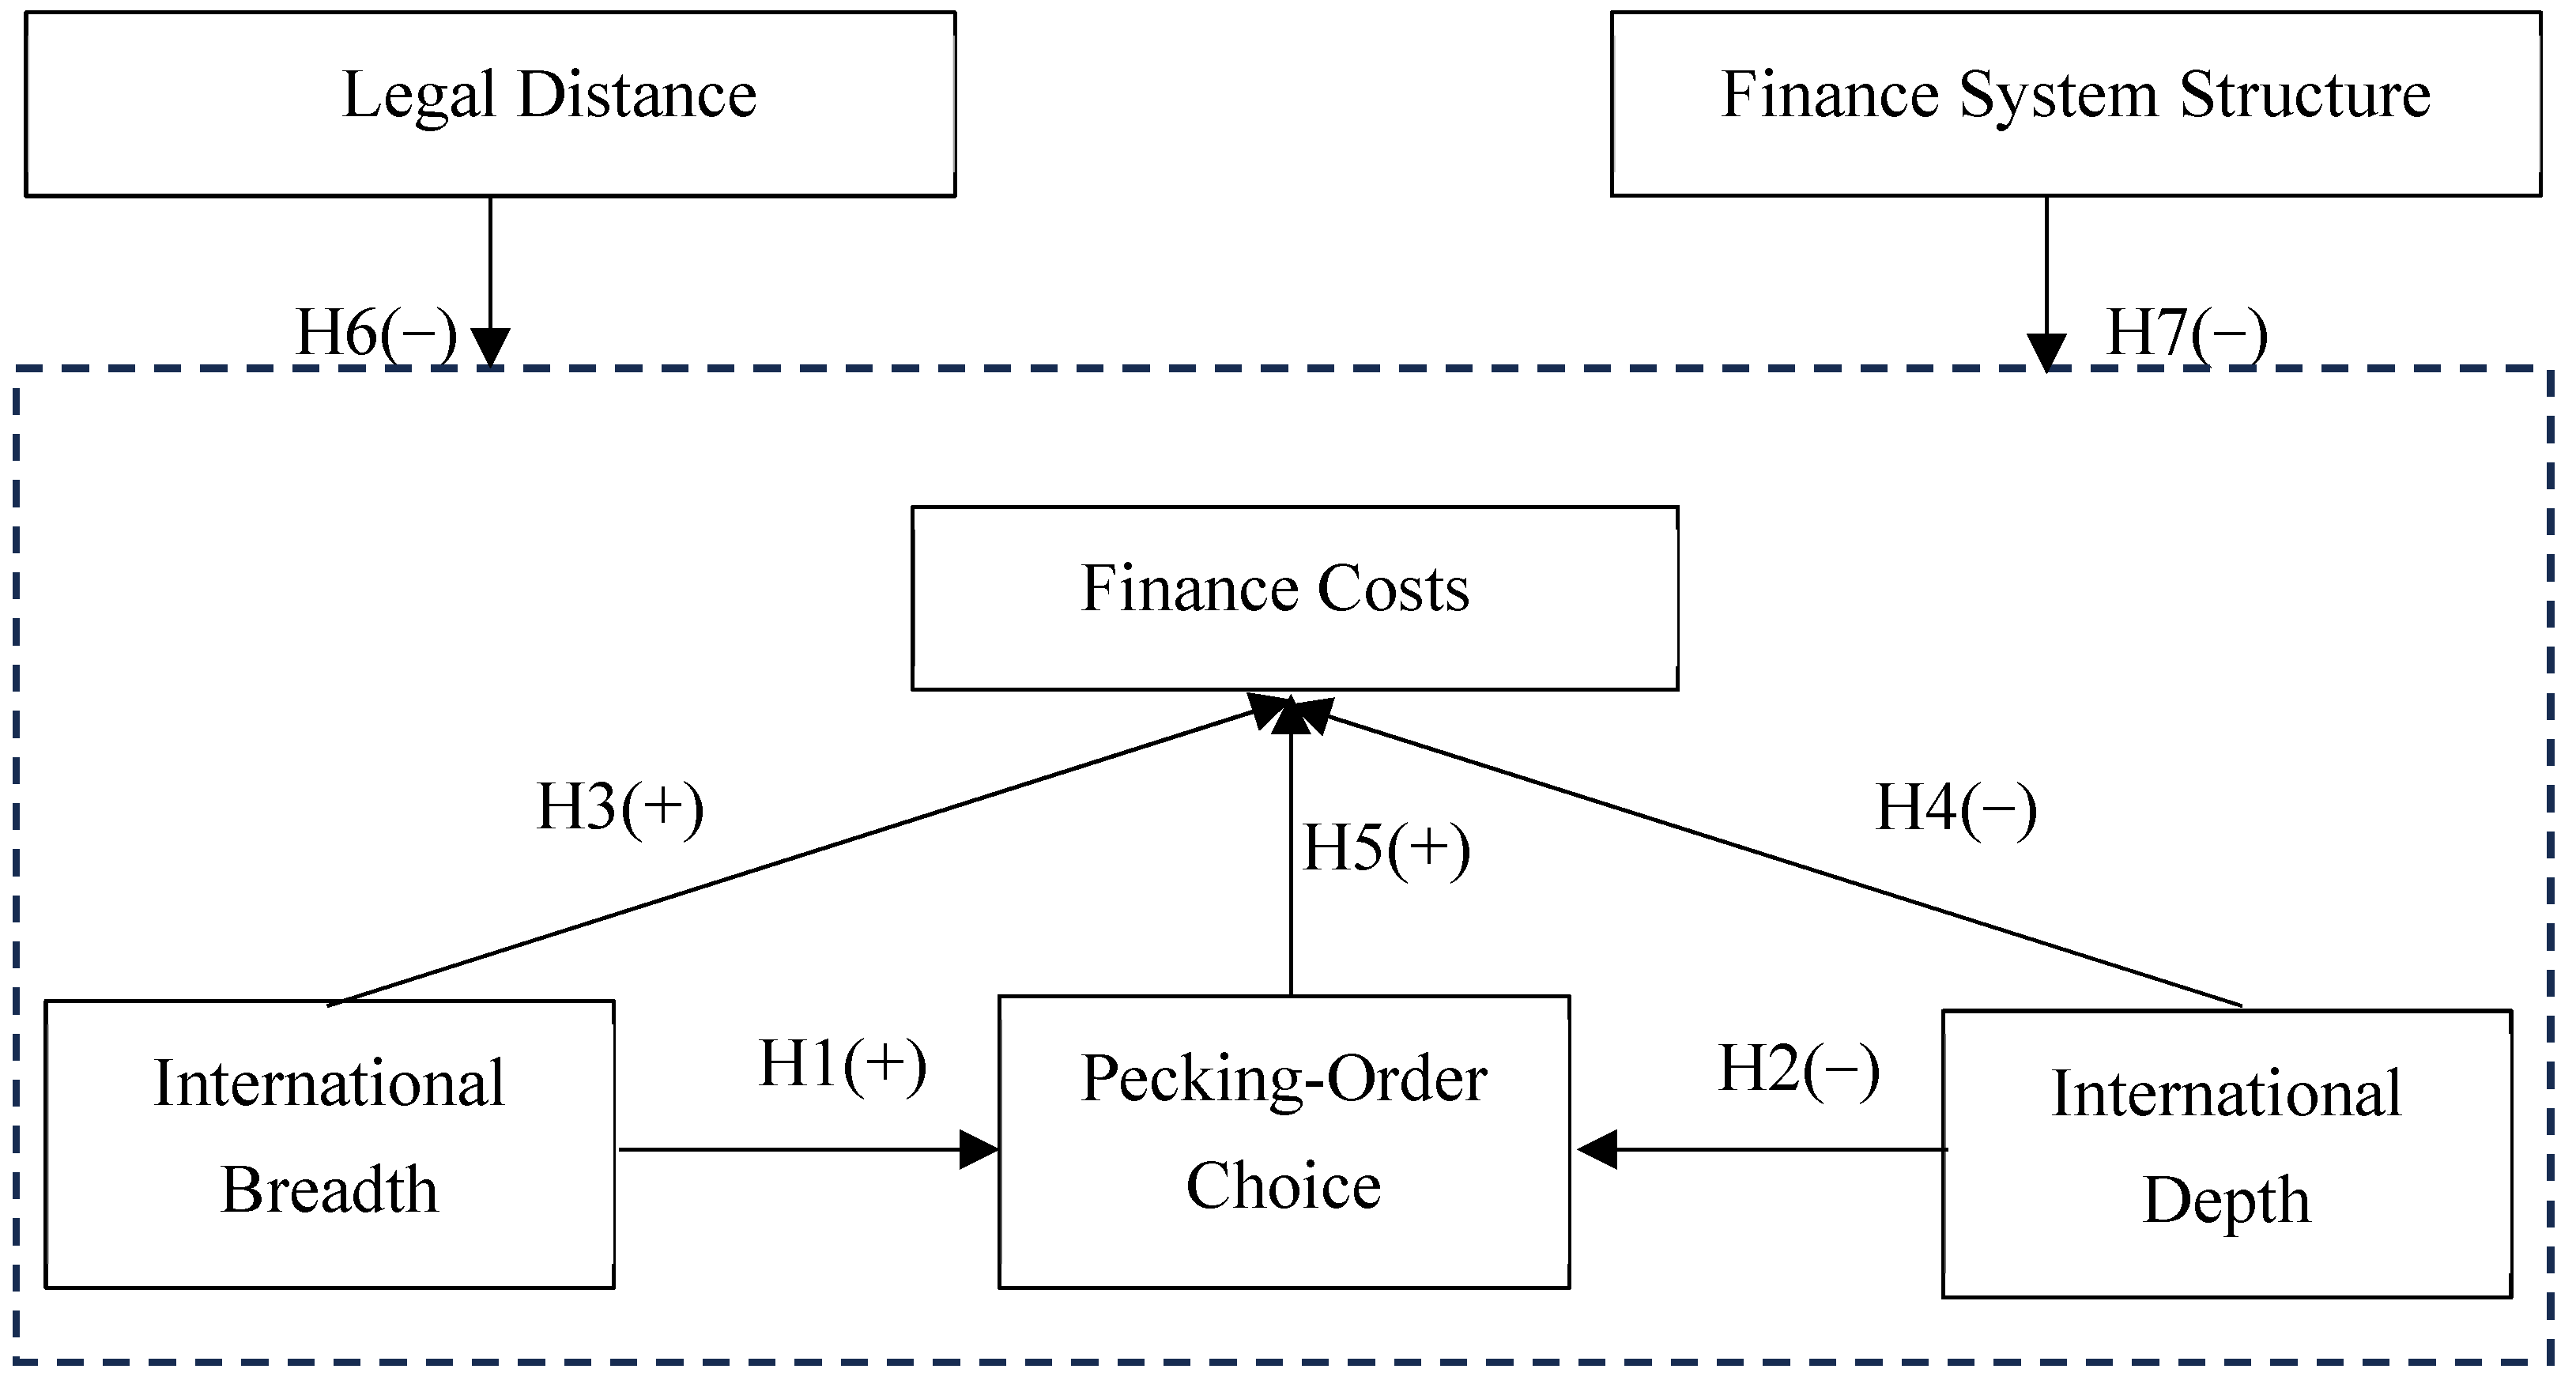
Figure 1 in the original draft presents the mechanism more clearly when interpreted through the integrated framework above. The literature review establishes the key building blocks: internationalization affects firm information environments and resource deployment; pecking order theory explains how firms sequence financing under information asymmetry; and institutional theory explains why legal distance and financial-system heterogeneity alter financing frictions. Together, these arguments imply a mediated-moderated framework in which internationalization breadth and depth influence finance costs both directly and indirectly through pecking-order choice, with institutional conditions shaping the strength of these relationships.

2.6. Contribution

This study makes several theoretical contributions to the intersection of international business and corporate finance. First, it integrates the degree of internationalization with pecking order theory and capital-structure research in a unified framework. Existing work often examines multinationality and capital structure separately, or focuses on the traditional forward pecking order within a single country. By distinguishing between internationalization breadth and depth and linking both to cross-region pecking-order choices and finance costs, this study clarifies how different patterns of international expansion translate into heterogeneous financing outcomes.
Second, the study extends the pecking order theory to a cross-region, bidirectional context. Classic pecking-order models emphasize a one-directional sequence from internal funds to debt and then to equity. This research explicitly incorporates both forward and reverse pecking-order choices and treats pecking order as a vector of cross-border financing sequences rather than a single static ranking. By showing how internationalization can promote reverse or partially reverse pecking-order behavior through changes in information frictions, agency problems, and wealth constraints, the study enriches the theoretical understanding of dynamic financing order in multinational settings.
Third, the study bridges the institutional-distance literature with firm-level financing decisions by modeling legal distance and financial system structure differences as moderating factors in the relationship between internationalization, pecking-order choice, and finance costs. Prior research typically treats institutional distance or financial structure as background variables affecting entry mode or aggregate capital flows. This paper embeds these macro-institutional factors directly into the financing mechanism of Chinese firms listed in Hong Kong, demonstrating that stronger investor protection and more market-oriented financial systems not only shape access to overseas finance but also condition the cost implications of internationalization breadth and depth.
Fourth, the study links internationalization strategy to finance costs via an explicit mediated-moderated mechanism. Rather than assuming a direct effect from internationalization to firm performance or cost of capital, the analysis identifies cross-region pecking-order and bank-network choices as key mediators and shows how they transmit the impact of internationalization to subsequent-year finance costs. Legal distance and financial-system heterogeneity further moderate these mediation paths. This mechanism-based approach contributes to theory by explaining why and when internationalization raises or lowers finance costs, moving beyond simple linear multinationality-performance or multinationality-leverage relationships.
Finally, by focusing on Chinese non-financial enterprises listed in Hong Kong, the study contributes context-sensitive evidence to theories of liability of origin and liability of foreignness in capital markets. It shows how firms from an emerging institutional environment use internationalization depth, cross-region financing order, and host-market institutional advantages to partially offset their origin-related disadvantages and optimize their cost of capital. This adds nuance to existing theories that often treat emerging-market multinationals as homogeneous and underscores the importance of financing strategy in realizing the benefits of international expansion.

3. Data and Methodology

This section outlines the process of filtering qualified samples according to the econometric statistical principles, constructing models based on the research hypotheses, and explaining the measurement of variables. It also provides descriptive statistics for the main variables. Initially, qualified samples are filtered according to the mathematical statistical principles. Subsequently, based on the research hypotheses, test models are constructed to measure, test, and explain the relationships between variables. t-tests are performed on the breadth and depth of internationalization to assess the impact of the degree of internationalization on cross-region pecking order and cross-region banking networks.

3.1. Sample Selection

This study selects all listed Chinese non-financial companies that maintained their listing status between 2010 and 2020. Data for these samples have been collected from three primary aspects:
1. Static data of sample companies
Following the sample design of De Jong et al. (2010) and Lee et al. (1996), the static data of sample companies include listing codes, company names, industry codes, shareholder information, annual financial data, and their converted financial indicators. Additionally, operational data from annual reports are included, such as the distribution of domestic and foreign institutions, geographical distribution of sales revenue and assets, and geographical distribution of shareholders (Lee et al., 1996; De Jong et al., 2010).
2. Transaction data of sample companies
The transaction data of public financing for sample companies encompass the syndicated loans, public debt issuance (including ordinary bonds, convertible bonds, and exchangeable bonds issued by listed companies), and public equity financing (including ordinary shares, preferred shares, and warrants issued by listed companies). Following Daude and Kadapakkam, the transaction data of the sample include transaction amount, time, lead bank, and lead bank market share ranking (Daude & Fratzscher, 2008; Kadapakkam et al., 2016).
3. Macro data on distances
(1) Data on Investor Protection Differences between Mainland China and Hong Kong. This study uses the Investor Protection Index by Djankov et al. (2007) and Özer and Çam (2021), employing the sum of differences in sovereign ratings for mainland China and Hong Kong from Standard & Poor’s, Moody’s, and Fitch as an indicator of the financial system structure differences between mainland China and Hong Kong (Djankov et al., 2007; Özer & Çam, 2021) to analyze market reactions.
(2) Financial System Structure Differences between Mainland China and Hong Kong. There are notable differences between mainland China and Hong Kong in terms of the proportion of debt financing to equity financing. This study adopts Baum et al. (2011) and Allen et al. (2018)’s definition of financial system structure, which is defined as the ratio of accumulated debt and equity financing amounts to GDP over the year (Baum et al., 2011; Allen et al., 2018).
Based on the above screening criteria, this study ultimately obtained an unbalanced panel data sample of Chinese non-financial companies listed in Hong Kong from 2010 to 2020, comprising a total of 785 companies and 5215 observations, covering six major industries (see Table 1 and Table 2). Among these, 395 companies (2621 observations) had overseas income, while 390 companies (2594 observations) had no overseas income. Additionally, 781 companies (5187 observations) had overseas institutions, whereas four companies (28 observations) had no overseas institutions.

3.2. Model Construction

Currently, the most common research on financing decisions in academia uses the Ordinary Least Squares (OLS) model. In the main model, this study adopts a multiple regression model and, to mitigate the impact of heteroscedasticity, following the practices of existing scholars (Stulz, 2010; Özer & Çam, 2021), all regression models are estimated using robust standard errors. Based on the research hypotheses of this study, the following two models are to be tested:
PeckOrderi,t = β0 + β1 InternationalBreadthi,t + β2 InternationalDepthi,t +
β3 LegalDistancet + β4 CulturalDistancet + β5 FinanceSystemStructuret +
β6 Controli,t + εi,t
In the above equation, PeckOrderi,t is the explained variable of pecking-order choice, representing the cross-region pecking order of the i-th Chinese non-financial company in year t. This study first tests the pecking-order choice based on the accounting statement data as the explained variable, and then replaces it with the pecking-order choice based on market transaction data for robustness testing.
InternationalBreadthi,t and InternationalDepthi,t, represent the breadth and depth of internationalization, respectively. Correspondingly, β1 and β2 measure the impact of the breadth and depth of internationalization on the choice of pecking order and banking-network selection, respectively.
The three moderating variables are: LegalDistancet (legal distance between the two regions in year t), CulturalDistancet (cultural distance between the two regions in year t), FinanceSystemStructuret (difference in financial system structures between the two regions in year t). Correspondingly, β3, β4, and β5 in the equation measure the effects of legal distance, cultural distance, and differences in financial system structures on the relationship between internationalization degree and the choice of financing pecking order and bank networks, respectively.
The control variable Controli,t represents all control variables of the i-th Chinese non-financial company in year t. εi,t is the random disturbance term.

3.3. Variable Description

3.3.1. Dependent Variable: Finance Choice

In line with standard corporate finance, this study uses the firm’s weighted average cost of capital (WACC) as a proxy for overall financing costs. WACC aggregates the required returns on debt and equity into a single measure of the firm’s cost of capital. The prior literature frequently employs WACC or closely related firm-level cost-of-capital measures when examining how financing conditions affect investment and firm value (Bagley & Yaari, 1996; Frank & Goyal, 2003).

3.3.2. Independent Variables: Internationalization Degree

Based on past research, a company’s degree of internationalization can be divided into the breadth of internationalization (Breadthi,t) and the depth of internationalization (Depthi,t) (Sullivan, 1994; Velez-Calle et al., 2018; Batsakis & Theoharakis, 2021). Representative indicators for measuring the breadth of a company’s internationalization include the number of overseas subsidiaries (NOS) and the number of countries in which subsidiaries are located (NOC). Representative indicators for measuring the depth of a company’s internationalization include the ratio of overseas sales to total sales (FSTS), the proportion of overseas subsidiaries to the total number of subsidiaries (OSTS), the proportion of overseas assets to total assets (FATA), and the proportion of overseas employees to the total number of employees (FETE). Based on data availability and the actual needs of this research, this study selects NOS and NOC to measure the breadth of a company’s internationalization and FSTS and OSTS to measure the depth of a company’s internationalization. The raw data for the breadth and depth of internationalization come from publicly available information of listed companies.

3.3.3. Mediating Variable: Pecking-Order Choice

The pecking order of listed companies is a comprehensive translation of the financing sequence and direction involved in this study of the pecking order theory. As early as 1984, Myers synthesized the relationship between a company’s various financing options into a problem of sequence and direction (Myers & Majluf, 1984): in most cases, it is a sequence and direction problem from internally generated cash flows (accounting for 62%) to debt financing (30%), and then to equity financing (6%); out-of-order and reverse problems are in the minority. This study defines the forward pecking order as a progression from internal financing to debt financing and finally to equity financing. Therefore, the dependent variable for hypotheses H1 and H2 in this study is a dummy variable, with a value of 1 for the forward pecking order, 0 for the reverse pecking order, and partially reverse pecking order (e.g., from equity financing to debt financing, or debt financing to internal financing). The specific measurement method is as follows:
The financing data of listed companies involved in the pecking order can come from two aspects: annual reports and public financing transaction data. Although public financing transaction data does not include data on bilateral loans with banks, there is no autocorrelation problem with accounting statement data. This study attempts to verify the relationship between pecking-order choice and the breadth and depth of internationalization using both annual report data and transaction data as the pecking-order choice to increase the robustness of the test.
First, this study tests the pecking-order choice based on the statement approach as the dependent variable. In the following situation, the value of the dependent variable is 1, and 0 in other cases:
Earnings before interest and taxes (EBIT) are greater than or equal to the net increase in debt financing, and the net increase in debt financing is greater than or equal to the net increase in equity financing.
Here, internal financing or internally generated cash flow is EBIT, i.e., earnings before interest and taxes. Debt financing is the increase in debt during the accounting statement period. Following Myers’ research, financing is mainly for capital expenditure, the net increase in debt financing is the increase in long-term debt, and equity financing is the net increase in equity financing during the accounting statement period (Myers & Majluf, 1984).
Furthermore, this study conducts a robustness test using the pecking-order choice based on the market transaction approach as the dependent variable. In the following situation, the value of the dependent variable is 1, and 0 in other cases:
Earnings before interest and taxes are greater than or equal to the amount of public debt financing, and the amount of public debt financing is greater than or equal to the amount of equity financing.
Since there is no market transaction for internal financing, EBIT, i.e., earnings before interest and taxes, is still used. Public debt financing includes syndicated loans and public debt issuance financing. Equity debt financing refers to IPOs and equity issuance records in the stock market.

3.3.4. Moderating Variables

(1) Legal distance. The institutional characteristics systemically affected sovereign ratings (Mohapatra et al., 2018). Stronger creditor rights and better enforcement substitute for major contractual protection and legal environment (Qi et al., 2011). So this study adopts measuring the legal distance between two regions using the difference in investor protection indices. Specifically, the measurement involves summing the rating differences for mainland China and Hong Kong as provided by three international rating agencies: Standard & Poor’s, Moody’s, and Fitch (Chui et al., 2016).
(2) Cultural distance. To measure cultural distance, this study utilizes the methodology proposed by Harms and Shuvalova (2020), which employs the Inglehart-Welzel World Cultural Map generated through the World Values Survey (WVS) method. This approach calculates the cultural indices differences between mainland China and Hong Kong’s cultural indices (Harms & Shuvalova, 2020). The cultural distance is assessed annually to account for any temporal variations in cultural alignment between the two regions.
(3) Finance system structure difference. This study refers to Allen and Gale’s (2000) classification of financial system structures into market-oriented and bank-oriented systems. The financial system structure difference is calculated by determining the ratio of total market value to total loan amount for both mainland China and Hong Kong (Allen & Gale, 2000). The difference between these two ratios serves as the value for the financial system structure difference, which is used to test the samples for each year. This measure helps to understand how the structural differences in financial systems influence cross-region financing decisions.

3.3.5. Control Variables

According to existing research, a company’s cross-region financing decisions are influenced by its internal factors and the macroeconomic factors of the financing market in which it operates. Therefore, this study controls for several variables to isolate the effects of these factors. The control variables include:
  • Company market capitalization (reflects the overall size of the company);
  • Total liabilities (indicates the company’s debt burden);
  • Annual public financing amount (the sum of net public equity financing, net public bond financing, and net syndicated loan financing);
  • Price-to-book ratio (measures the market valuation relative to the book value);
  • Gearing ratio (indicates the proportion of debt in the company’s capital structure);
  • Changes in short-term borrowings (capture the fluctuations in short-term debt);
  • Changes in working capital (reflect changes in the company’s operational liquidity);
  • Changes in shareholders’ equity (indicate changes in the ownership structure);
  • The number and proportion of international investors (which reflects the extent of foreign investment in the company).
The purpose of these control variables is to account for the effects of company size, financing scale, stock price volatility, leverage level, short-term fund changes, and changes in shareholder composition. Except for market capitalization and annual public financing amount data, which are sourced from Bloomberg and Reuters terminals, data for other control variables are obtained from publicly available financial reports of listed companies.

3.4. Data Sources

3.4.1. Static and Transaction Data of Sample Companies

To compile a sample of Chinese non-financial enterprises listed in Hong Kong, this study utilizes data from Bloomberg and Refinitiv terminals. The sample includes companies headquartered in China and listed on the Hong Kong Stock Exchange, maintaining their listing status from 2010 to 2020. The total sample size over these 11 years is 5215 observations. Each sample first includes 21 financial data items for the respective year, all of which have been directly downloaded from the Bloomberg and Refinitiv terminals.
Additionally, the Bloomberg and Refinitiv terminals have been used to search for records of public financing transactions for these companies from 2010 to 2020, including syndicated loans, public bond issuances, and IPOs. These public financing transaction data are then merged with the companies’ financial data to create a comprehensive dataset.

3.4.2. Legal Distance Data Between Mainland China and Hong Kong

The Refinitiv terminal has been employed to query the annual ratings of mainland China and Hong Kong from 2010 to 2020 by three international rating agencies: Standard & Poor’s, Moody’s, and Fitch. The sum of the differences in ratings for each year is used as the indicator of legal distance between the two regions for that year.

3.4.3. Cultural Distance Data Between Mainland China and Hong Kong

This study utilizes data from The Inglehart-Welzel World Cultural Map to measure cultural distance between mainland China and Hong Kong. The data can be accessed at The Inglehart-Welzel World Cultural Map: https://www.worldvaluessurvey.org/WVSContents.jsp, accessed on 13 January 2026 (WVS trend 1981–2022).

3.4.4. Financial System Structure Difference Data Between Mainland China and Hong Kong

The financial system structure difference data for mainland China and Hong Kong are downloaded from Refinitiv and related government websites. The total market value of A-shares in mainland China and the Hong Kong Stock Exchange is obtained from the Refinitiv terminal. The total loan amounts for mainland China and Hong Kong are sourced from the People’s Bank of China (https://www.pbc.gov.cn/, accessed on 13 January 2026) and the Hong Kong Monetary Authority (https://www.hkma.gov.hk/, accessed on 13 January 2026), respectively.
Finally, the sample company data are linked with the financial system structure difference parameters, legal distance index, and cultural distance by year, ensuring that each sample data set includes these three macro indicators for the respective year.

3.5. Descriptive Statistical Analysis

The panel data comprises a short panel, containing 785 sample companies and 11 years of data. Among these, 32.6% of the sample companies were listed for less than 5 years between 2010 and 2020, while the remaining 67.4% had at least 5 years of data. Except for 304 companies whose major shareholders were all from mainland China (excluding Hong Kong, Macau, and Taiwan), 4911 companies had foreign shareholders holding 0.01% or more of their shares between 2010 and 2020. Table 3 presents the descriptive statistics for the main variables. (To limit the influence of extreme observations on inference, the analysis applies winsorization before estimation and relies on robust estimation procedures.)
Table 4 reports the correlation coefficients between pecking-order choice, banking-network choice, and the breadth and depth of internationalization, along with control variables. The absolute values of these coefficients are all less than 0.5, preliminarily ruling out severe multicollinearity issues.
Furthermore, for all explanatory variables and control variables, this study employs the multivariate linear regression method to diagnose the variance inflation factor (VIF). The results in Table 5 show that the average VIF value between the explanatory variables and control variables is 1.13, with a maximum value of 1.40, indicating no obvious multicollinearity issues.

4. Findings and Implications

The empirical analysis is structured as follows: Initially, we examine the direct impact of internationalization breadth and internationalization depth on finance costs, as well as the indirect effects mediated through the choice of pecking order. Subsequently, we conduct robustness checks and endogeneity tests on the relevant regression results. Given that the independent variables of internationalization breadth (NOS, NOC) are left-truncated data with a minimum value of 0, and internationalization depth (FSTS, OSTS) are restricted variables between 0 and 1, with many observations having NOS, NOC equal to 0 and FSTS, OSTS equal to 0, we use Tobit regression to obtain unbiased and consistent estimates for this data structure. Therefore, this study continues to use Tobit regression for hypothesis testing. Prior to the analysis, winsorization has been performed to ensure the consistency and effectiveness of model estimation (Flannery & Rangan, 2006). Additionally, the following procedures have been conducted to ensure the validity and consistency of model testing:
(1) Wooldridge test and cluster-robust standard errors: Employed at the 1% level to address panel data serial correlation. (2) Mitigating multicollinearity: All independent variables and moderating variables have been standardized, and random effects regression has been performed with cluster-robust standard errors, followed by an over-identification test. The results have rejected the random effects model, suggesting the use of a fixed effects model with cluster-robust standard errors. (3) Addressing heteroscedasticity, time effects, and cross-sectional correlation: Cluster-robust standard errors have been adopted, and STATA 17.0 software has been used for fixed effects model analysis.

4.1. Mechanism of Internationalization Degree Influencing Finance Costs

This section primarily examines the relationship between internationalization, as mediated by cross-border financing decisions, and subsequent-year finance costs. The baseline model and its subsequent models have adopted Stata’s linear fixed-effect estimator with the following structure:
Xtreg y x1 x2 x3 … i.year, fe vce(cluster firm_id)
Specific empirical results are presented below. Table 6 presents the regression analysis results of the relationship between pecking order and corporate resource capabilities. Based on the concept of the pecking order—prioritizing internal financing, followed by external debt financing, and lastly, external equity financing—the forward pecking order is defined as the company’s current-year internal financing (earnings before interest and taxes, EBIT) being no less than the net debt financing, and the net debt financing being no less than the net equity financing. EBIT is uniformly obtained from the company’s annual reports. Net debt financing and net equity financing each have two data sources: annual reports and market transactions.
Annual Report Source: Net debt financing and net equity financing are, respectively, the net increase/decrease in long-term liabilities and the net increase/decrease in shareholders’ equity in the balance sheet.
Market Transaction Data: Net debt financing is the total amount of syndicated loans and bonds issued in the current year; net equity financing is the total amount of equity financing conducted through the market in the current year.
In this paper, we first employ the statement-based cross-border pecking-order choice as the independent variable in the primary model, and then conduct robustness tests by replacing the statement-based cross-border pecking-order choice with the market-based cross-border pecking-order choice.
In Table 6 below, Model (1) is the baseline model, including all moderating and control variables. Models (2) through (4) are advanced models built upon Model (1), with the addition of the independent variables internationalization breadth (NOC) and internationalization depth (OSTS), and the mediating variable cross-border pecking-order choice (PeckOrder), respectively. The verification analysis is performed based on Models (2) through (4), and the results are as follows:
1. Model (2), built on Model (1) and incorporating lagged effects, reveals that the dependent variable financing cost (FINANCECOST) is positively affected by the independent variable lagged internationalization breadth (L.NOC) (beta = 0.1390, p < 0.1) and negatively affected by lagged internationalization depth (L.OSTS) (beta = −43.1510, p < 0.01). Hypotheses H1 and H2 are thus supported. Additionally, legal distance has a significant negative impact on the relationship between the internationalization degree and finance costs (beta = −0.5046, p < 0.01), and structural differences in the financial system have a significant negative impact on the relationship between the internationalization degree and finance costs (beta = −0.2072, p < 0.01). Therefore, H6 and H7 are preliminarily supported.
2. Model (3), built on Model (1), reveals that the dependent variable financing cost (FINANCECOST) is negatively affected by the cross-border pecking-order choice costs (PeckOrder) (beta = −0.6419, p < 0.01), reflecting the significant impact of the pecking-order choice on the finance costs. Then, H5 is also supported.
3. Model (4), built on Model (1) and incorporating lagged effects, reveals that the mediating variable lagged cross-border pecking-order choice (L.PeckOrder) is negatively affected by the independent variable lagged internationalization breadth (L.NOC) (beta = −0.0195, p < 0.05) and negatively affected by lagged internationalization depth (L.OSTS) (beta = −7.9745, p < 0.01), reflecting the significant impact of the internationalization degree on the mediating variable cross-border pecking-order choice.
4. Model (5), built on Models (2) through (5), further reveals that the dependent variable (FINANCECOST) is positively affected by the independent variable lagged internationalization breadth (L.NOC) (beta = 0.1434, p < 0.05), and negatively affected by lagged internationalization depth (L.OSTS) (beta = −43.025, p < 0.01), as well as lagged cross-border pecking-order choice (L.PeckOrder) (beta = 1.1087, p < 0.1). Additionally, legal distance has a significant negative impact on the relationship between the internationalization degree, as mediated by cross-border pecking-order choice, and finance costs (beta = −0.4960, p < 0.01), and structural differences in the financial system have a significant negative impact on the relationship between the internationalization degree, as mediated by cross-border pecking-order choice, and finance costs (beta = −0.2107, p < 0.01). Model (5) comprehensively reflects that the internationalization degree has a significant effect on finance costs through the mediating effect of pecking-order choice, and that the negative moderating effects of legal distance and financial system structure differences are significant.

4.2. Robustness Tests

Although the empirical results indicate that the breadth and depth of internationalization significantly influence finance costs, this correlation may be affected by firm-specific factors, comparison bias, or inappropriate indicator selection. To address these potential issues, this study conducts robustness tests by substituting the mediating variable, adding control measurement variables, and adopting alternative regression methods to examine endogeneity.
1. Robustness test—substituting the mediating variable
To ensure the robustness of our findings, we substitute market-based pecking-order selection with statement-based pecking-order selection as the mediating variable. In Table 7, Model (1) serves as the baseline model, incorporating all control variables. Models (2), (4), and (5) were built upon Model (1) by adding internationalization breadth (NOC) and internationalization depth (OSTS) as independent variables, respectively. Model (3) was also built on Model (1) by market-based pecking-order choice (PeckOrder).
The results of Model (5) demonstrate that internationalization breadth (NOC) (beta = 0.1434, p < 0.05), internationalization depth (OSTS) (beta = −43.025, p < 0.01) and pecking-order choice (PeckOrder) (beta = 1.1087, p < 0.1) are significantly influencing the finance costs (FinanceCosts). These findings indicate that even after substituting the dependent variable measurement, the results of this study remain robust.
Additionally, the moderating effects of legal distance and finance system structure differences also exhibit strong robustness. This further validates the consistency and reliability of our empirical results, reinforcing the conclusion that both the breadth and depth of internationalization significantly impact pecking-order choices in cross-region financing decisions.
2. Robustness test—adding control varialbes
Given that state-owned enterprises (SOEs) typically receive more protection (Pessarossi & Weill, 2013; Fotak, 2016), we introduce a dummy variable for state ownership as a control variable. This addition aims to exclude the influence of company attributes on the regression results, thereby enhancing the reliability of the findings. After incorporating this control variable, Table 8 presents the test results: the relationships between internationalization breadth (NOC), internationalization depth (OSTS), and the finance costs (FinanceCosts) remain significantly correlated respectively. This consistency demonstrates the robustness of the findings.
3. Robustness test—substituting the regression model
This paper employs the Sobel test to examine whether there is a mediating effect between the internationalization degree, the choice of pecking-order and finance costs. Also, this paper off-loads moderators to focus on the robustness test. After changing the testing method, the impact of internationalization degree on finance costs through the pecking-order choice is consistent with the previous results. Therefore, the Table 9 presents the hypotheses H1 to H7 still hold, and the conclusion is highly robust.

5. Results

Following the preceding analysis, the mechanism through which a company’s internationalization degree influences its finance costs in the subsequent year can be discerned. To this end, this paper selects 785 Chinese non-financial enterprises listed on the Main Board of the Hong Kong Stock Exchange between 2010 and 2020 as the research sample. The research results show that, on the one hand, the internationalization breadth indicator NOC has a positive direct effect on finance costs, and the internationalization depth indicator OSTS has a negative direct effect on finance costs, while legal distance and financial system structure differences have a significant negative moderating effect on this relationship. On the other hand, the internationalization breadth and the internationalization depth have a mediating positive effect on finance costs through the choice of pecking order, and the moderating effect of legal distance and financial system structure differences remains significant in negatively influencing the relationship. Finally, to enhance the robustness and persuasiveness of the research conclusions in this paper, all hypotheses were verified.

6. Discussion

Rather than treating internationalization, financing order, and institutional conditions as separate topics, the manuscript now presents them as an integrated mechanism. This improves the logical progression from the prior literature to theory, from theory to hypotheses, and from hypotheses to empirical testing.
The findings also have practical implications. Managers should be cautious about pursuing wide geographic expansion without adequate operating depth because a broad but shallow international presence may increase financing frictions. By contrast, deeper resource commitment abroad can strengthen financing flexibility and improve access to lower-cost funds, especially when institutional conditions in the financing market are favorable.

7. Conclusions

Using Chinese non-financial enterprises listed in Hong Kong, this study shows that internationalization breadth and depth have distinct financing consequences. Breadth increases subsequent finance costs, whereas depth reduces them. Cross-region pecking-order choice partially mediates these relationships, and legal distance and financial system structure differences materially shape the financing outcomes. By understanding these dynamics, companies can better navigate the challenges of international finance, optimize their internationalization strategy, and enhance their overall business performance.

8. Limitations and Future Research

This study focuses on Chinese non-financial enterprises listed in Hong Kong over the period 2010–2020. The sample period, therefore, excludes the years in which the COVID-19 pandemic had a substantial impact on the economies of mainland China and Hong Kong, particularly 2021–2023. Financial results of listed firms for 2021–2024, which may reflect pandemic-related shocks and subsequent adjustments, are outside the scope of the present analysis and are left for future research.
Consequently, the firm-level financial results used in this paper do not incorporate post-COVID developments; the effects of the pandemic on internationalization, financing decisions, and finance costs will be examined in subsequent work.

Author Contributions

Conceptualization, P.L.; methodology, P.L.; formal analysis, P.L.; investigation, P.L.; data curation, P.L.; writing—original draft preparation, P.L.; writing—review and editing, P.L.; review and supervision, T.L.Y. All authors have read and agreed to the published version of the manuscript.

Funding

This research received no external funding.

Institutional Review Board Statement

Not applicable.

Informed Consent Statement

Not applicable.

Data Availability Statement

The data presented in this study are available and accessible in the terminals of Bloomberg and Reuters.

Conflicts of Interest

The authors declare no conflict of interest.

References

  1. Akhtar, S., & Oliver, B. (2009). Determinants of capital structure for Japanese multinational and domestic corporations. International Review of Finance, 9(1–2), 1–26. [Google Scholar] [CrossRef]
  2. Allayannis, G., Brown, G. W., & Klapper, L. (2003). Capital structure and financial risk: Evidence from foreign debt use in East Asia. The Journal of Finance, 58(6), 2667–2710. [Google Scholar] [CrossRef]
  3. Allen, F., Bartiloro, L., Gu, X., & Kowalewski, O. (2018). Does economic structure determine financial structure? Journal of International Economics, 114, 389–409. [Google Scholar] [CrossRef]
  4. Allen, F., & Gale, D. (2000). Comparing financial systems. MIT Press. [Google Scholar]
  5. Bagley, C. N., & Yaari, U. (1996). Financial leverage strategy with transaction costs. Applied Mathematical Finance, 3(3), 191–208. [Google Scholar] [CrossRef]
  6. Batsakis, G., & Theoharakis, V. (2021). Achieving the paradox of concurrent internationalization speed: Internationalizing rapidly in both breadth and depth. Management International Review, 61(4), 429–467. [Google Scholar] [CrossRef]
  7. Baum, C. F., Schäfer, D., & Talavera, O. (2011). The impact of the financial system’s structure on firms’ financial constraints. Journal of International Money and Finance, 30(4), 678–691. [Google Scholar] [CrossRef]
  8. Bell, R. G., Filatotchev, I., & Rasheed, A. A. (2012). The liability of foreignness in capital markets: Sources and remedies. Journal of International Business Studies, 43(2), 107–122. [Google Scholar] [CrossRef]
  9. Berry, H., Guillén, M. F., & Zhou, N. (2010). An institutional approach to cross-national distance. Journal of International Business Studies, 41(9), 1460–1480. [Google Scholar] [CrossRef]
  10. Bessler, W., Drobetz, W., & Grüninger, M. C. (2011). Information asymmetry and financing decisions. International Review of Finance, 11(1), 123–154. [Google Scholar] [CrossRef]
  11. Beugelsdijk, S., Kostova, T., Kunst, V. E., Spadafora, E., & Van Essen, M. (2018). Cultural distance and firm internationalization. Journal of Management, 44(1), 89–130. [Google Scholar] [CrossRef]
  12. Boisot, M., & Meyer, M. W. (2008). Which way through the open door? Reflections on the internationalization of Chinese firms. Management and Organization Review, 4(3), 349–365. [Google Scholar] [CrossRef]
  13. Brealey, R. A., Myers, S. C., & Allen, F. (2014). Principles of corporate finance (12th ed.). McGraw-Hill. [Google Scholar]
  14. Burlacu, R. (2000). New evidence on the pecking order hypothesis: The case of French convertible bonds. Journal of Multinational Financial Management, 10(3–4), 439–459. [Google Scholar] [CrossRef]
  15. Chen, C. J. P., Cheng, C. S. A., He, J., & Kim, J. (1997). An investigation of the relationship between international activities and capital structure. Journal of International Business Studies, 28(3), 563–577. [Google Scholar] [CrossRef]
  16. Chui, A. C. W., Kwok, C. C. Y., & Zhou, G. (2016). National culture and the cost of debt. Journal of Banking & Finance, 69, 1–19. [Google Scholar] [CrossRef]
  17. Çam, İ., & Özer, G. (2021). Institutional quality and corporate financing decisions around the world. The North American Journal of Economics and Finance, 57, 101401. [Google Scholar] [CrossRef]
  18. Dau, L. A., Morck, R., & Yeung, B. Y. (2021). Business groups and the study of international business: A Coasean synthesis and extension. Journal of International Business Studies, 52(2), 161–211. [Google Scholar] [CrossRef]
  19. Daude, C., & Fratzscher, M. (2008). The pecking order of cross-border investment. Journal of International Economics, 74(1), 94–119. [Google Scholar] [CrossRef]
  20. De Jong, A., Verbeek, M., & Verwijmeren, P. (2010). The impact of financing surpluses and large financing deficits on tests of the pecking order theory. Financial Management, 39(2), 733–756. [Google Scholar] [CrossRef]
  21. Djankov, S., McLiesh, C., & Shleifer, A. (2007). Private credit in 129 countries. Journal of Financial Economics, 84(2), 299–329. [Google Scholar] [CrossRef]
  22. Donaldson, G. (1961). Corporate debt capacity: A study of corporate debt policy and the determination of corporate debt capacity. Harvard Graduate School of Business Administration. [Google Scholar]
  23. Erel, I., Jang, Y., & Weisbach, M. S. (2023). The corporate finance of multinational firms. SSRN. [Google Scholar]
  24. Eren, E., Malamud, S., & Zhou, H. (2022). International pecking order. SSRN. [Google Scholar]
  25. Flannery, M. J., & Rangan, K. P. (2006). Partial adjustment toward target capital structures. Journal of Financial Economics, 79(3), 469–506. [Google Scholar] [CrossRef]
  26. Fotak, V. (2016). A spark from the public sector: Co-lending by government-owned and private-sector lenders. BAFFI CAREFIN Centre. [Google Scholar]
  27. Fotak, V., Lee, H., & Megginson, W. (2019). A BIT of investor protection: How Bilateral Investment Treaties impact the terms of syndicated loans. Journal of Banking & Finance, 102, 138–155. [Google Scholar] [CrossRef]
  28. Frank, M. Z., & Goyal, V. K. (2003). Testing the pecking order theory of capital structure. Journal of Financial Economics, 67(2), 217–248. [Google Scholar] [CrossRef]
  29. Gehr, A. K., Jr. (1984). Financial structure and financial strategy. Journal of Financial Research, 7(1), 69–80. [Google Scholar] [CrossRef]
  30. Harms, P., & Shuvalova, D. (2020). Cultural distance and international trade in services: A disaggregate view. Economic Systems, 44(2), 100775. [Google Scholar] [CrossRef]
  31. Ige, A., & Washington, M. (2023). Capital market liability of foreignness and country-of-origin stereotype: An empirical investigation. Transnational Corporations Review, 15(1), 50–58. [Google Scholar] [CrossRef]
  32. Jang, Y. (2017). International corporate diversification and financial flexibility. Review of Financial Studies, 30(12), 4133–4178. [Google Scholar] [CrossRef]
  33. Joliet, R., & Muller, A. (2013). Capital structure effects of international expansion. Journal of Multinational Financial Management, 23(5), 375–393. [Google Scholar] [CrossRef]
  34. Kadapakkam, P.-R., Meisami, A., & Wald, J. K. (2016). The debt trap: Wealth transfers and debt-equity choices of junk-grade firms. The Financial Review, 51(1), 5–35. [Google Scholar] [CrossRef]
  35. Khan, A. S., & Adom, A. Y. (2015). A test of the pecking order theory of capital structure in corporate finance. Accounting & Taxation, 7(2), 43–49. [Google Scholar]
  36. Kittilaksanawong, W. (2017). Institutional distances, resources and entry strategies. International Journal of Emerging Markets, 12(1), 58–78. [Google Scholar] [CrossRef]
  37. Lee, I., Lochhead, S., Ritter, J., & Zhao, Q. (1996). The costs of raising capital. Journal of Financial Research, 19(1), 59–74. [Google Scholar] [CrossRef]
  38. Lindner, T., Klein, F., & Schmidt, S. (2018). The effect of internationalization on firm capital structure: A meta-analysis and exploration of institutional contingencies. International Business Review, 27(6), 1238–1249. [Google Scholar] [CrossRef]
  39. Mansi, S. A., & Reeb, D. M. (2002). Corporate international activity and debt financing. Journal of International Business Studies, 33(1), 129–147. [Google Scholar] [CrossRef]
  40. Miller, D. P., & Puthenpurackal, J. J. (2005). Security fungibility and the cost of capital: Evidence from global bonds. Journal of Financial and Quantitative Analysis, 40(4), 849–872. [Google Scholar] [CrossRef]
  41. Mohapatra, S., Nose, M., & Ratha, D. (2018). Determinants of the distance between sovereign credit ratings and sub-sovereign bond ratings: Evidence from emerging markets and developing economies. Applied Economics, 50(9), 934–956. [Google Scholar] [CrossRef]
  42. Myers, S. C. (1984). The capital structure puzzle. The Journal of Finance, 39(3), 575–592. [Google Scholar] [CrossRef]
  43. Myers, S. C., & Majluf, N. S. (1984). Corporate financing and investment decisions when firms have information that investors do not have. Journal of Financial Economics, 13(2), 187–221. [Google Scholar] [CrossRef]
  44. Oxelheim, L. (1997). Financial markets in transition: Globalization, investment and economic growth. Routledge. [Google Scholar]
  45. Özer, G., & Çam, İ. (2021). Financing decisions of firms: The roles of legal systems, shareholder rights and creditor rights. Accounting & Finance, 61(2), 2717–2757. [Google Scholar] [CrossRef]
  46. Pessarossi, P., & Weill, L. (2013). Choice of corporate debt in China: The role of state ownership. China Economic Review, 26, 1–16. [Google Scholar] [CrossRef]
  47. Qi, Y., Roth, L., & Wald, J. K. (2011). How legal environments affect the use of bond covenants. Journal of International Business Studies, 42, 235–262. [Google Scholar] [CrossRef]
  48. Ramachandran, J., & Pant, A. (2010). The liabilities of origin: An emerging economy perspective on the costs of doing business abroad. In T. Devinney, T. Pedersen, & L. Tihanyi (Eds.), The past, present and future of international business and management (p. 247). Emerald Group Publishing. [Google Scholar]
  49. Randøy, T., Oxelheim, L., & Stonehill, A. (2001). Corporate financial strategies for global competitiveness. European Management Journal, 19(6), 659–669. [Google Scholar] [CrossRef]
  50. Reeb, D. M., Mansi, S. A., & Allee, J. M. (2001). Firm internationalization and the cost of debt financing: Evidence from non-provisional publicly traded debt. Journal of Financial and Quantitative Analysis, 36(3), 395–414. [Google Scholar] [CrossRef]
  51. Sandberg, C. M., Lewellen, W. G., & Stanley, K. L. (1987). Financial strategy: Planning and managing the corporate leverage position. Strategic Management Journal, 8(1), 15–24. [Google Scholar] [CrossRef]
  52. Seifert, B., & Gonenç, H. (2010). Pecking order behavior in emerging markets. Journal of International Financial Management & Accounting, 21(1), 1–31. [Google Scholar]
  53. Shapiro, A. C., & Hanouna, P. (2019). Multinational financial management (11th ed.). John Wiley & Sons. [Google Scholar]
  54. Simerly, R. L., & Li, M. (2000). Environmental dynamism, capital structure and performance: A theoretical integration and an empirical test. Strategic Management Journal, 21(1), 31–49. [Google Scholar] [CrossRef]
  55. Singh, M., Davidson, W. N., & Suchard, J.-A. (2003). Corporate diversification strategies and capital structure. The Quarterly Review of Economics and Finance, 43(1), 147–167. [Google Scholar] [CrossRef]
  56. Stulz, R. M. (2010). Globalization, corporate finance, and the cost of capital. Journal of Applied Corporate Finance, 22(1), 8–25. [Google Scholar]
  57. Sullivan, D. (1994). Measuring the degree of internationalization of a firm. Journal of International Business Studies, 25(2), 325–342. [Google Scholar] [CrossRef]
  58. Sun, S. L., Peng, M. W., Lee, R. P., & Tan, W. (2015). Institutional open access at home and outward internationalization. Journal of World Business, 50(1), 234–246. [Google Scholar] [CrossRef]
  59. Velez-Calle, A., Sanchez-Henriquez, F., & Contractor, F. J. (2018). Internationalization and performance: The role of depth and breadth. Academia Revista Latinoamericana de Administración, 31(1), 91–104. [Google Scholar] [CrossRef]
  60. Vitali, S., Glattfelder, J. B., & Battiston, S. (2011). The network of global corporate control. PLoS ONE, 6(10), e25995. [Google Scholar] [CrossRef] [PubMed]
  61. Zaheer, S. (1995). Overcoming the liability of foreignness. Academy of Management Journal, 38(2), 341–363. [Google Scholar] [CrossRef] [PubMed]
  62. Zámborský, P., & Yan, Z. J. (2022). Institutional distance and the motivations to springboard. American Business Review, 25(2), 355–389. [Google Scholar] [CrossRef]
Figure 1. Mechanism of internationalization degree and finance costs.
Econometrics 14 00023 g001
Table 1. Distribution of listing years of observations in the dataset.
Listing YearNumber of Observed Listed CompaniesPercentage (%)
2010 and before165431.72
20113827.32
20123626.95
20132865.48
20143526.75
20152524.84
20162264.33
20172063.95
20183987.64
20194989.55
202059811.46
Table 2. Distribution of industries of the sample.
Industry NameNumber of SamplesPercentage (%)
Information Technology60911.68
Pharmaceuticals & Biotechnology4137.92
Real Estate64912.44
Light Manufacturing164631.56
Heavy Manufacturing150028.76
Public Utilities3987.63
Total:5215100
Table 3. Descriptive Statistics for Main Variables.
Variable NameVariable CodeObservationsMeanMedianStd. Dev.MinimumMaximum
Panel A: Explained Variables
Finance CostsFinanceCost52159.978.986.301.9753.82
Panel B: Explanatory Variables
BreadthNOC52154.2625.28150
DepthOSTS52150.330.300.2501
Panel C: Mediating Variables
Pecking orderPeckOrder52150.3000.4601
Panel D: Moderating Variables
Legal DistanceLegalDistance52158.9690.68810
Finance System Structure DifferenceFinanceSystemStructure52156.566.392.501.9612.84
Panel E: Control Variables
Market CapitalizationMarketCap5215345838419,7200697,693
Total LiabilitiesTotalLiabilities52157961379.7056,961−9475184,806
Annual Public FinancingPublicIssued5215380226.9007491
Price-to-Book RatioPriceBookRatio521526.921.09927.70058,681
Gearing RatioGearingRatio521567.1838.3089.800533
Change in Equity CapitalEquitych521542.660344.40−17,5914707
Change in Short-term DebtsStdebtch52152.6200243.50−78066975
Change in Working AssetsNetworkingAssetsch5215−40.68−3.74687.60−23,89411,359
Number Institutional InvestorInvestor491180.4616130.3001029
% of Institutional InvestorInvrate49110.8360.8960.21401
Table 4. Finance costs, internationalization degree, pecking-order selection and other variables.
(1)(2)(3)(4)(5)(6)(7)(8)(9)(10)(11)(12)(13)(14)(15)
FinanceCost1
PeckOrder−0.035 **1
NOC−0.047 ***0.028 **1
OSTS0.053 ***−0.064 ***0.166 ***1
Totalliabilities−0.061 ***0.0180.103 ***−0.078 ***1
Marketcap0.0140.0210.119 ***−0.052 ***0.251 ***1
PublicIssued0.0070.0160.023 *0.0020.056 ***0.054 ***1
Networkingassetsch0.033 **−0.005−0.036 ***0.029 **−0.190 ***0.125 ***−0.029 **1
Equitych−0.0090.0100.052 ***−0.027 *0.057 ***0.0150.029 **0.233 ***1
Stdebtch−0.0080.0150.0030.0110.036 ***0.035 **0.004−0.031 **−0.0051
Gearingratio−0.275 ***0.0110.097 ***−0.110 ***0.096 ***−0.0170.008−0.056 ***0.010−0.0021
Investor0.0150.056 ***0.301 ***−0.078 ***0.138 ***0.412 ***0.179 ***0.0040.084 ***0.006−0.0041
Invrate−0.002−0.0150.062 ***−0.0110.0150.028 *0.001−0.006−0.003−0.0010.0210.115 ***1
FinanceSystemStructure−0.078 ***0.030 **0.026 *−0.022−0.026 *−0.001−0.011−0.024 *−0.033 **0.021−0.027 *0.031 **0.040 ***1
LegalDistance−0.053 ***−0.022−0.0130.009−0.095 ***−0.021−0.0170.020−0.0160.0010.013−0.0220.0060.050 ***1
Note: * p < 0.1, ** p < 0.05, *** p < 0.01.
Table 5. VIF analysis results for the main variables.
VariableVIF1/VIF
Investor1.4100.708
Marketcap1.3200.756
NOC1.1800.846
Totalliabilities1.1700.852
Networkingassetsch1.1700.855
Equitych1.1100.900
OSTS1.1000.912
Stateowned1.0500.954
PublicIssued1.0400.962
Invrate1.0200.978
LegalDistance1.0100.986
FinanceSystemStructure1.0100.989
PeckOrder1.0100.991
Stdebtch10.995
BankNetwork10.996
Mean VIF1.1100.901
Table 6. Main model: Examining the relationship between internationalization degree and finance costs with moderating effects.
Explained Variable (FinanceCosts)Mediator
L.PeckOrder
(1)(2)(3)(5)(4)
L.NOC 0.1390 * 0.1434 **0.0195 **
(1.93) (1.98)(2.56)
L.OSTS −43.1510 *** −43.0250 ***−7.9745 ***
(−7.94) (−7.81)(−15.85)
PeckOrder −0.6419 ***1.1087 *
(statement-based) (−3.44)(1.66)
LegalDistance−0.2769 **−0.5046 ***−0.3053 *−0.4960 ***−0.0337 ***
(−2.29)(−4.30)(−2.49)(−4.26)(−3.09)
FinanceSystemStructure−0.1940 ***−0.2072 ***−0.1896 ***−0.2107 ***0.0033
(−4.74)(−5.04)(−4.63)(−5.14)(1.15)
Totalliabilities−0.0001 *−0.0001 **−0.0001−0.0001 **0.0001
(−1.81)(−2.57)(−1.43)(−2.57)(1.42)
Marketcap0.0001 *0.00010.00010.00010.0001 *
(1.65)(1.52)(1.71)(1.51)(1.66)
PublicIssued−0.0001−0.0010 *−0.0002−0.0010 *0.0001
(−0.09)(−1.67)(−0.05)(−1.68)(0.90)
Networkingassetsch−0.0001−0.0001−0.0001 *−0.0001−0.0001 *
(−1.44)(−0.96)(−1.42)(−0.95)(−1.83)
Equitych0.00010.00010.00010.00010.0001 **
(0.66)(0.56)(0.36)(0.56)(2.11)
Stdebts−0.0002 **−0.0001−0.0001−0.0001−0.0001
(−2.46)(−0.99)(−2.05)(−1.01)(−0.91)
Gearingratio−0.0098 ***−0.0101 ***−0.0098 ***−0.0099 ***−0.0002 **
(−5.49)(−5.07)(−5.63)(−4.93)(−2.37)
Investor−0.0504−0.0542−0.0622−0.05490.0221 ***
(−1.11)(−0.77)(−1.36)(−0.77)(3.12)
Invrate2.5416 ***−1.8355−2.9623 ***−1.83190.0850
(5.79)(−1.41)(−6.42)(−1.39)(0.69)
_cons16.2908 ***35.0810 ***17.3211 ***33.9002 ***1.4997 **
(4.45)(5.98)(4.71)(5.69)(2.52)
N49104169491041694169
Note: *, **, and *** indicate that the coefficients are significant at the 10%, 5%, and 1% levels, respectively. D-K standard errors are reported in parentheses.
Table 7. Robustness test (substituting mediating variable): Examining the relationship between internationalization degree and pecking order with moderating effects.
Explained Variable (FinanceCosts)Mediator
L.PeckOrder
(1)(2)(3)(5)(4)
L.NOC 0.1390 * 0.1434 **0.0195 **
(1.93) (1.98)(2.56)
L.OSTS −43.1510 *** −43.0250 ***−7.9745 ***
(−7.94) (−7.81)(−15.85)
PeckOrder −1.5527 *1.1087 *
(statement-based) (1.92)(1.66)
LegalDistance−0.2769 **−0.5046 ***−0.2887 **−0.4960 ***−0.0337 ***
(−2.29)(−4.30)(−2.40)(−4.26)(−3.09)
FinanceSystemStructure−0.1940 ***−0.2072 ***−0.1904 **−0.2107 ***0.0033
(−4.74)(−5.04)(−4.68)(−5.14)(1.15)
Totalliabilities−0.0001 *−0.0001 **−0.0001−0.0001 **0.0001
(−1.81)(−2.57)(−1.55)(−2.57)(1.42)
Marketcap0.0001 *0.00010.00010.00010.0001 *
(1.65)(1.52)(1.59)(1.51)(1.66)
PublicIssued−0.0001−0.0010 *−0.0002−0.0010 *0.0001
(−0.09)(−1.67)(−0.28)(−1.68)(0.90)
Networkingassetsch−0.0001−0.0001−0.0001 *−0.0001−0.0001 *
(−1.44)(−0.96)(−1.42)(−0.95)(−1.83)
Equitych0.00010.00010.00010.00010.0001 **
(0.66)(0.56)(0.75)(0.56)(2.11)
Stdebts−0.0002 **−0.0001−0.0001 **−0.0001−0.0001
(−2.46)(−0.99)(−2.42)(−1.01)(−0.91)
Gearingratio−0.0098 ***−0.0101 ***−0.0098 ***−0.0099 ***−0.0002 **
(−5.49)(−5.07)(−5.50)(−4.93)(−2.37)
Investor−0.0504−0.0542−0.0508−0.05490.0221 ***
(−1.11)(−0.77)(−1.12)(−0.77)(3.12)
Invrate2.5416 ***−1.8355−2.567 ***−1.83190.0850
(5.79)(−1.41)(−5.86)(−1.39)(0.69)
_cons16.2908 ***35.0810 ***17.9096 ***33.9002 ***1.4997 **
(4.45)(5.98)(4.85)(5.69)(2.52)
N49104169491041694169
Note: *, **, and *** indicate that the coefficients are significant at the 10%, 5%, and 1% levels, respectively. D-K standard errors are reported in parentheses.
Table 8. Robustness test (adding control variable): Examining the relationship between internationalization degree and finance costs with moderating effects.
Explained Variable (FinanceCosts)Mediator
L.PeckOrder
(1)(2)(3)(5)(4)
L.NOC 0.1390 * 0.1433 **−0.0191 **
(1.93) (1.98)(−2.51)
L.OSTS −43.1415 *** −43.0175 ***−7.9743 ***
(−7.93) (−7.81)(−15.82)
L.PeckOrder −0.6412 ***1.1043 *
(statement-based) (−3.44)(1.65)
LegalDistance−0.2756 **−0.5034 ***−0.3042 *−0.4949 ***−0.0164
(−2.28)(−4.28)(−2.48)(−4.24)(−1.55)
FinanceSystemStructure−0.1942 ***−0.2074 ***−0.1898 ***−0.2109 ***0.0040
(−4.74)(−5.04)(−4.63)(−5.14)(1.53)
Stateowned−0.6010−0.6020−0.0001−0.5124−0.0287
(−0.72)(−0.87)(−0.58)(−0.74)(−0.35)
Totalliabilities−0.0001 *−0.0001 **0.0001−0.0001 **−0.0001
(−1.82)(−2.58)(1.44)(−2.58)(−0.59)
Marketcap0.0001 *0.00010.00020.00010.0001 *
(1.65)(1.52)(1.71)(1.51)(1.75)
PublicIssued−0.0001−0.0010 *−0.0001 *−0.0010 *0.0000
(−0.09)(−1.67)(−0.05)(−1.68)(0.06)
Networkingassetsch−0.0001−0.0001−0.0001−0.0001−0.0000 **
(−1.46)(−0.99)(−1.45)(−0.97)(−2.27)
Equitych0.00010.00010.00010.00010.0001
(0.66)(0.57)(0.36)(0.57)(1.39)
Stdebts−0.0002 ***−0.0001−0.0002 ***−0.0001−0.0001
(−2.67)(−1.08)(−2.22)(−1.08)(−0.91)
Gearingratio−0.0098 ***−0.0101 ***−0.0099−0.0099 ***−0.0002
(−5.49)(−5.07)(−5.63)(−4.93)(−1.30)
Investor−0.0503−0.0541−0.0621 ***−0.05480.0057
(−1.10)(−0.76)(−1.36)(−0.77)(0.43)
Invrate2.5402 ***−1.8359−2.9607 ***−1.83230.2695
(5.78)(−1.41)(−6.41)(−1.39)(1.08)
_cons15.6100 ***35.1206 ***17.3723 ***35.4390 ***1.0270
(4.27)(6.73)(4.72)(6.43)(0.96)
N49104169491041694169
Note: *, **, and *** indicate that the coefficients are significant at the 10%, 5%, and 1% levels, respectively. D-K standard errors are reported in parentheses.
Table 9. Robustness check (Substituting dependent variable): Examining the relationship between internationalization degree and finance costs with moderating effects.
Explained Variable
FinanceCost
(1)(2)(3)(4)
L.NOC0.0053 *0.0053 *
(1.72)(1.72)
L.OSTS −0.7709 **−0.7244 **
(−2.16)(−2.03)
L.PeckOrder 1.4486 ** 1.3825 **
(statement-based) (2.45) (2.33)
Totalliabilities−0.0001 **−0.0001 **−0.0001 **−0.0001 **
(−2.41)(−2.39)(−2.39)(−2.37)
Marketcap0.00010.00010.00010.0001
(0.36)(0.35)(0.41)(0.39)
PublicIssued0.00020.00020.0002−0.0002
(0.56)(0.60)(0.61)(0.62)
Networkingassetsch0.00010.00010.00010.0001
(0.81)(0.80)(0.82)(0.82)
Equitych−0.0002−0.0002−0.0002−0.0002
(−0.60)(−0.59)(−0.61)(−0.60)
Stdebts−0.0002−0.0002−0.0002−0.0002
(−0.56)(−0.52)(−0.59)(−0.55)
Gearingratio−0.0188 ***−0.0187 ***−0.0187 ***−0.0187 ***
(−19.39)(−19.39)(−19.33)(−19.34)
Investor0.00110.00120.00080.0009
(1.43)(1.54)(1.12)(1.23)
Invrate0.08410.06230.6510.0444
(0.21)(0.15)(0.16)(0.11)
_cons11.1591 ***12.5853 ***10.8820 ***12.2598 ***
(31.57)(18.48)(28.91)(17.51)
N4910491049104910
Note: *, **, and *** indicate that the coefficients are significant at the 10%, 5%, and 1% levels, respectively. D-K standard errors are reported in parentheses.
Disclaimer/Publisher’s Note: The statements, opinions and data contained in all publications are solely those of the individual author(s) and contributor(s) and not of MDPI and/or the editor(s). MDPI and/or the editor(s) disclaim responsibility for any injury to people or property resulting from any ideas, methods, instructions or products referred to in the content.