1. Introduction
The optimal capital structure (CapStruct), the strategic mix of debt and equity used to finance firm operations, remains a cornerstone of corporate finance research, particularly in emerging markets. In these contexts, economic volatility, evolving regulatory frameworks, and limited access to external finance heighten the complexity of capital structure decisions. South Africa presents a compelling case study in this regard. With its expanding financial markets and socio-economic diversity, firms must navigate a financial landscape shaped by systemic constraints, investor sentiment, and access to credit.
Early theoretical work by
Modigliani and Miller (
1958) proposed the irrelevance of capital structure under perfect market conditions. However, subsequent theories like the Trade-Off Theory (
Kraus & Litzenberger, 1973), the Agency Cost Theory (
Jensen & Meckling, 2019), and the Pecking Order Theory (
Myers & Majluf, 1984) recognized the frictions inherent in real-world markets. These models suggest that while debt offers tax advantages, excessive leverage exposes firms to financial distress and agency conflicts, especially in markets with institutional inefficiencies such as South Africa.
Recent literature has increasingly moved beyond linear models to uncover more nuanced dynamics between leverage and performance. Studies such as
Prekazi et al. (
2023) and
Kathayat et al. (
2024) identify a non-linear, inverse U-shaped relationship, where moderate debt enhances profitability, but beyond a critical threshold, the benefits diminish. These findings align with South Africa’s emerging economy status, where access to finance remains uneven and firm responses to debt levels are shaped by industry type, governance structures, and macroeconomic cycles.
Additionally, firm size emerges as a key moderating variable. Larger firms often enjoy better credit terms and can withstand higher debt levels due to diversified operations and more stable cash flows. In contrast, smaller firms are typically constrained by higher borrowing costs and greater sensitivity to market shocks (
Zhang, 2024;
Cooper et al., 2024). Despite this, empirical evidence exploring how firm size conditions the leverage–performance link remains sparse, particularly within the South African context.
This research seeks to fill that gap by empirically investigating the non-linear relationship between leverage and firm performance, while also examining the moderating effect of firm size. Drawing on a decade-long panel dataset of South African firms and employing the System-GMM methodology, the study offers new insights into the dynamic nature of CapStruct decisions. By identifying the “hidden peak” where leverage optimally boosts profitability before becoming detrimental, the study provides a data-driven benchmark for managers, investors, and policymakers in navigating financial decisions.
While the CapStruct performance link has been widely examined, few studies have explored the non-linear relationship in the context of South African firms, particularly with respect to an optimal leverage ratio (
Tao, 2024) for different firm sizes. Despite extensive research on CapStruct determinants, the dynamic nature of CapStruct adjustments in South African firms remains largely unexplored. Prior studies have primarily relied on static models, overlooking how firms adjust their leverage in response to profitability fluctuations over time (
Abor, 2005;
Gwatidzo & Ojah, 2009). Given South Africa’s economic volatility, firms frequently modify their financial strategies, yet empirical evidence on these dynamic adjustments and limited research on firm characteristics and economic factors together are lacking. Additionally, while firm size is widely recognized as a moderating factor in CapStruct decisions, its influence within the South African context remains underexplored, despite larger firms benefiting from better access to financing and lower borrowing costs (
Frank & Goyal, 2009;
Rajan & Zingales, 1995). Furthermore, the literature does not sufficiently differentiate optimal CapStruct across industries, despite sectoral differences in financial constraints and risk exposure. Without these insights, firms lack tailored financial strategies, and policymakers struggle to develop industry-specific regulations that promote financial stability. This study addresses these gaps by employing a System-GMM model to capture dynamic CapStruct adjustments while investigating the moderating effect of firm size. By identifying industry-specific leverage thresholds, the research provides actionable insights for corporate managers and policymakers, enhancing financial resilience in South Africa’s evolving economic landscape.
This study aims to fill these gaps by determining the optimal leverage levels for South African firms, examining the inverse U-shaped relationship between leverage and profitability, and analyzing how firm size moderates this relationship. Specifically, the study addresses the following research questions:
RQ1: Does capital structure significantly influence the financial performance of South African firms?
H1: There is a significant impact of CapStruct on the financial performance of firms.
RQ2: Is there an inverse U-shaped relationship between leverage and financial performance?
H2: CapStruct exhibits an inverted U-shaped association with financial performance.
RQ3: How does firm size moderate the relationship between leverage and profitability?
H3: Large enterprises achieve their optimal CapStruct with a greater debt ratio than small firms.
This study uniquely contributes to the literature by applying the System-GMM model, which captures dynamic adjustments in CapStruct and addresses potential endogeneity issues. This approach is especially useful in South Africa, where economic volatility affects firms’ financing decisions. By examining the inverse U-shaped relationship, this research also offers insights into the precise leverage levels that maximize firm performance across different sizes, providing practical guidance for managers and policymakers.
The study’s findings offer valuable implications for multiple stakeholders. For corporate managers, understanding optimal debt–equity balance can lead to more strategic financial decision-making, enhancing profitability while mitigating risk. For policymakers, the results provide a basis for developing regulations that support economic stability and business growth. Additionally, this research enriches academic discourse by validating the applicability of CapStruct theories within an emerging market context and refining existing theories based on empirical evidence. Given South Africa’s volatile economic conditions and varied access to capital markets across firm sizes, this study aims to determine the optimal capital structure that maximizes firm profitability. It further investigates how the effect of leverage on performance varies between large and small firms. In doing so, the study addresses the critical question: What is the ideal capital structure for South African companies, and how does leverage influence profitability based on firm size?
The remainder of this paper is structured as follows.
Section 2 reviews the theoretical and empirical literature on CapStruct dynamics and firm performance.
Section 3 outlines the data sources, sample selection, and the methodological approach employed in the study.
Section 4 presents and discusses the empirical results, highlighting key findings from the Fixed Effects and System-GMM models.
Section 5 explores the theoretical contributions and practical implications for corporate managers, policymakers, and financial institutions. Finally,
Section 6 provides the conclusion, summarizing the main findings and contributing recommendations for future research.
4. Results and Discussion
4.1. Descriptive Statistics
Table 2 provides summary data for the variables used in the study, which include ROA, leverage, firm size, and various control variables. With 1548 firm-year observations and 183 firms, with observations for each variable, the table captures the central tendency and dispersion of the data: ROA has a mean value of 0.049 and a standard deviation of 0.108, indicating that firms in the sample have an average return of 4.9% on their assets, with considerable variability in profitability across firms. Leverage (Lev) has a mean of 0.208, suggesting that the average firm finances approximately 20.8% of its assets through debt. The relatively low standard deviation (0.163) indicates moderate variation in leverage levels among firms. Size (natural log of total assets) has a mean of 19.822, reflecting the size distribution of firms in the sample. The standard deviation of 1.868 suggests varying scales of operations among the firms. The control variables, such as Non-current assets to total assets (Non CA/TA), Current Ratio (CR), Asset Turnover (AT), Assets growth (AG), Cash Ratio (C), and Market to book ratio (MB), display their respective mean and standard deviation values, helping to understand the variability in the financial health and operations of firms. Overall, these statistics provide a snapshot of the financial and operational characteristics of the sample firms, setting the context for subsequent regression analysis.
4.2. Correlation
Table 3 presents the pairwise correlations between the variables, offering insights into the relationships between them. Key observations include the following. ROA and Leverage have a significant negative correlation (−0.199 *), indicating that higher leverage is generally associated with lower returns on assets. This suggests that, in the sample, firms with higher debt levels tend to experience lower profitability. ROA and Size show a positive correlation (0.055), albeit weak, suggesting that larger firms might achieve slightly better returns on assets. Leverage and Size are positively correlated (0.222 *), indicating that larger firms tend to have higher leverage, possibly due to their greater ability to access debt markets. The correlation matrix also helps identify potential multicollinearity issues among the independent variables. The Variance Inflation Factor (VIF) values are all below 2, suggesting that multicollinearity is not a significant concern in this analysis. These correlations provide preliminary evidence of the relationships between CapStruct, firm size, and financial performance, supporting the hypotheses regarding the impact of leverage on ROA.
4.3. Distribution of Return on Assets and Financial Leverage (Box Plot Technique)
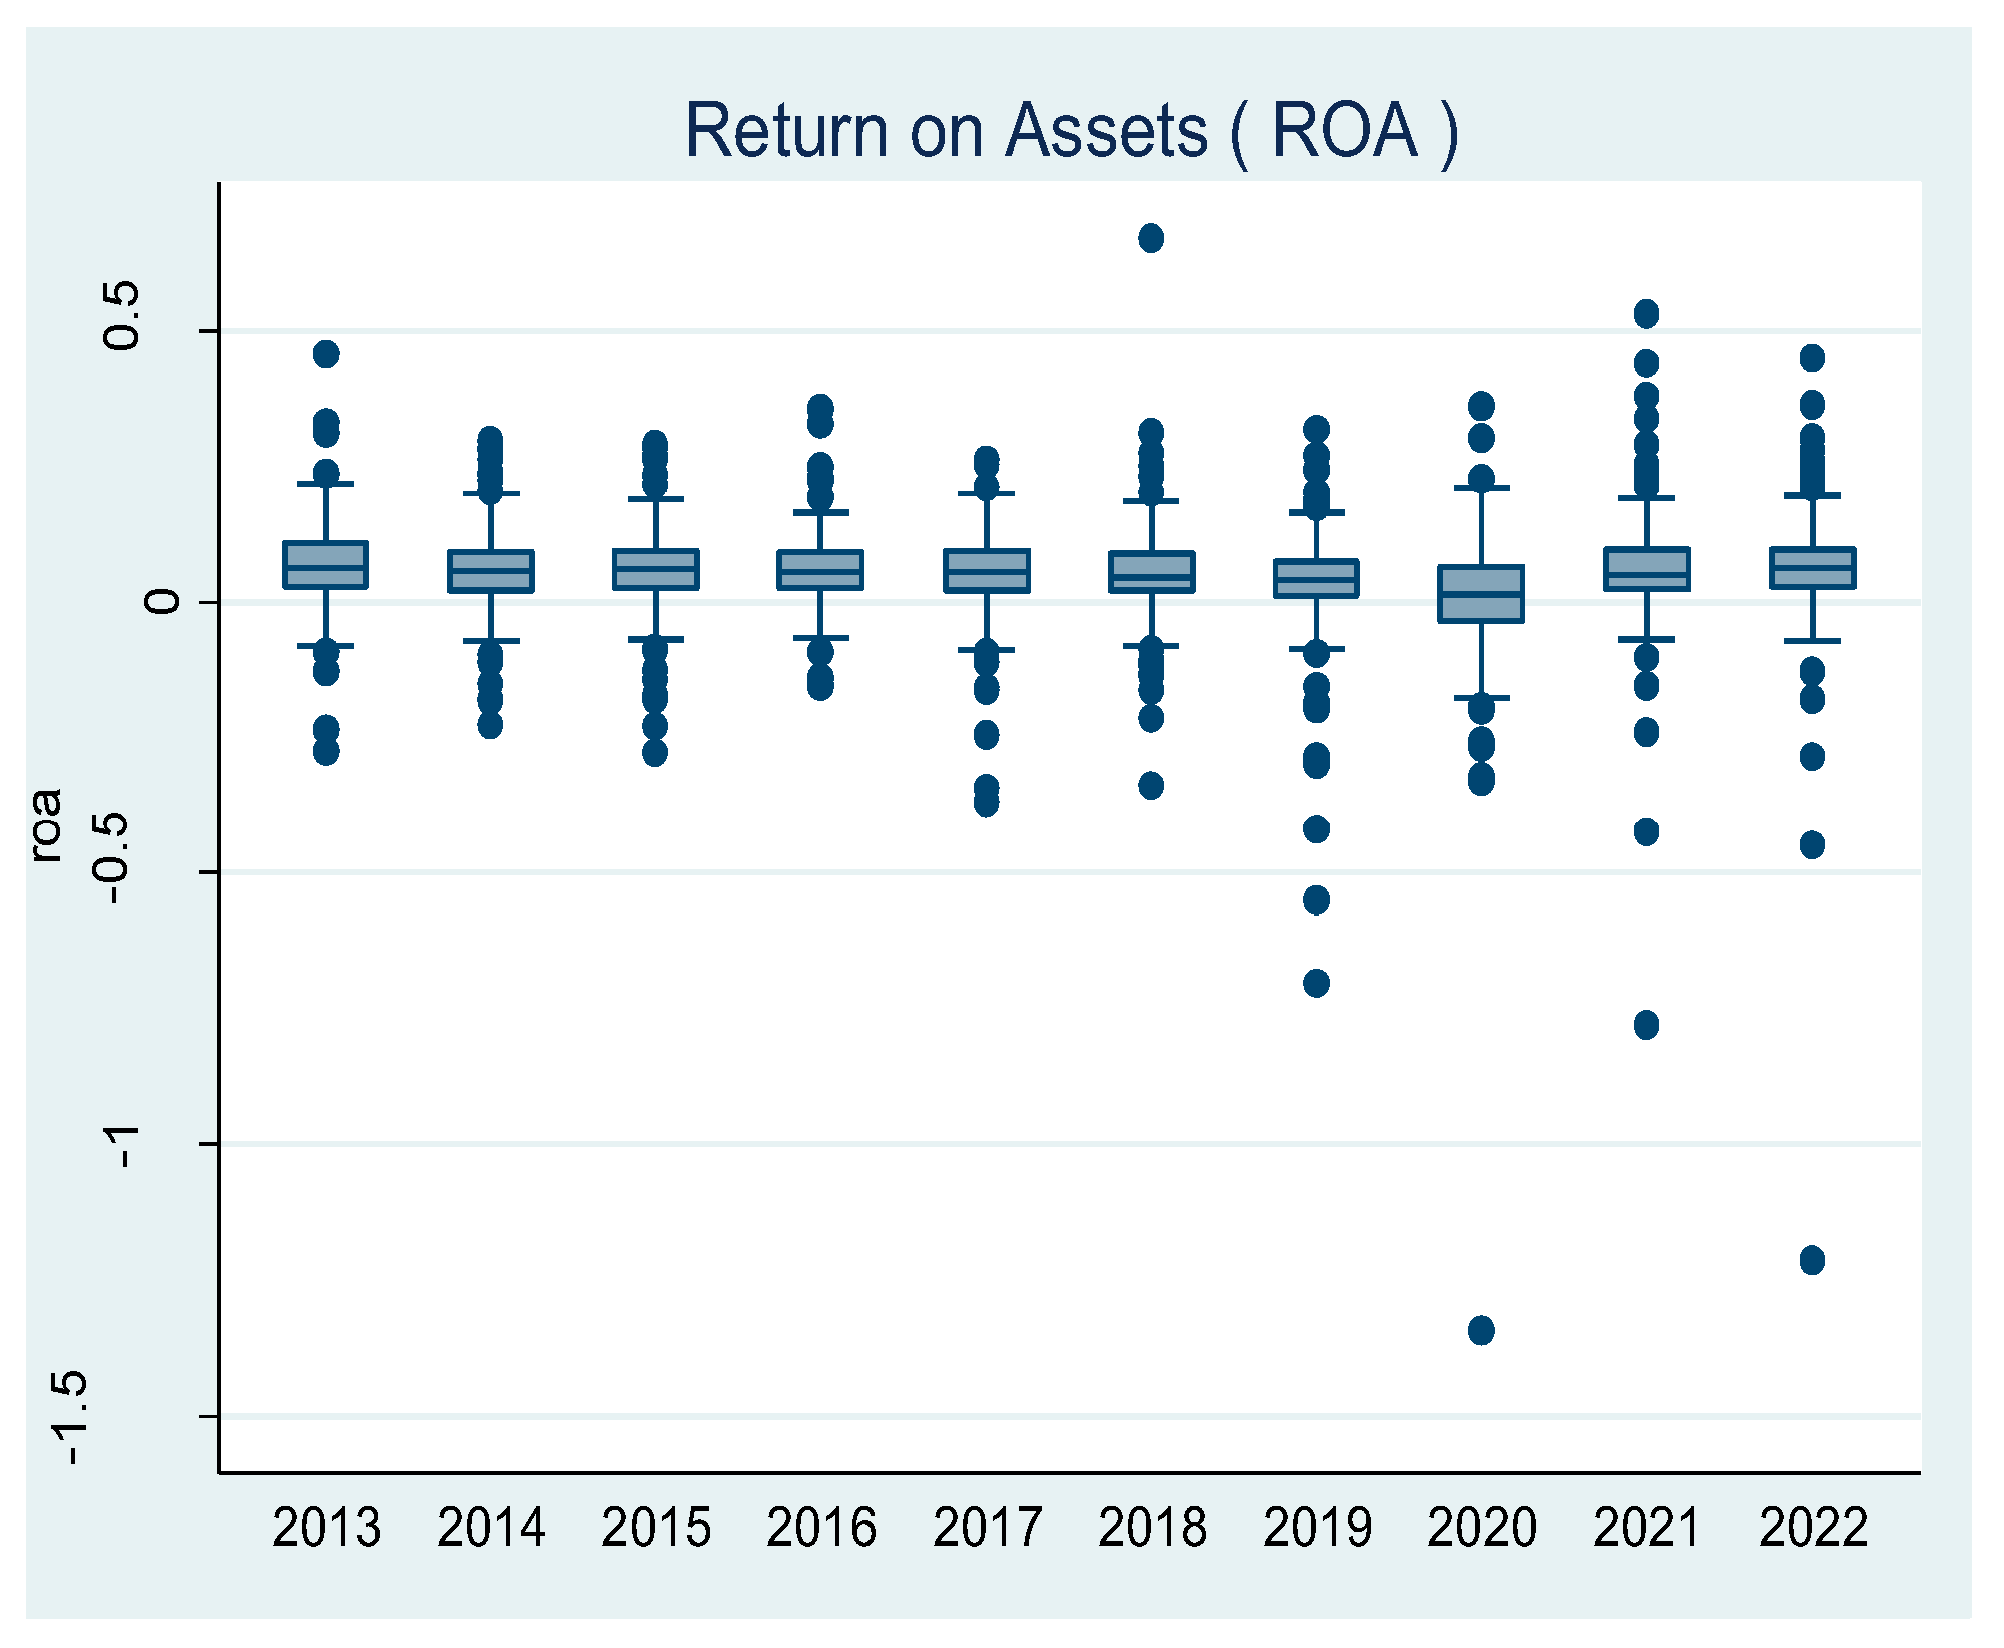
The aforementioned
Figure 1 and
Figure 2 illustrate the distribution of Return on Assets (ROA) and Financial Leverage (Lev) across the timeframe from 2013 to 2022, utilizing the Box plot methodology. The Box plot technique encapsulates the five-number summary within a central box, accompanied by whiskers that extend to encompass the non-outlier values. It is evident from all the figures that, for each individual year examined, the median is not approximately equidistant from the quartiles, and the whiskers exhibit unequal lengths; hence, we infer that the annual data distribution for ROA and Lev throughout the duration of the study is skewed.
4.4. Univariate Analysis
Univariate analysis independently examined each individual variable within a given dataset. It delves into the characteristics of each variable individually.
Table 4 shows the mean and median values of the independent variable and all control variables, with respect to the quartiles of the dependent variable (ROA). The mean difference was measured for each independent and control variable, followed by T-statistic results with a level of significance. The mean differences (Q1–Q4) of the independent variable and all control variables, except MB, were significantly closer to zero. Except for Lev, all others have a negative mean difference, indicating that the mean of the observations in Q4 is higher than the mean of the observations in Q1. The T-stat values in the table measure the statistical significance of the differences in mean values between the lowest (Q1) and highest (Q4) ROA quartiles. Large absolute T-stat values indicate stronger evidence that the differences are not due to random chance. Lev has a T-stat of 9.6823, highlighting a highly significant decrease from Q1 to Q4. Similarly, variables like Non CA/TA (−5.4652), CR (−6.4816), AT (−8.5303), and MB (−10.8499) show statistically significant differences at the 1% level (***). This suggests that these variables are closely associated with variations in ROA across firms.
4.5. Fixed Effects Regression Analysis
Table 5 displays the results of the Fixed Effects (FE) regression models used to analyze the impact of leverage on ROA. The three models vary in complexity, incorporating squared leverage terms and interaction terms with firm size: Model 1 shows that leverage has a significant negative impact on ROA (β = −0.085,
p < 0.01), indicating that higher leverage is associated with reduced profitability. The lagged ROA term (β = 0.139,
p < 0.01) suggests that past performance positively influences current performance. Model 2 introduces the squared term for leverage (Lev
2), which is positive and significant (β = 0.289,
p < 0.01), supporting the inverse U-shaped relationship hypothesis. This suggests that moderate levels of leverage improve profitability, but beyond a certain point, the negative impact of debt outweighs the benefits. Model 3 incorporates an interaction term between leverage and firm size, revealing that the negative impact of leverage is moderated for larger firms (β = −0.077,
p < 0.1). This indicates that the leverage–profitability relationship varies with firm size, although the effect is weaker in this model. The R-squared values range from 0.288 to 0.294, indicating that the models explain around 29% of the variation in ROA. The significant Hausman test
p-values suggest that the fixed effects model is appropriate for the analysis.
The negative coefficient for leverage in Model 1 (β = −0.085, p < 0.01) indicates that, in the South African context, higher levels of debt are associated with reduced profitability (ROA). Economically, this suggests that excessive reliance on debt financing can erode firm earnings due to rising interest obligations and heightened financial risk. In an emerging market like South Africa, where access to affordable credit may be uneven and macroeconomic volatility is common, firms with high leverage are particularly vulnerable to financial distress. This underscores the need for prudent debt management, especially among smaller firms with limited buffers against economic shocks. Hence, the findings reinforce the importance of maintaining moderate debt levels to preserve financial performance in such a dynamic economic environment.
The results of these models provide empirical support for the study’s hypotheses. The significant negative coefficient of leverage in Model 1 aligns with the hypothesis H1, which posits that CapStruct influences firm performance. The positive squared term in Model 2 confirms the hypothesis H2 of an inverse U-shaped relationship, indicating that moderate levels of debt are beneficial, but excessive leverage is detrimental. Finally, the interaction term in Model 3 supports H3, suggesting that larger firms that can reach their optimal CapStruct have a greater debt ratio than smaller enterprises, although this effect is less prominent in dynamic contexts. The findings directly respond to the central question of this study—what constitutes an ideal capital structure for South African firms. The results demonstrate that while moderate debt levels enhance profitability, excessive leverage erodes financial performance, confirming a non-linear (inverse U-shaped) relationship. Moreover, while larger firms can sustain relatively higher debt levels under fixed settings, the difference in optimal leverage between small and large firms becomes insignificant when accounting for dynamic adjustments. These insights highlight that capital structure strategies must be both size-sensitive and context-dependent, especially in emerging economies like South Africa.
4.6. System-GMM Regression Results
Table 6 presents the results of the System-GMM regression models, used to address potential endogeneity issues and better capture the dynamic nature of ROA. Model 1 confirms the negative impact of leverage on ROA (β = −0.315,
p < 0.01), similarly to the FE model. The significant positive coefficient for lagged ROA (β = 0.237,
p < 0.05) indicates a persistent effect of past profitability. Model 2, which includes the squared term (Lev
2), shows a strong positive relationship (β = 2.047,
p < 0.01), again confirming the inverse U-shaped relationship between leverage and ROA. Model 3 introduces the interaction between leverage and firm size but finds the coefficient (β = 0.0663) to be insignificant, suggesting that the effect of leverage does not differ significantly between large and small firms in the dynamic model. The diagnostic tests further validate the model. The significant AR1
p-values indicate the presence of first-order serial correlation, while the AR2
p-values are not significant, suggesting no second-order autocorrelation, thereby validating the use of the GMM approach. The Hansen test
p-values are high (all > 0.49), confirming that the instruments used in the model are valid and not over-identifying the model. Additionally, the Sargan test
p-values (ranging from 0.057 to 0.166) are within an acceptable range, further supporting the validity of the instruments in the analysis.
This study uniquely contributes to the literature by applying the System-GMM model, which effectively captures dynamic adjustments in CapStruct and mitigates potential endogeneity concerns. The results from the System-GMM regression confirm a persistent effect of past profitability (β = 0.237, p < 0.05), supporting the notion that firms dynamically adjust their CapStruct in response to profitability fluctuations. This is particularly relevant in South Africa, where economic volatility influences firms’ financing decisions. Furthermore, the study validates that financial performance and leverage have an inverted U-shaped relationship (β = 2.047, p < 0.01 in the squared term for leverage), indicating that while moderate debt enhances profitability, excessive leverage leads to financial distress.
4.7. Comparison of Optimal Leverage Ratios: Fixed Effects vs. System-GMM Models
Table 7 and
Figure 3 compares the optimal leverage ratios derived from the Fixed Effects and System-GMM models. Model 2 shows that the optimal leverage ratio is 44.64% in the FE model and 35.71% in the System-GMM model. This suggests that the debt level that maximizes profitability is slightly lower when accounting for the dynamic adjustments in leverage. Model 3 suggests that the optimal leverage ratio for large firms is 49.67% in the FE model, but it is lower (36.61%) in the System-GMM model, indicating that large firms might sustain higher leverage under static conditions compared to dynamic settings. For small firms, the optimal leverage ratio is 36.88% under the FE model, similar to that for large firms in the System-GMM analysis (36.61%). The lack of significance in the interaction term in the GMM model suggests no substantial difference in optimal leverage between large and small firms in the dynamic context. The results suggest that while moderate leverage can enhance firm profitability, firms must carefully manage their debt levels to avoid exceeding the optimal threshold. The differences between the FE and GMM models highlight the importance of considering dynamic adjustments when determining optimal leverage ratios. These interpretations provide an in-depth understanding of the relations between leverage, firm size, and financial performance, using a robust methodology that accounts for dynamic factors. Our findings demonstrate that the ideal leverage ratio varies between static and dynamic settings, with System-GMM estimating a lower optimal debt threshold. While large firms can sustain higher leverage in fixed settings, the moderating effect of firm size diminishes in dynamic contexts. This directly addresses our core question, revealing that optimal capital structure is both size-sensitive and context-dependent in South African enterprises. The results support the hypothesis of an inverse U-shaped connection between leverage and profitability and offer insights into how firms can achieve optimal CapStructs to maximize their returns.
The dynamic System Generalized Method of Moments (System-GMM) estimator was selected due to its ability to account for unobserved heterogeneity, endogeneity, and autocorrelation—common issues in capital structure–performance studies. Unlike static models such as OLS or Fixed Effects (FE), System-GMM leverages internal instruments (e.g., lagged dependent variables) to mitigate bias from simultaneity between leverage and profitability. This method is particularly effective in our unbalanced panel context, where firm behavior evolves over time and past performance influences current financing decisions. The inclusion of both lagged levels and differences enhances efficiency and consistency in estimation, making it superior for capturing dynamic financial behavior in emerging markets like South Africa.
5. Theoretical and Practical Implications
5.1. Theoretical Implications
This study adds to the growing body of literature by confirming the non-linear and inverse U-shaped association between CapStruct and business performance, as has been substantiated by a small number of previous studies. The findings challenge the traditional CapStruct irrelevance theory, proving that CapStruct decisions play a crucial role in influencing firm performance and must be carefully considered by financial managers. The evidence supports the Trade-off Theory, which suggests that there is an optimal balance between debt and equity where the benefits of debt peak before being offset by the costs of financial distress. This study’s discovery of an inflection point is consistent with the Pecking Order Theory, suggesting that firms with higher profitability are less inclined to rely on debt despite its theoretical benefits. Furthermore, the existence of this optimal structure implies a convergence of shareholder and management interests at specific debt levels, which helps to minimize agency costs and maximize firm performance. Beyond this point, however, the rising costs associated with increased debt reintroduce conflicts, leading to a decline in overall firm performance.
5.2. Practical Implications
The study’s conclusions hold significant significance for financial management, investors, lenders, and policymakers within South Africa’s unique economic landscape. For corporate managers, understanding the CapStruct–performance relationship is vital for optimizing financial health, especially in the context of South Africa’s evolving market and regulatory environment. Identifying an optimal leverage range offers a practical guide for financial decision-making, allowing firms to adjust their CapStruct to maximize shareholder value while minimizing financial risk. The inverted U-shaped link found across leverage and performance is especially important for strategic planning, enabling South African firms to align financing decisions with sustainable, long-term growth objectives. Furthermore, industry-specific insights allow firms to tailor their financial strategies to the distinct economic and financial dynamics of each sector, aiding them in benchmarking their CapStruct to maintain both competitiveness and resilience. For capital providers, including investors and lenders, this study provides valuable insights into evaluating a firm’s financial stability and risk profile in the South African context. Investors can use these findings to refine their portfolio management by focusing on firms within the optimal leverage range, effectively balancing risk and return in a market that can be volatile. Lenders can also use these data to determine the creditworthiness of borrowers, better customizing lending terms to align with firms that demonstrate stable financial performance and a sustainable CapStruct.
From a policy perspective, these insights are particularly relevant for South Africa. Policymakers can use this understanding of the CapStruct–performance relationship to design regulations that encourage firms to operate within optimal leverage levels, promoting overall economic stability. Additionally, these findings can guide policy initiatives aimed at enhancing financial resilience, particularly for firms in sectors facing structural challenges in achieving optimal leverage ratios. This method can promote a more robust and dynamic company environment, better equipped to navigate South Africa’s socio-economic complexities while supporting long-term growth.
This study highlights the need for sector-specific regulations, such as debt ceilings aligned with industry leverage capacities. Policymakers should offer incentives for firms maintaining optimal debt levels, especially during economic volatility. Supporting SMEs through alternative financing schemes and enhancing monitoring systems to track capital structure trends can promote financial resilience and sustainable growth in South Africa.
6. Conclusions
This study investigates the connection between CapStruct and financial performance among South African companies, focusing on identifying the optimal leverage levels that maximize profitability. Using both Fixed Effects (FE) and dynamic System-GMM models, the study found an inverse U-shaped link between leverage and company performance. This indicates that although moderate debt levels can boost profitability through tax advantages and other benefits, high levels of leverage may result in financial distress, negatively impacting returns. The analysis also highlights that larger firms tend to manage higher levels of debt more effectively than smaller firms, although the System-GMM results indicate that this difference is less significant when accounting for dynamic adjustments.
One of the main contributions of this research is the identification of optimal leverage ratios, which vary depending on the model used. The FE model suggests a higher optimal leverage ratio compared to the System-GMM model, which accounts for time-varying factors and firm-specific dynamics. This insight emphasizes the importance of considering dynamic adjustments in CapStruct decisions to better align with changes in profitability and market conditions. The study also confirms that firm size plays a moderating role, allowing larger firms to potentially sustain higher leverage under certain conditions. These findings, while grounded in the South African context, hold broader relevance for other emerging markets that face similar financial constraints, institutional gaps, and economic volatility. The evidence on optimal leverage and its performance implications can guide firms and policymakers in comparable settings to refine capital structure strategies that balance profitability with financial stability.
However, the study has several limitations. The focus on South African firms may limit the generalizability of the findings to other emerging markets with different regulatory and economic environments. Additionally, the analysis is constrained by the available data from 2013 to 2022 and may not capture longer-term trends or structural shifts in the South African economy. Future research could explore the influence of macroeconomic variables such as inflation and interest rates in greater depth, as these factors play a crucial role in shaping CapStruct decisions; also, industry-oriented variations in optimal leverage can be explored further.
The findings of this study have practical implications for both managers and policymakers. For corporate managers, understanding the optimal balance between debt and equity can guide strategic financial decisions, ensuring that firms leverage their financial structures for sustainable growth while minimizing risks. For policymakers, insights into the CapStruct dynamics of South African firms can inform the development of regulations that foster financial stability and support business growth. This research ultimately contributes to a more nuanced understanding of CapStruct optimization in the context of South Africa, providing a foundation for further studies and strategic financial planning.


 ,
, 


