1. Introduction
The increasing penetration of Distributed Generation (DG) from Renewable Energy Resources (RESs) is heavily affecting the design and operation of modern power grids [
1,
2]. The growing diffusion of dispersed generators installed at end users’ premises is calling for the adoption of advanced control and protection mechanisms, to comply with the increasing complexity of grid codes. New functions are being introduced, year over year, by national regulatory frameworks, thus often requiring the implementation of intelligent devices. New devices are required to implement advanced control capabilities over Distributed Energy Resources (DERs) and Energy Storage Systems (ESSs) [
3,
4], including the provisioning of active and reactive power limitations and of ancillary services, such as voltage and frequency control. At the same time, existing devices implementing the classical protection functions devoted to the safe operation of Distribution Networks (DNs) and of electrical equipment are also involved [
5,
6]. The application of the most recent protection functions defined by current regulatory frameworks [
7,
8] is indeed calling for advanced communication capabilities, thus posing an increasing interest on the development of smart protection devices and systems. This is the case, for instance, of Interface Protection Systems (IPSs), which are used to prevent the undesired islanding of distributed generators in smart and micro-grids. Although the protection mechanisms implemented by IPSs evolved significantly during the last years, further improvements are required in this field, particularly concerning the coordination of dispersed devices in the occurrence of local events or following the implementation of external control signals. Two main research topics can be identified in the scientific literature concerning the evolution of IPSs mechanisms and devices: (1) the study of advanced mechanisms for the effective detection of undesired islanding events, and (2) the application of innovative communication systems enabling low-cost solutions for the coordination of distributed IPSs.
Although the anti-islanding mechanisms defined by current regulatory frameworks proved to be effective in most cases, recent studies demonstrated that, under the different stabilizing functions required by national and international grid codes, the measurement techniques implemented in current IPSs could be inadequate [
9]. Anti-islanding protection functions could in fact fail, particularly during transients, due to the masking effect of stabilizing functions on IPSs [
10]. To cope with this issue, different anti-islanding mechanisms have been recently proposed by the literature, from advanced measurement techniques, to the application of active mechanisms. A passive islanding protection method, for instance, was presented in [
11], while the adoption of the traveling wave analysis was proposed in [
12]. Active mechanisms have been also taken into consideration, such as the observation of the network equivalent impedance through a high frequency measure based on an intentional current injection, and the provisioning of remote signals by Distribution System Operators (DSOs) [
10].
As already mentioned, besides the study of alternative techniques for the detection of undesired islanding conditions, the application of communication systems enabling the coordination of distributed IPSs also plays a key role. Indeed, the development of innovative protection mechanism and of the related Intelligent Electronic Devices (IEDs) may be not sufficient, and proper communication infrastructures must be deployed to provide the required coordination capabilities. In this case, very different solutions have been proposed by the scientific literature, from high-performing systems (e.g., fiber optic), to Power-Line Communication (PLC) and wireless solutions [
13]. However, despite a large variety of communication systems with high performance capabilities are available on the market, their adoption may present relevant limitations. The use of wired infrastructures, for instance, such as fiber optics or ethernet networks, may require high installation costs, particularly in complex systems. Conversely, the use of Wi-Fi is limited to short-range applications, and its application in hybrid environments (e.g., between different stories of the same building) would require the adoption of multiple devices, thus increasing the overall costs.
To cope with this issue, the use of low-cost communication systems for the coordination of IPSs has been recently investigated by the literature. In Ref. [
14], an IPS device equipped with a Narrow Band PLC (NB-PLC) communication system was presented. In this case, the use of PLC was proposed for the communication between the IPS and the DSO, while the Modbus RTU protocol over RS-232 was adopted as field-bus communication between the IPS and the inverters connected to DG and ESS units. In Ref. [
15], the authors adopted a similar approach by proposing a hybrid communication system for the monitoring and control of smart meters and IPSs connected to Low Voltage (LV) networks. In Ref. [
15], a NB-PLC system is used on the LV lines, while a High Performance Radio Local Area Network (HIPERLAN) installed at secondary substations is proposed for the communication with the Medium Voltage (MV) distribution network.
By following this research trend, in this study, the use of a low-cost wireless solution, i.e., the Long-Range Wide Area Network (LoRaWAN) technology, is proposed to allow the coordination of dispersed IPSs. In this case, the use of the LoRaWAN technology has been considered thanks to its low cost, simple implementation, and good coverage capabilities. However, despite these promising capabilities, the main drawback of the LoRaWAN technology is represented by the relative low data-throughput (up to 11 kbps), which limits the number of communicating nodes and the response time of connected devices. The latter, in particular, represents a relevant limitation in scenarios involving the coordination of electrical protections, thus making its application questionable. It is worth noting that, even though the use of the LoRaWAN technology was already proposed in the literature for the coordination of circuit breakers in MV distribution networks, its application for IPSs was never specifically investigated. In particular, in Ref. [
16], the use of Class A LoRa devices was proposed to implement logic selectivity mechanisms in MV networks. However, this study focused only on the coordination of MV circuit breakers, without taking into consideration the specific requirements of IPSs in terms of data monitoring and coordinated control messages.
In particular, it must be stressed that knowing the performance of the communication infrastructure is only one side of the coin. In order to correctly evaluate the usability of the LoRaWAN technology in a specific field of application, it is first of all mandatory to define a proper use case, and only once user application details are known is it possible to verify if and how well they match the communication infrastructure characteristic. Currently, neither the first nor the second aspects have been discussed for the coordination of distributed IPSs.
Following the preliminary work presented in [
17], this study aims at filling this gap by answering the following questions:
is the LoRaWAN technology able to handle the amount of data and the response time intervals required for the coordination of IPSs in smart and micro grids?
how many devices can be coordinated by a single LoRaWAN gateway?
To answer these questions, the monitoring and control functions of IPSs was first defined, by referring to the Italian regulatory framework on the matter. Based on these requirements, a proper communication architecture based on the LoRaWAN Class B technology was proposed, by also defining a specific data model structure, to allow the computation of the payload of the communication. Finally, a scalability analysis on the application of the proposed LoRaWAN architecture was proposed, by computing the number of devices that can be handled by a single LoRaWAN gateway and the maximum expected time of response between a triggering event and the arrival of the related coordination command. The analysis was carried out by computing the Time-on-Air duration of monitoring and supervisory control messages, by varying the main parameters of the communication, i.e., the ping period and the spreading factor.
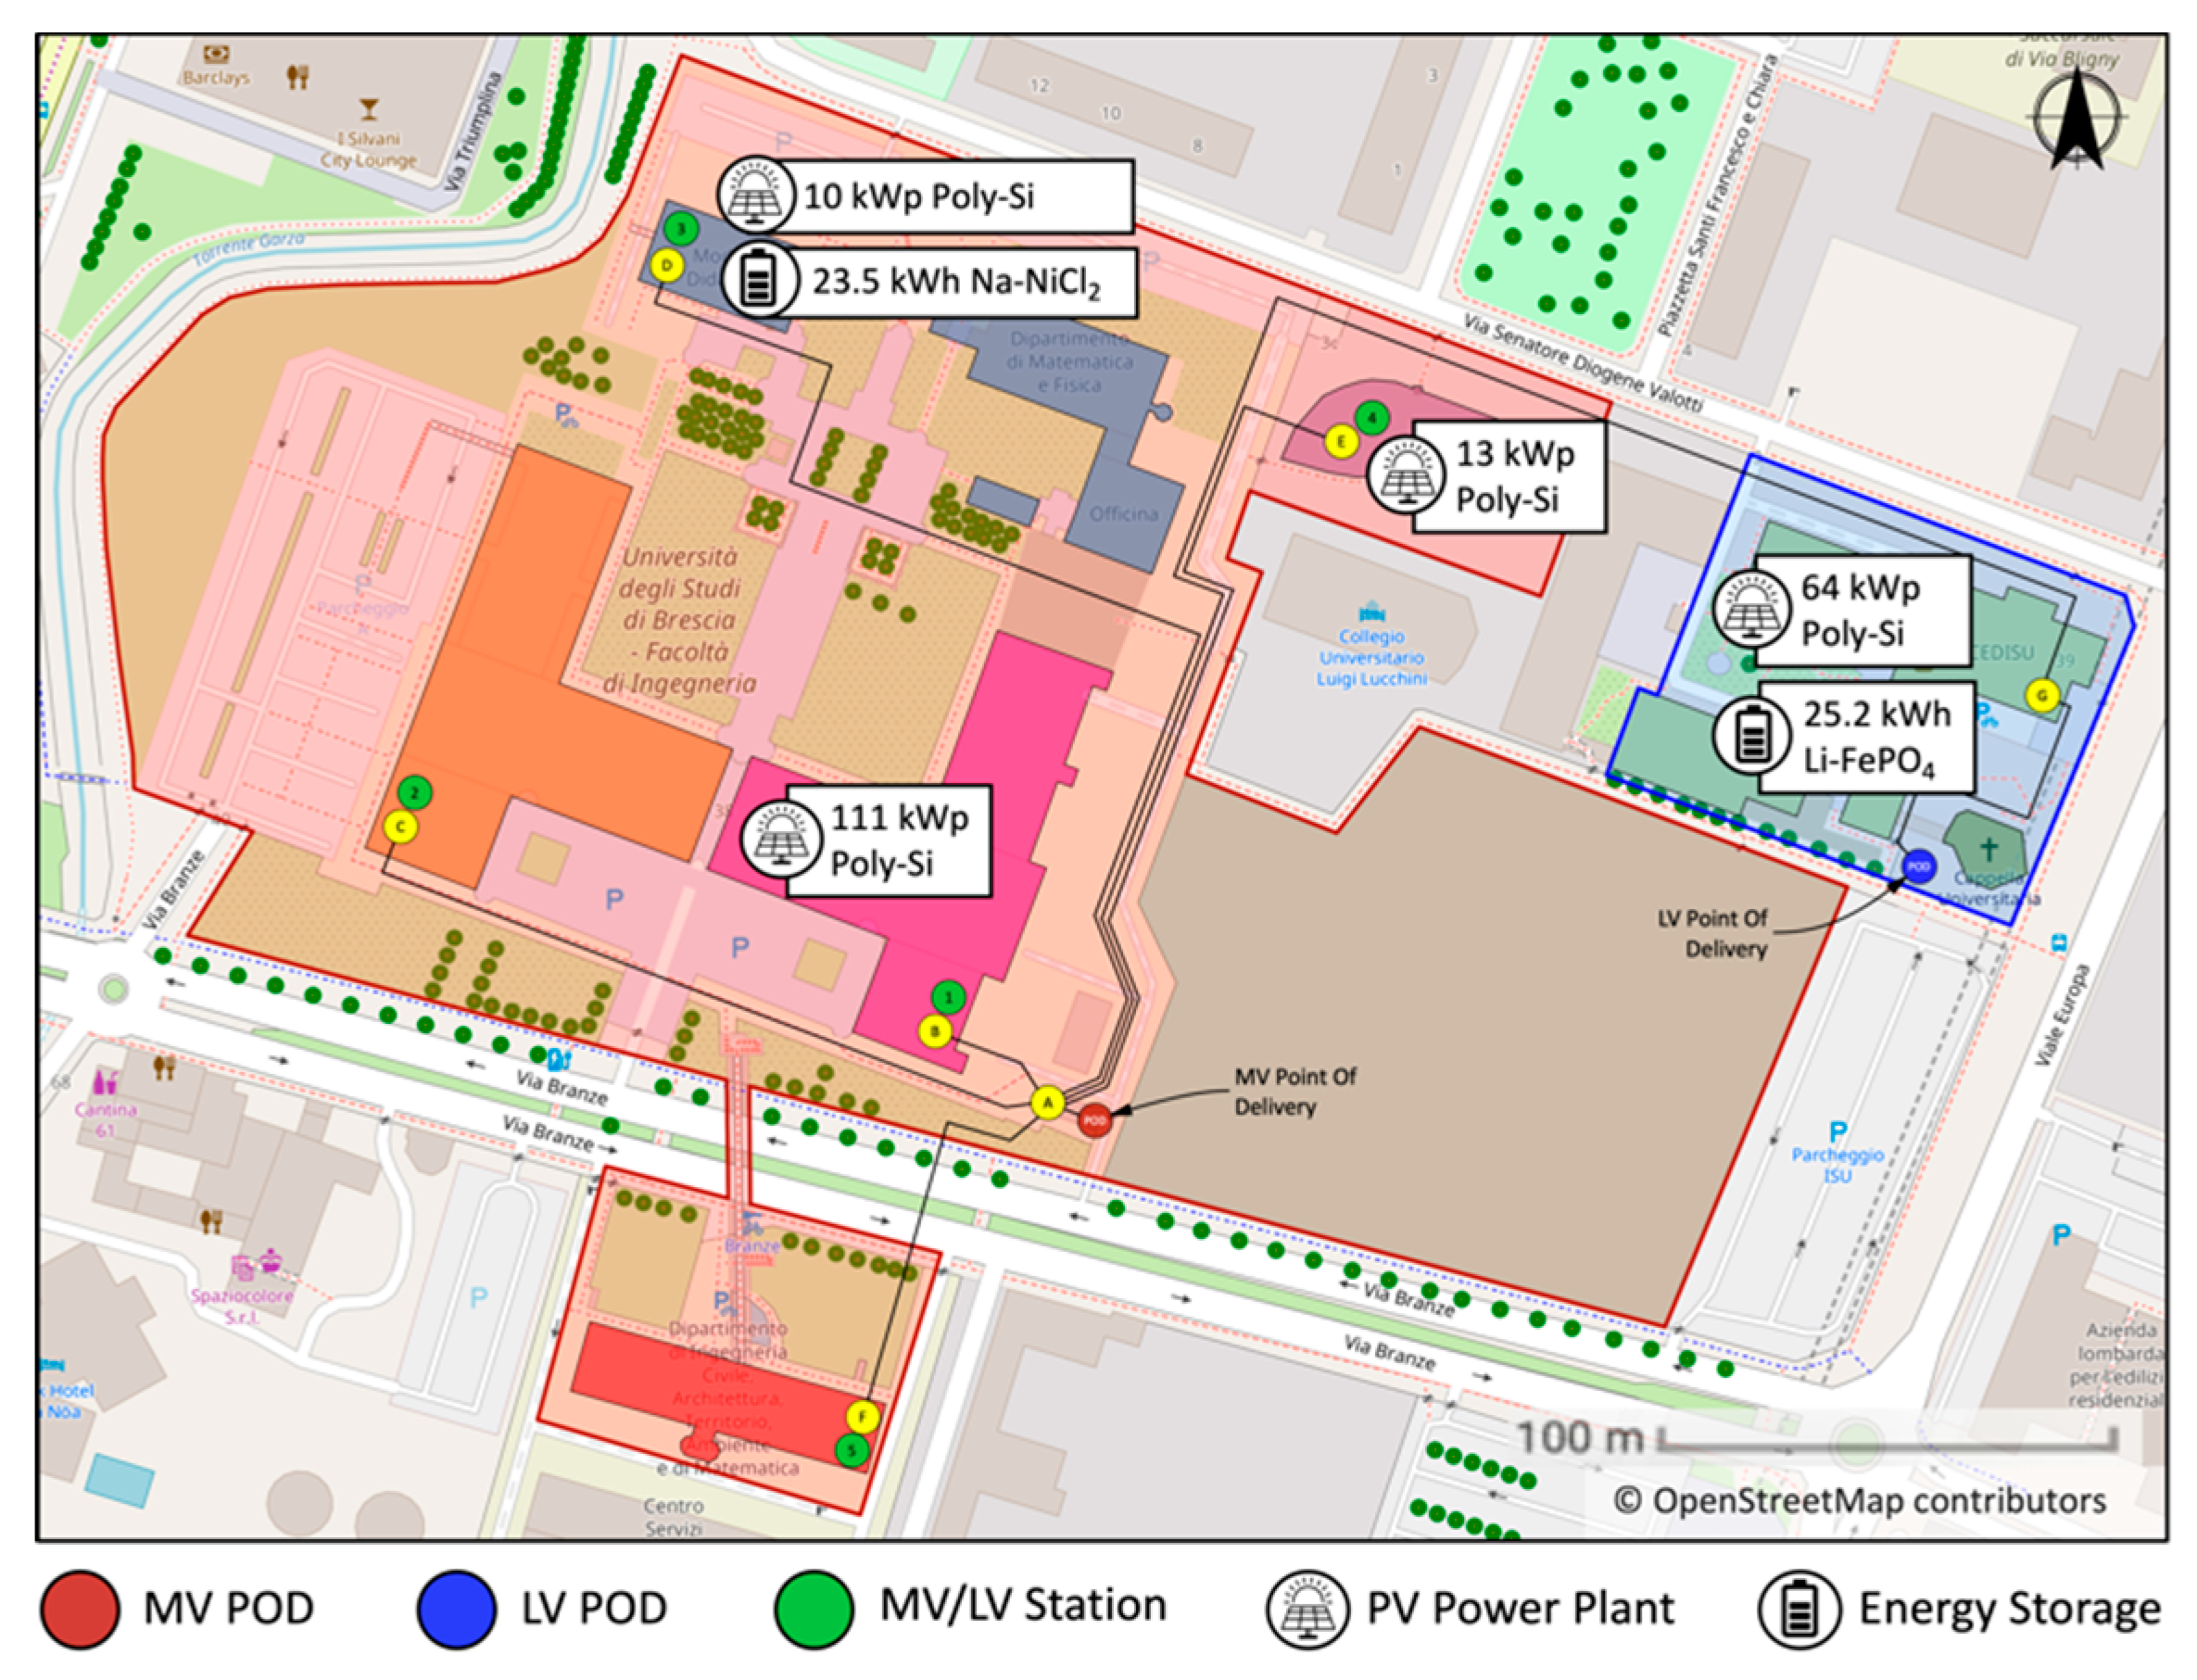
For the sake of completeness, a real-world use case was also presented, to allow the reader to understand the critical aspects related to the coordination of IPSs in complex systems, and thus to better comprehend the benefits introduced by the proposed LoRaWAN solution. The use case introduced in this study is based on the configuration of the IPSs installed in the Engineering campus of the University of Brescia, Italy, which presents four independent LV DG units (three photovoltaic systems and one ESS) connected to a MV Point of Common Coupling (PCC) with the DN.
The structure of the paper is organized as follows. In
Section 2, the main characteristics of IPSs are briefly presented, and their main protection functions and coordination requirements are introduced. Further details on the protection functions defined by the current Italian regulatory framework are reported in
Appendix A. In
Section 3, the configuration of the IPSs installed in the Engineering campus of the University of Brescia is described, to note the current limitations related to the coordination of IPSs installed in complex systems, and thus to highlight the benefits introduced by the proposed solution. The detailed description of the communication system implemented by the current IPS configuration is reported in
Appendix B.
Section 4 presents a brief introduction on the LoRaWAN technology, to allow the readers to better understand its use in the proposed application. In
Section 5, a proper communication mechanism based on the LoRaWAN Class B technology is proposed for the coordination of dispersed IPSs, and the related data model structure is described in detail. In
Section 6, the scalability and sensitivity analyses of the proposed solution are presented and discussed. Finally, in
Section 7, the main findings of the study are summarized, and the conclusions are presented. For the sake of completeness, the list of the abbreviations and the nomenclature adopted in the manuscript have been reported in Abbreviations and Nomenclature.
2. Coordination Requirements of Interface Protection Systems
Interface Protection Systems are protection devices which are used to prevent the undesired operation in islanding mode of distributed generators installed in smart and micro-grids. IPSs are designed to detect the loss of connection with the DN and to disconnect the supervised generation units, in order to inhibit their operation in islanded mode. The loss of the main connection is usually detected as a violation of predefined voltage and frequency acceptable bands [
10]. The safe implementation of anti-islanding protection functions represents a critical task in modern DNs, due to the relevant risks related to the unintentional islanding of DG units, even if operated for a very short time. The main effects include the feeding of DN lines during planned disconnections of the main grid (which expose grid operators to safety risks) and the risk of degradation of electrical equipment during automatic grid reconnections. The latter, in particular, may be caused by possible voltage drifts of the islanded portion of the electrical network with respect to that of the main grid [
18].
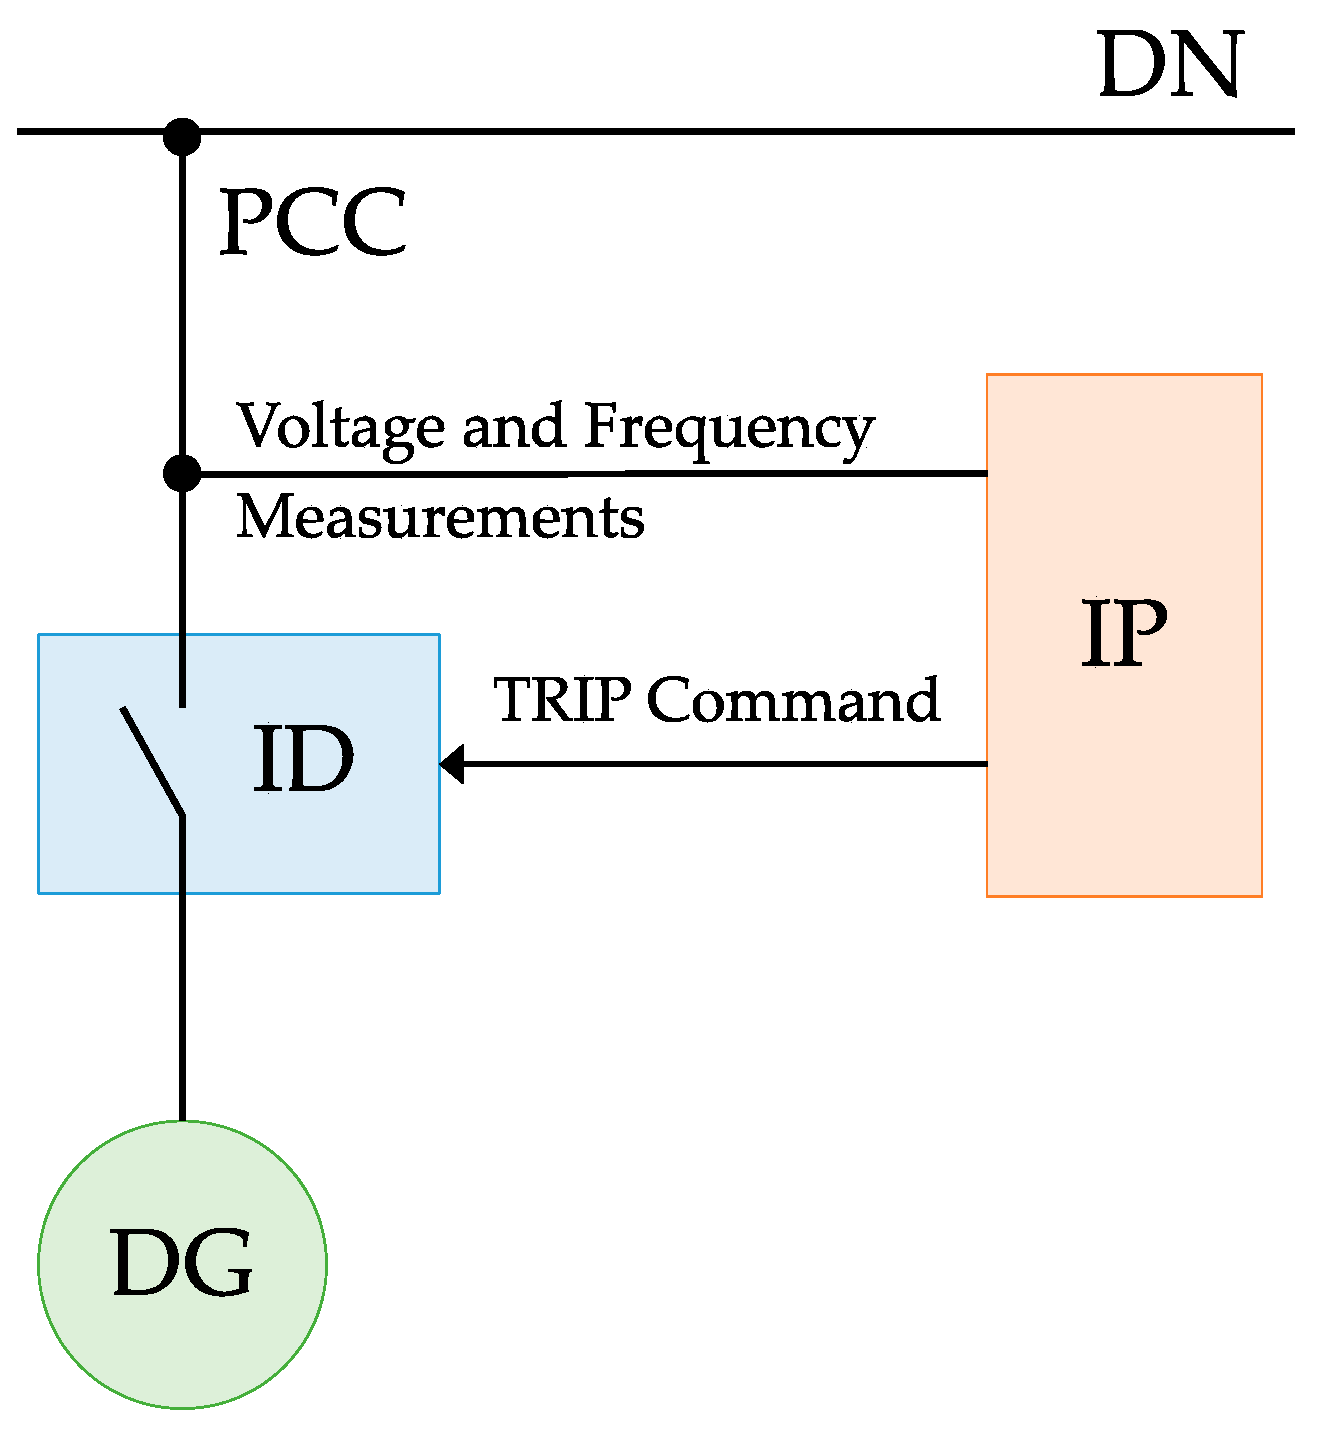
The schematic diagram in
Figure 1 represents the classic connection scheme of an IPS in its most simple configuration. The Interface Protection (IP) is the intelligent device that makes measurements of voltage and frequency values of the supervised DG unit. When an undesired islanding is detected, IP forces the disconnection of the unit from the main grid by opening the associated Interface Device (ID). The ID typically behaves as a normally opened (NO) circuit breaker driven by a “minimum voltage coil” with remote tripping contact. The couple formed by an IP and its related ID is one IPS. IPs and IDs may be combined into a single IED to create an IPS device. A single IP can drive more than one ID, depending on the specific system configuration.
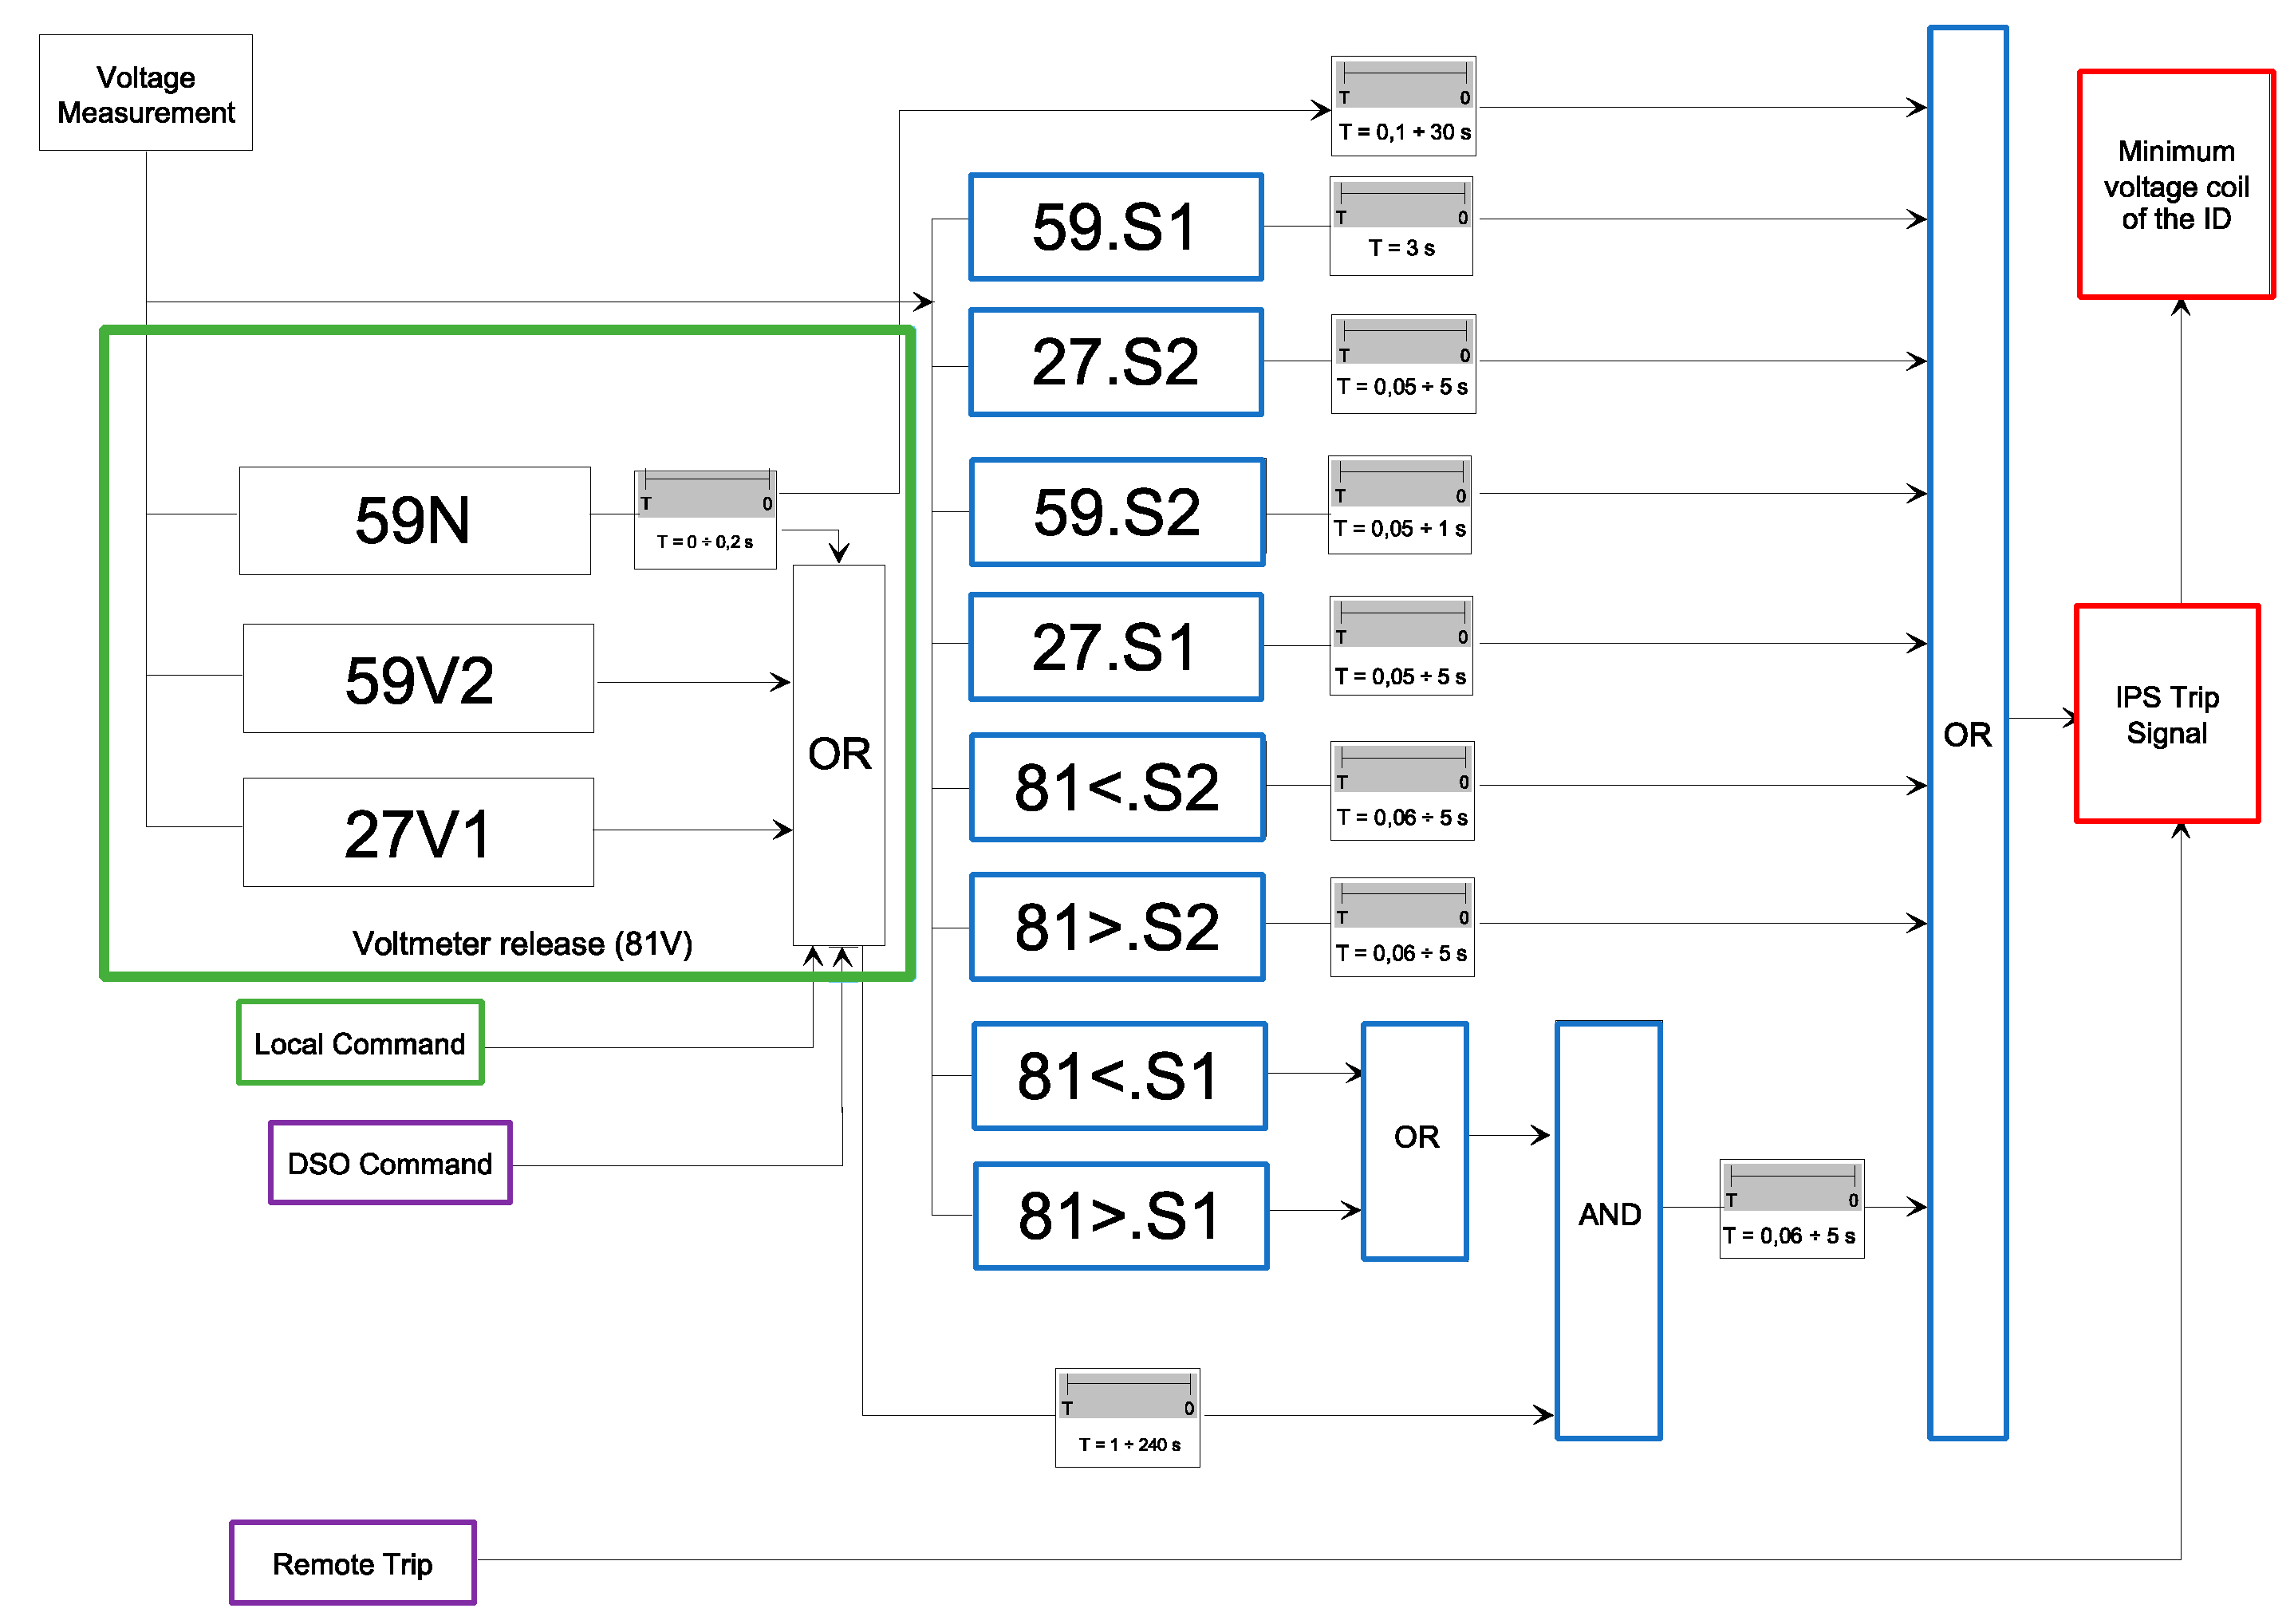
The protection functions implemented in IPSs are triggered by the violation of predefined acceptable bands of voltage and frequency values, which are measured by the IP or by external sensors. Further details on the definition and operation of typical IPS protection functions are reported in
Appendix A, by referring to the current Italian regulatory framework on the matter.
For what concerns the coordination of IPSs, it must be noted that, for systems equipped with several distinct generators (or, more generally, equipped with several distinct IPSs), a proper coordination mechanism among all of the installed IPSs must be provided to meet the requirements set by grid codes. In this case, when an anomaly is detected by an IPS, a coordination command must be provided to all the installed devices, causing the TRIP of all the IPSs installed in the system.
Finally, the capability of implementing remote TRIP signals from supervisory systems must also be taken into account. Depending on the specific system configuration, the installation of a remote TRIP system may be in fact required, by enabling the DSO to disconnect all the installed generators by means of remote signals. This must be applied in Italy, for instance, for systems with a total installed power greater than 100 kWp, connected to High Voltage (HV) or MV DNs, as defined by the regulation CEI 0-16, Annex M [
19]. In this case, a remote signal is sent by the DSO to one entry point installed in the user’s system (typically implemented by means of a GSM or GPRS receiver), which must be connected to all the user’s IPSs, in order to ensure the disconnection of all the supervised GD or ESS units. In addition, a proper “protection opening failure” monitoring system must be provided for each installed ID. It is worth noting that the regulation allows the installation of only one entry point per each user, thus requiring the installation of a proper IPS coordination system.
3. A Real-World Use Case: The Engineering Campus of the University of Brescia
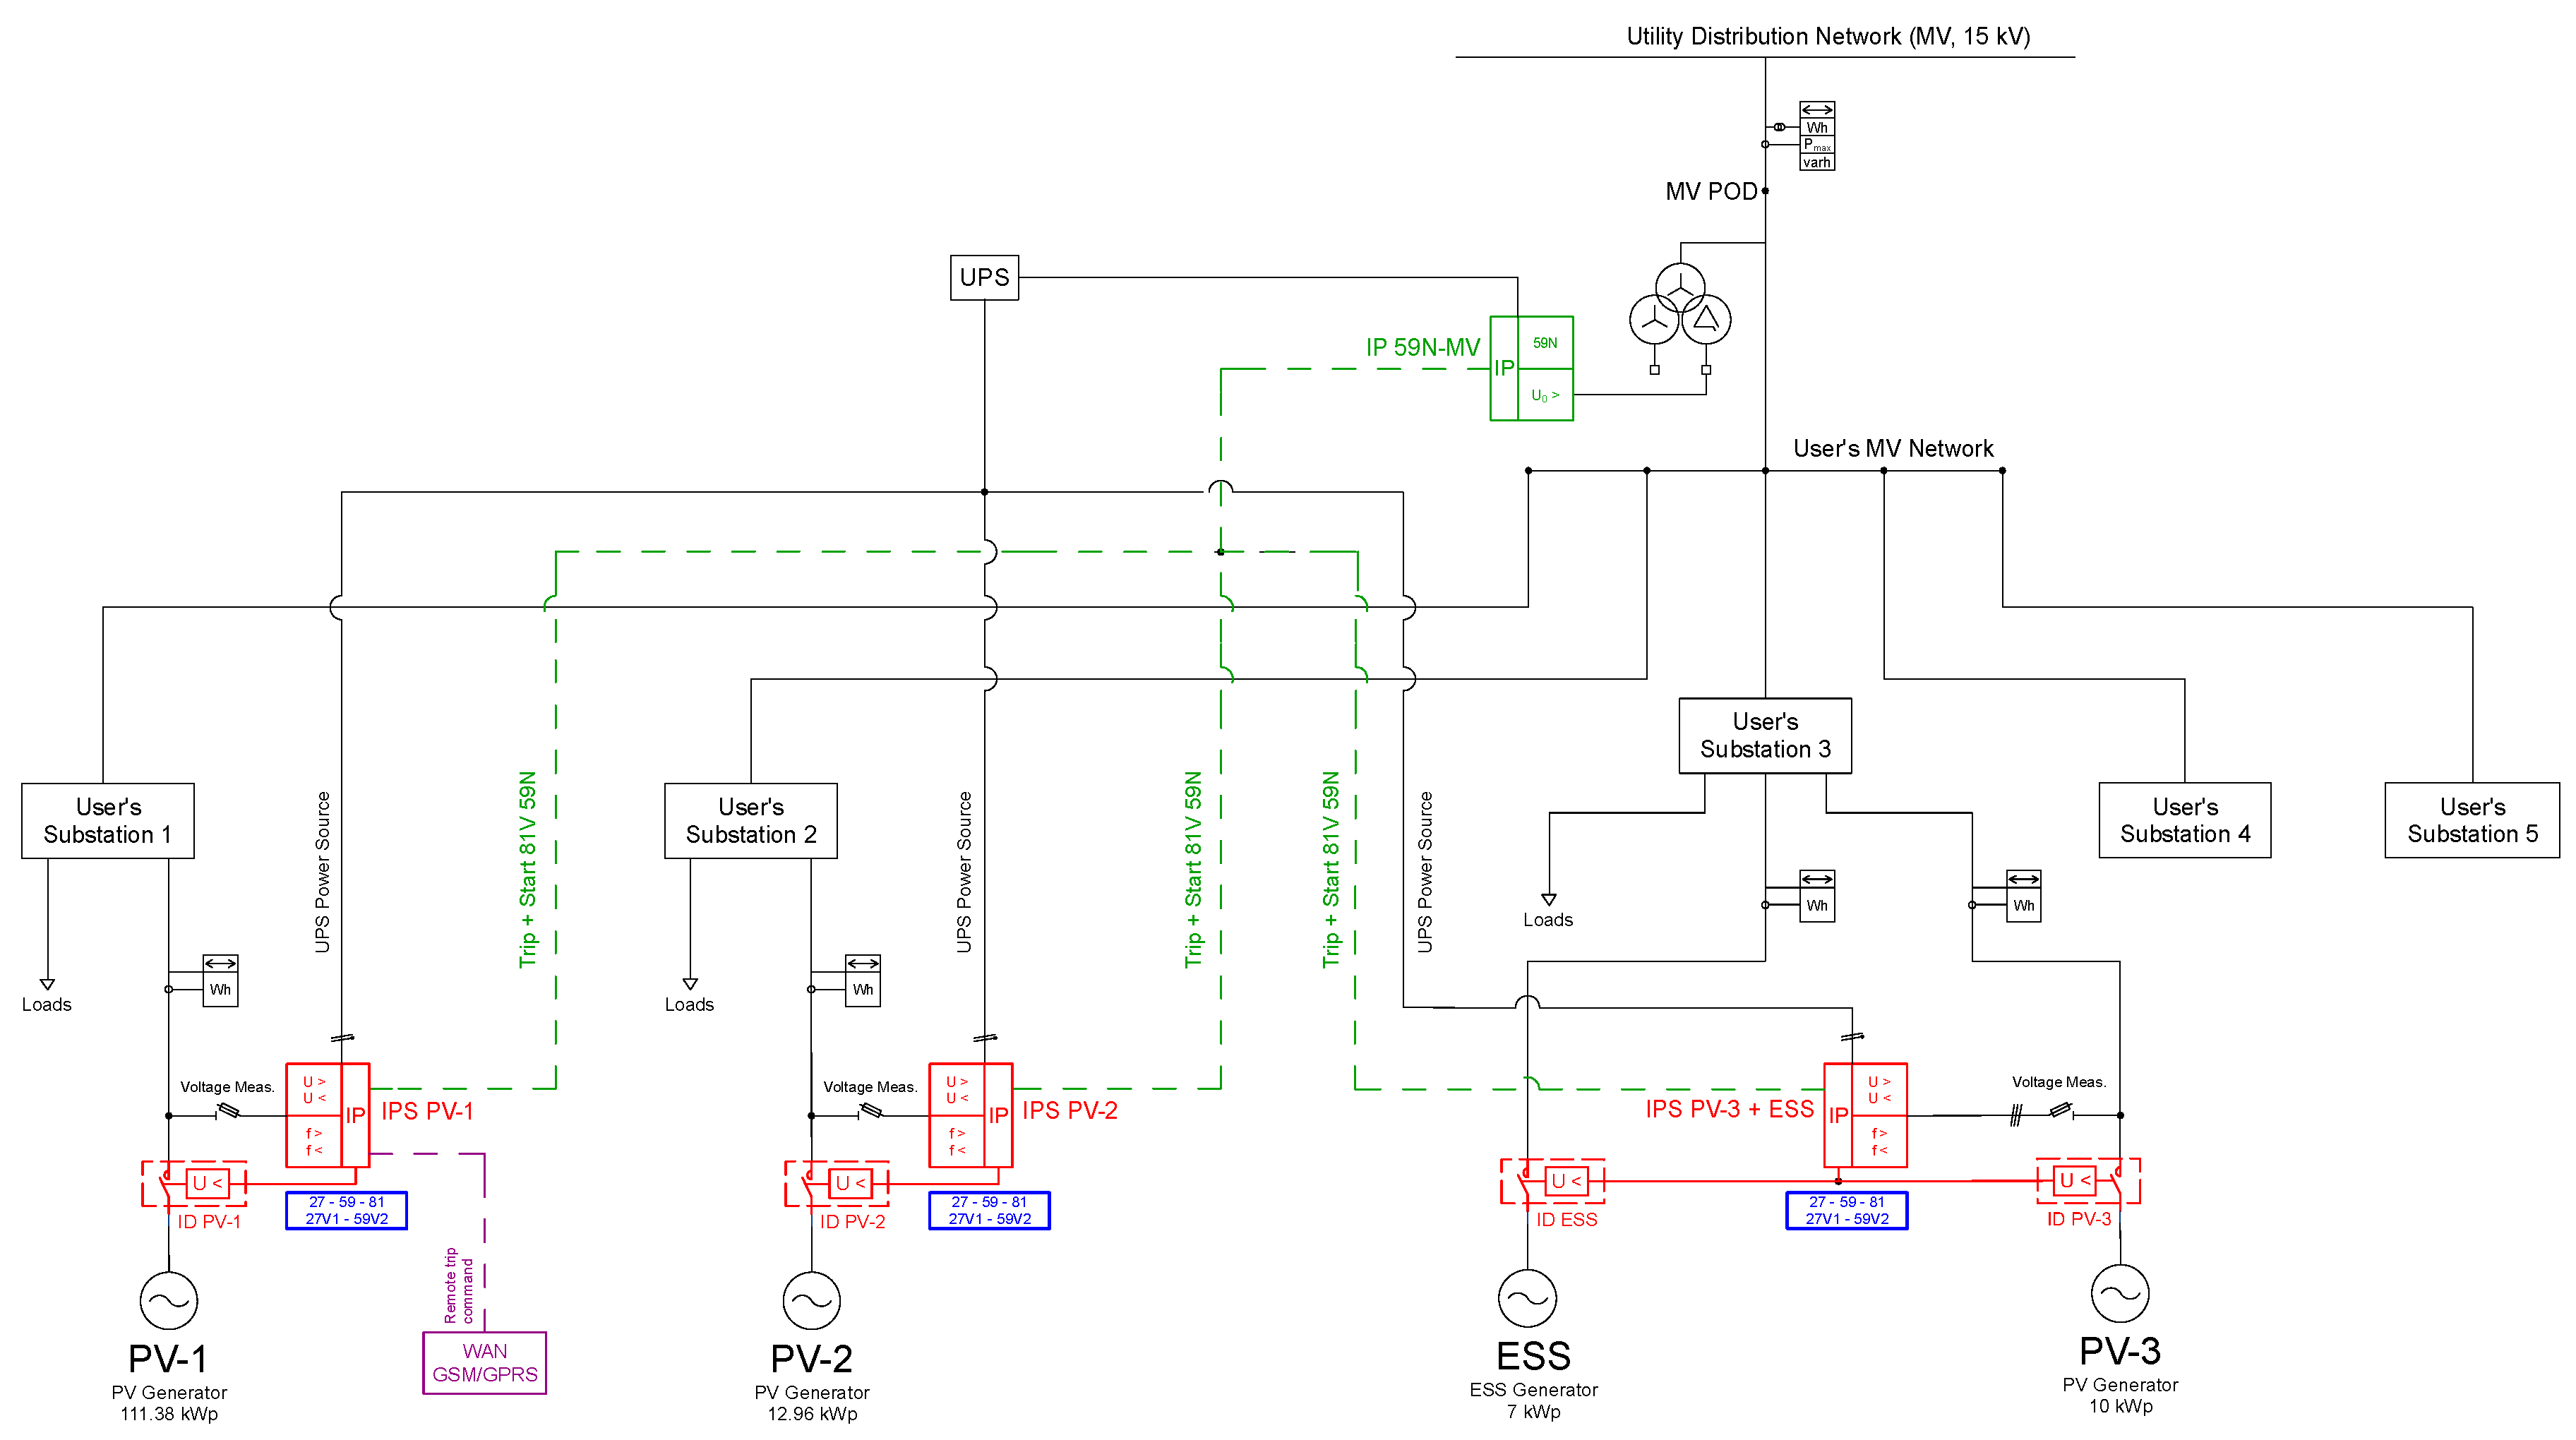
The Engineering campus of the University of Brescia is connected to a MV (15 kV) DN. The MV network of the campus has five MV/LV substations that, in turn, feed a complex system of LV lines.
Figure 2 shows the simplified schematic diagram of the electrical network of the campus, by focusing on the connection of the DG units to the main MV feeder, and on the configuration of their IPSs.
As shown by the schematic diagram of
Figure 2, the campus has three Photovoltaic (PV) power plants (10 kWp, 13 kWp and 111 kWp) and one ESS (molten salt—Na-NiCl
2) with a nominal capacity of 25.3 kWh, and a nominal power of 7 kWp. The PV systems are connected to different LV line of different MV/LV substation. The ESS is connected to the same LV line of the PV-3 system. More detailed information about the electrical equipment installed in the campus can be found in [
20].
The DG units of the campus are equipped with an IPS, which is connected to the respective LV line. In detail, three independent IPSs are installed: IPS-1 and IPS-2 (each connected to a single ID) are the protection of PV-1 and PV-2, respectively; IPS-3 protects PV-3 and the ESS (by means of two dedicated IDs with OR configuration). According with the current Italian regulation, the three IPSs have been configured as uncoordinated IPSs, i.e., without implementing the "OR logic" configuration. The three IPSs implement the protection function 59N through the indirect mode, by means of a dedicated IP (IP 59N) placed at the MV substation of the campus. Finally, a GPS device connected to the PV-1 IPS implements the remote TRIP signal provided by the DSO. Further details on the configuration of the communication system implementing the 59N function and the remote TRIP signal from the DSO are provided in
Appendix B.
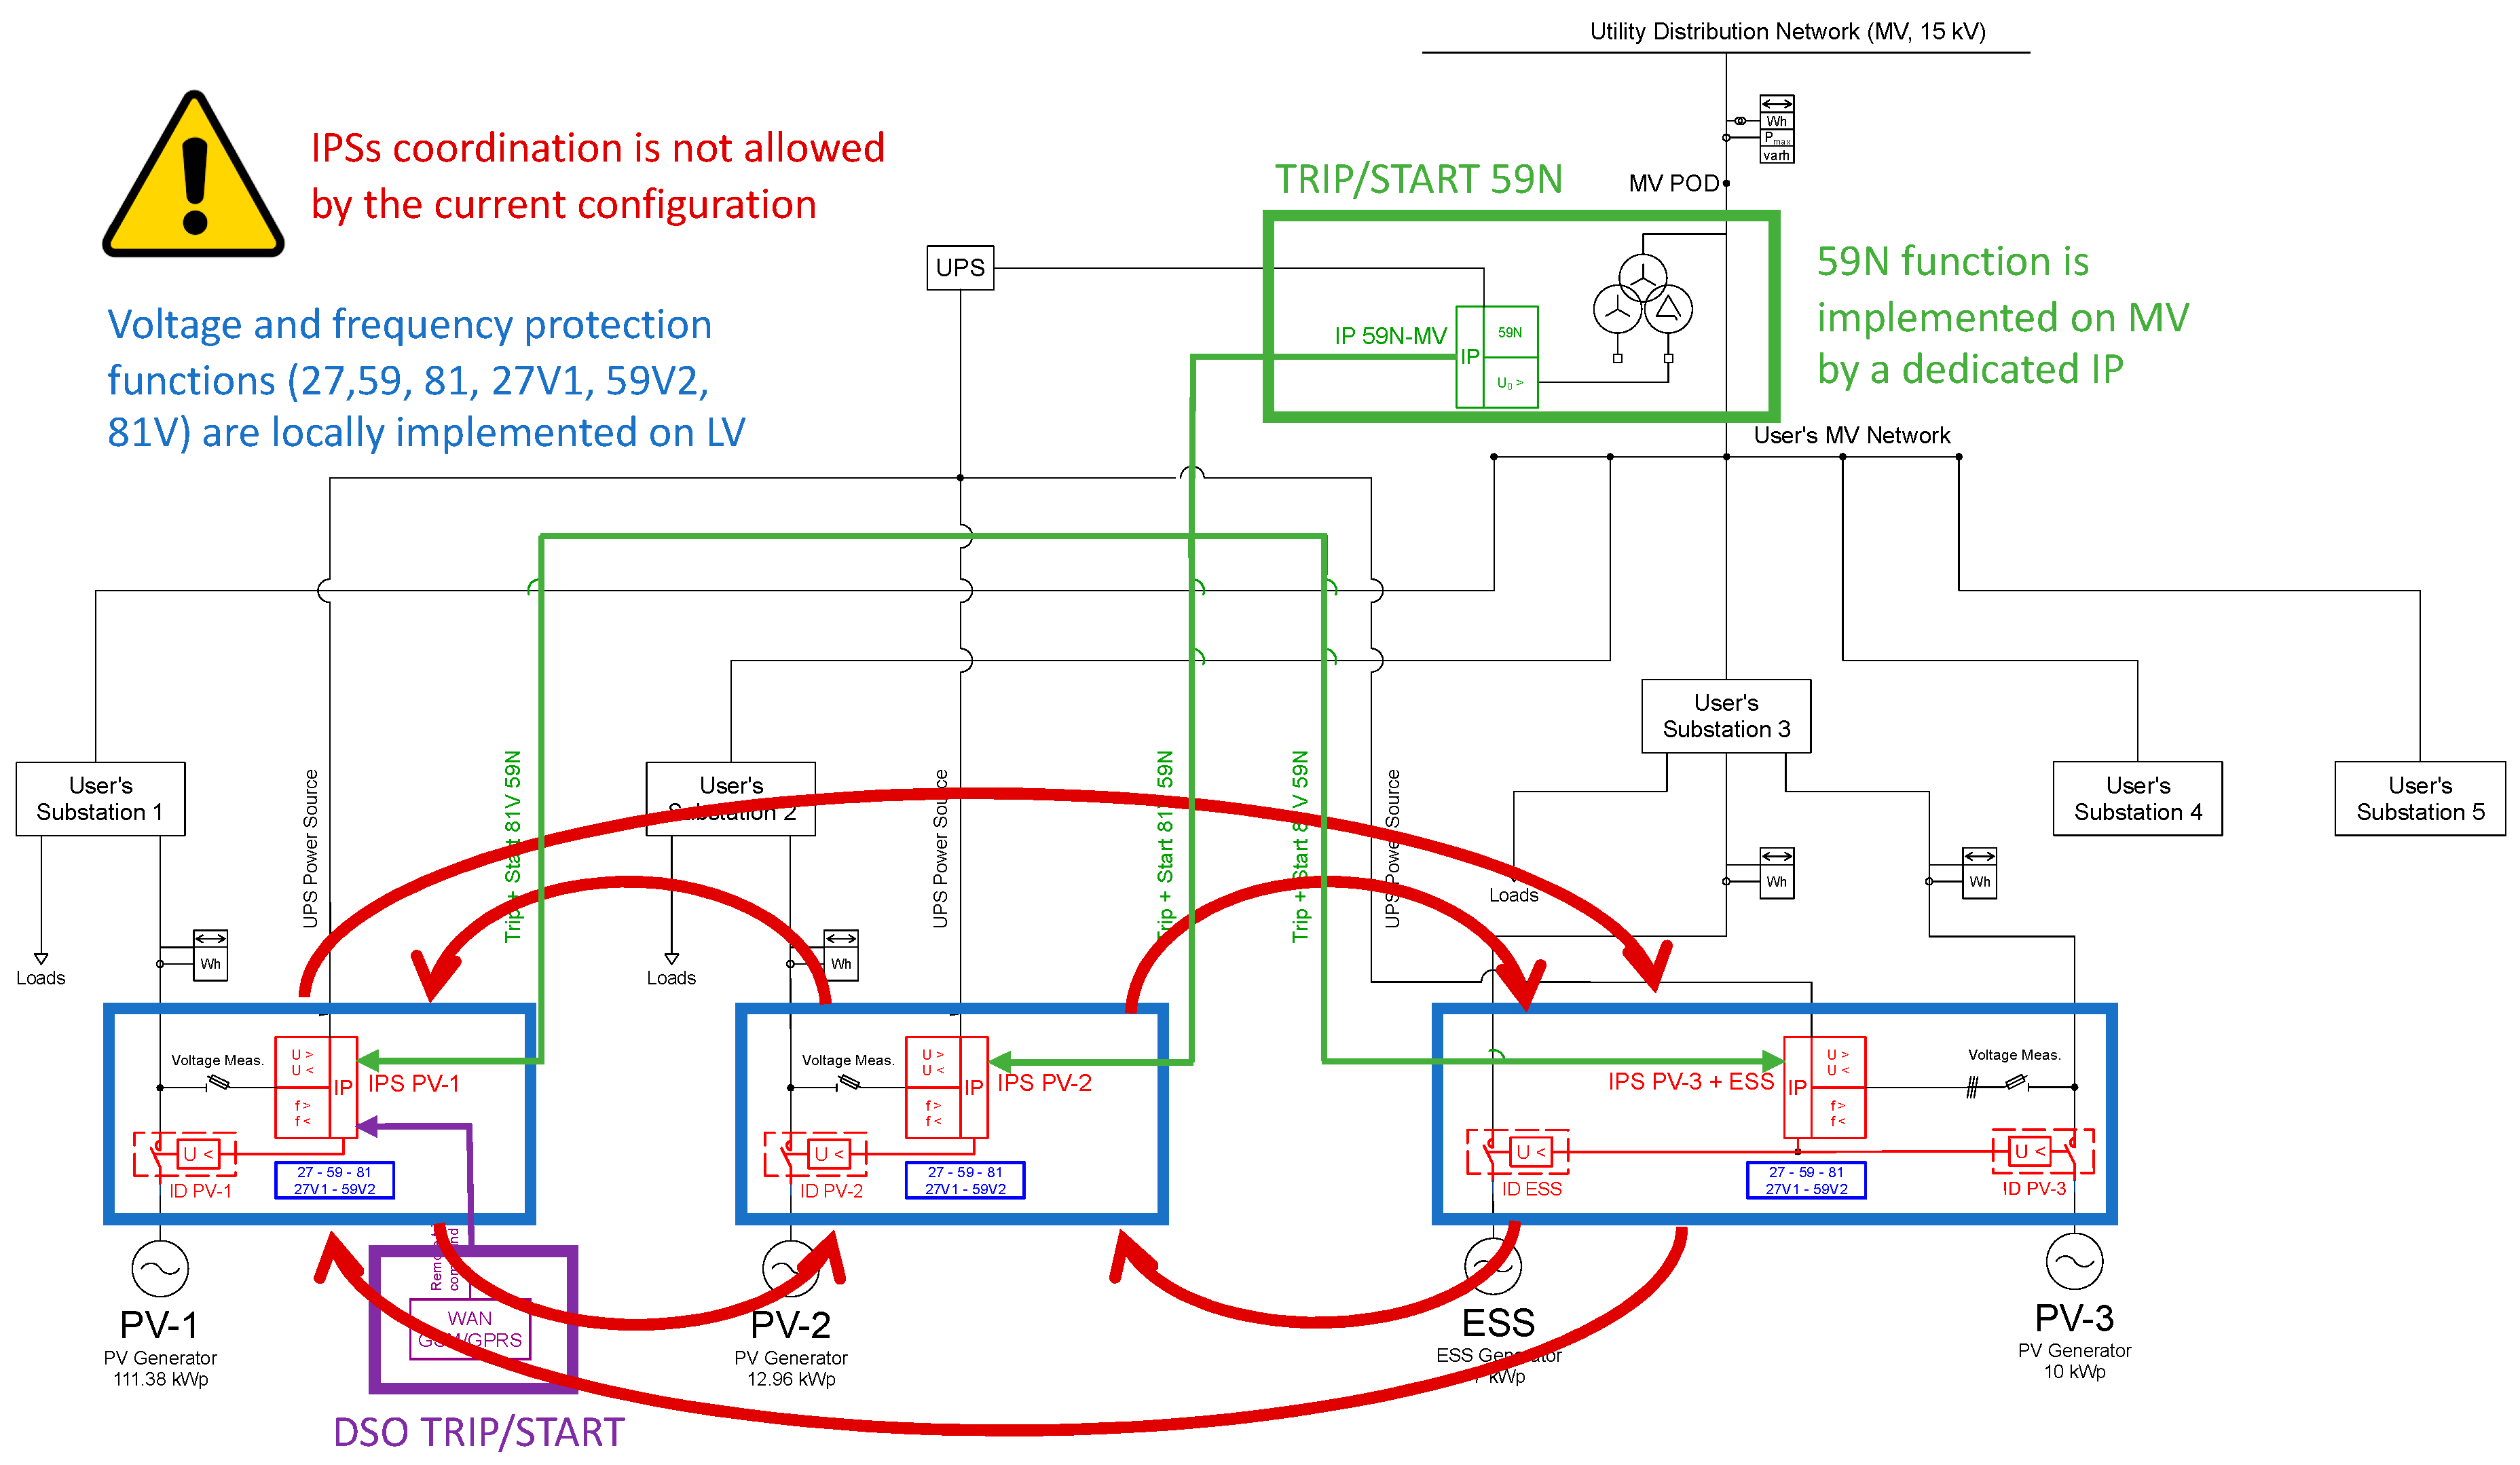
As schematically represented in
Figure 3, the main limitations of the IPS coordination system currently implemented in the campus can be summarized as follows:
High installation costs: the implementation of the remote 59N TRIP and START functions for the new PV system (PV-3) installed in 2016, required the installation of a dedicated analog circuit. In this case, the installation costs (including digs, operation in MV substations, etc.) reached thousands of euros, i.e., an amount of money comparable to that of the components of the PV system;
Scarce scalability: in the case of the installation of a new PV section in the campus, all of the existing IPSs will require a much more complex coordination system, due to the need of the implementation of the “OR logic" configuration (currently not applied, thanks to the limited number of installed IPSs);
Low reliability and high maintenance costs: the use of a coordination system based on analog signals is less reliable and maintainable than a system based on digital signals. The current configuration, in fact, requires technical personnel to continuously monitor all the analog connections to guarantee the correct operation of the DG units;
Scarce flexibility: in the case of future (and most probable) modifications to the current regulatory framework, e.g., involving the coordination between protections, remote trip or power limitation commands, etc., the current solution would not allow updating actions, but it would require a complete system reconfiguration by making use of a dedicated digital communication network.
According to the previous discussion, it is clear that the coordination of smart IPSs can take a lot of advantages from the adoption of a digital communication system. Wired solutions based on the widespread Ethernet (over copper or optical fiber links), which generally offer better performance, suffer from higher installation costs. The adoption of PLC is limited to IEDs of the same LV substation and does not satisfy needs for addressing IPSs sparse in complex MV/LV user’s networks.
In this work, the adoption of the LoRaWAN technology is suggested as a viable wireless approach, permitting to lower the installation and maintenance costs. Indeed, the considered application does not require high data throughputs and can take advantage from the large area coverage in both indoor and outdoor scenarios.
4. The LoRaWAN Technology
Despite several different Low-power Wide Area Network (LPWAN) solutions having been proposed in the recent past, most of the already deployed applications leverage on the LoRaWAN technology. The radio link is implemented via a proprietary chirp spread spectrum modulation, developed by Semtech and named LoRa. On the contrary, protocols of the upper levels are managed by the LoRa Alliance, who managed the drafting of the LoRaWAN specifications. The aim of the specs is to describe the medium access strategy and the overall system architecture, including the functionalities of the backend.
In particular, any LoRaWAN network can be split into two tiers. The first one is the wireless tier, providing a single-hop connectivity between end nodes and gateways (GWs). It has to be stressed that the very high sensitivity of the radio, complemented by the processing gain obtained by enlarging the symbol duration (set by a parameter called Spreading Factor—SF), allows for a large area coverage, minimizing the impact of the star only topology, chosen for the needs for efficiency and low power consumption. The role of the gateways is to tunnel radio messages (in the uplink or downlink directions, depending if they are transmitted or received by the end device) towards the backend, in which the Network Server (NS) takes care of the resource assignment, while the Application Server (AS) offers services for implementing the actual end user application. Regarding possible limitations, it has to remembered that LoRa radio operates in sub-GHz unlicensed bands and must cope with regional regulations in terms of duty-cycle and transmission power.
End devices are grouped into three classes, depending on how downlink is managed. The basic class, which includes a minimal set of functionalities, is the Class A; downlink must follow an event-based uplink, thus permitting the end devices to decide when to start the transmission and possibly to spend most of the time in a low-power sleep mode. Synchronized downlink messages are permitted by Class B. Continuous listening, allowing for completely asynchronous downlink, is added in Class C. It is evident that typical IoT applications, targeted by LoRaWAN, match the Class A behavior well, as confirmed by the few Class B solutions actually deployed.
Time dissemination in Class B occurs via Beacon transmission, i.e., well-defined messages transmitted every Beacon period TB by GWs. If Beacons are lost for more than two hours, the node turns back into the Class A mode. The TB interval is discretized into 4096 ping slots lasting each one 30 ms (and TB = 128 s, thus including an additional guard time). Downlink messages are permitted on ping slot edges; an end device can be configured to listen at the ping slot N, so that it has to turn on the receiver after Ton from the Beacon reception, where Ton = 2.12 s + (offset+N·TP)·30 ms and TP is the ping period, representing the actual device wake up interval. In particular, TP = 4096/Nb, where Nb = 2k, k = 0...7. A pseudo-random offset, changed every Beacon period, is added to reduce the risk of collisions and the overhearing; such an offset can range from zero to TP. As a consequence, the minimum ping period is TP,min = 960 ms, obtained with k = 7. Class B and Class C also introduce the concept of multicast messages, opposed to unicast. By the way, many devices can belong to a multicast group (identified by a single multicast address and provided with a multicast enciphering key). However, the actual mechanism permitting multicast communications is out of the specifications scope and depends on the actual LoRaWAN implementation.
The success of LoRaWAN is demonstrated by the huge literature available. In particular, some works already highlighted the tradeoff between the application update rate and the number of nodes in a network [
21,
22]. However, it has to be highlighted that most of the results are limited to Class A devices, whereas very few extend the analysis to Class B [
23,
24].
Leveraging on a part of the results described in previous authors’ work [
25,
26,
27], some considerations about the coverage of a single gateway, limited by the actual link budget, can be sketched. In particular, if a typical outdoor urban scenario is taken into account, previous experiments demonstrated that the communication range is on the order of few kilometers. When indoor scenarios are addressed, the very high sensitivity of LoRa radios still permits covering multiple rooms located on different floors.
5. The Proposed Communication Architecture
A schematic block diagram representing the proposed LoRaWAN communication architecture for the coordination of smart IPSs is depicted in
Figure 4.
It has to be highlighted that previously introduced end device classes only refer to the way the downlink messages are managed, whereas uplink messages are always handled in the same way. In the considered application, power supply is not a stringent constraint, and Class-C operation could be a useful choice for reducing the latency in receiving messages from the IPSs coordinator. However, it is well-known that the ALOHA-like random access medium access strategy adopted in LoRaWAN has limited throughput (despite the time and power capture effects mitigating the worst case 18% of pure ALOHA) that is also severely affected by uncoordinated downlink transmissions [
28]. The easiest way to improve the overall network performance is to provide some synchronization strategies for coordinating message transmissions, reducing the vulnerability time (i.e., the time interval in which the sent frame can suffer from collisions). It could be possible to implement a time dissemination mechanism for a Class-C device, but this would completely depend on the application layer implementation, thus greatly lowering the time accuracy. On the contrary, Class-B defines the Beacon-based synchronization mechanism implemented at the data link level. The Class-B downlink message transmission follows a Slotted-ALOHA-like medium access strategy, enhanced by further adding slot selection randomness to reduce the frame collision probability. Moreover, it has also to be underlined that Class-C extends the RX2 window, which, as reported in the specifications, “uses a fixed frequency and data rate”. Thus, a change in the data rate affects all messages received in the RX2 window, including those related to Class-A devices. On the contrary, Class-B allows for specifying a data rate for synchronized downlink messages only, resulting in a more flexible approach. For all these reasons, in this work, Class-B operations have been considered.
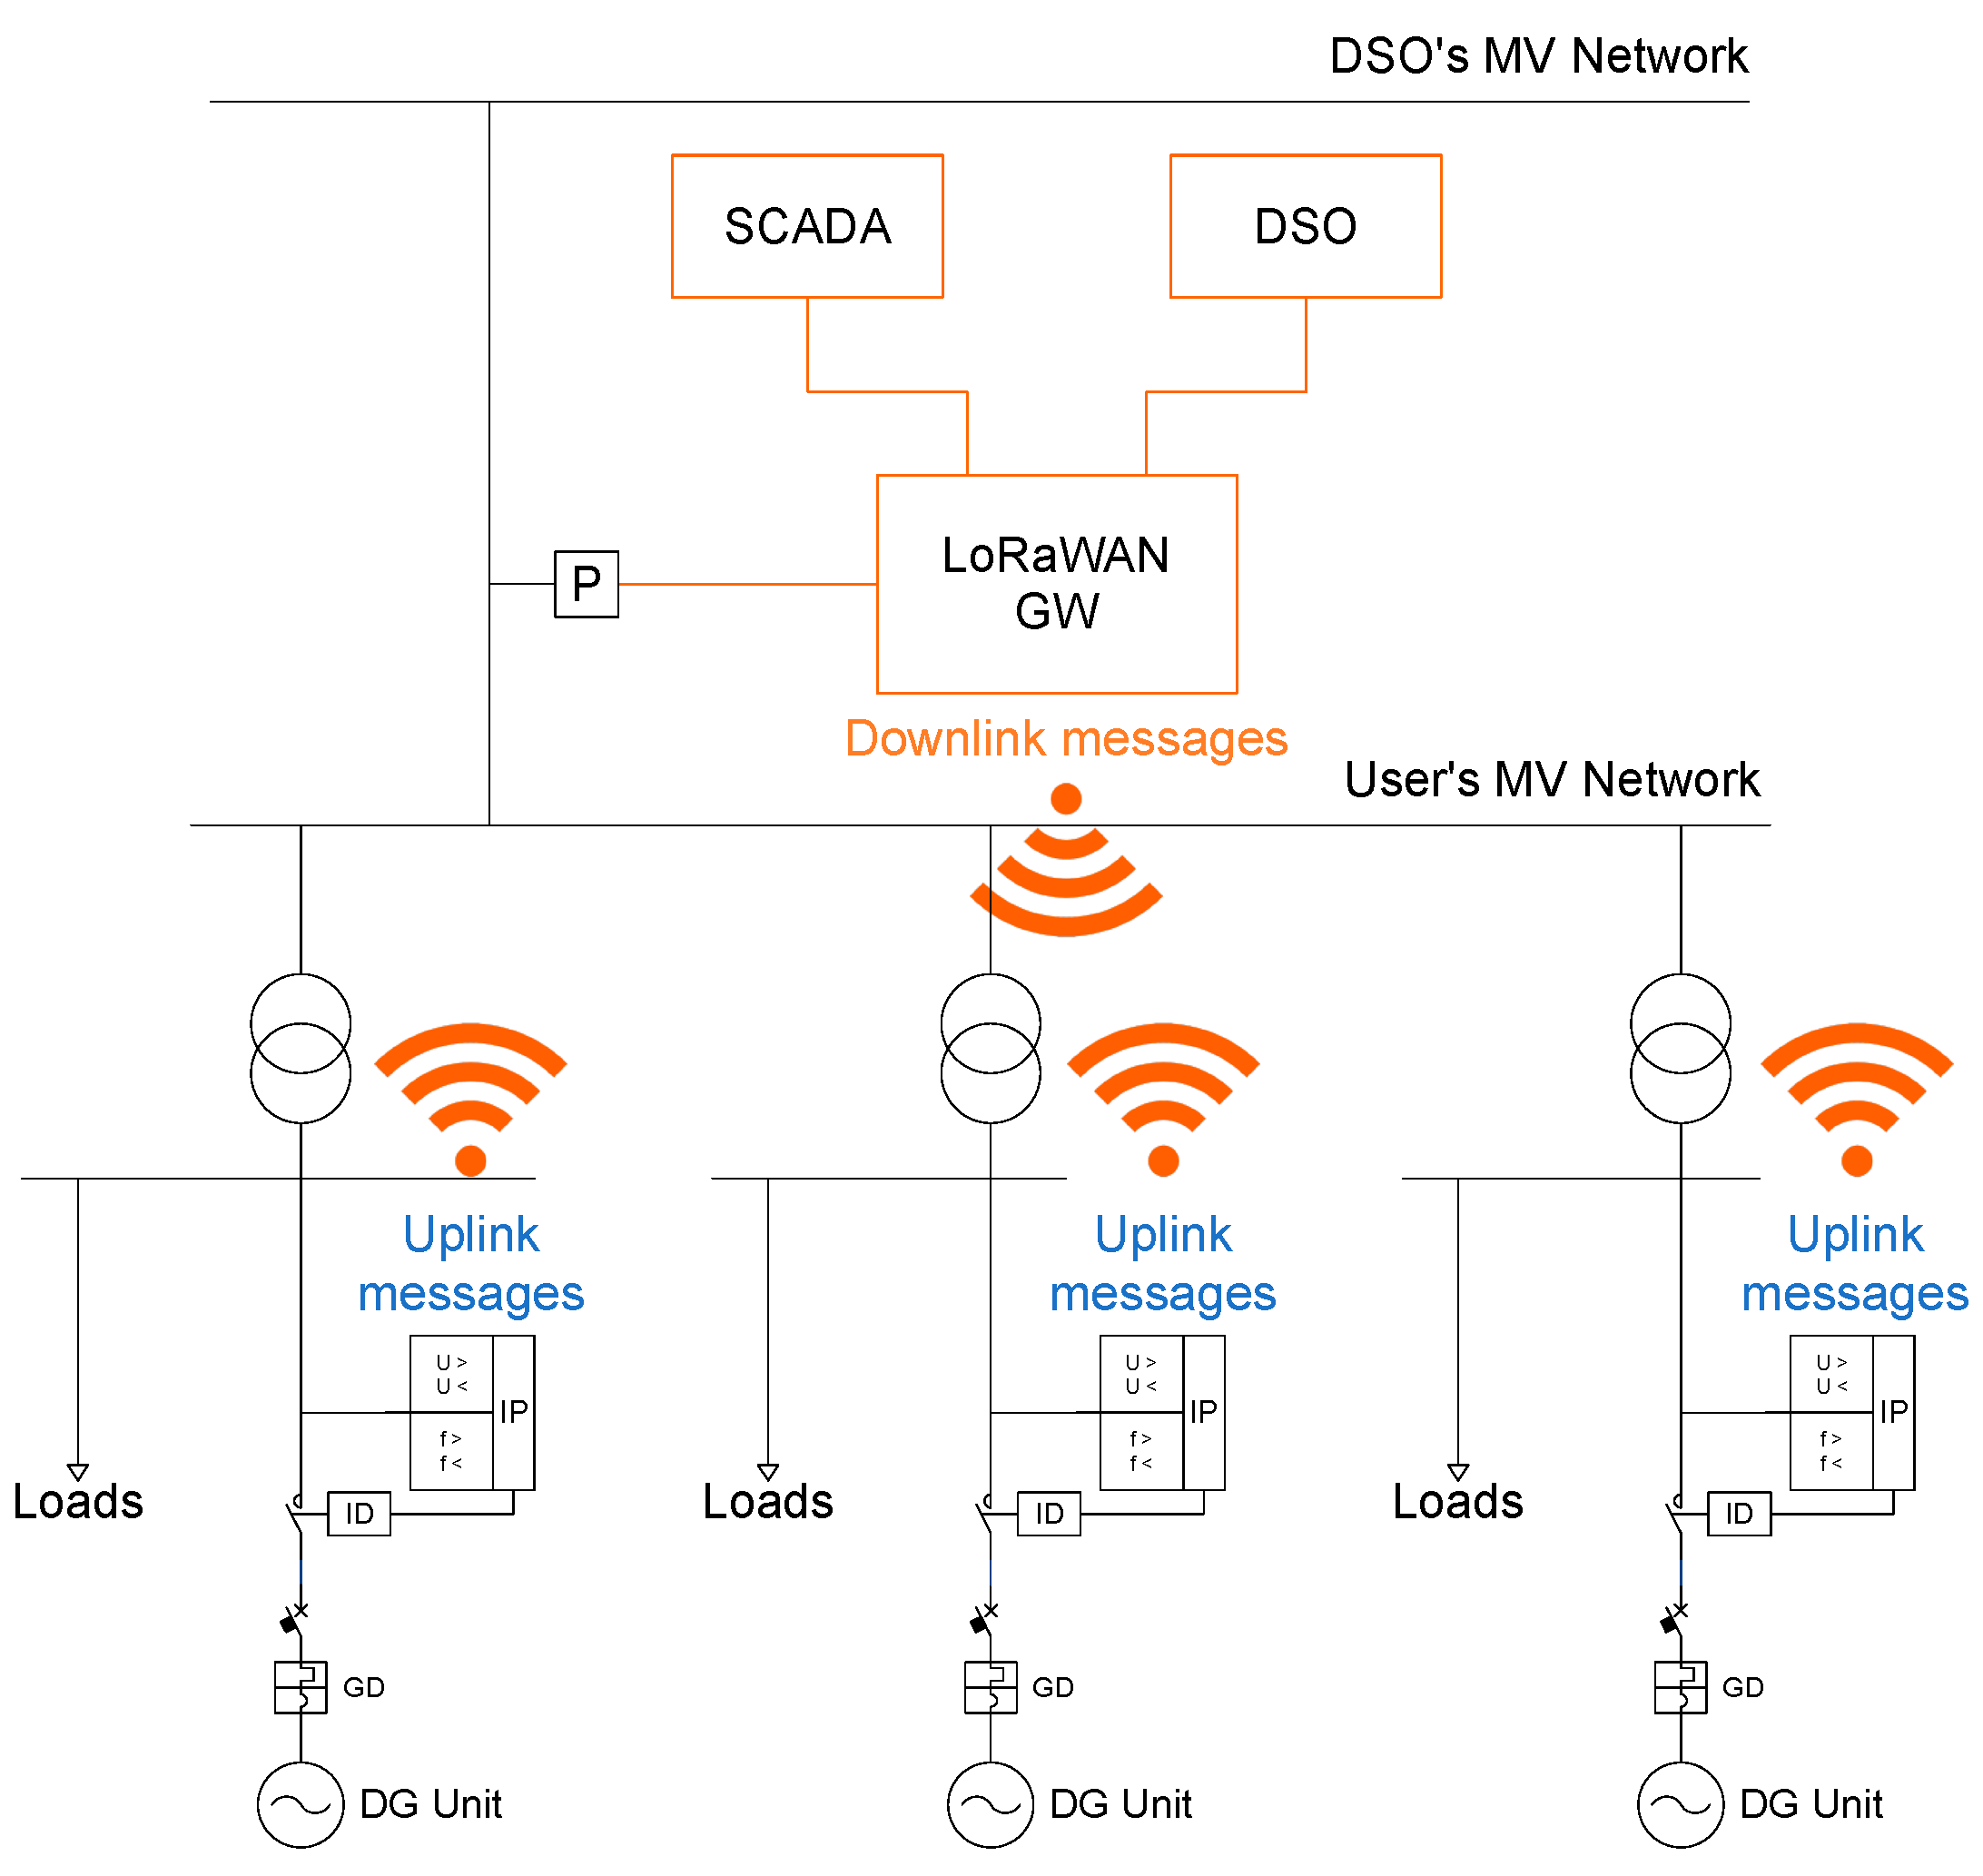
In the typical scenario, as that depicted in
Figure 5, a GW is located close to the PCC with the main MV utility grid, while the backend servers allow all the different type communications required by the considered application, i.e., with other smart protections installed in the user’s main substation; with the DSO communication infrastructure (e.g., for the provisioning of remote signals); and with the user’s local network (e.g., for the system monitoring). Each IPS is connected to or embeds a LoRaWAN node. Indeed, digital input can be used for legacy IPs, while direct integration can be considered for new smart IPs.
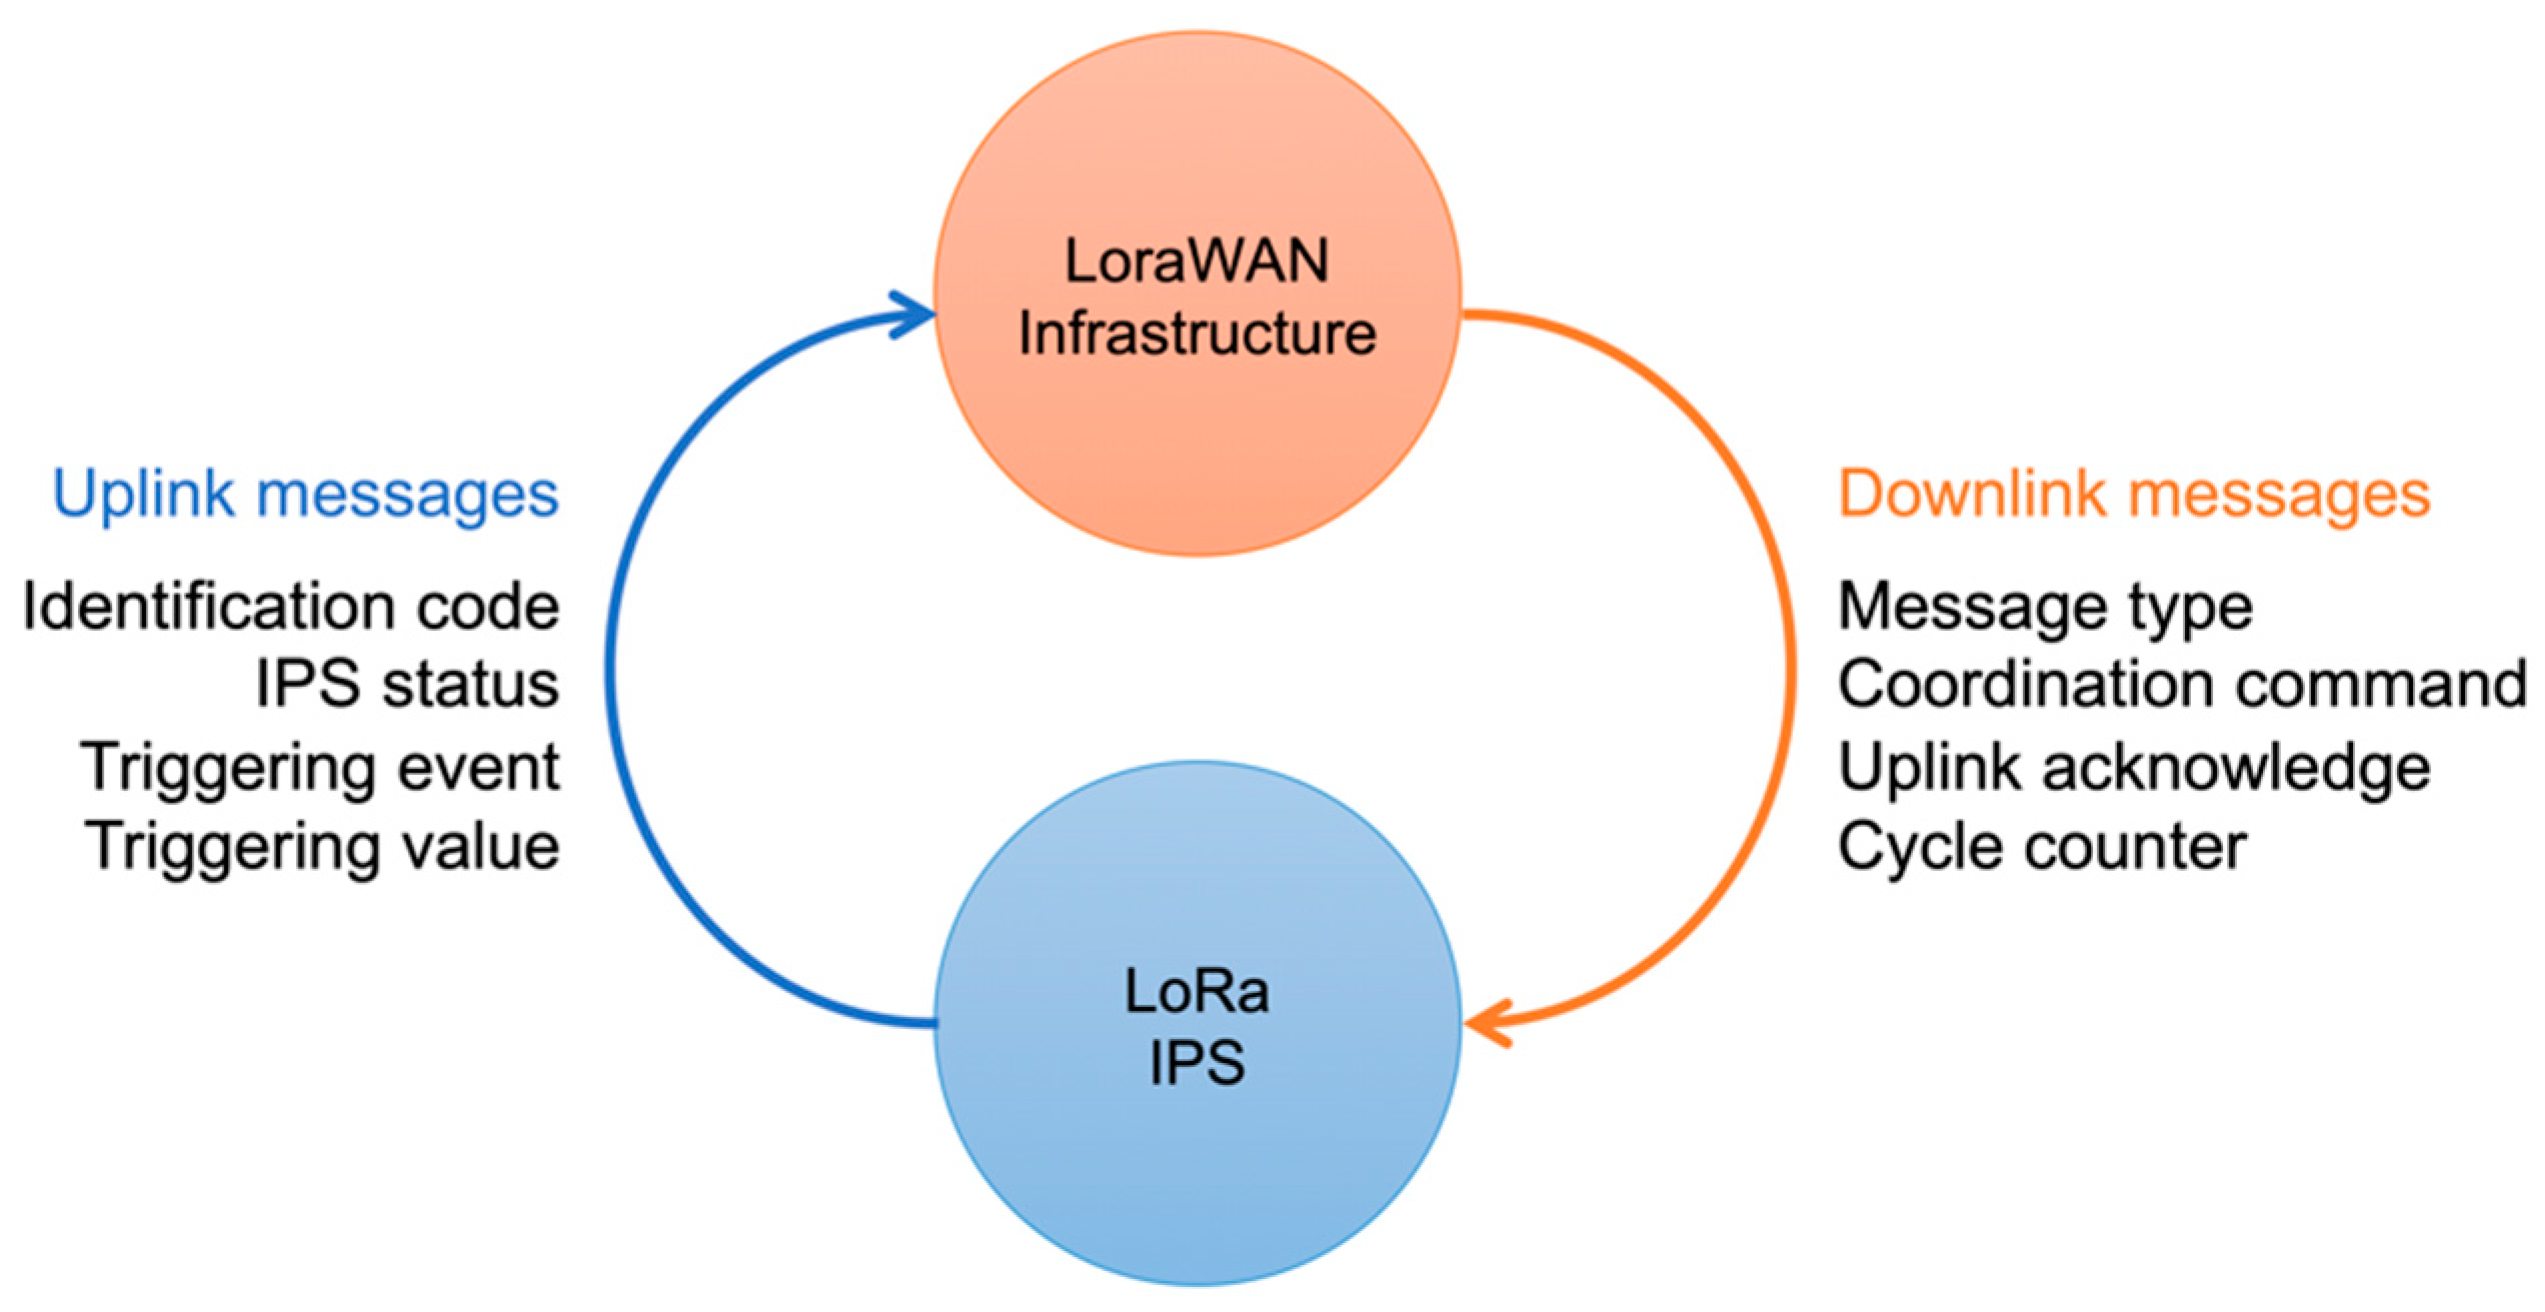
Each IPS transmits uplink messages containing its identification code, the operating status (i.e., normal versus TRIP or START mode), the triggering event (if any, as the triggered protection function), and, possibly, the triggering value (i.e., the voltage or frequency value, or the connection timeout, causing the protection function activation). The IPS identification code can be configured by the system (i.e., by the application server) and is used to allow the implementation of the monitoring of the communication between the IPS and the LoRaWAN infrastructure.
The possible time interval between consecutive uplinks can be on the order of few seconds, depending on the adopted SF, on the number of coordinated nodes, and on the selected
TP value. The data model describing the structure of uplink messages is presented in
Table 1. Based on the proposed data model, a 5 B message must be transmitted by IPSs to the LoRaWAN infrastructure for each uplink transmission.
On the other hand, once the system is configured, multicast messages are sent to all the LoRaWAN-enabled IPSs, in order to coordinate the devices in the occurrence of possible islanding events detected in the system. Possible coordination commands include: the TRIP of all of the installed IPSs generated by the TRIP of a single IP of the system (i.e., the application of the “OR logic” configuration); the TRIP or START of all of the installed IPSs following a residual voltage violation event; and a remote signal (e.g., TRIP, START, or 81V commands) triggered by the DSO. For the sake of robustness, an acknowledge field is embedded in the downlink message to monitor the communication status, as required by the regulatory framework. The data model describing the structure of downlink messages is presented in
Table 2.
The “message type” field is considered to allow the distinction between configuration messages (used during the first configuration of the system, e.g., for the assignment of IPS identification codes) and normal operation messages. The “coordination command” field is used to send commands to all the installed IPSs and can support up to 256 different commands. The acknowledge message is transmitted as a bitmap, where each n-th bit represents the success (bit = 1) or the fail (bit = 0) of the receipt of the m-th uplink message from the n-th node. Each m-th uplink message is traced by both the nodes and the GW by means of a counter, represented by the “cycle counter” field in the data model. The counter is reset (by all the nodes and by the GW) at each beacon message. In particular, the size of the acknowledge message depends on the expected number of IPSs which must be coordinated by the system. Since the maximum allowed size of a LoRaWAN message is limited to 51 B (if all the possible SF values are used), the maximum size of the acknowledge message is of 48 B, corresponding to a maximum of 384 allowed IPSs per network.
6. Scalability and Sensitivity Analyses
The aim of the scalability and sensitivity analyses is to determine the number of IPSs that can be handled by a single LoRaWAN gateway and the maximum expected time of response between a triggering event and the arrival of the related coordination command. The analyses were carried out by computing, per each SF (with SF ranging from 7 to 12) the Time-on-Air (ToA) duration of the monitoring and supervisory control messages introduced in the previous section. Different scenarios have been considered by varying the maximum number of mapped IPSs (i.e., by varying the size of the acknowledge message defined in the data model) and the value of the ping period TP.
Referring to the data model introduced in the previous section, every ping period, a 5 B uplink message is transmitted by each IPS to the LoRaWAN infrastructure, while a single multicast downlink message is transmitted by the LoRaWAN infrastructure to all the IPSs installed in the system. If we call R the size (in B) of the acknowledge message, the size (in B) of the multicast downlink message is equal to 3+R. Since R can vary between 1 B and 48 B, the total size of each downlink message ranges between 4 B and 51 B.
Since the size of all the uplink messages is fixed, the duration of each uplink transmission,
ToAU, depends only on the selected
SF. Conversely, since the size of the multicast downlink transmission depends on the number
M of mapped IPSs (with
M = 8·
R), the duration of multicast downlink transmissions,
ToAD, depends both on
M and on the selected
SF. If we consider that, during each ping period (with a duration
TP), the time reserved for uplink messages is equal to
TP −
ToAD, the maximum number of nodes per channel that can be managed by a single GW in a synchronized scenario, per each
SF, can be computed as follows:
where
nsync(
SF) is rounded to the lower positive integer. Once the value of
nsync(
SF) is determined, the maximum number of nodes per channel assuming the pure ALOHA access is determined as
nALOHA(
SF) =
ALOHA·
nsync(
SF), by assuming
ALOHA = 18%. The value of
nALOHA(
SF) is rounded to the lower positive integer. The value of maximum nodes per each
SF is then computed by considering the adoption of the three compulsory LoRaWAN channel, and limited to the maximum number of mapped devices as defined in the data model definition:
Finally, the maximum number of nodes that can be managed by a single GW is determined by considering all the available
SF, and limited to the maximum number of mapped devices as defined in the data model definition:
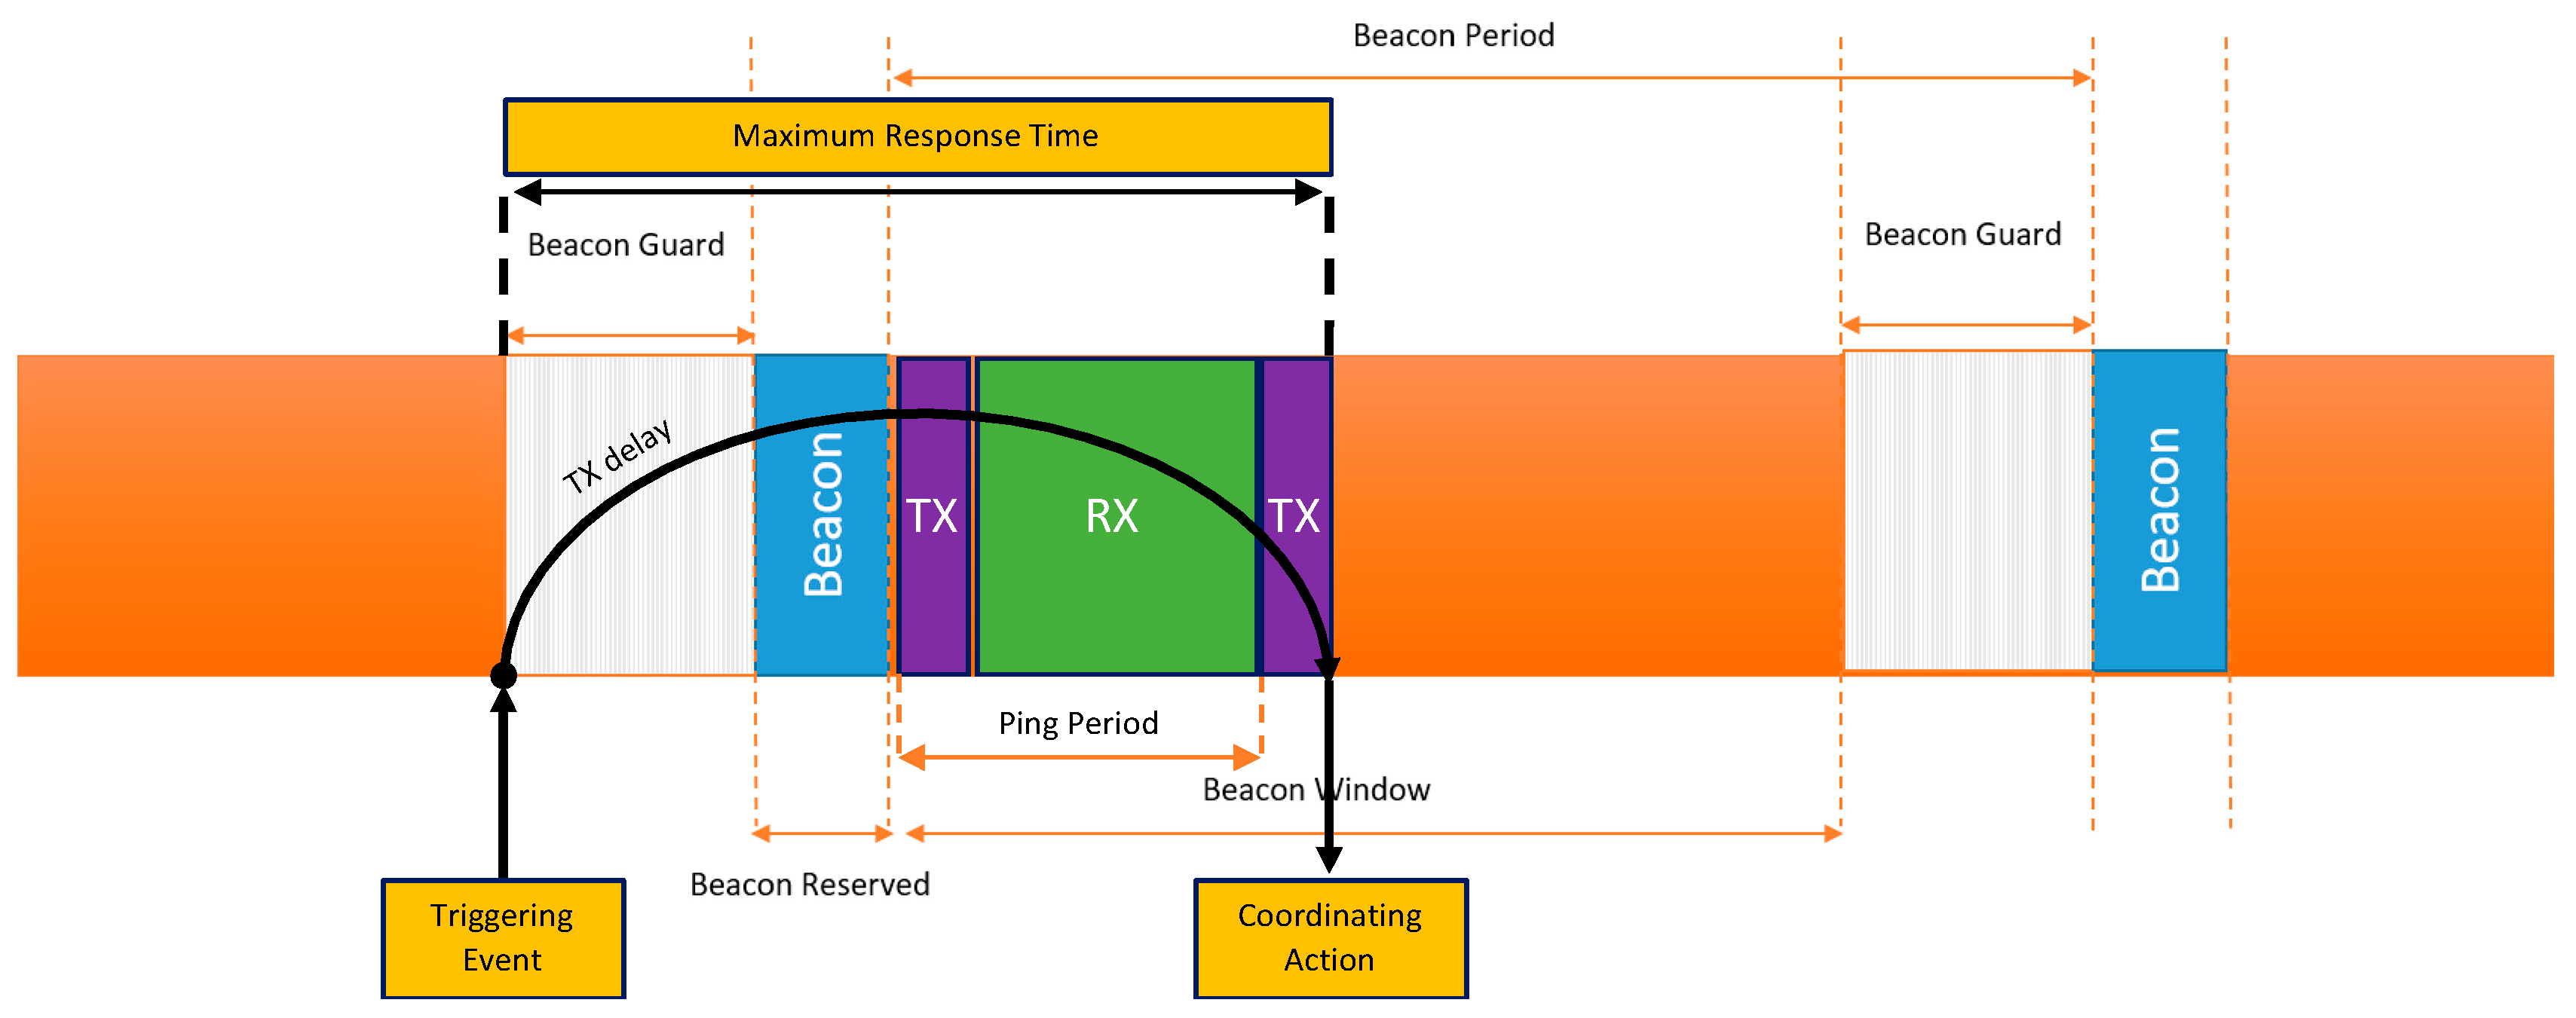
The maximum expected time of response between a triggering event and the arrival of the related coordination command is computed by assuming the scenario depicted in
Figure 6.
In this case, the triggering event (e.g., the TRIP of an IP) causing the need of a specific coordination command occurs just before the start time of the beacon guard time, and the related message is not immediately transmitted by the node to the GW. After the beacon guard time (
TBG) and the beacon reserved time (
TBR) have elapsed, the GW turns into the transmit mode, and then the triggering event message is transmitted by the node to the GW. Independently from the time of receipt of the triggering event message, an entire ping period
TP must have passed before the related coordinating message is sent to all the installed IPSs. If this scenario is assumed, the maximum expected time of response
TR depends on the considered ping period, by the number of mapped IPSs and by the selected
SF. In particular,
TR can be computed as follows:
where
TBG = 3 s and
TBR = 2.12 s.
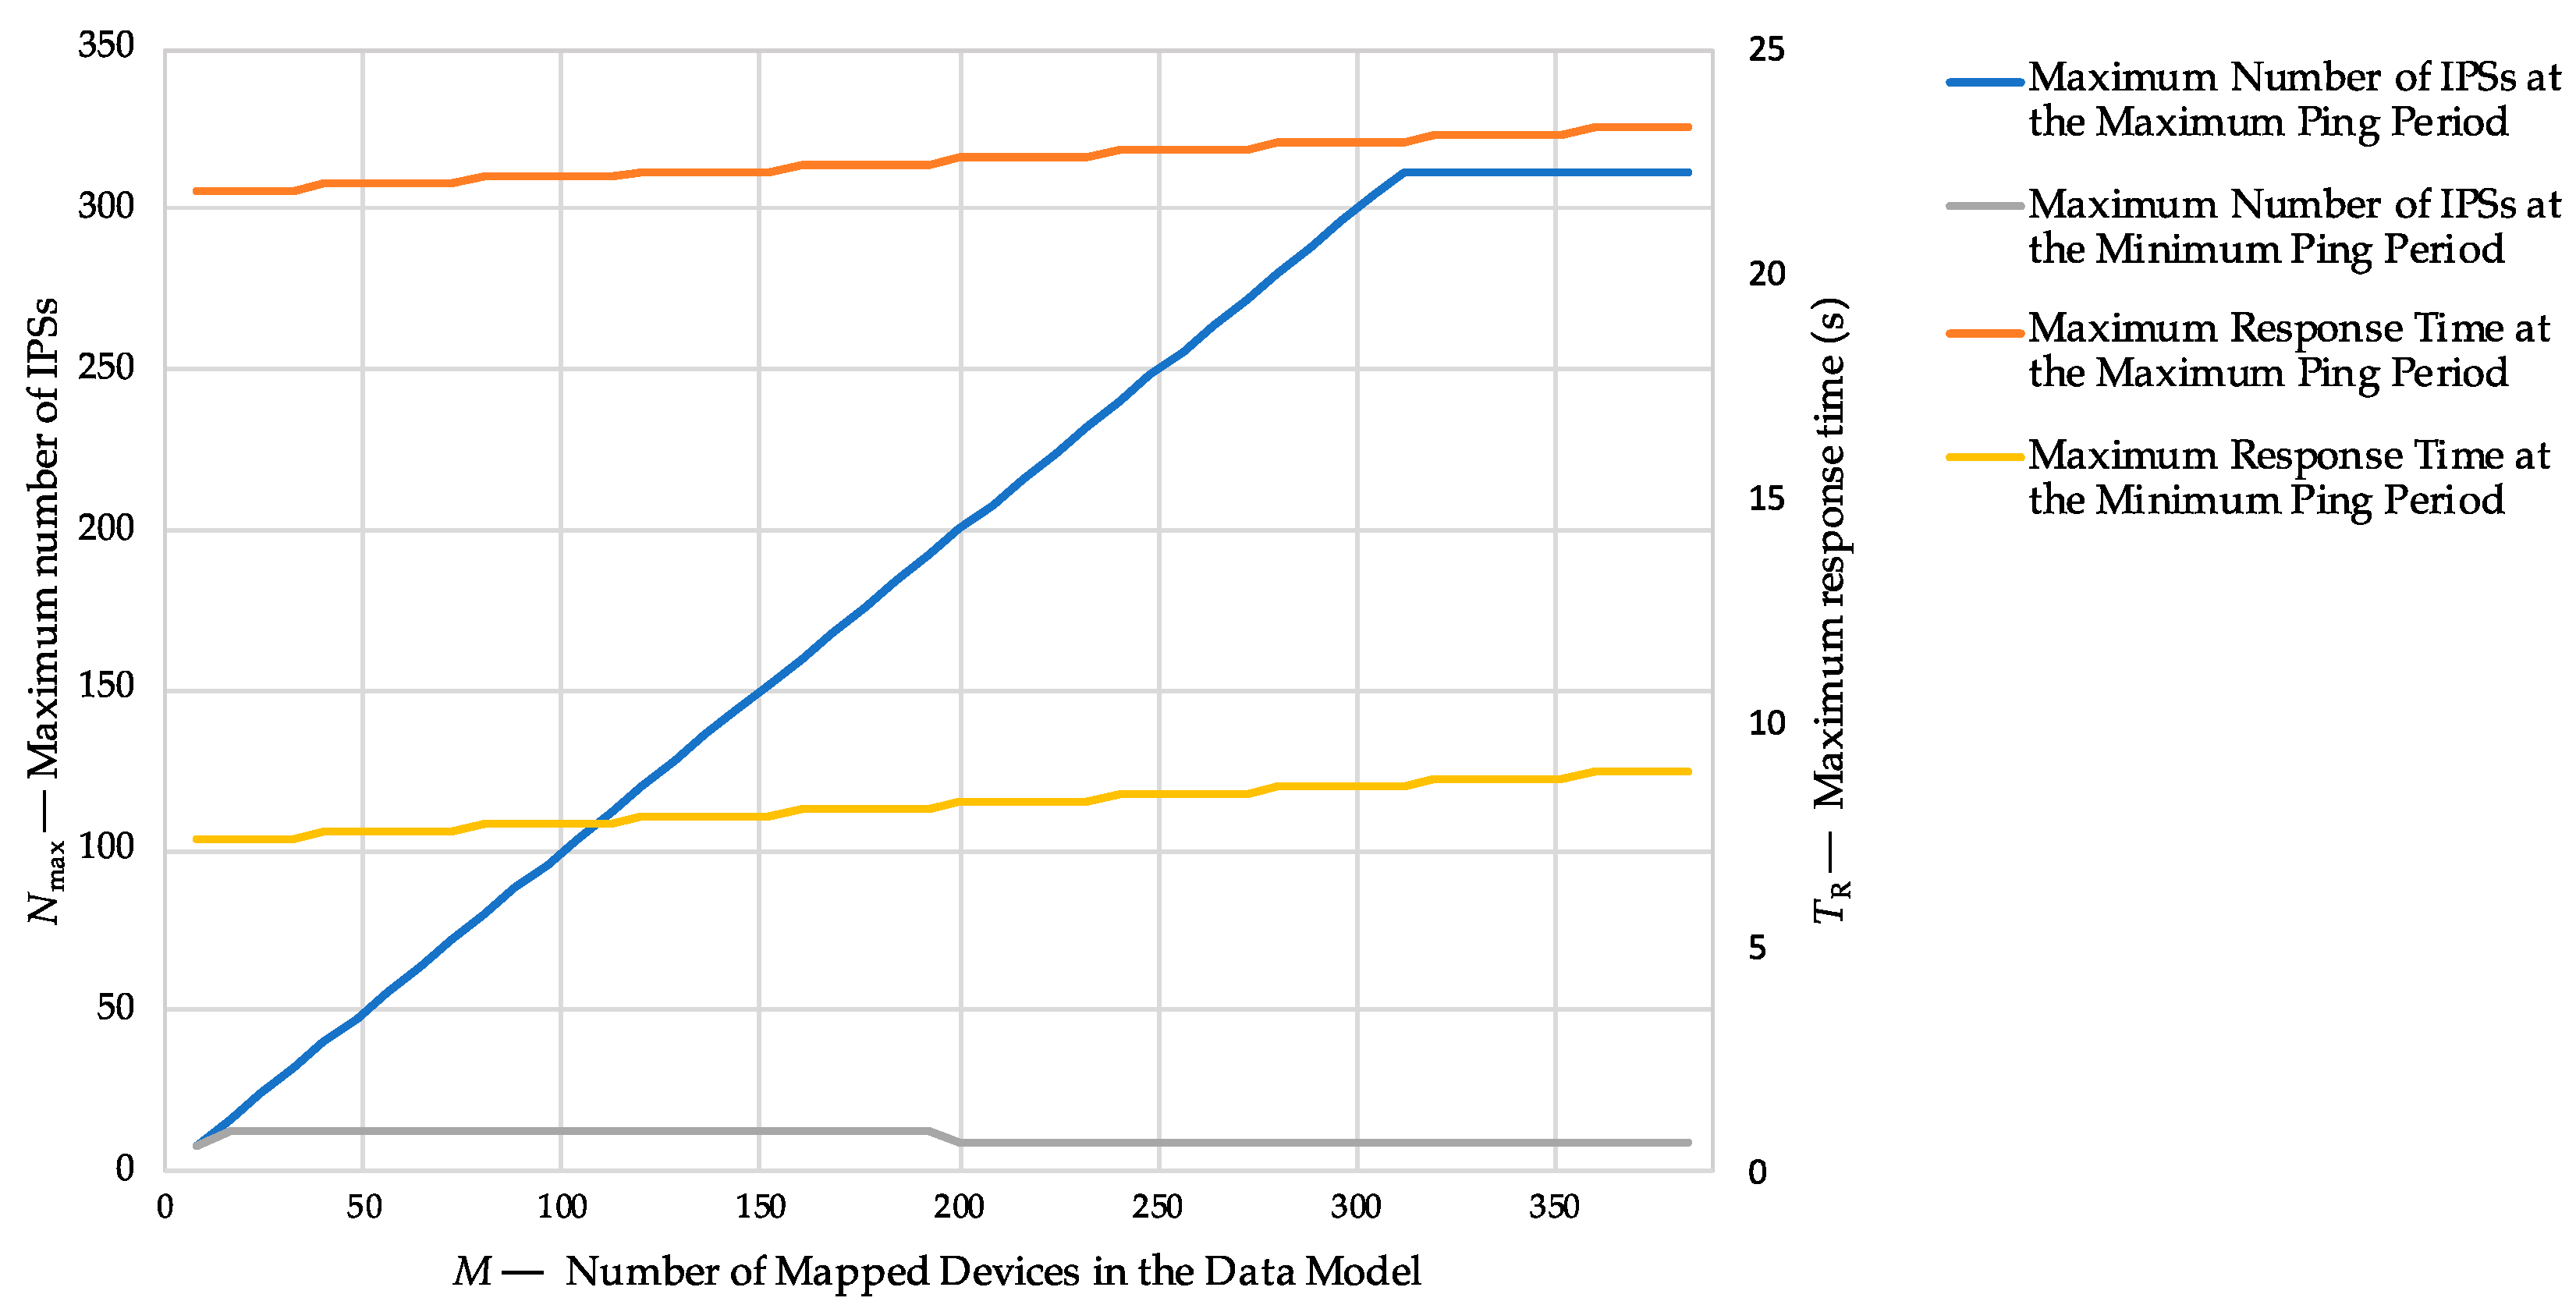
A first sensitivity analysis was carried out to determine the maximum number of IPSs that can be managed by (a single) LoRaWAN GWs and the maximum expected response time by varying the number of devices mapped in the data model. The value of Nmax was computed using Equation (3), by varying M from 8 to 48 for two different scenarios: at the minimum allowed ping period (corresponding to k = 7), and at the maximum ping period (corresponding to k = 3). The value of k was limited to 3 (corresponding to a ping period of about 15.36 s) because, for lower values of k, the corresponding value of TP would exceed the response time limit of 30 s defined by the Italian regulatory framework.
As shown by the results depicted in
Figure 7, if the highest ping period is considered, the maximum number of IPSs that can be managed by (a single) LoRaWAN GWs perfectly matches the number of devices mapped by the data model, up to a limit of 312 devices per network. Conversely, if the lowest allowed ping period is assumed, the maximum number of IPSs is limited to 12. Concerning the maximum expected response time, it can be noted that the latter is slightly affected by the number of mapped devices (with differences lower than 2 s), while it is sensibly affected by the chosen ping period, by ranging from 8.5 s for
TP = 0.96 s (with 312 mapped devices) to 22.9 s for
TP = 15.36 s (with 312 mapped devices).
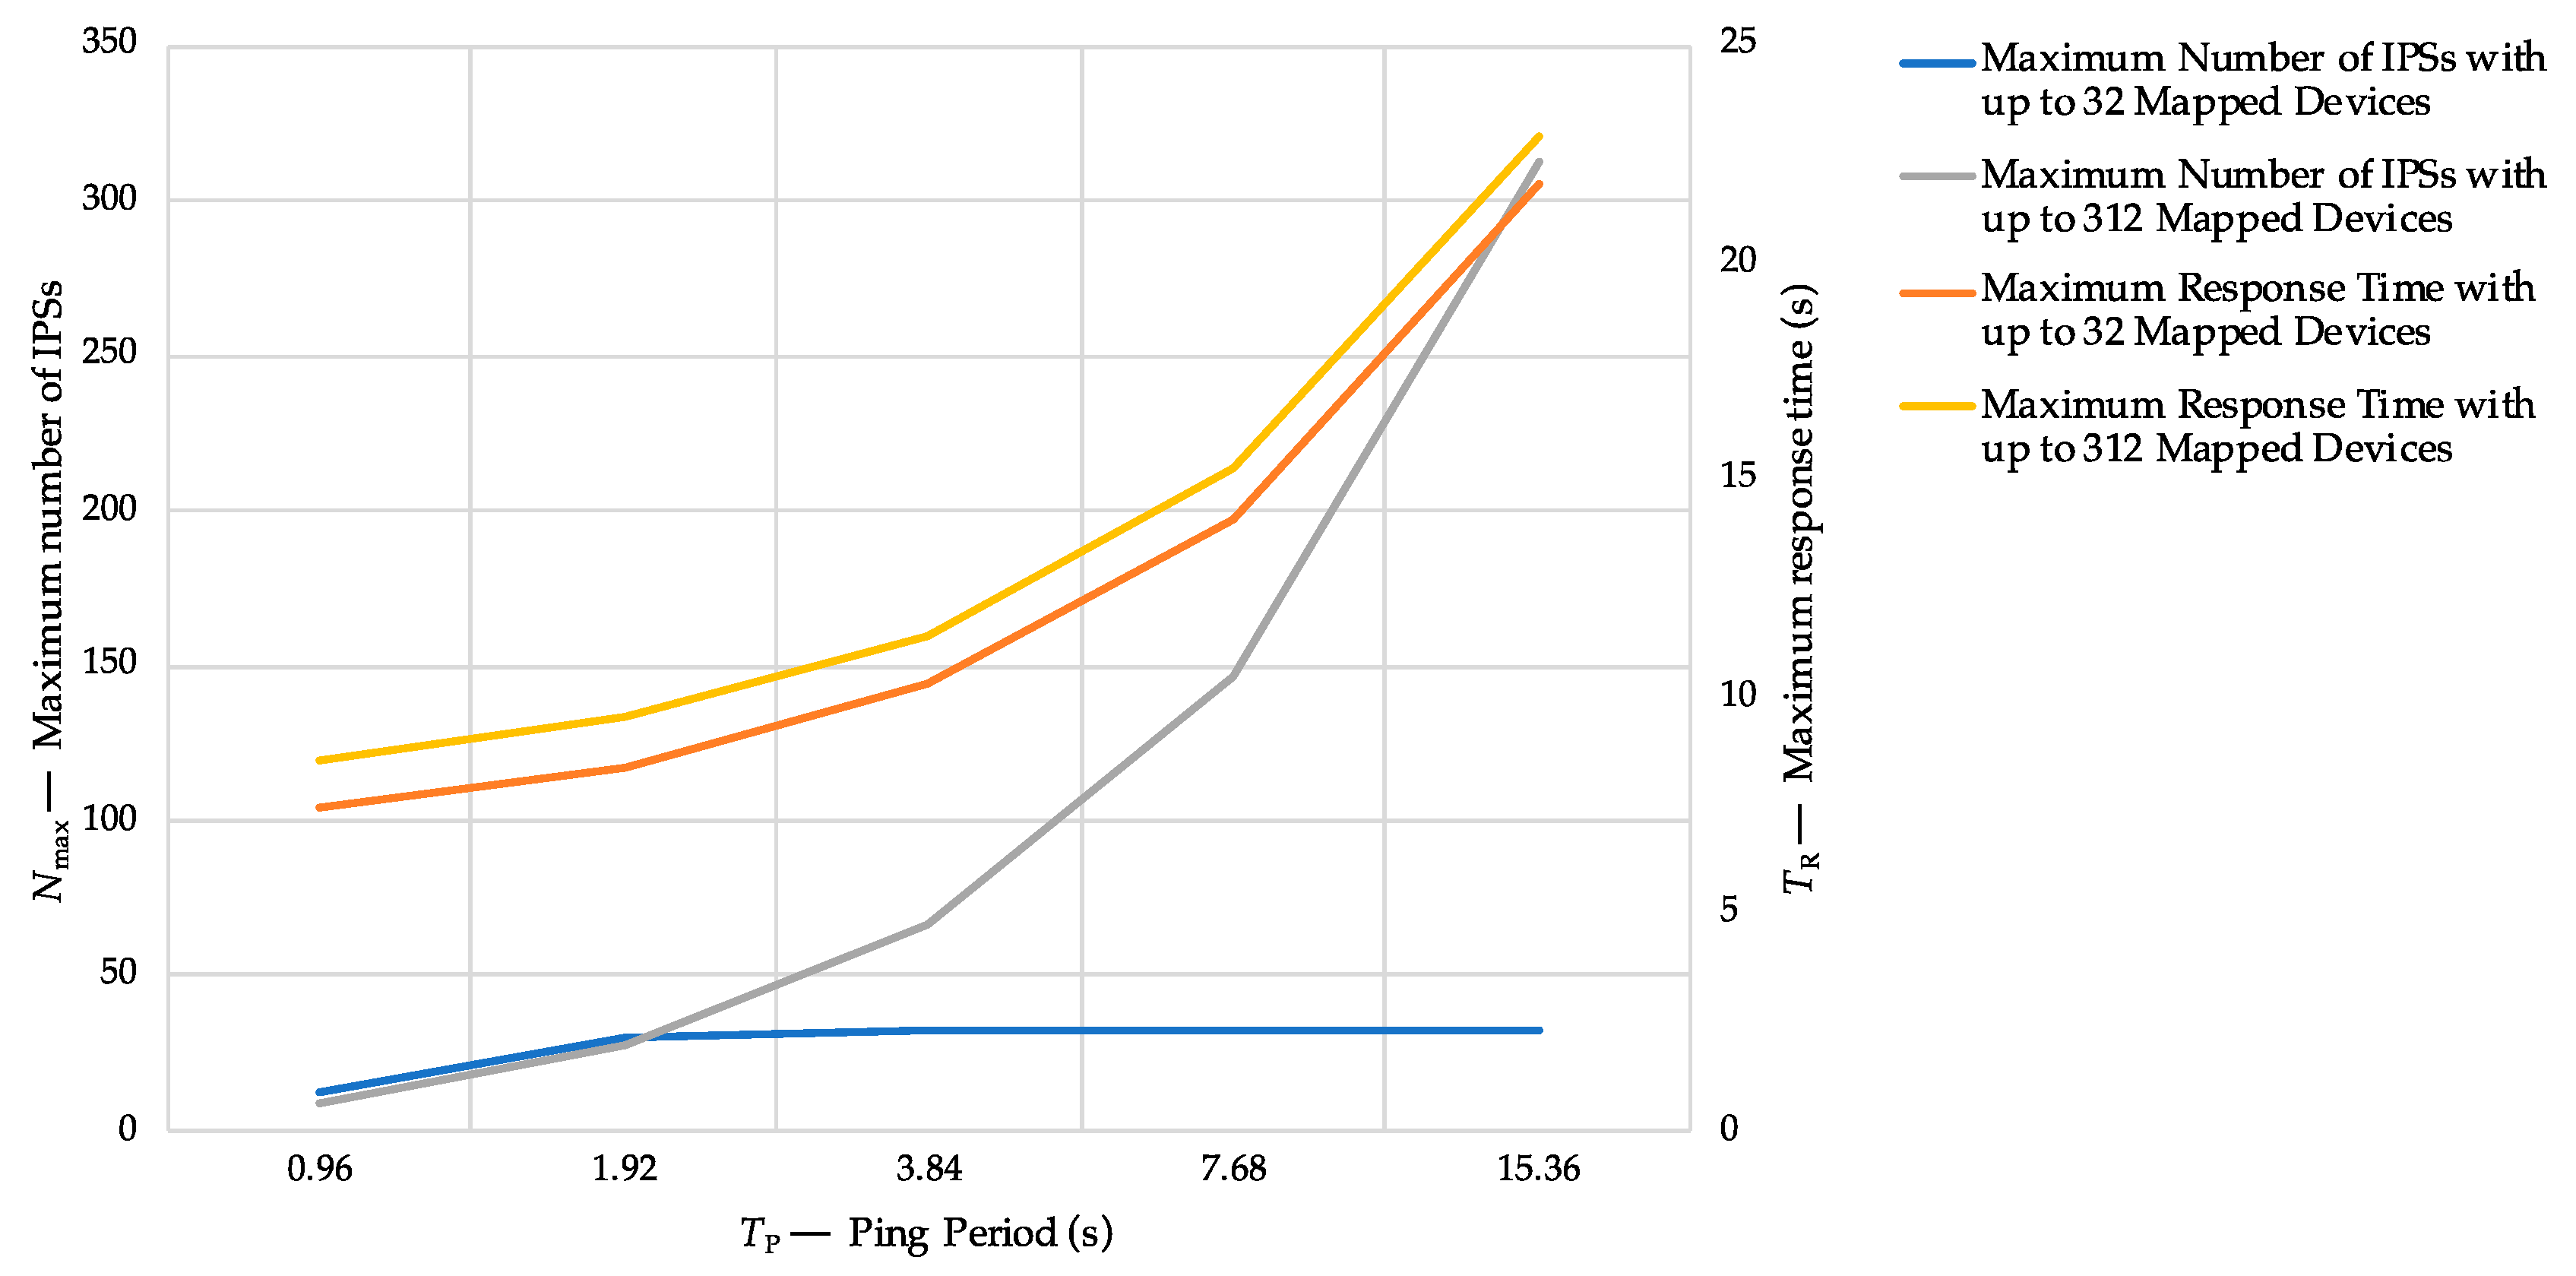
A further sensitivity analysis was carried out to determine the maximum number of IPSs that can be managed by (a single) LoRaWAN GWs and the maximum expected response time by varying the ping period. The value of Nmax was computed using Equation (4), by varying k from 3 to 7 (i.e., corresponding to a ping period of 15.36 s and 0.96 s, respectively) for two different scenarios: for 32 and for 312 mapped devices.
As shown by the results depicted in
Figure 8, the maximum number of IPSs grows by increasing the duration of the ping period, by reaching the limit of 32 devices of the first scenario at 1.92 s, while exponentially increasing up to 312 devices at 15.36 s in the second scenario. On the other hand, the maximum expected response time grows exponentially by increasing the ping period, by varying from 8.54 s to 22.94 s (with 312 mapped devices). It must be also noted that, for the two considered scenarios, the difference of the maximum expected response time is negligible (less than 2 s).
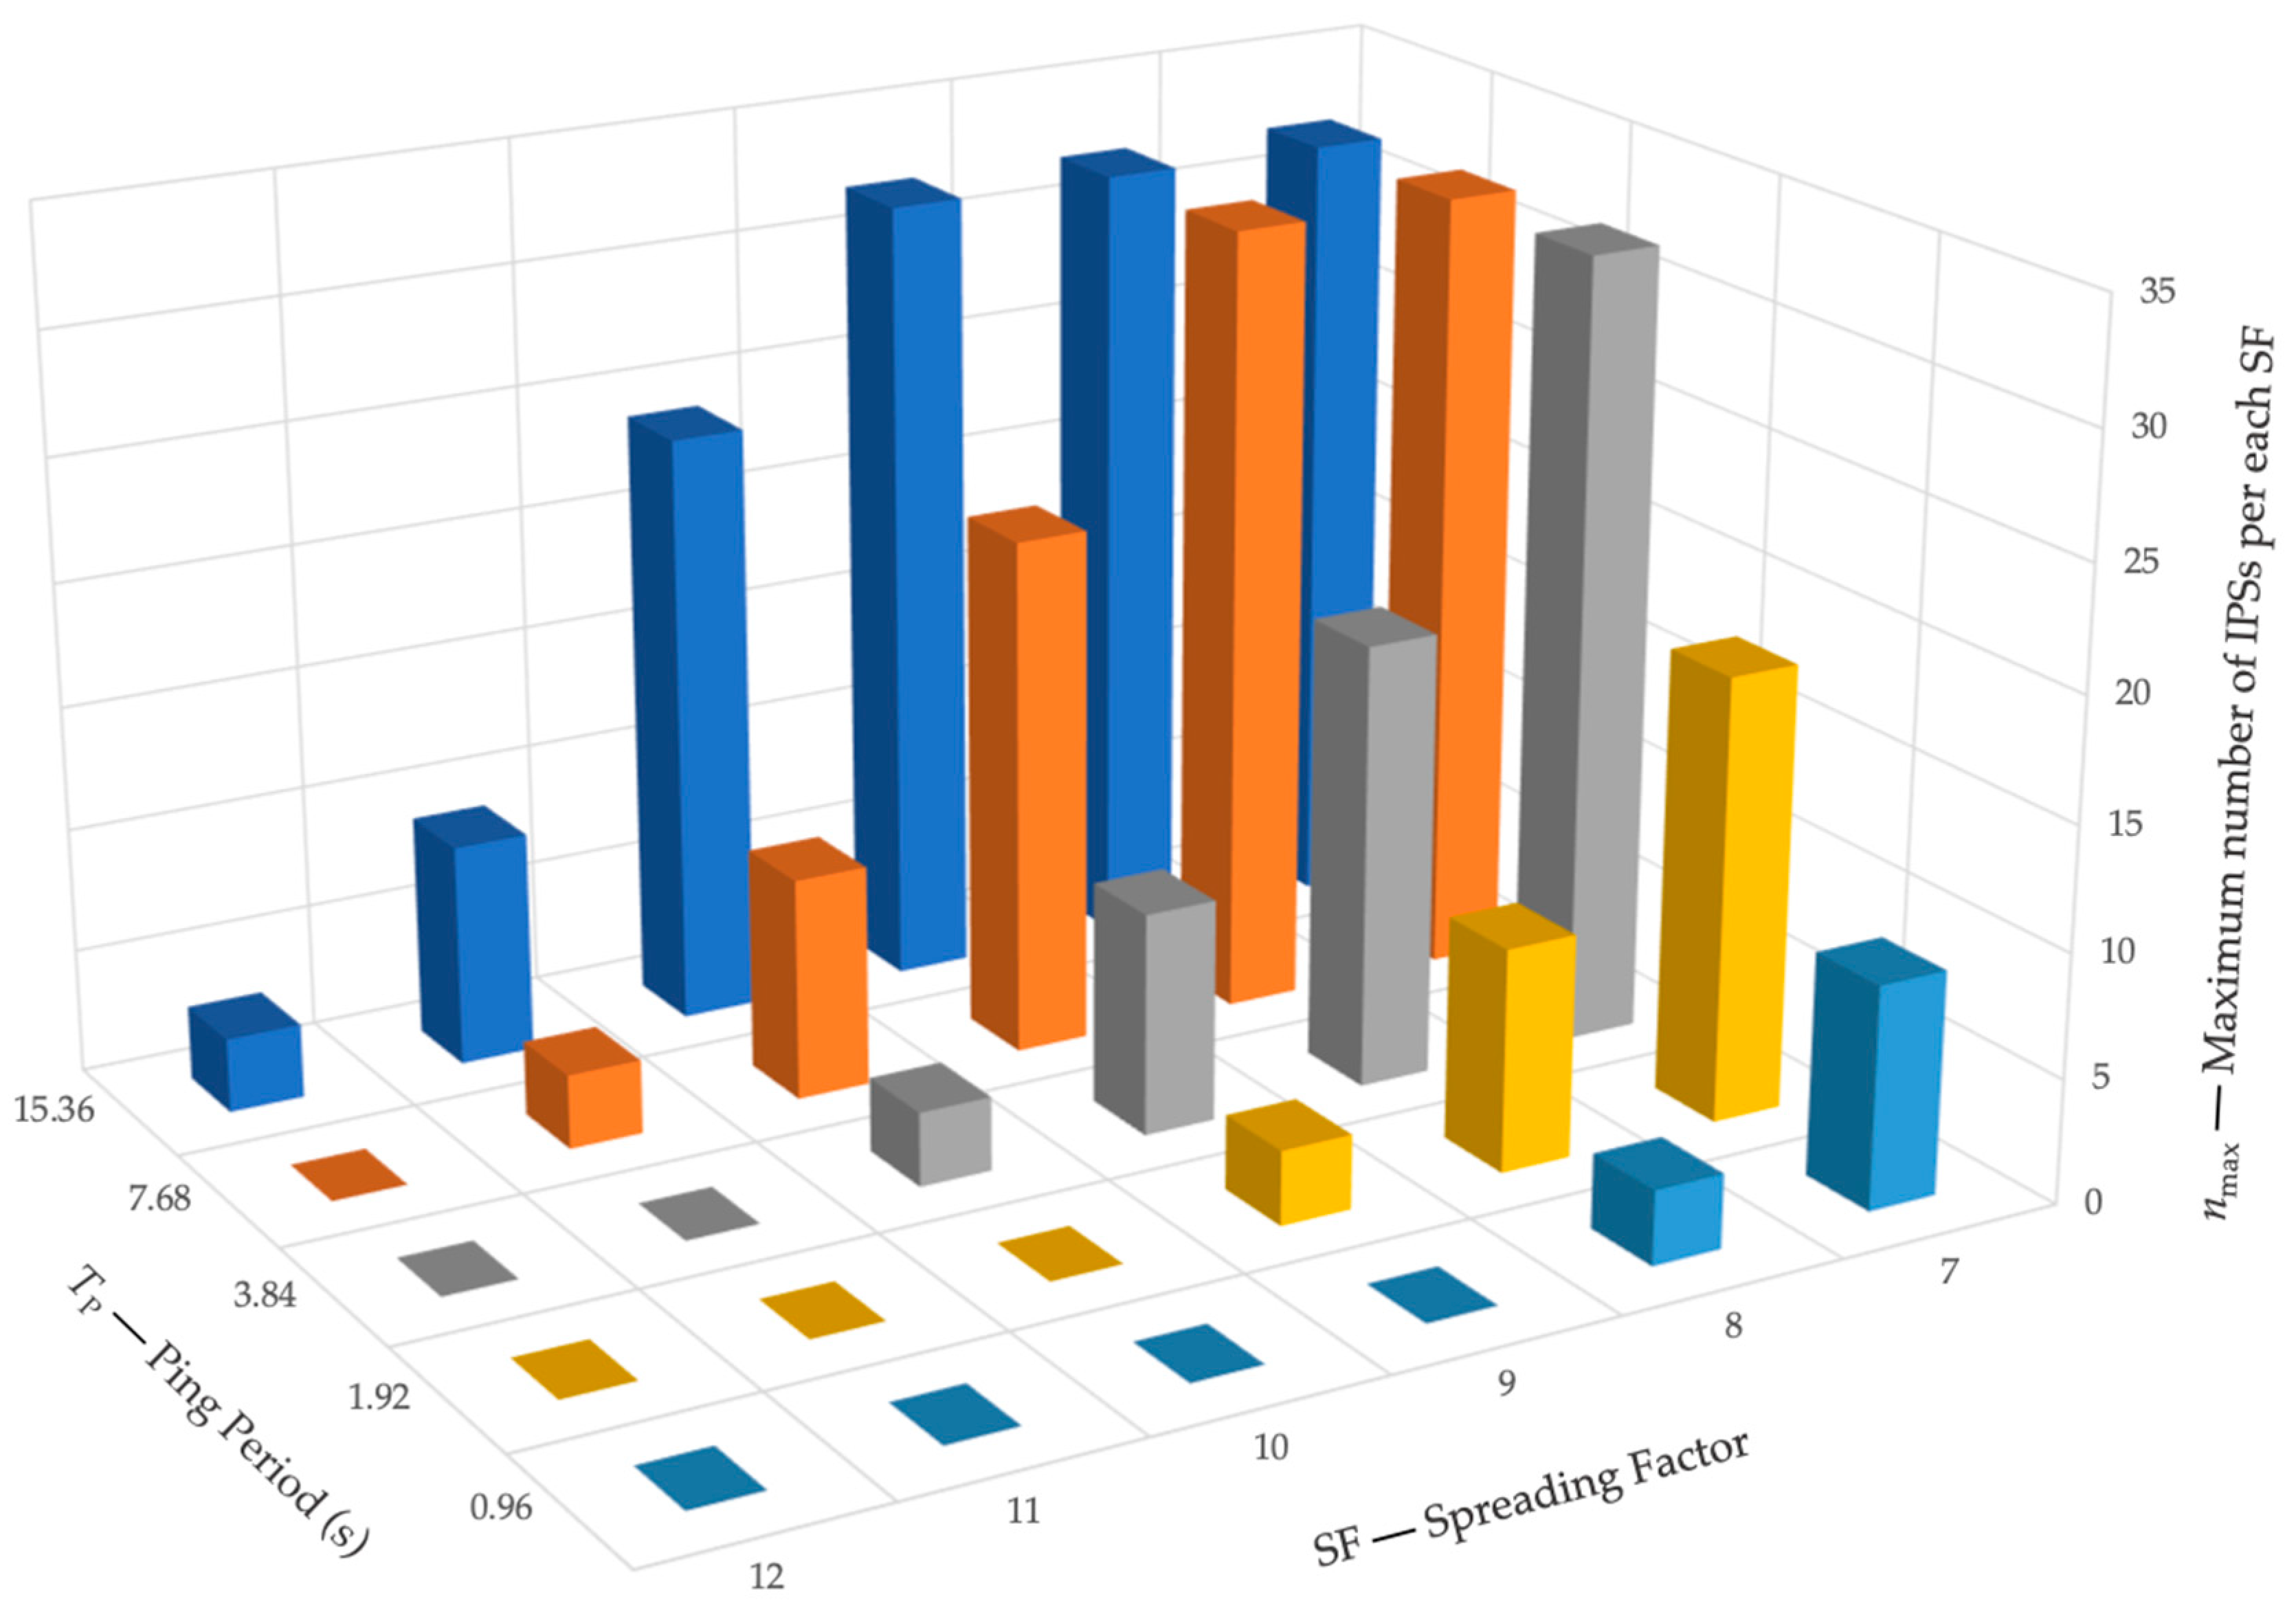
The detailed analysis of the scalability of the proposed solution was finally carried out for the two scenarios described above, i.e., with up to 32 and up to 312 mapped devices.
In
Table 3, the duration of the uplink and downlink messages for scenario with up to 32 mapped devices are reported for each SF. The values have been computed by referring to the standard LoRaWAN specifications. Based on these values, the maximum number of coordinated IPSs for each
SF, depending on the selected ping period, is reported in
Table 4, and then depicted in
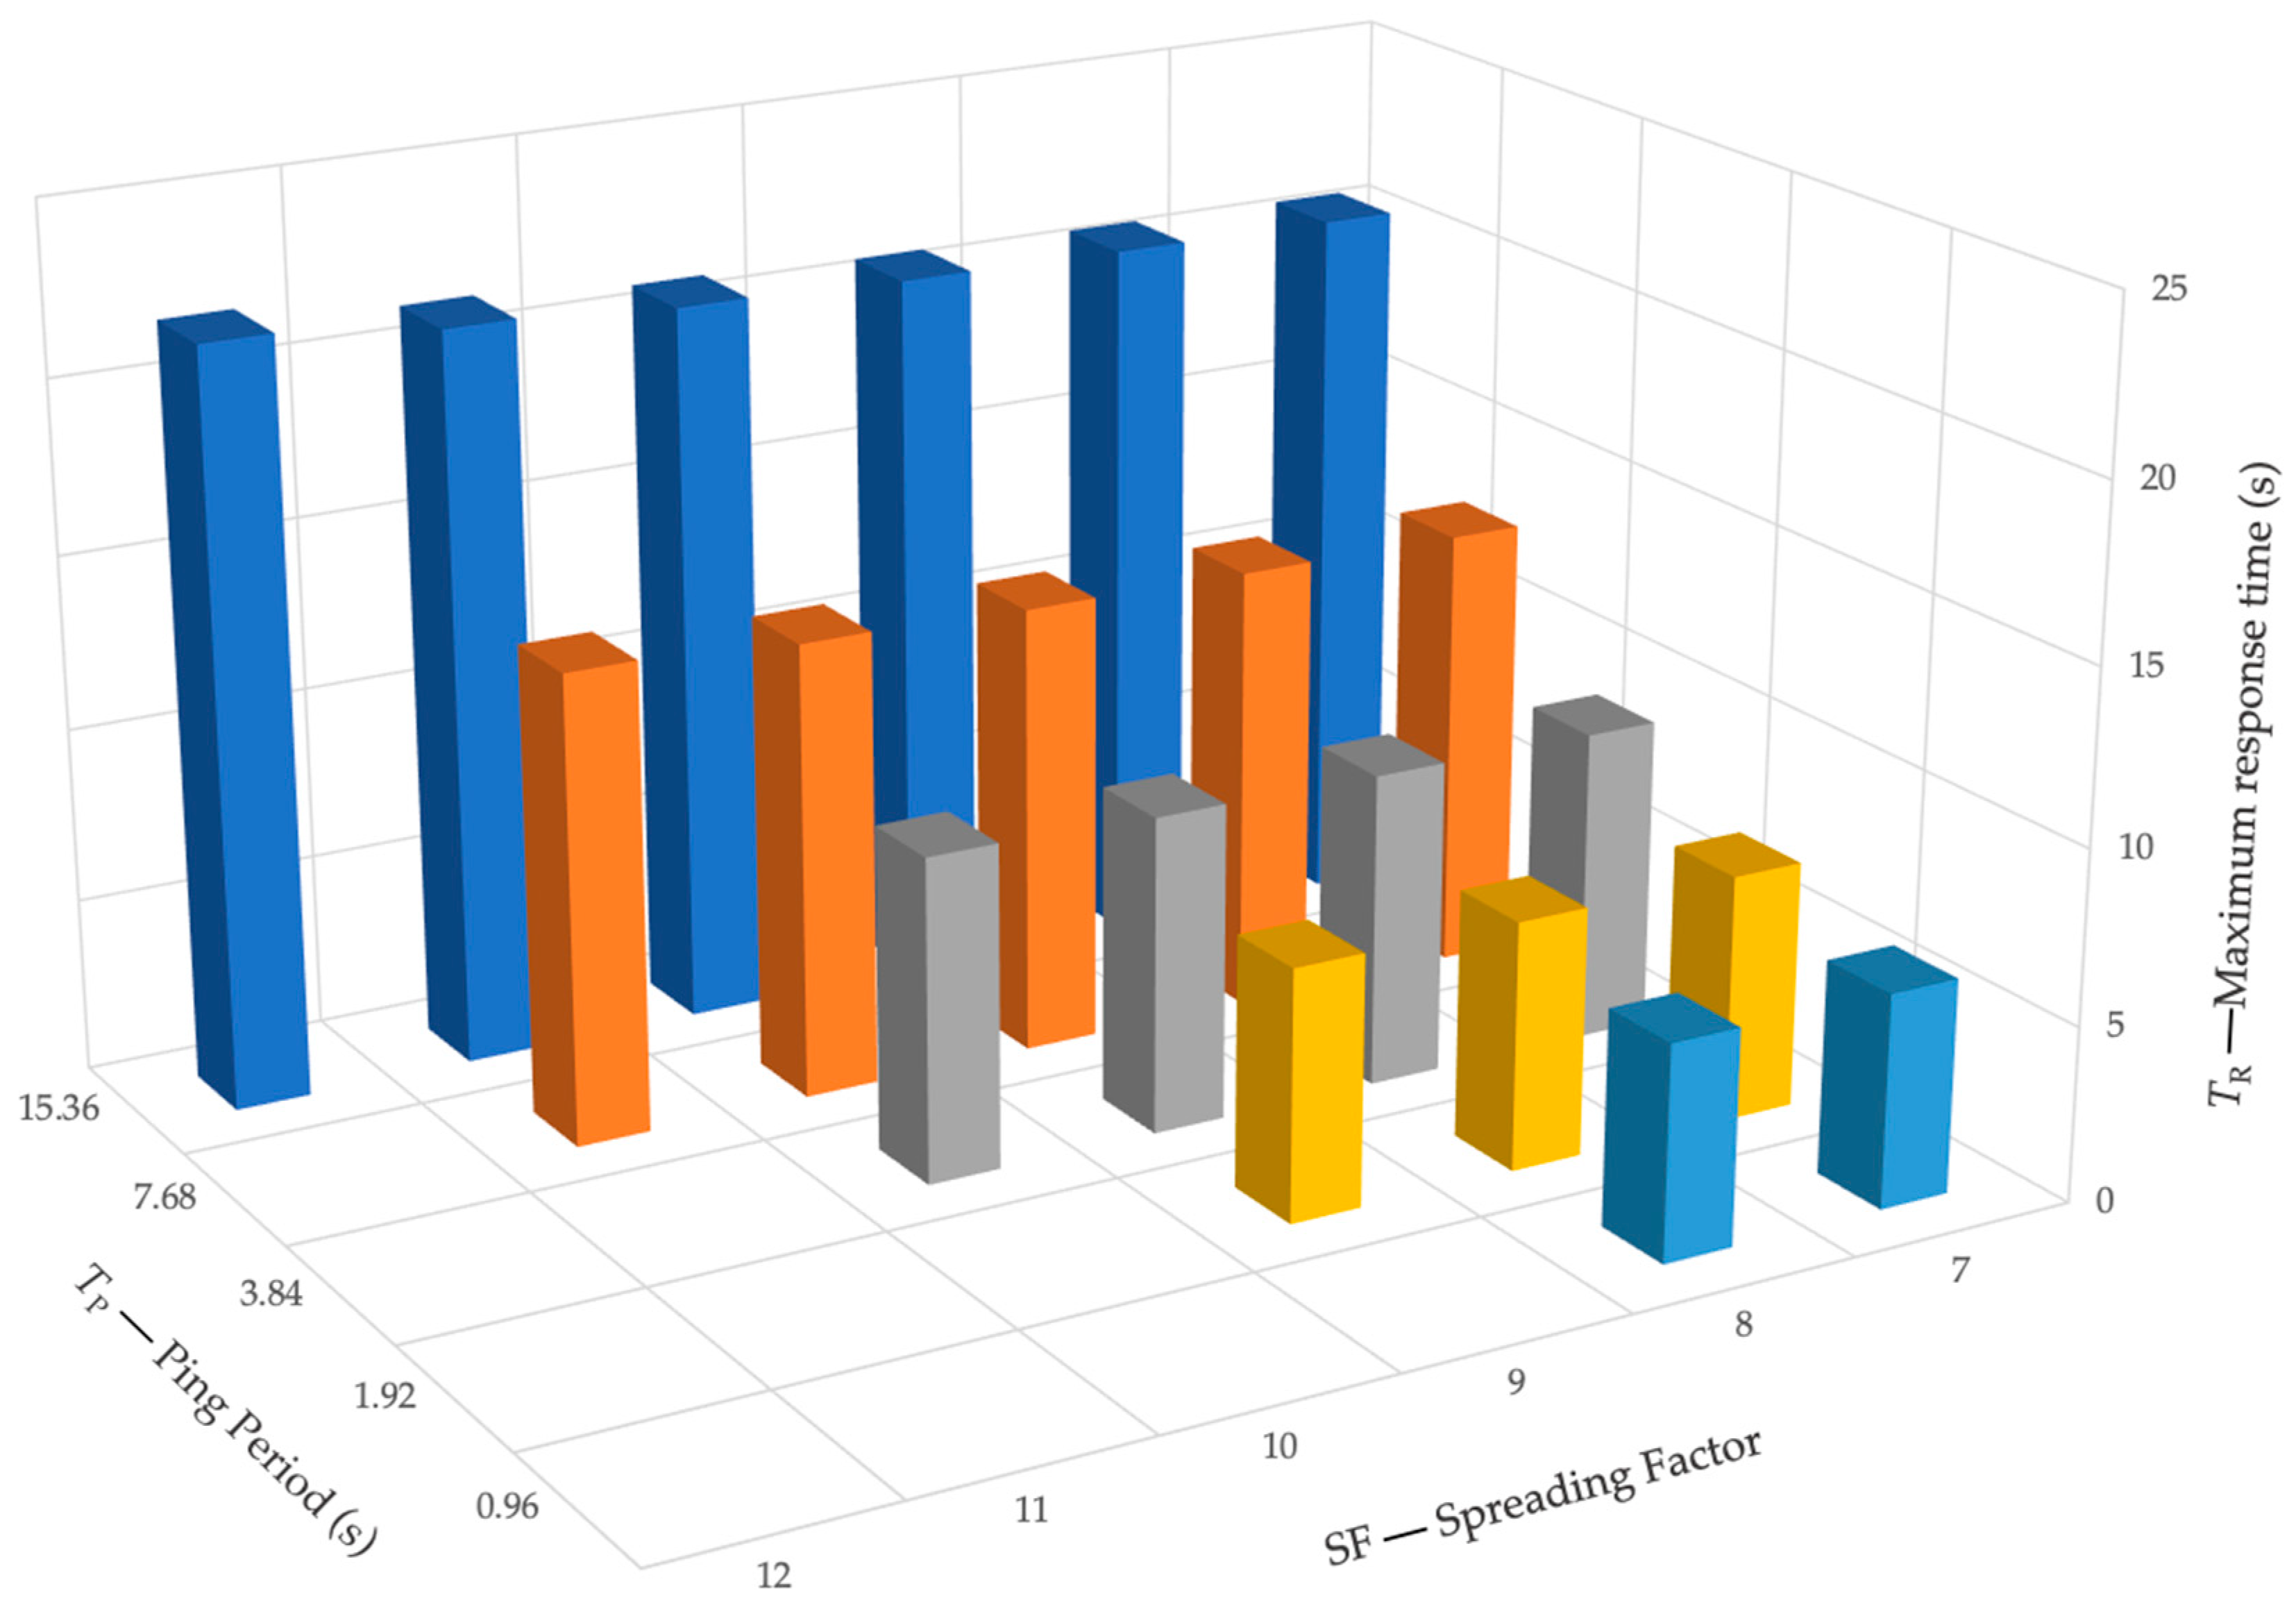
Figure 9. Similarly, the maximum expected response time for each
SF, depending on the selected ping period, is reported in
Table 5, and then depicted in
Figure 10.
As it can be noted, the maximum number of coordinated devices is reduced only in the case the lowest ping period duration is adopted (which allows only 12 total devices). However, some relevant limitations can be noted concerning the use of high SF values (i.e., for SF from 10 to 12) if a ping period duration lower than 7 s is applied. In this case, the coordination of IPSs is very limited, or even not possible for ping periods lower than 2 s. In addition, it must be noted that the highest number of coordinated IPSs for the highest SF values is limited to nine devices for SF = 11 and to three devices for SF = 12. On the other hand, it can be noted that the maximum response time is scarcely affected by the SF, while strongly depending on the selected ping period, with values ranging from 6.14 s (corresponding to TP = 0.96 s, and SF = 7) to 21.8 s (corresponding to TP = 15.36 s, and SF = 12).
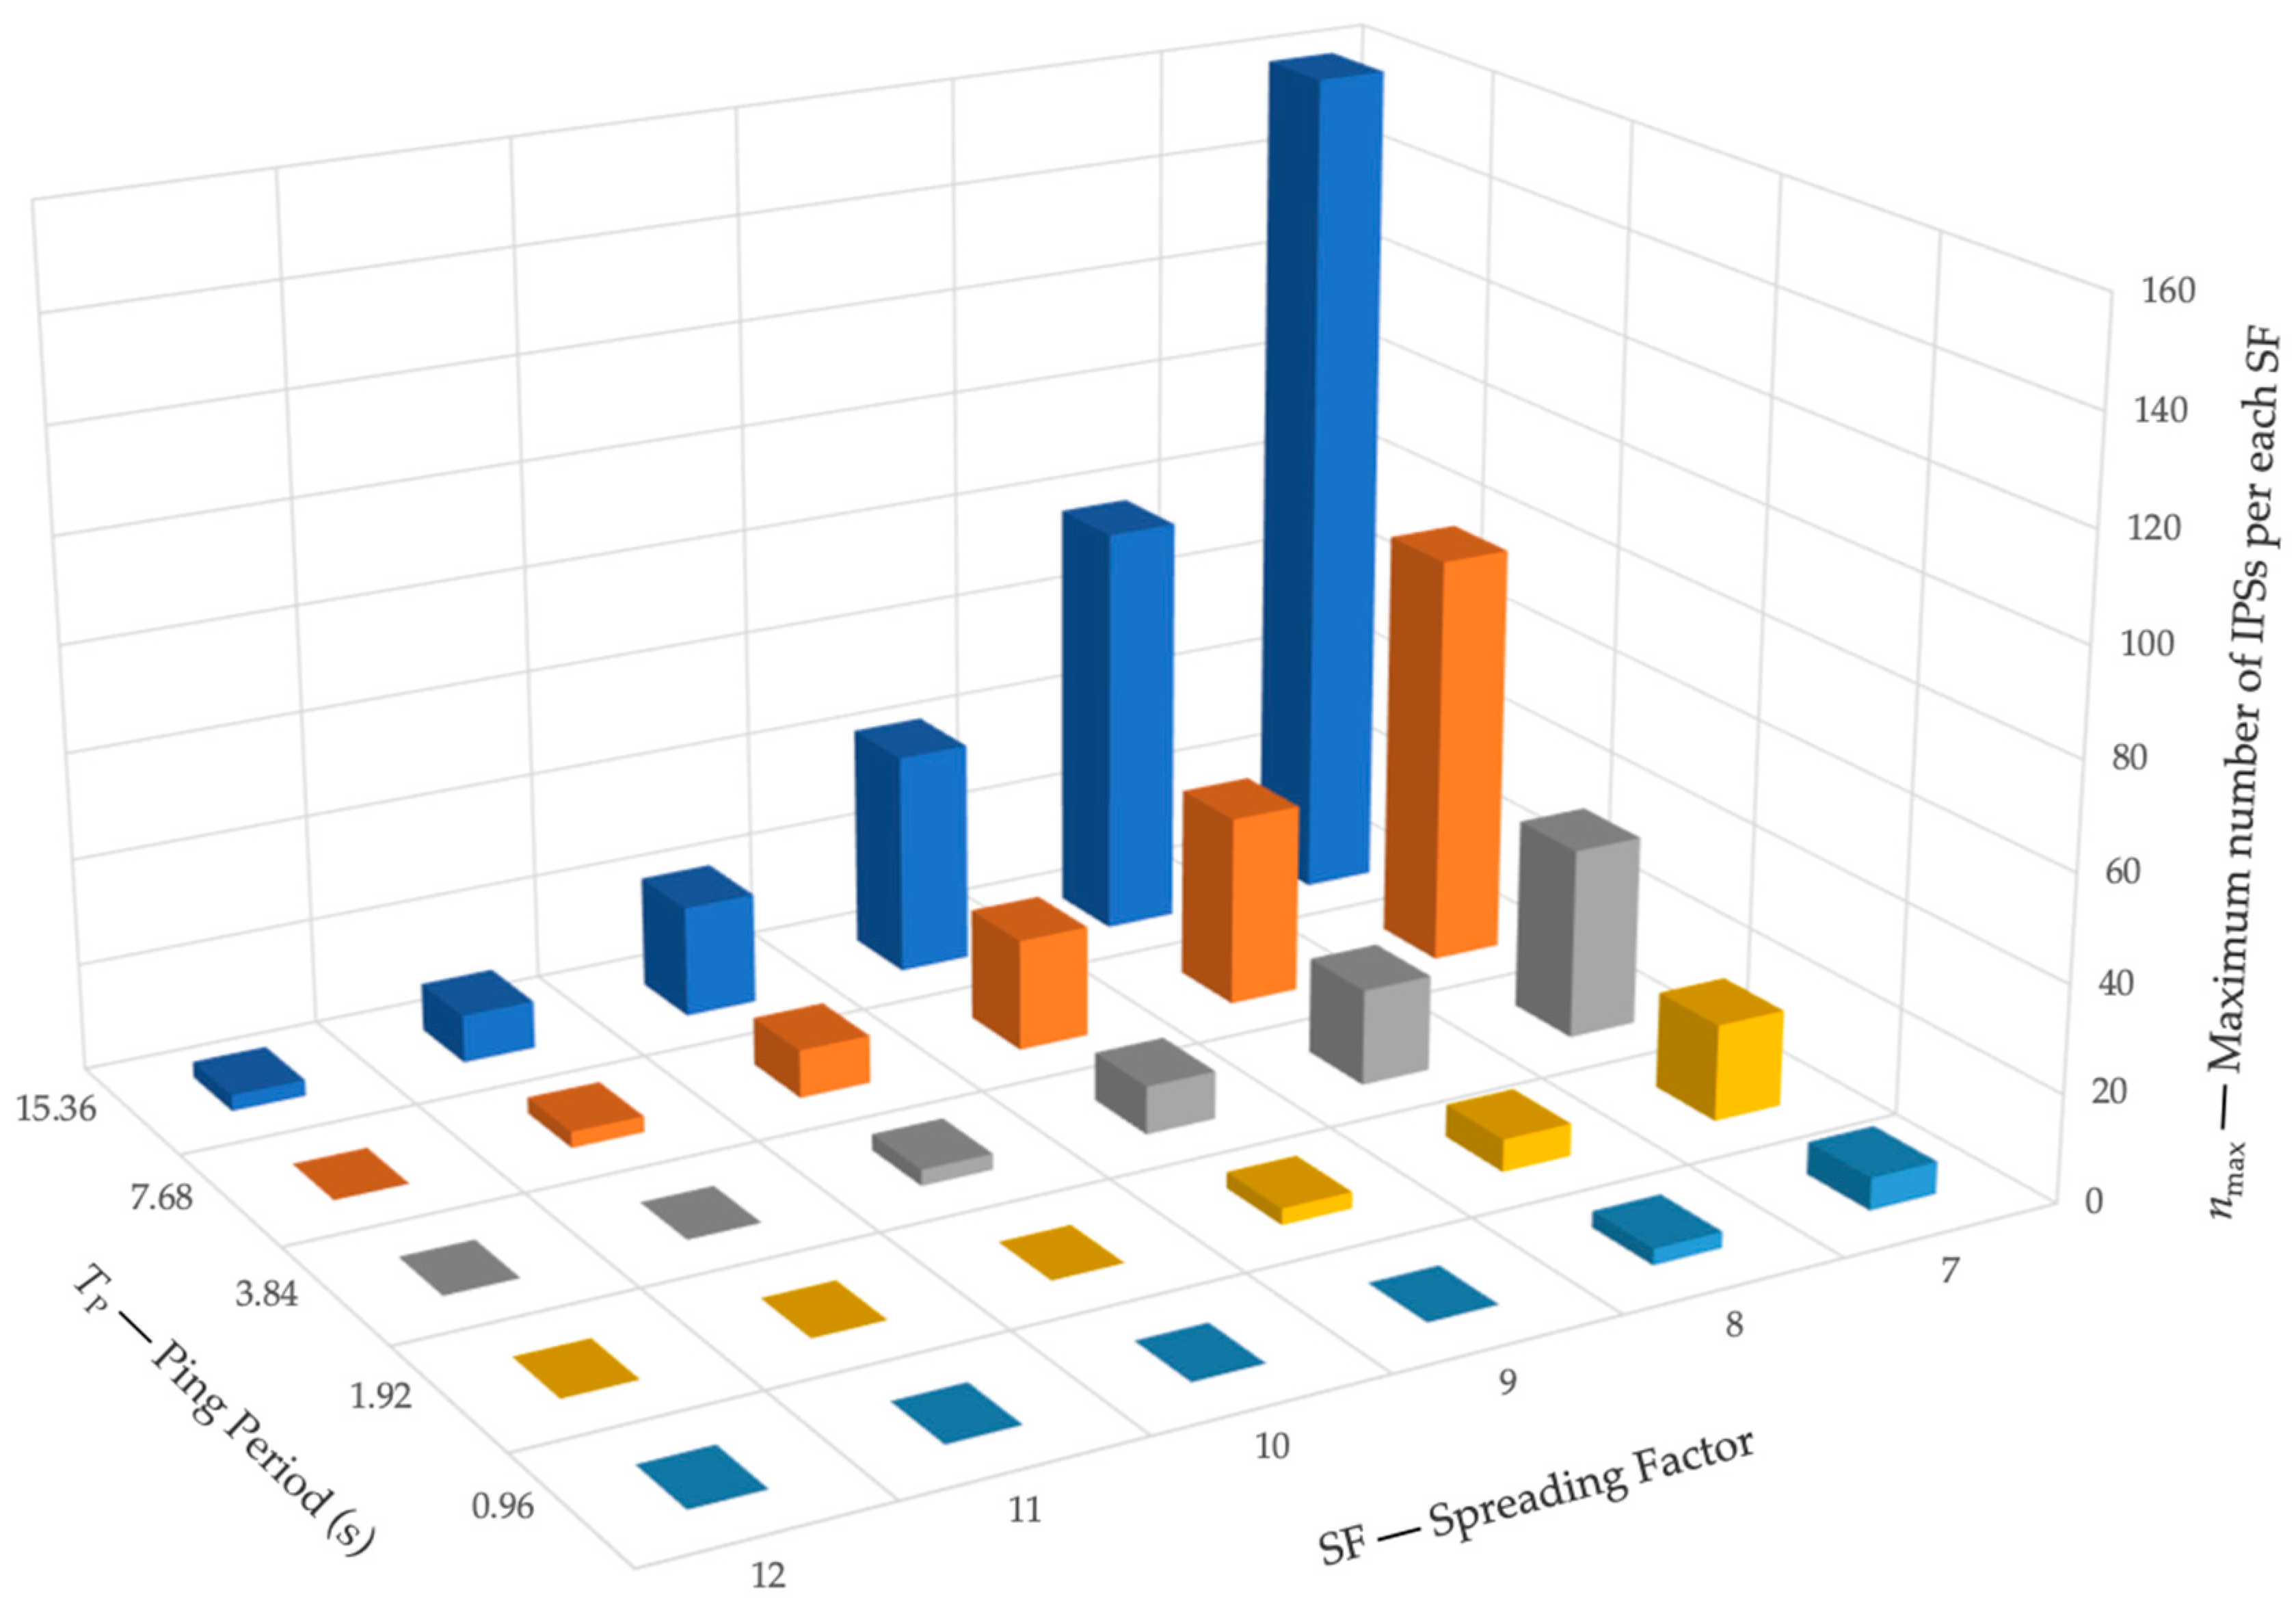
In
Table 6, the duration of the uplink and downlink messages for scenario with up to 312 mapped devices are reported for each
SF. The values have been computed by referring to the standard LoRaWAN specifications. Based on these values, the maximum number of coordinated IPSs for each
SF, depending on the selected ping period, is reported in
Table 7 and then depicted in
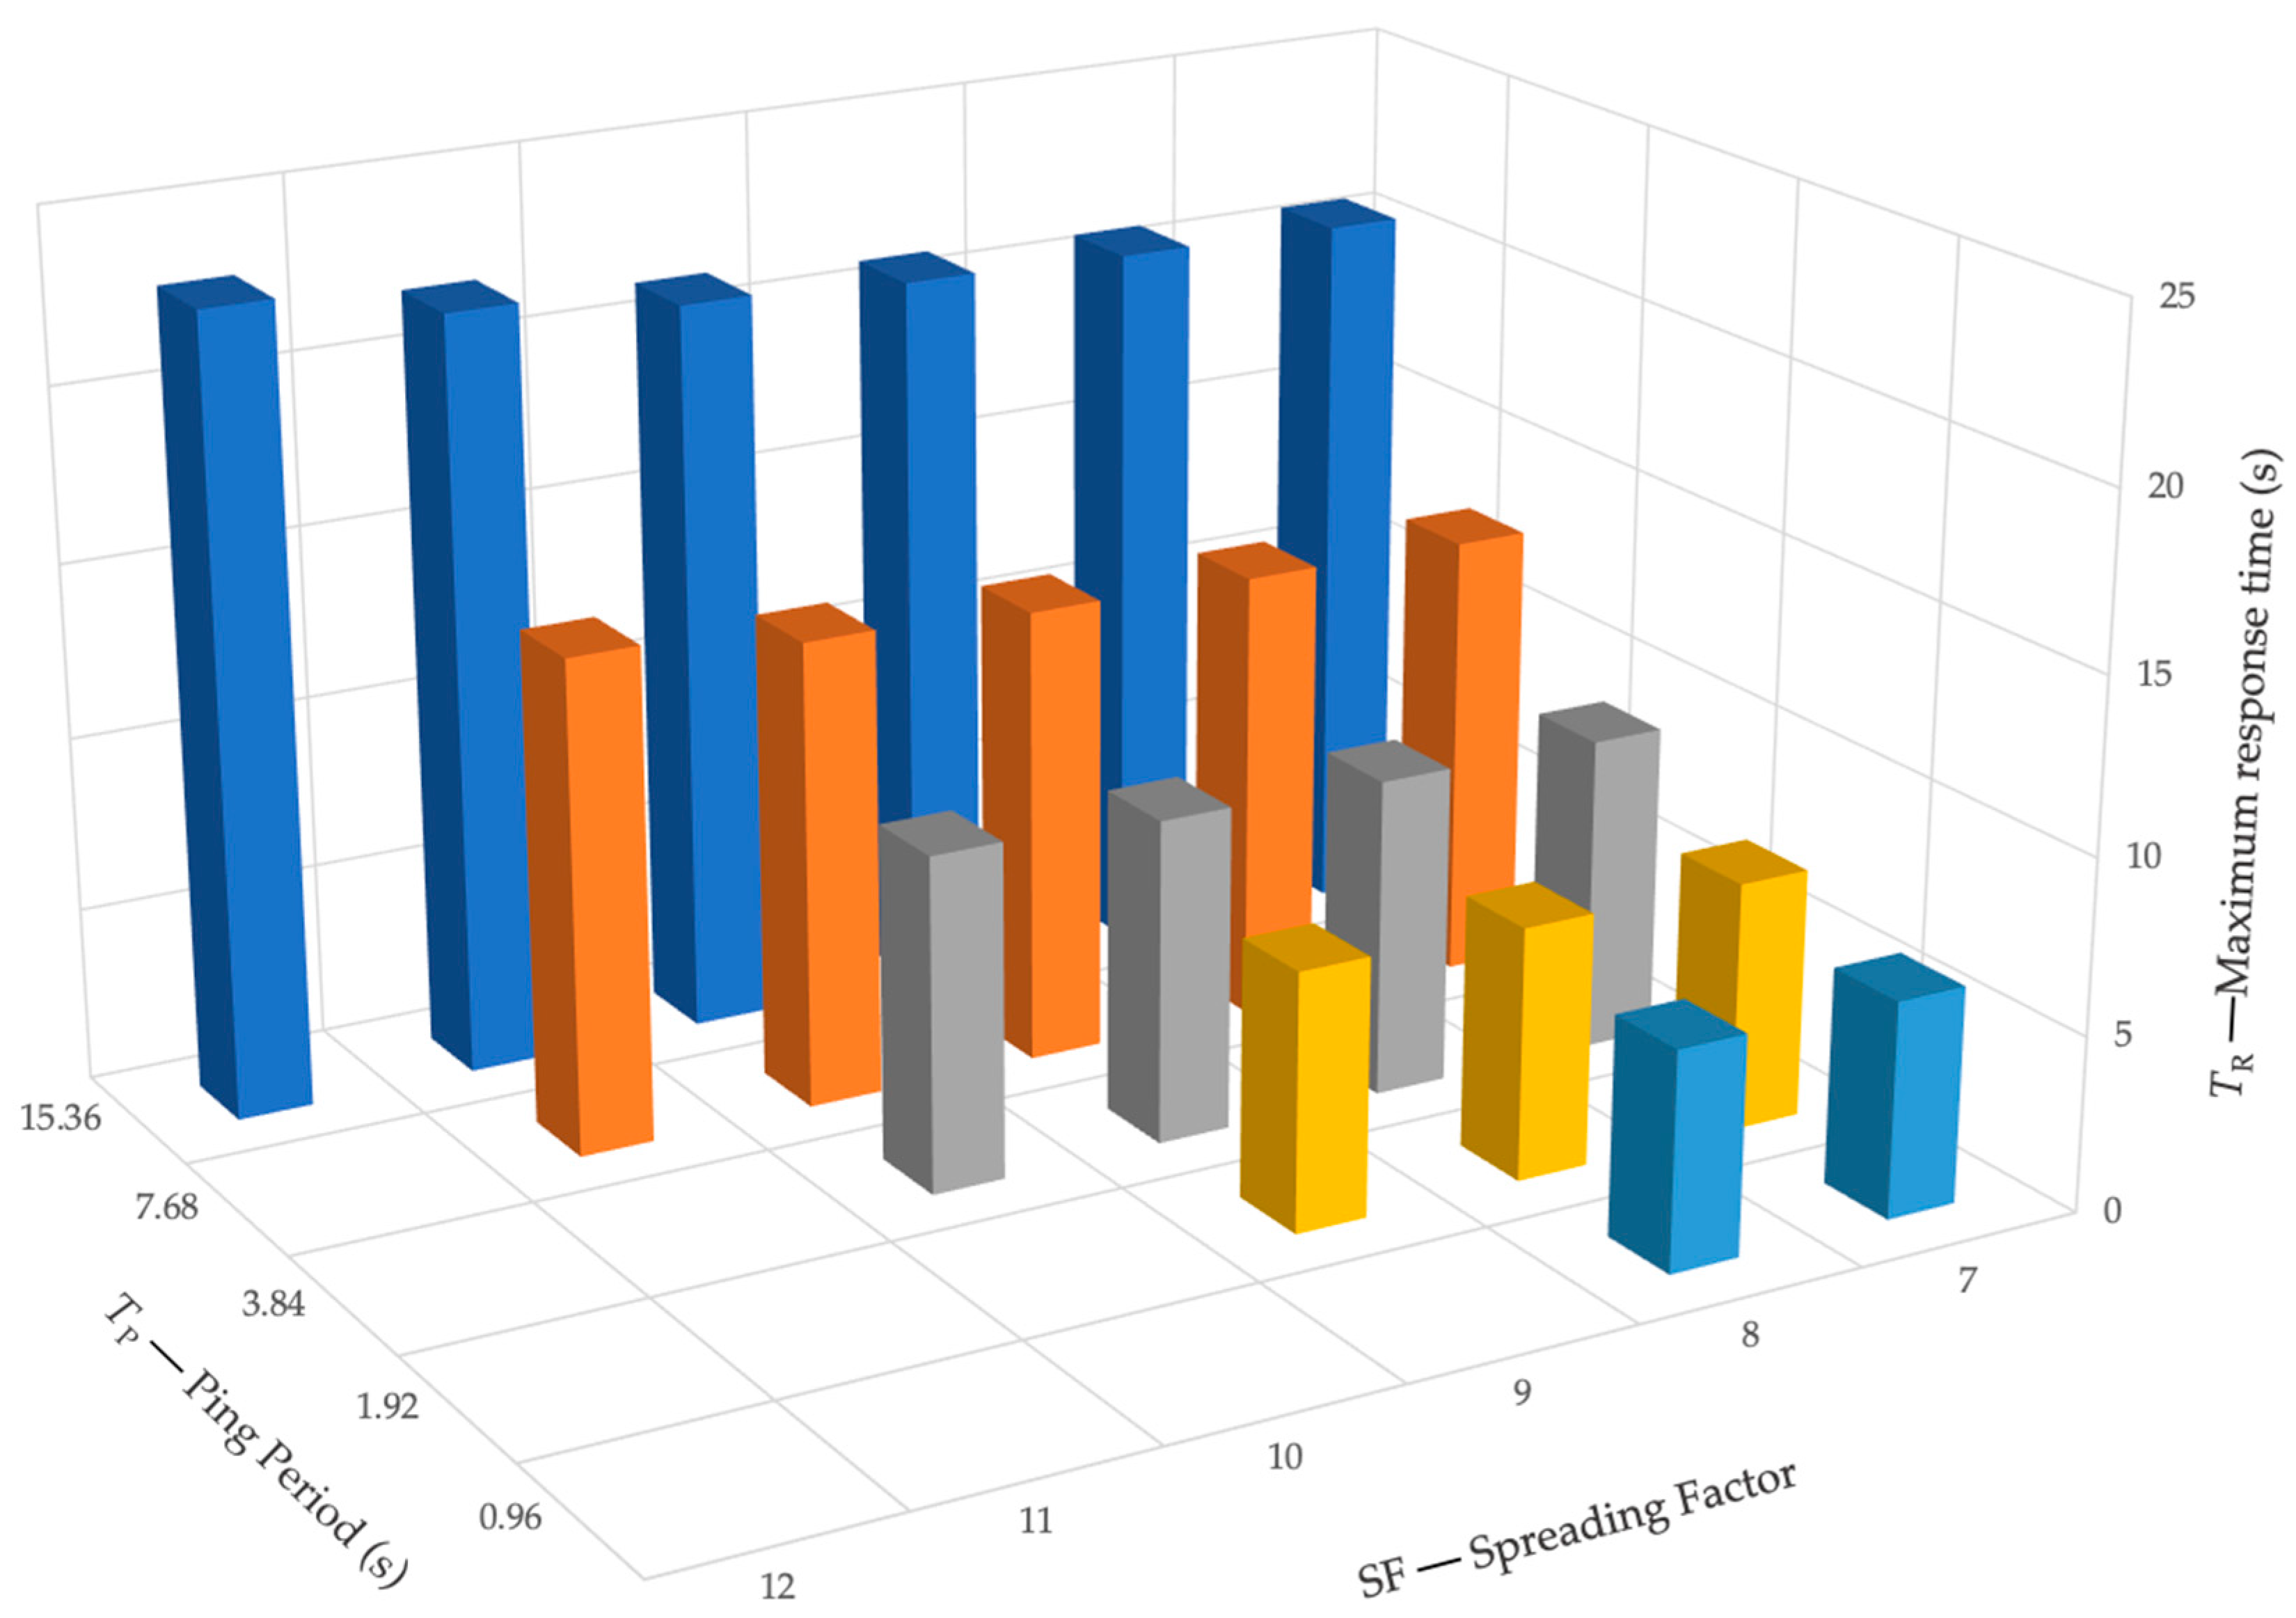
Figure 11. Similarly, the maximum expected response time for each
SF, depending on the selected ping period, is reported in
Table 8 and then depicted in
Figure 12.
In the scenario with up to 312 mapped devices, the maximum number of coordinated devices is remarkably affected by both the selected SF and by the adopted ping period. In particular, the number of IPSs that can be managed by a single LoRaWAN base station ranges from 312 devices in the case of TP = 15.36 s, to only nine devices for TP = 0.96 s. Similarly to the results obtained in the scenario with up to 32 mapped devices, in the second scenario, the number of allowed IPSs is also very limited for high SF values, particularly from 10 to 12. It is interesting to note that the same results are shown by both the considered scenarios for SF from 10 to 12, for each ping period. On the other hand, the maximum response time is scarcely affected by the SF, while strongly depending on the selected ping period, by showing values very close to that obtained for the scenario with up to 32 mapped devices.
If applied to the use case presented in
Section 3, it can be concluded that the proposed LoRaWAN architecture would be able to manage all the installed IPSs, by providing monitoring and coordinated control functions with a maximum expected response time of about 10 s, thus in compliance with the current Italian regulatory framework on the matter. In addition, it must be noted that the adoption of the proposed communication architecture would allow for overcoming the main drawbacks of the currently deployed infrastructure, i.e., scarce scalability, low reliability, and scarce flexibility. The proposed solution would in fact allow the implementation of coordination and monitoring functions (which cannot be implemented by the current system), and its expansion to a larger number of installed DER units. Theoretically, up to 312 devices could be in fact managed by a single GW, by assuring a maximum response time compliant with the current Italian grid codes.

 ,
, 


