1. Introduction
Mobile health (mHealth) is a multifaceted research field to deliver healthcare services anytime and anywhere through mobile computing technologies while using a cost-effective approach. The mHealth services and applications are enhanced personalized healthcare systems that improve the communication between patient and doctor [
1]. The development of mobile computing solutions for health improvement and well-being has significantly increased in the recent past. There is relevant interest in the study and development of reliable solutions based on mobile computing for enhanced healthcare systems [
2]. However, most people do not use mobile health applications, and the individuals that use them tend to stop using it in a short period of time. Therefore, the software developers need to study new pervasive and ubiquitous methods and architectures to better address the consumer needs in order to promote the adoption of these mobile applications for enhanced living environments [
3]. The proliferation of computer processing power and the evolution of wireless communication technologies have promoted mHealth and lead to the development of solutions and technologies that substantially contribute to the evolution of clinical research and healthcare [
4].
It is anticipated that 20% of the world population will be aged 60 years and older in 2050 [
5], which will cause a significant increase of health disorders, medical services costs, and caregivers demands. Furthermore, Ambient Assisted Living (AAL) is a research field that is closely related to mHealth. The mHealth and AAL systems address several open issues of aged population in order to extend their independence as long as possible. Most aged population tend to remain in their homes and support the significant cost of nursing care instead of been moved to nursing homes [
6].
On the one hand, the continuous technological advances turn possible the development of automatic and intelligent services with powerful sensing and connecting capabilities for enhanced living environments and occupational health [
7,
8,
9]. In particular, the advances in networking, sensors, and embedded systems enable real-time monitoring for enhanced living environments and healthcare, as well as they are closely related to mHealth [
10]. On the other hand, there is a vast array of challenges in the design and implementation of effective AAL and mHealth systems, such as information architecture, interaction design, human-computer interaction, ergonomics, usefulness, and accessibility [
11]. There are also social and ethical issues, such as acceptance by the elderly adults, as well as privacy and security. Moreover, it is imperative to ensure that technology does not replace human care, but rather that it is an essential complement.
The Internet of Things (IoT) has been described in different ways. IoT refers to the connectivity of a great variety of objects connected to the virtual world [
12,
13]. IoT has been described as a dynamic and global network of objects that incorporate communication standards to provide interoperability. These “things” can be identified, as their physical and virtual attributes are established [
14]. IoT is a paradigm where objects are connected to the Internet and support sense capabilities. These objects can be accessed through unique addressing schemes with interaction and cooperation features [
15]. IoT is relevant on the development of several applications for areas, such as industry, domotics, smart homes, and smart cities. Furthermore, it offers important opportunities, particularly for healthcare systems and enhanced living environments.
One of the most important challenges for the implementation of mHealth and AAL solutions is the non-interoperability of heterogeneous technologies. IoT architecture can provide interoperability to build a unified system for enhanced living environments [
16]. Moreover, IoT has relevant potential for creating new real-life applications and services for enhanced healthcare systems [
17]. IoT devices tend to be ubiquitous and context-aware; they enable ambient intelligence features that are closely related to AAL and mHealth [
18]. IoT architectures combined with AAL and mHelath methods can be the basics for the development of effective and efficient solutions for enhanced health and well-being at low-cost [
19]. However, there are still several challenges to IoT, AAL, and mHealth, such as security and privacy [
20,
21,
22]. IoT architectures are typically wireless; they are publically exposed; therefore, the ownership of data collected must be clearly identified [
23].
Indoor environment quality (IEQ) includes indoor air quality (IAQ), acoustics, thermal comfort, and lighting [
24]. Abundant scientific research concludes that defective IEQ leads to significant negative impacts on health and well-being, particularly on children and elderly people. Living environments include several types of spaces, and workplaces, such as offices, hospitals, public service centres, schools, libraries, leisure spaces, and even vehicles cabins [
25]. The increasing number of building occupants, and the time spent indoors justify the need to develop automatic monitoring systems not only to promote occupants’ health and well-being, but also to offer a productive workplace [
26].
In particular, IAQ affects health and well-being significantly. Subsequently, it is a critical issue of global health as tobacco and sexually transmitted diseases [
27]. According to the Environmental Protection Agency (EPA), IAQ pollutants concentration can be up to 100 times greater when compared with outdoor pollutant’s concentration levels. Therefore, EPA considered poor air quality into the top five environmental risks to global health [
28].
Every year, indoor and outdoor air quality is accountable for approximately 3.2 million deaths worldwide. It is also related to the increase of heart and asthma attacks, dementia, as well as cancer [
29,
30]. The air quality impact is particularly most severe in developing countries lacking of legislation to regulate pollution emissions. Nevertheless, even in developed countries, such as the USA, approximated that 50,000 premature deaths are related to defective air quality annually. Furthermore, the costs of pollution-related diseases treatments reach
$150 billion annually [
31]. Air quality is a concern, even in locations with low pollution levels. Research studies state that short-term poor air quality exposure can produce relevant health effects for sensitive groups, like kids and people with cardiovascular disease and asthma [
32,
33].
There is a need of IEQ research in order to study the air quality issues to create proper legislation, inspection, and mechanisms that act in real time for enhanced living environments, such as schools, hospitals, and private homes, but also to increase rigour in building’s construction rules. It is necessary to develop an automatic monitoring system to ensure IEQ detailed data and analysis, as well as a healthy environment in at least public spaces. An integrated management system for IEQ can be used as a significant assessment and decision-making tool to plan interventions in useful time for enhanced living environments and occupational health. Simple behavioural changes that are implemented by occupants can achieve significant positive impacts on IEQ, such as the use of natural ventilation and the avoidance of indoor smoking.
This paper presents the AirPlus, a mHealth solution for indoor real-time supervision that is based on IoT architecture. The proposed architecture incorporates a PMS5003ST sensor that provides particulate matter (PM), temperature, humidity, and formaldehyde supervision. The solution is composed of a hardware prototype for data collection and transmission, and mobile computing software for data consulting. The AirPlus is based on open-source technologies with several advantages as compared to existing systems, such as its modularity, scalability, low-cost, and easy installation.
The paper is structured as follows:
Section 2 covers the IEQ impacts on public health;
Section 3 presents the related work;
Section 4 is concerned to the methods and materials that are used in the system architecture development;
Section 5 presents the experimental results and discussion; and, the conclusion is presented in
Section 6.
2. Indoor Environmental Quality and Public Health
PM is a combination of solid and liquefied biological and mineral material particles that are suspended in the air. It is stated by several studies that PM is the pollutant that affects more people [
34,
35]. The PM includes dust, dirt, soot, smoke, and liquid droplets that can penetrate the lower airways of humans, leading to negative health effects. Environmental tobacco smoke is a major contributor to indoor air PM concentrations, and human exposures [
36]. The World Health Organization (WHO) considers threshold values of 10 μg·m
−3 (annual mean) and 50 μg·m
−3 (24-h mean) for PM
2.5 [
37]. There is increasing evidence of PM-related cardiovascular health effects, as well as a pathophysiological interconnection that links PM exposure with cardiopulmonary morbidity and mortality [
38,
39]. Fine particulate matter (PM
2.5), which is particles of aerodynamic diameter ≤ 2.5 μm, has been specially related to negative health effects [
40]. The mortality effect of PM
2.5 was responsible for ∼3.2 million premature deaths in 2010 [
41]. Therefore, monitoring and controlling IEQ is a complex and expensive task. In particular, the elderly people and people with cardiopulmonary problems should take precautions of PM
2.5 pollution minimizing outdoor PM
2.5 exposure [
42]. In China, over 1.3 billion people have high health risks that are associated to PM
2.5 exposure [
43]. Several studies show a consistent association between PM with exacerbations of illness in people with respiratory disease and an increase in the number of deaths from cardiovascular and respiratory diseases among elderly people [
44]. PM are estimated to cause more than 500,000 deaths annually [
45]. The PM adverse health effects include increased respiratory symptoms, decreased lung function, increased hospitalization, healthcare visits for respiratory and cardiovascular disease, increased respiratory morbidity, as measured by absenteeism from work and school, as well as other restrictions in activity and increased cardiopulmonary disease mortality [
46].
Formaldehyde is a carcinogenic substance; the exposure to this pollutant can cause eye and respiratory tract irritation and skin sensitization. Wood-pressed products, insulation materials, paints, varnishes, household cleaning products, and tobacco smoke are the main indoor sources of this pollutant [
47]. In 2010, the WHO established an IEQ guideline for formaldehyde exposure of 0.1 mg/m
3 (0.08 ppm) for 30-min. periods [
48]. In June 2014, the European Union (EU) classified formaldehyde as a factor of cancer. When considering the indoor living environments, there are several activities that increase formaldehyde concentrations [
49]. A study that was conducted by [
50] associates asthma with very early exposure of children to formaldehyde. Therefore, the formaldehyde real-time supervision is significant to decrease the risk factors for asthma in early childhood and to plan interventions to decrease the exposure levels for symptoms reduction. There is also a risk association between formaldehyde and lymphohematopoietic malignancies and nasal cancer [
51]. The formaldehyde effects in adults health is much smaller than in children, therefore, an automatic monitoring system is particularly important for indoor living environments that are occupied by children [
52].
Thermal comfort can be influenced by several factors and people trend to ensure temperature and humidity conditions in detriment of visual and acoustic comfort and IAQ [
53]. In general, the comfort temperature ranges from 17 °C to 30 °C. Thermal comfort is influenced by six factors: air temperature, radiant temperature, air velocity, humidity, clothing insulation, and metabolic heat. The first four factors can be measured, and the last two are personalised factors [
54].
Buildings are an integral part of smart cities. They are responsible for about 40% of the global energy consumption and over 30% of the CO2 emissions. A large proportion of building energy consumption is used to ensure thermal comfort. These justify temperature and humidity monitoring in real-time to provide accurate data for analysis to ensure thermal comfort and promote energy efficiency.
Nowadays, buildings IEQ are based on random sampling. However this procedure provides information that is related to a specific sampling, the information is devoid of details of spatial-temporal variations that are relevant to promote health and well-being. AirPlus architecture provides a reliable flow of data. The AirPlus is proposed to provide PM, formaldehyde, temperature, and humidity monitoring to allow the early detection and correction of unhealthy conditions. A detailed evaluation of the historical environment data regarding PM and formaldehyde exposure can be used as a significant decision-making tool for enhanced health and well-being. In particular, PM and formaldehyde monitoring provide real-time data to trigger notifications for behavioural modifications in enhanced living environments and occupational spaces. Furthermore, appropriate legislation and policies are required to define the exposure limits for developing reliable monitoring methods.
3. Related Research
Numerous monitoring solutions are available in the literature; here, we describe some of them. Several IoT architectures for IEQ monitoring are proposed by [
55,
56,
57,
58,
59,
60]. They incorporate open-source technologies for data processing and transmission, as well as microsensors for data acquisition. These architectures allow access to data collected from different sites simultaneously through Web access and mobile applications in real-time.
A Raspberry Pi based system for carbon dioxide (CO
2) monitoring using a hybrid wireless sensor network (WSN) and IoT architecture is proposed by [
61]. This system is connected to the Internet using Wi-Fi and it provides web software for data consulting.
A wearable system designed while using a WSN architecture for indoor air and lighting quality supervision based on the Arduino Platform is proposed by the authors of [
62]. This system uses ZigBee communication technologies for data transmission.
The design and implementation of an IEQ monitoring solution using low-cost sensors and open source hardware/software are proposed by [
63]. This solution is based on a Arduino UNO microcontroller. It provides economic and consistent IEQ data. This system incorporates a mobile application for data consulting.
A WSN architecture for IEQ is proposed by the authors of [
64]. This experiment investigates undergraduate students’ concentration during a lecture due to IEQ in the classroom. This solution provides temperature, relative humidity, and CO
2 levels supervision while using a WNS based air quality monitoring system. It provides a desktop application for data accessibility.
An automatic IEQ monitoring system for areas with high density of population and vehicles is proposed by [
65]. The system is based on WSN architecture. It provides meteorological and air pollution data monitoring in real-time, such as air velocity and direction, temperature, humidity, and carbon monoxide (CO) concentration. The solution incorporates several nodes and coordinators. The coordinators receive data from the sensor nodes and they transmit it to a remote database using GSM.
An IoT based air-quality monitoring solution is developed by [
66]. The proposed method provides comprehensive IEQ data based on information collected from cost-effective sensors in real-time equipped with colour LED display. This system uses a TIMSP430 as microcontroller.
A hybrid IoT and WSN architecture for IEQ monitoring is proposed by [
67]. This system monitors CO
2, CO, sulphur dioxide (SO
2), nitrogen dioxide (NO
2), ozone (O
3), Chlorine (Cl
2), temperature, and relative humidity. A backup and data resubmission mechanism is implemented to provide Internet communication reliability in the case of radio communication failure or Internet disconnection.
Table 1 presents a review summary of the IEQ monitoring systems.
Table 1 shows that the less used technology for data communication is cabled Ethernet, being followed by GSM. The most used communication technology is ZigBee, which is commonly used to provide data communication across sensor’s nodes on WSN architectures. Bluetooth low energy (BLE) is also implemented on several applications. Furthermore, only three solutions, as described in
Table 1, provide software for data consulting and no one of the previous proposed solutions incorporates easy-installation and notifications features.
4. Materials and Methods
IEQ plays a major role in public health problems, as many people spend more than 90% of their time inside buildings, as explained above. PM, temperature, humidity, and formaldehyde are key parameters to be monitored for enhanced living environments and occupational health. Temperature and humidity supervision make part of daily life, since they can be perceived by the occupants; however, real-time air quality monitoring is not installed in most buildings. Therefore, a reliable, cost-effective, modular, scalable, and easy configuration and installation IoT architecture for IEQ real-time supervision solution is proposed by the authors. The proposed system is a PM, temperature, humidity, and formaldehyde monitoring solution that incorporates a notification framework for real-time alerts. The hardware and software used for system development is discussed in detail.
4.1. Design and Architecture
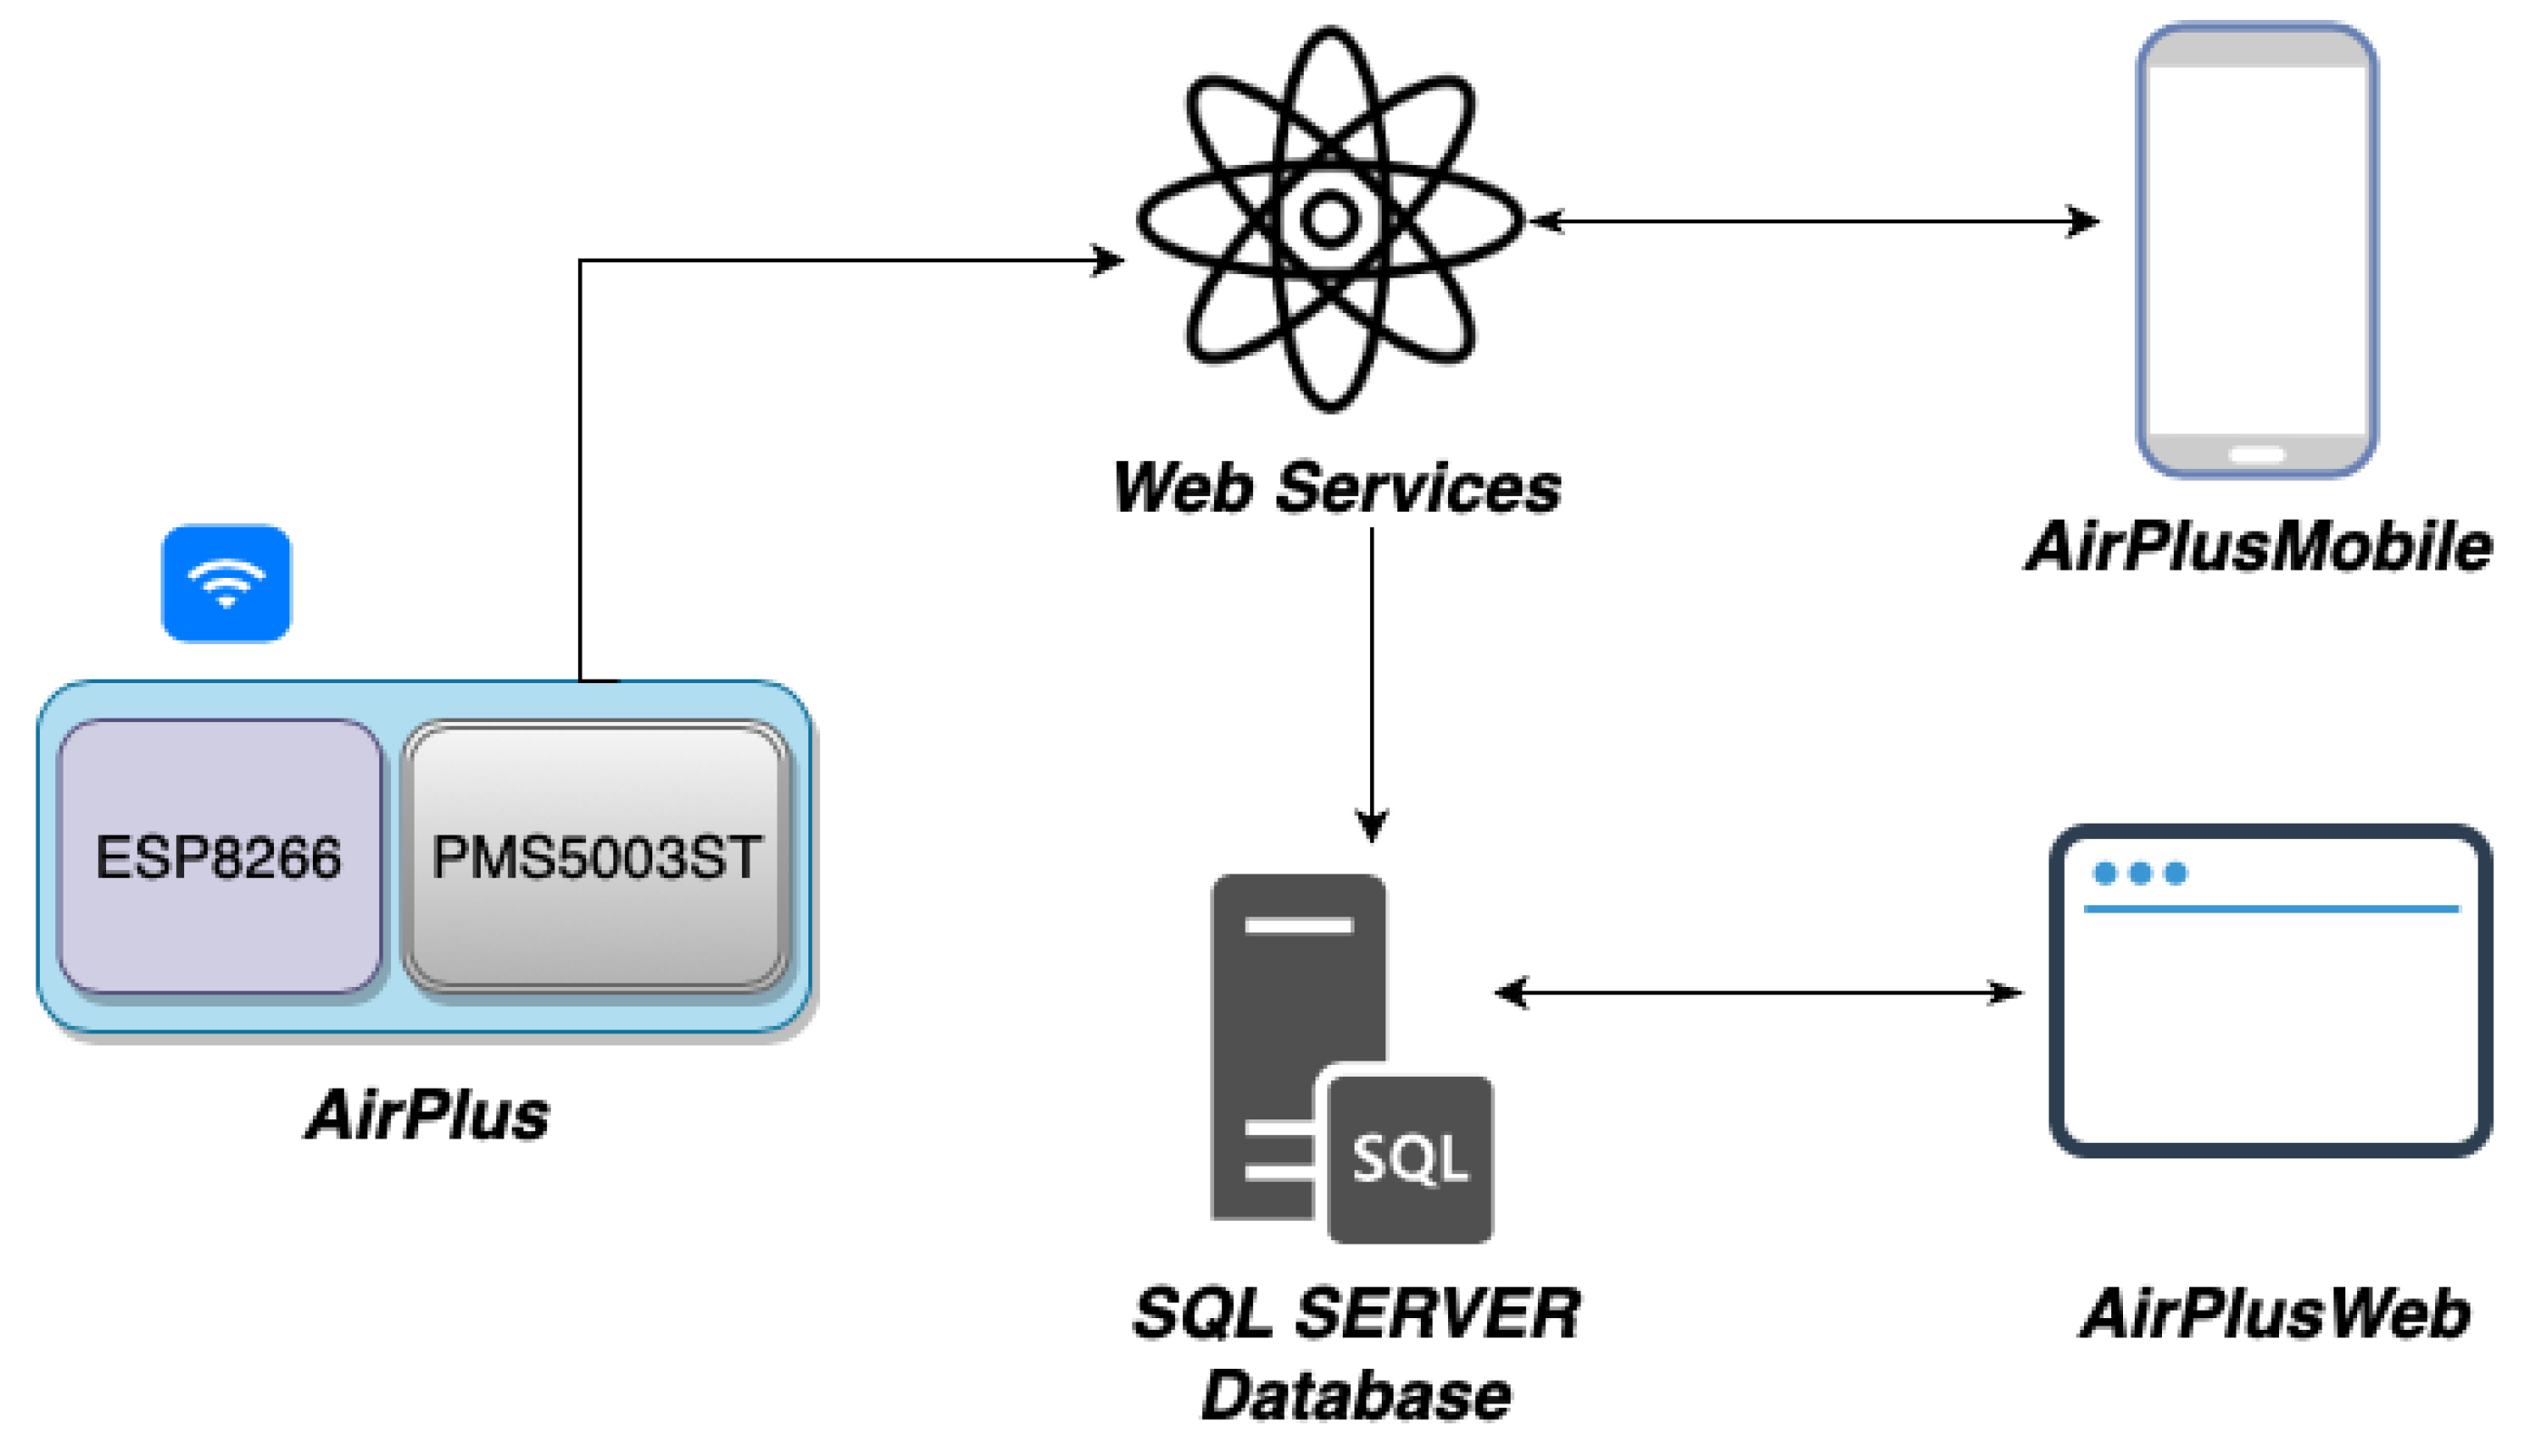
The system architecture includes an acquisition module for data collection and data transmission. AirPlus incorporates web and mobile compatibility for data consulting and notifications. The monitored data is stored in a Microsoft SQL Server database while using web services. For data consulting a web portal named AirPlusWeb and a mobile application for iOS named AirPlusMobile have been developed using ASP.NET and Swift, respectively (
Figure 1).
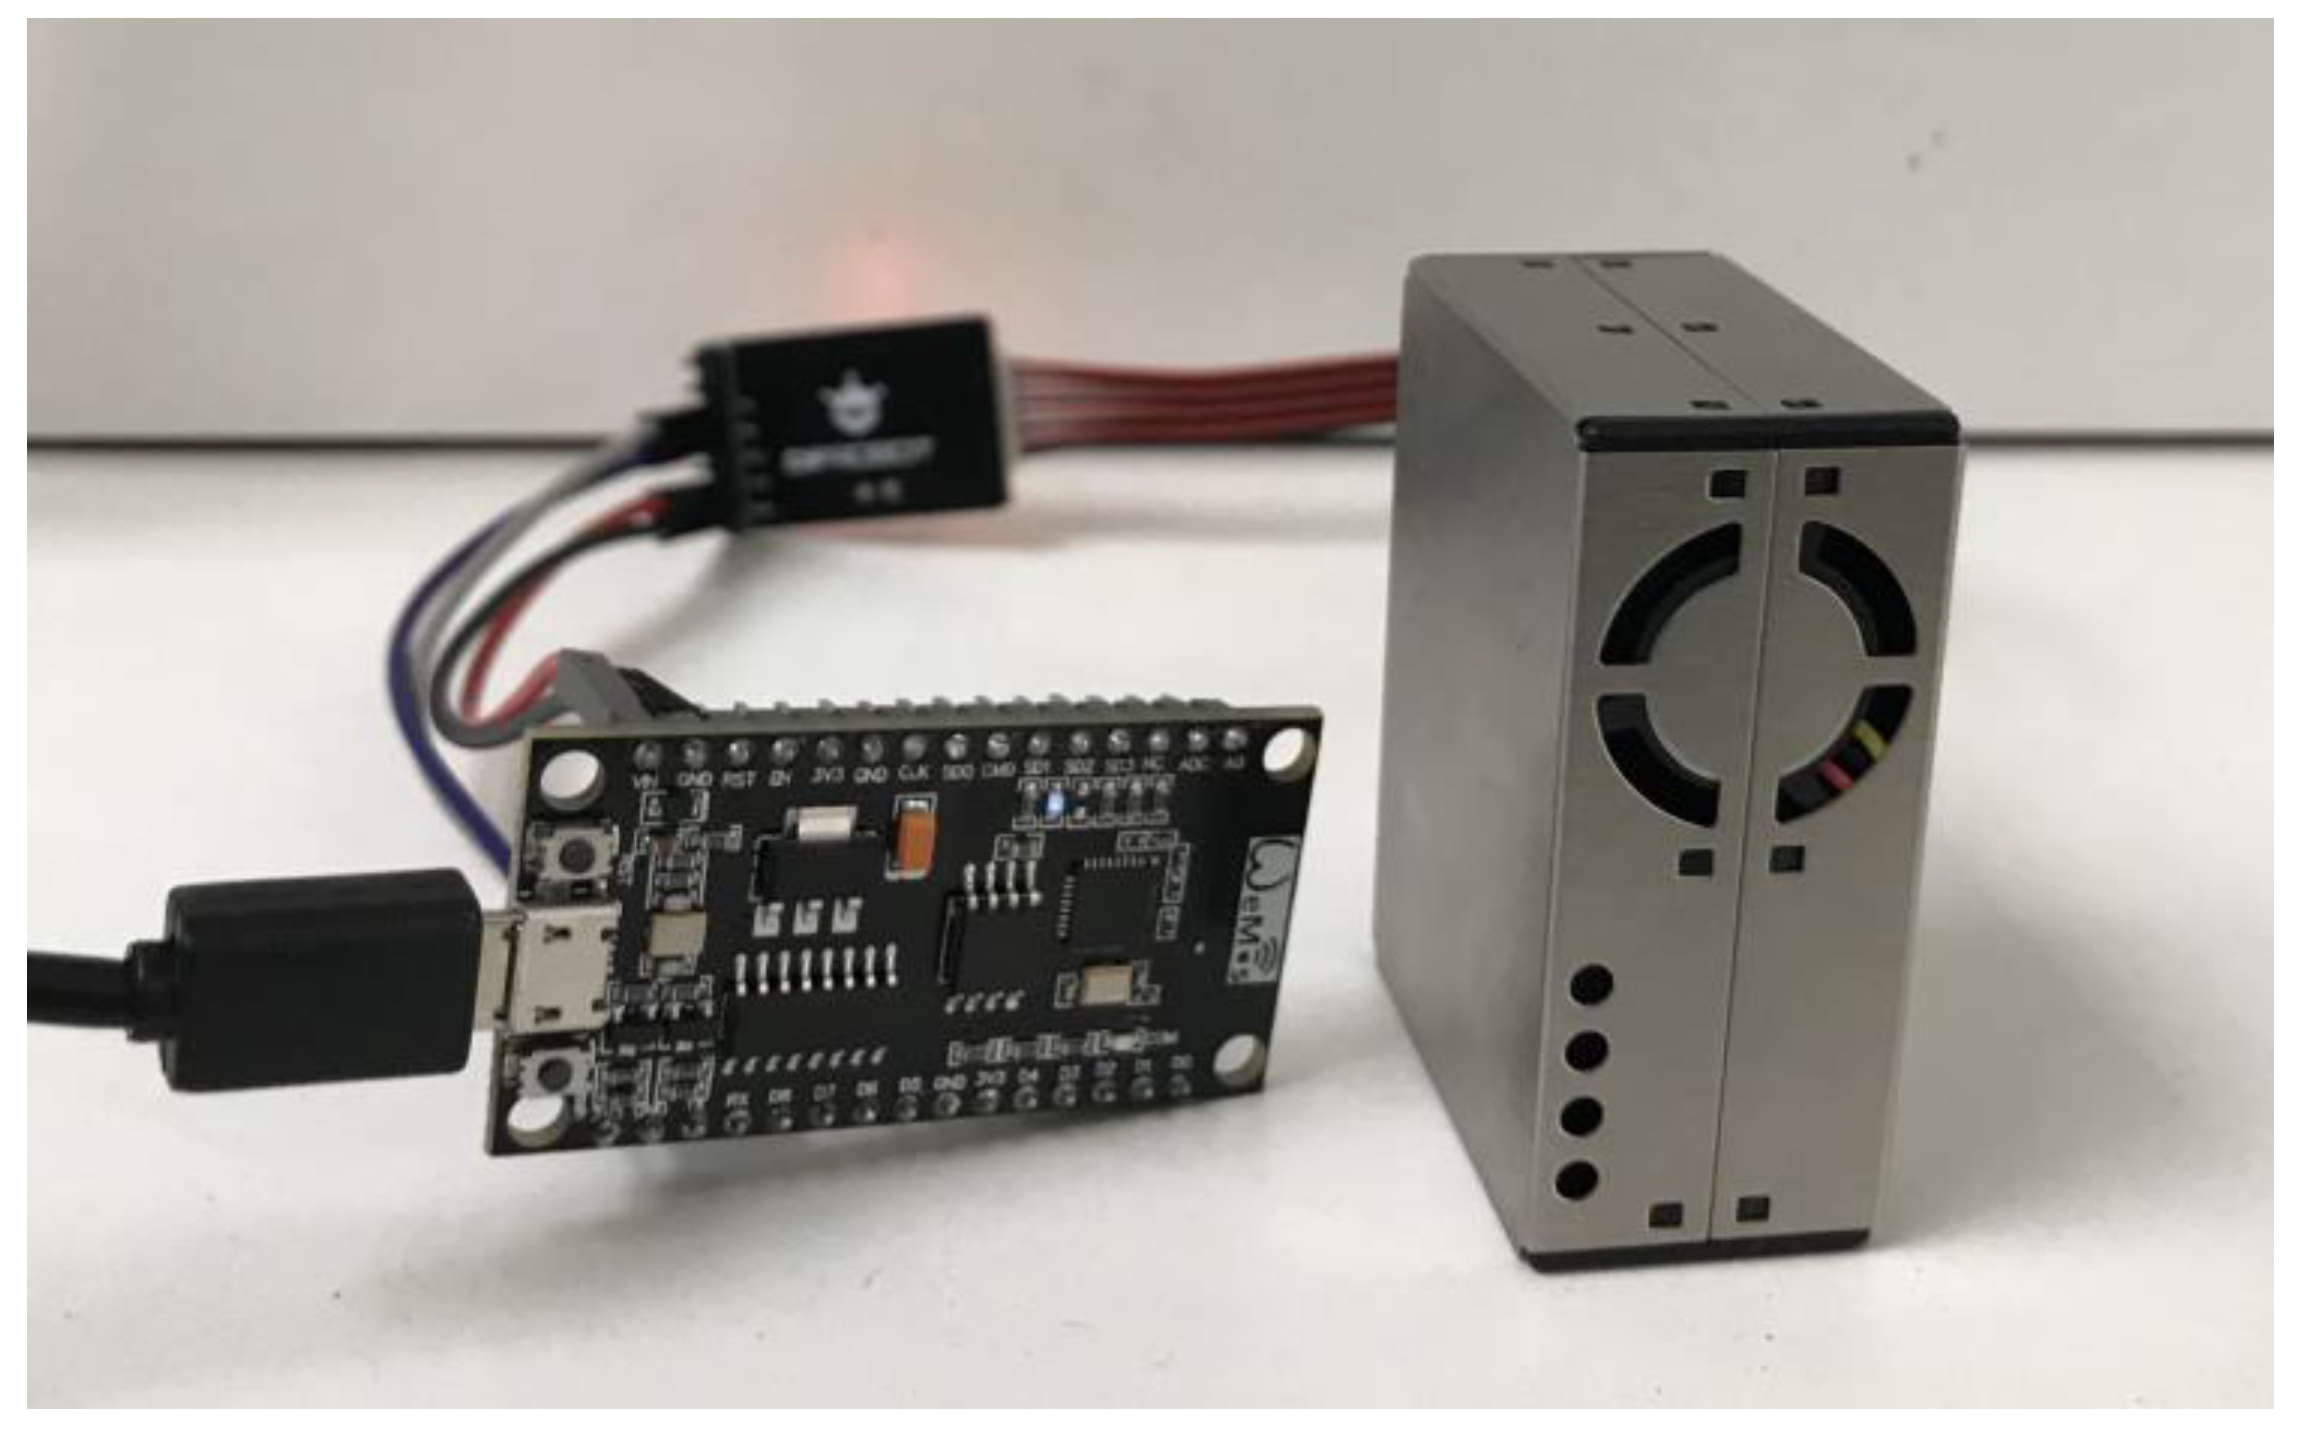
The acquisition module is based on open-source technologies that provide several advantages, such as modularity, scalability, low-cost, and easy installation. The AirPlus incorporates: a microcontroller with native Wi-Fi support; an ESP8266 (WEMOS Electronics, China); and, a PM, temperature, humidity, and formaldehyde sensor module (DFRobot, Shanghai, China) that is connected while using the serial interface. This system is an entirely wireless solution that implements the IEEE 802.11 b/g/n networking protocol, a family of specifications developed by the IEEE for WLANs. The IEEE 802.11 standard supports radio transmission within the 2.4 GHz band. The acquisition module is composed of two components: a microcontroller and a PMS5003ST sensor that was developed by PLANTOWER (Beijing Plantower Co., Ltd, Beijing, China).
Figure 2 shows the acquisition module that was developed by the authors.
The NodeM ESP8266 module (WEMOS Electronics, China) is based on the ESP8266 system on chip from (ESPRESSIF SYSTEMS, Shanghai, China) with an extra memory size of 32 Mb. The module has USB-TTL serial converter CH340G, with micro-USB socket, and it can be powered from 4~9 V DC. The NodeM incorporates digital 10 GPIOs (D0-D10), PWM functionality, I2C and SPI communication, 1-Wire, and 1 analogue input. The proposed architecture provides an easy Wi-Fi configuration. The AirPlus is by default a Wi-Fi client, but if it is unable to connect to any previous configured Wi-Fi network a hotspot will be created with an SSID “AirPlus”. The end-user can access this hotspot to configure the Wi-Fi network to which the AirPlus is going to connected. This functionality provides a significant advantage. On the one hand, this is a turn-key solution; the system can be easily installed by the owner, making it more competitive and commercially interesting and attractive. On the other hand, this feature prevents privacy issues that are related to the entry of unknown individuals into the home of the end user.
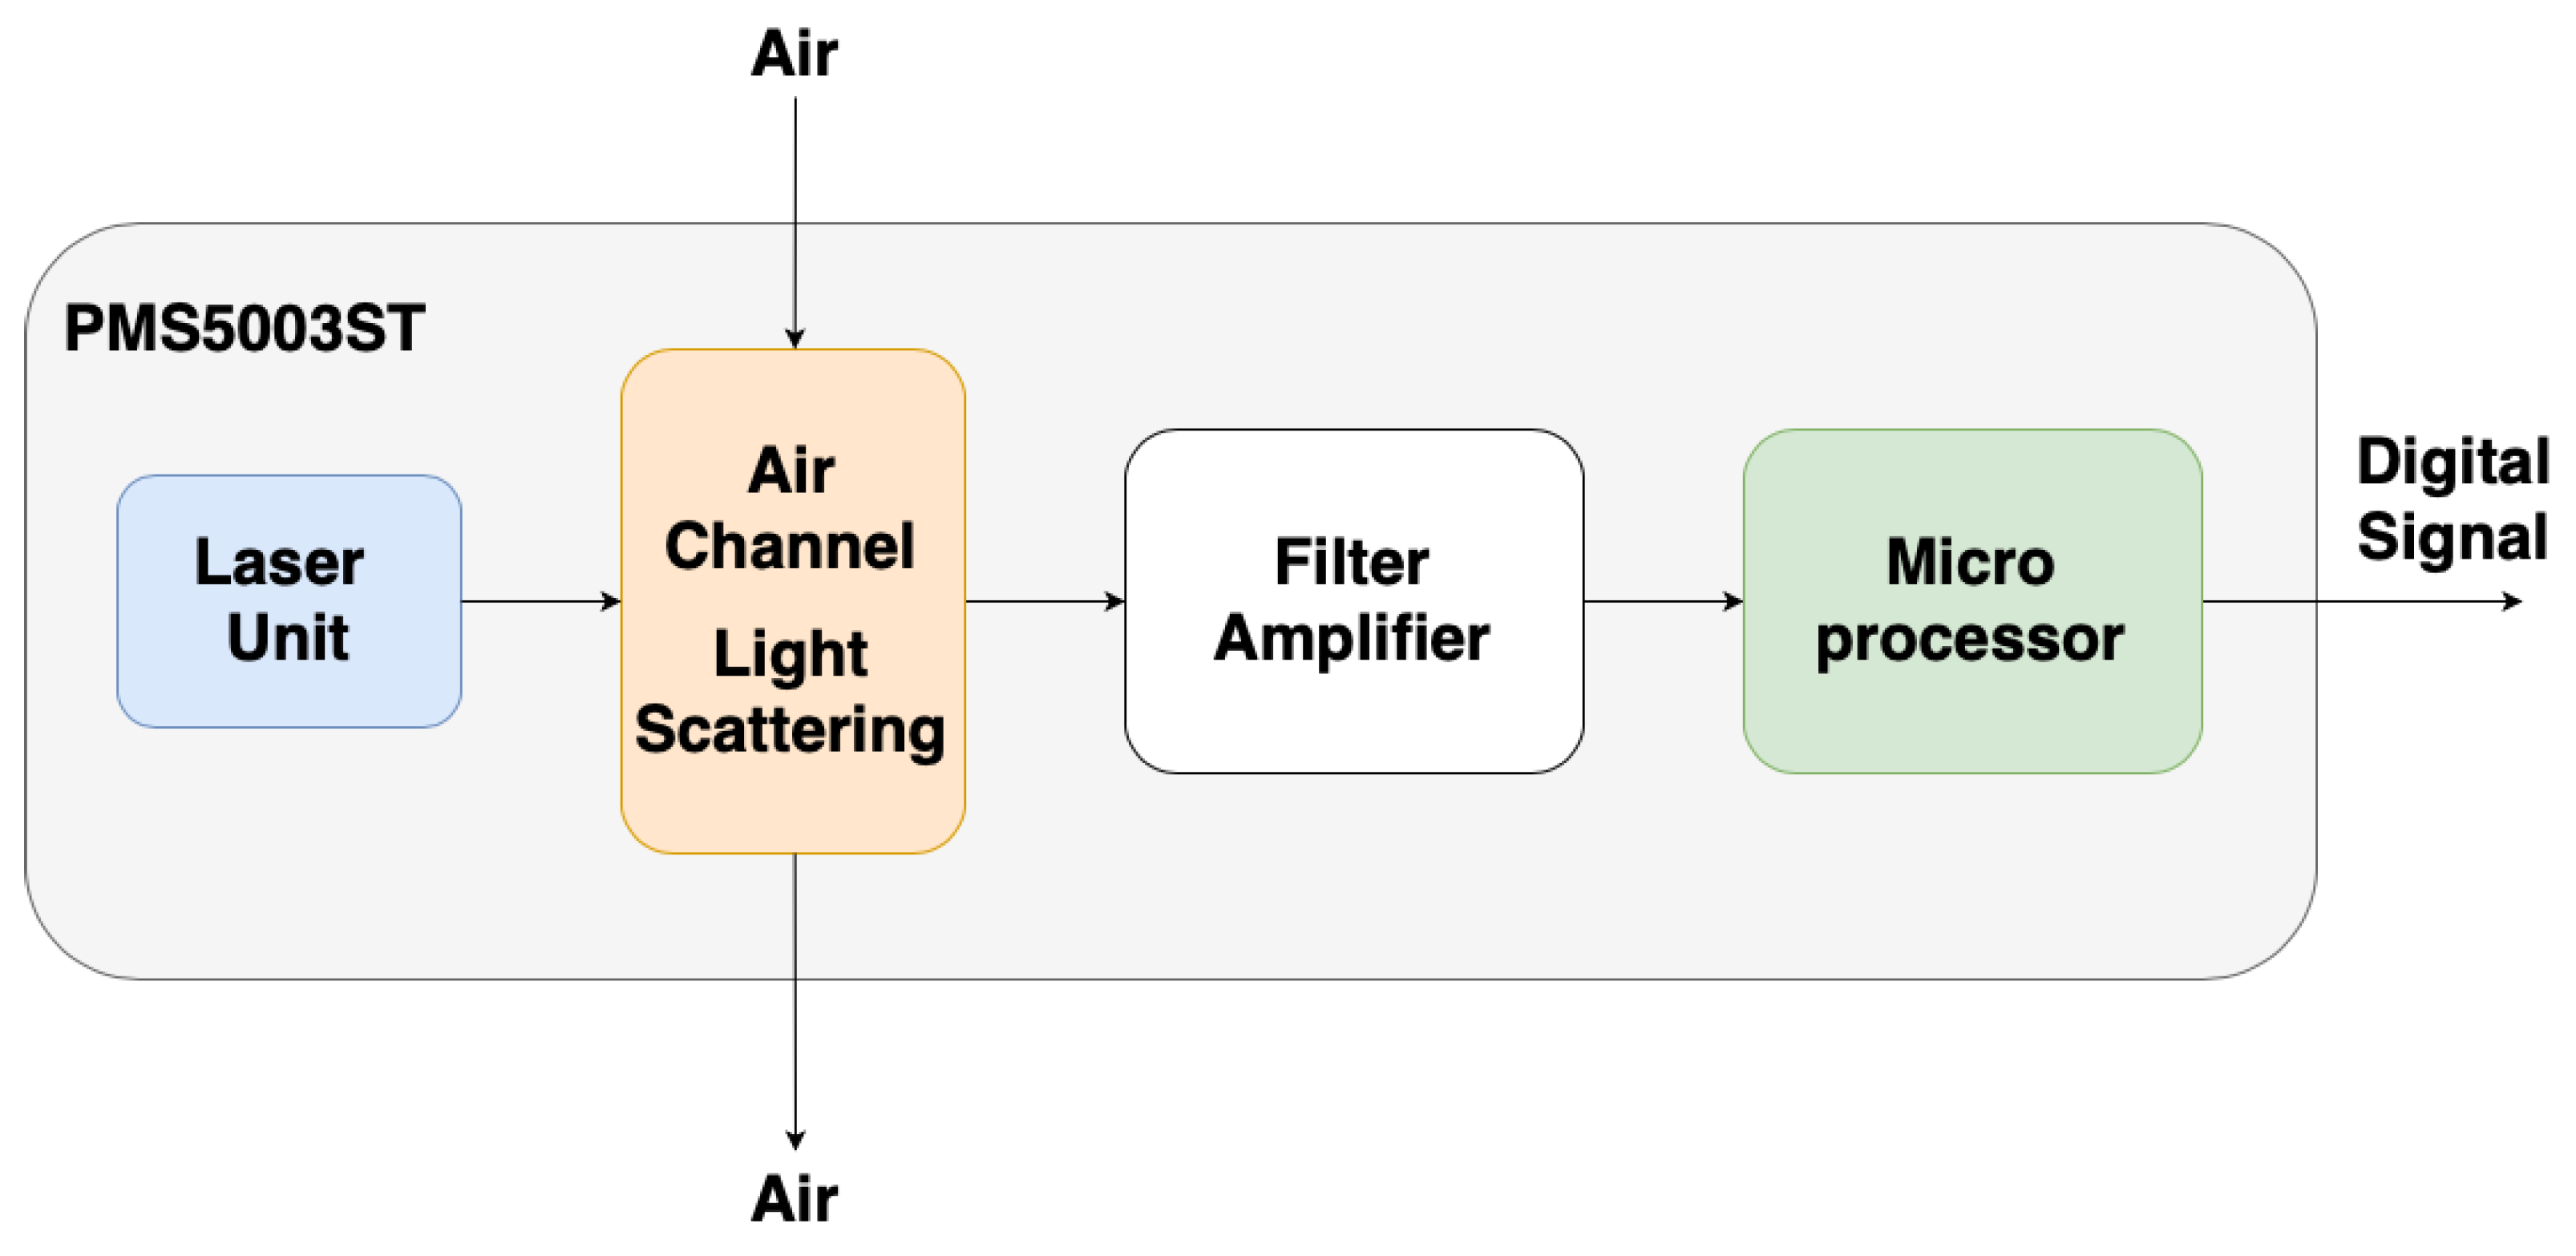
The PMS5003ST (Beijing Plantower Co., Ltd, Beijing, China) is a multifunction sensor that can measure the concentration of particles and formaldehyde, as well as temperature and humidity levels. This sensor can be used to provide particle concentration levels by calculating the number of suspended particles in the air using the laser scattering principle. Moreover, this sensor module incorporates an electrochemical probe for formaldehyde detection and a built-in sensor unit for temperature and humidity. This sensor uses a laser unit to generate scattering to radiate the suspending particles in the air (
Figure 3).
Over time, the scattering light is collected and the curve of scattering light change is obtained. PMS50003ST calculates the equivalent particle diameter and the number of particles with its diameter. It is done with a built-in microprocessor while using MIE scattering theory [
68]. The formaldehyde concentration is calculated using the electrochemical theory and a math algorithm.
The PMS50003ST sensor module works with 5 V operating voltage, 100 mA and 200 μA for active and standby current, respectively. The total response time is less than 10 s. The operating temperature and humidity range are −10~60 °C and 0~99%, respectively. The sensor dimensions are 50 mm × 38 mm × 21 mm and it weighs 50 g.
Table 2 shows the technical specification of the parameters measured by the sensor.
The AirPlus is a cost-effective system for indoor quality monitoring for enhanced living environments and occupational health. The cost of the system is an estimated of 96.40 USD (
Table 3); the prices were obtained from eBay and DFRobot (accessed on 10 June 2019).
The sensing activity is updated in every 30 s and stored in the SQL SERVER database. This value can be updated, depending on the requirements of the installation.
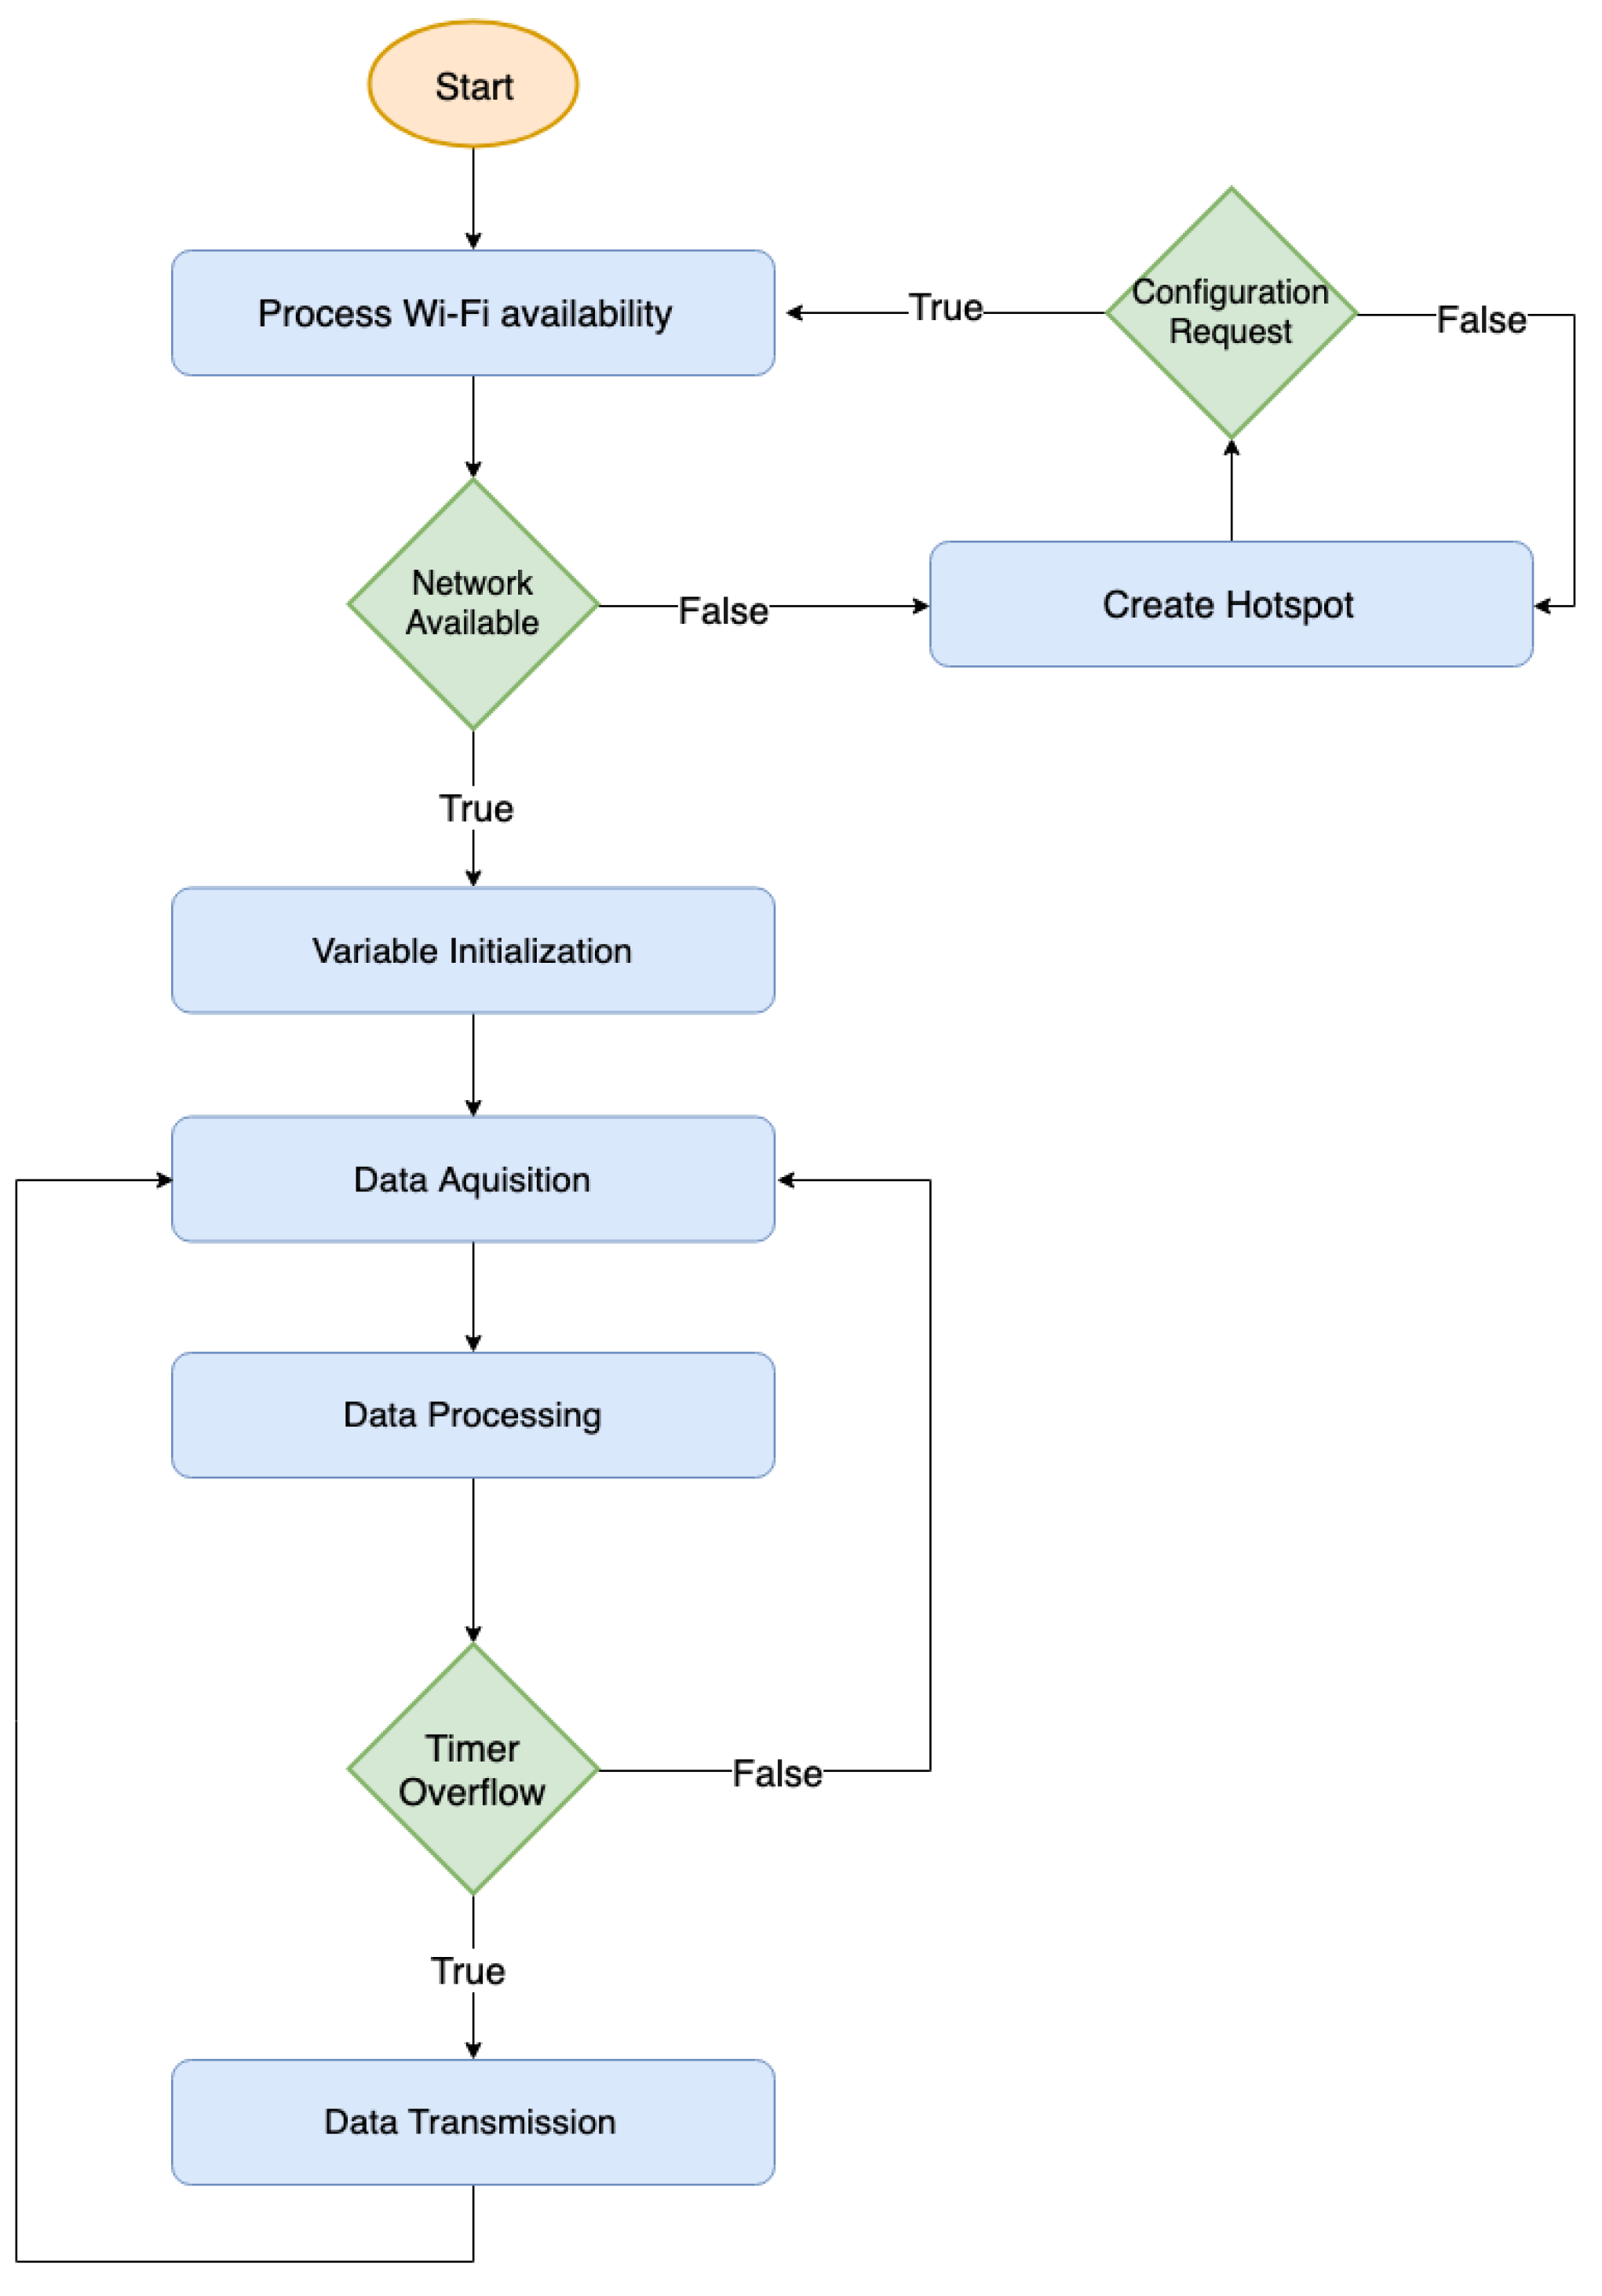
Figure 4 shows a flowchart of the acquisition module.
On start, the acquisition module handles the Wi-Fi availability. If one saved network is available, the system tries to connect to that network. In the case that there are no networks available for connecting, the system turns into a hotspot and wait for new Wi-Fi SSID and password data. After variable initialization, the system handles the data acquisition from the sensor and the data is then processed. If the defined timer is overflowed, the system sends the data to the remote database.
4.2. System Implementation
The collected data are uploaded to the SQL Server database while using .NET web services. The AirPlusWeb and the .NET web services are hosted at the same Windows Server instance. Moreover, the .NET web services are used as middleware to share the data collected by the acquisition module and to support the network requests from the mobile application. The web software is directly connected to the SQL Server database while using SQL Server authentication.
ASP.NET is an open-source server-side application framework to create dynamic web sites, web applications, and web services. The ASP.NET framework technology supports native optimization, early binding, caching services, and just-in-time compilation. On the one hand, ASP.NET incorporate built-in Windows authentication for more safe and secure development, supports continuous page components monitoring, and is purely server-side. On the other hand, using ASP.NET facilitates the web application provides support, since the source code is executed on the server. Microsoft SQL Server is a Relational Database Management System (RDBMS). The SQL Server database provides several enhanced features for database maintenance, performance, recoverability, and availability. This RDBMS provides easy installation via a setup wizard; it supports automatic updates, policy-based management for enhanced security, built-in transparent data compression features, along with encryption and effective data management and data mining tools. ASP.NET and SQL Servers were selected for the development of the proposed web software (
Figure 5) because of the above mentioned advantages.
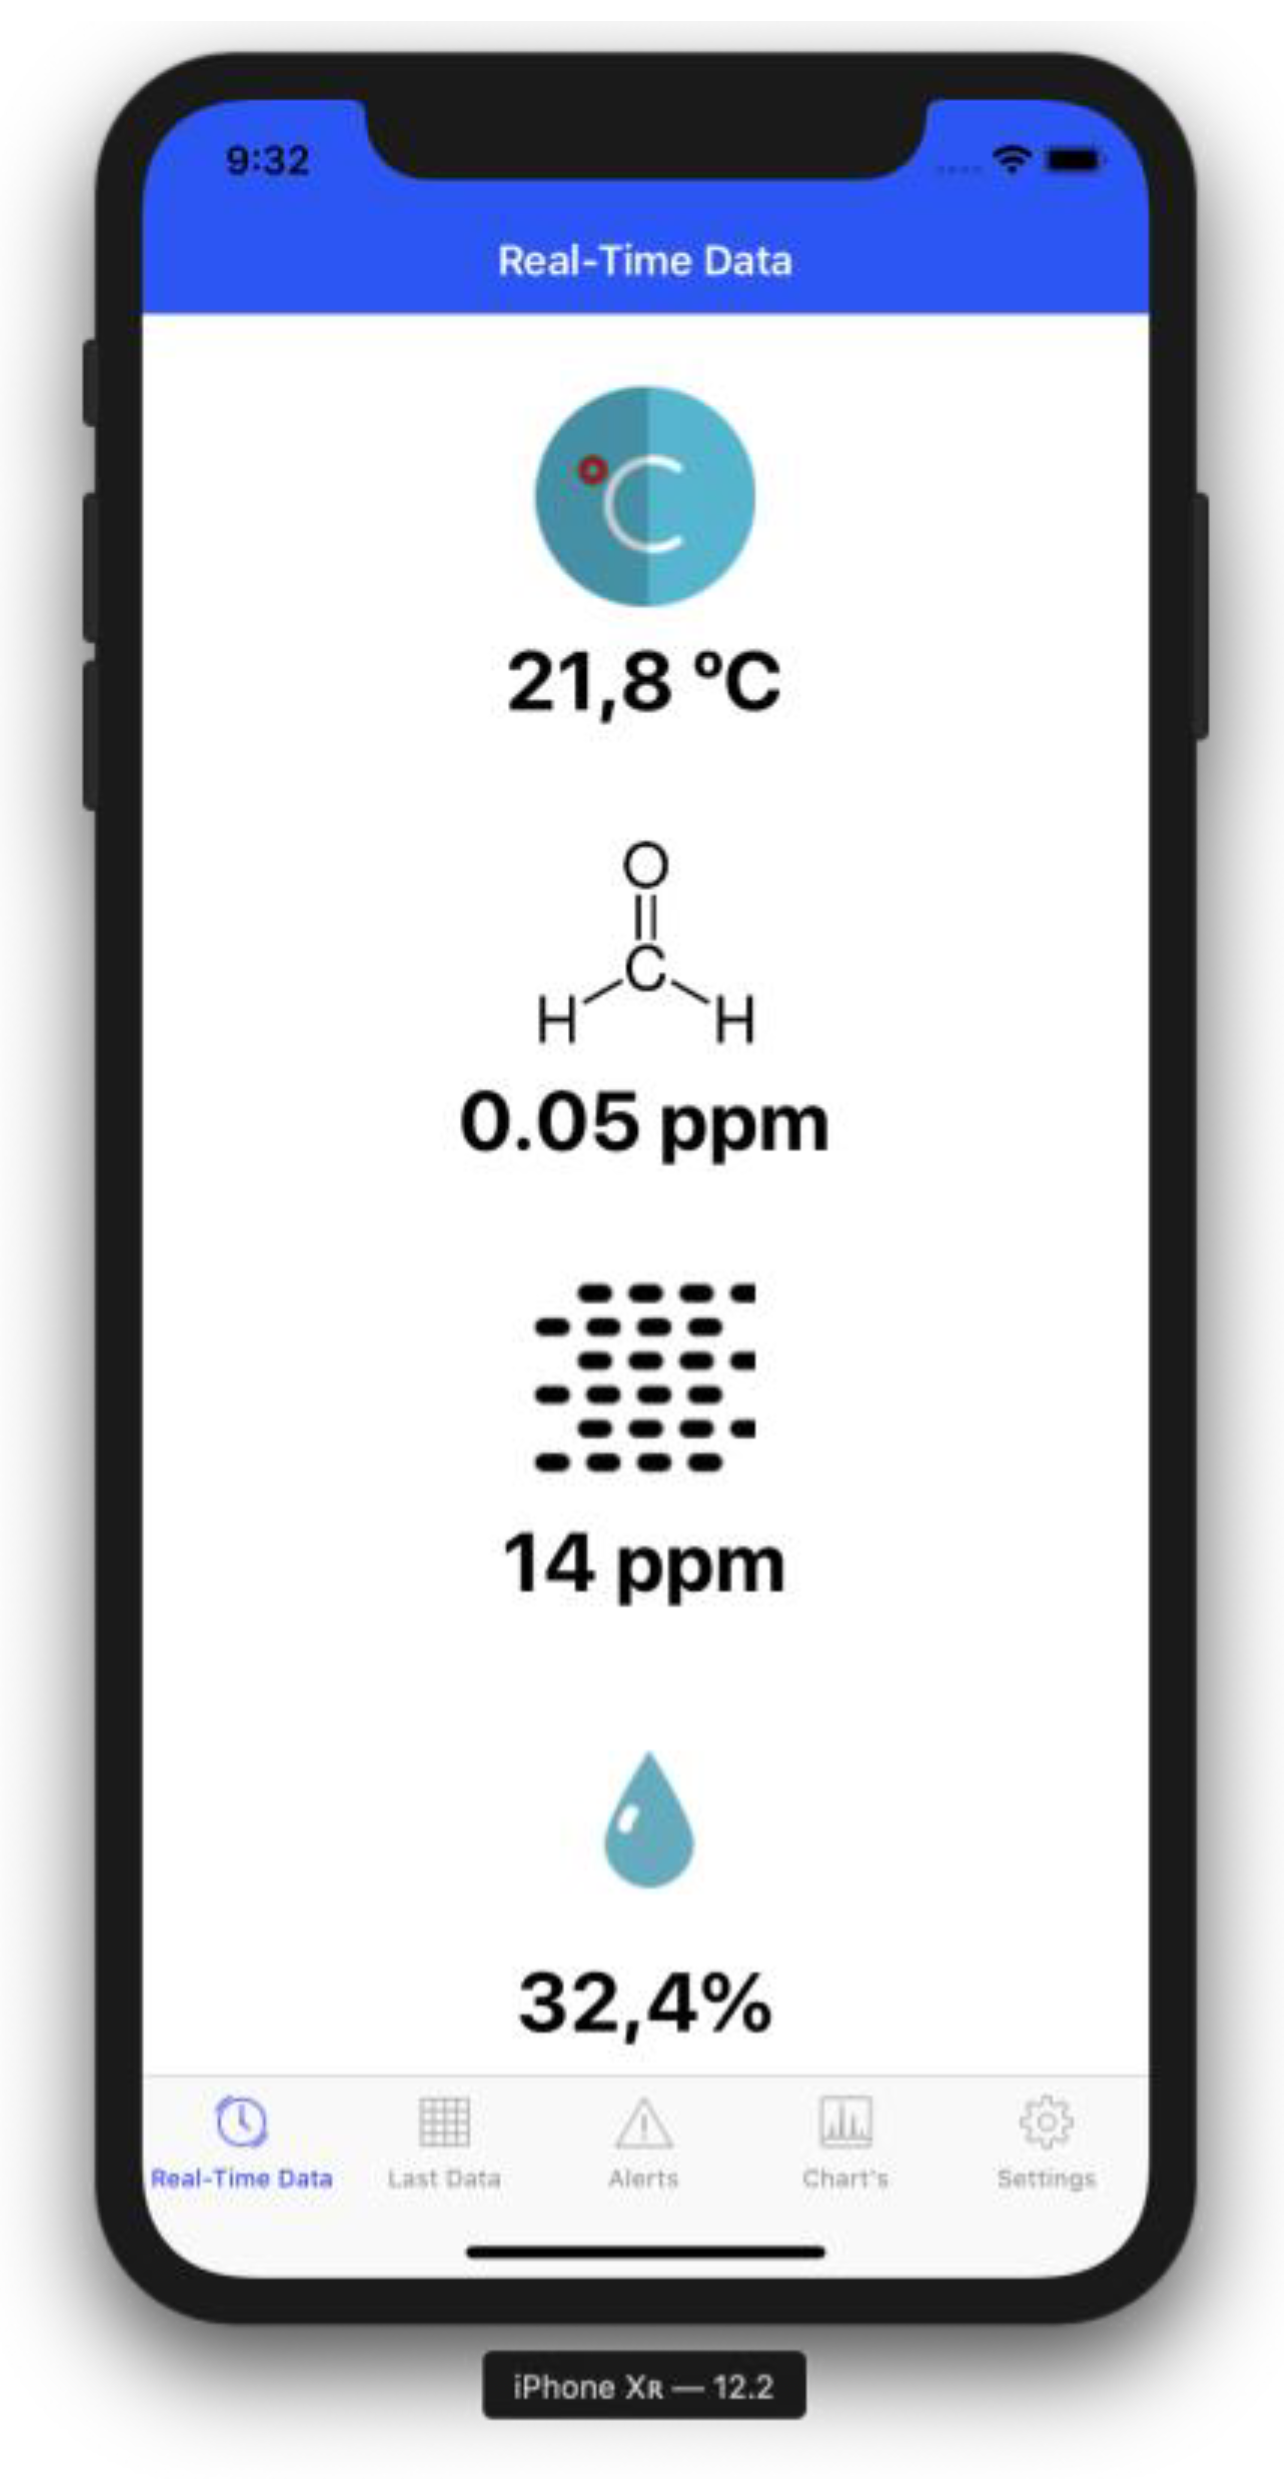
The iOS application is denominated AirPlusMobile. It has been developed with Swift programming language in Xcode integrated development environment, and it is compatible with iOS 12 and following versions (
Figure 6).
The mobile software supports several features, as it permits not only real-time consulting of the last data collected in both numeric and chart form, but also receiving real-time notifications to alert the occupants when the environmental quality is defective. This mobile application can be also used to configure the setpoints for these alarms. Using this mobile software, the occupants can consult the environmental data in real-time after successful authentication. The occupants can keep the parameters history for further analysis and visualization. Furthermore, the proposed solution can be used as a decision-making tool to plan interventions that are supported by the data collected. The solution provides precise and detailed data analysis for detecting patterns of poor indoor quality scenarios.
5. Results and Discussion
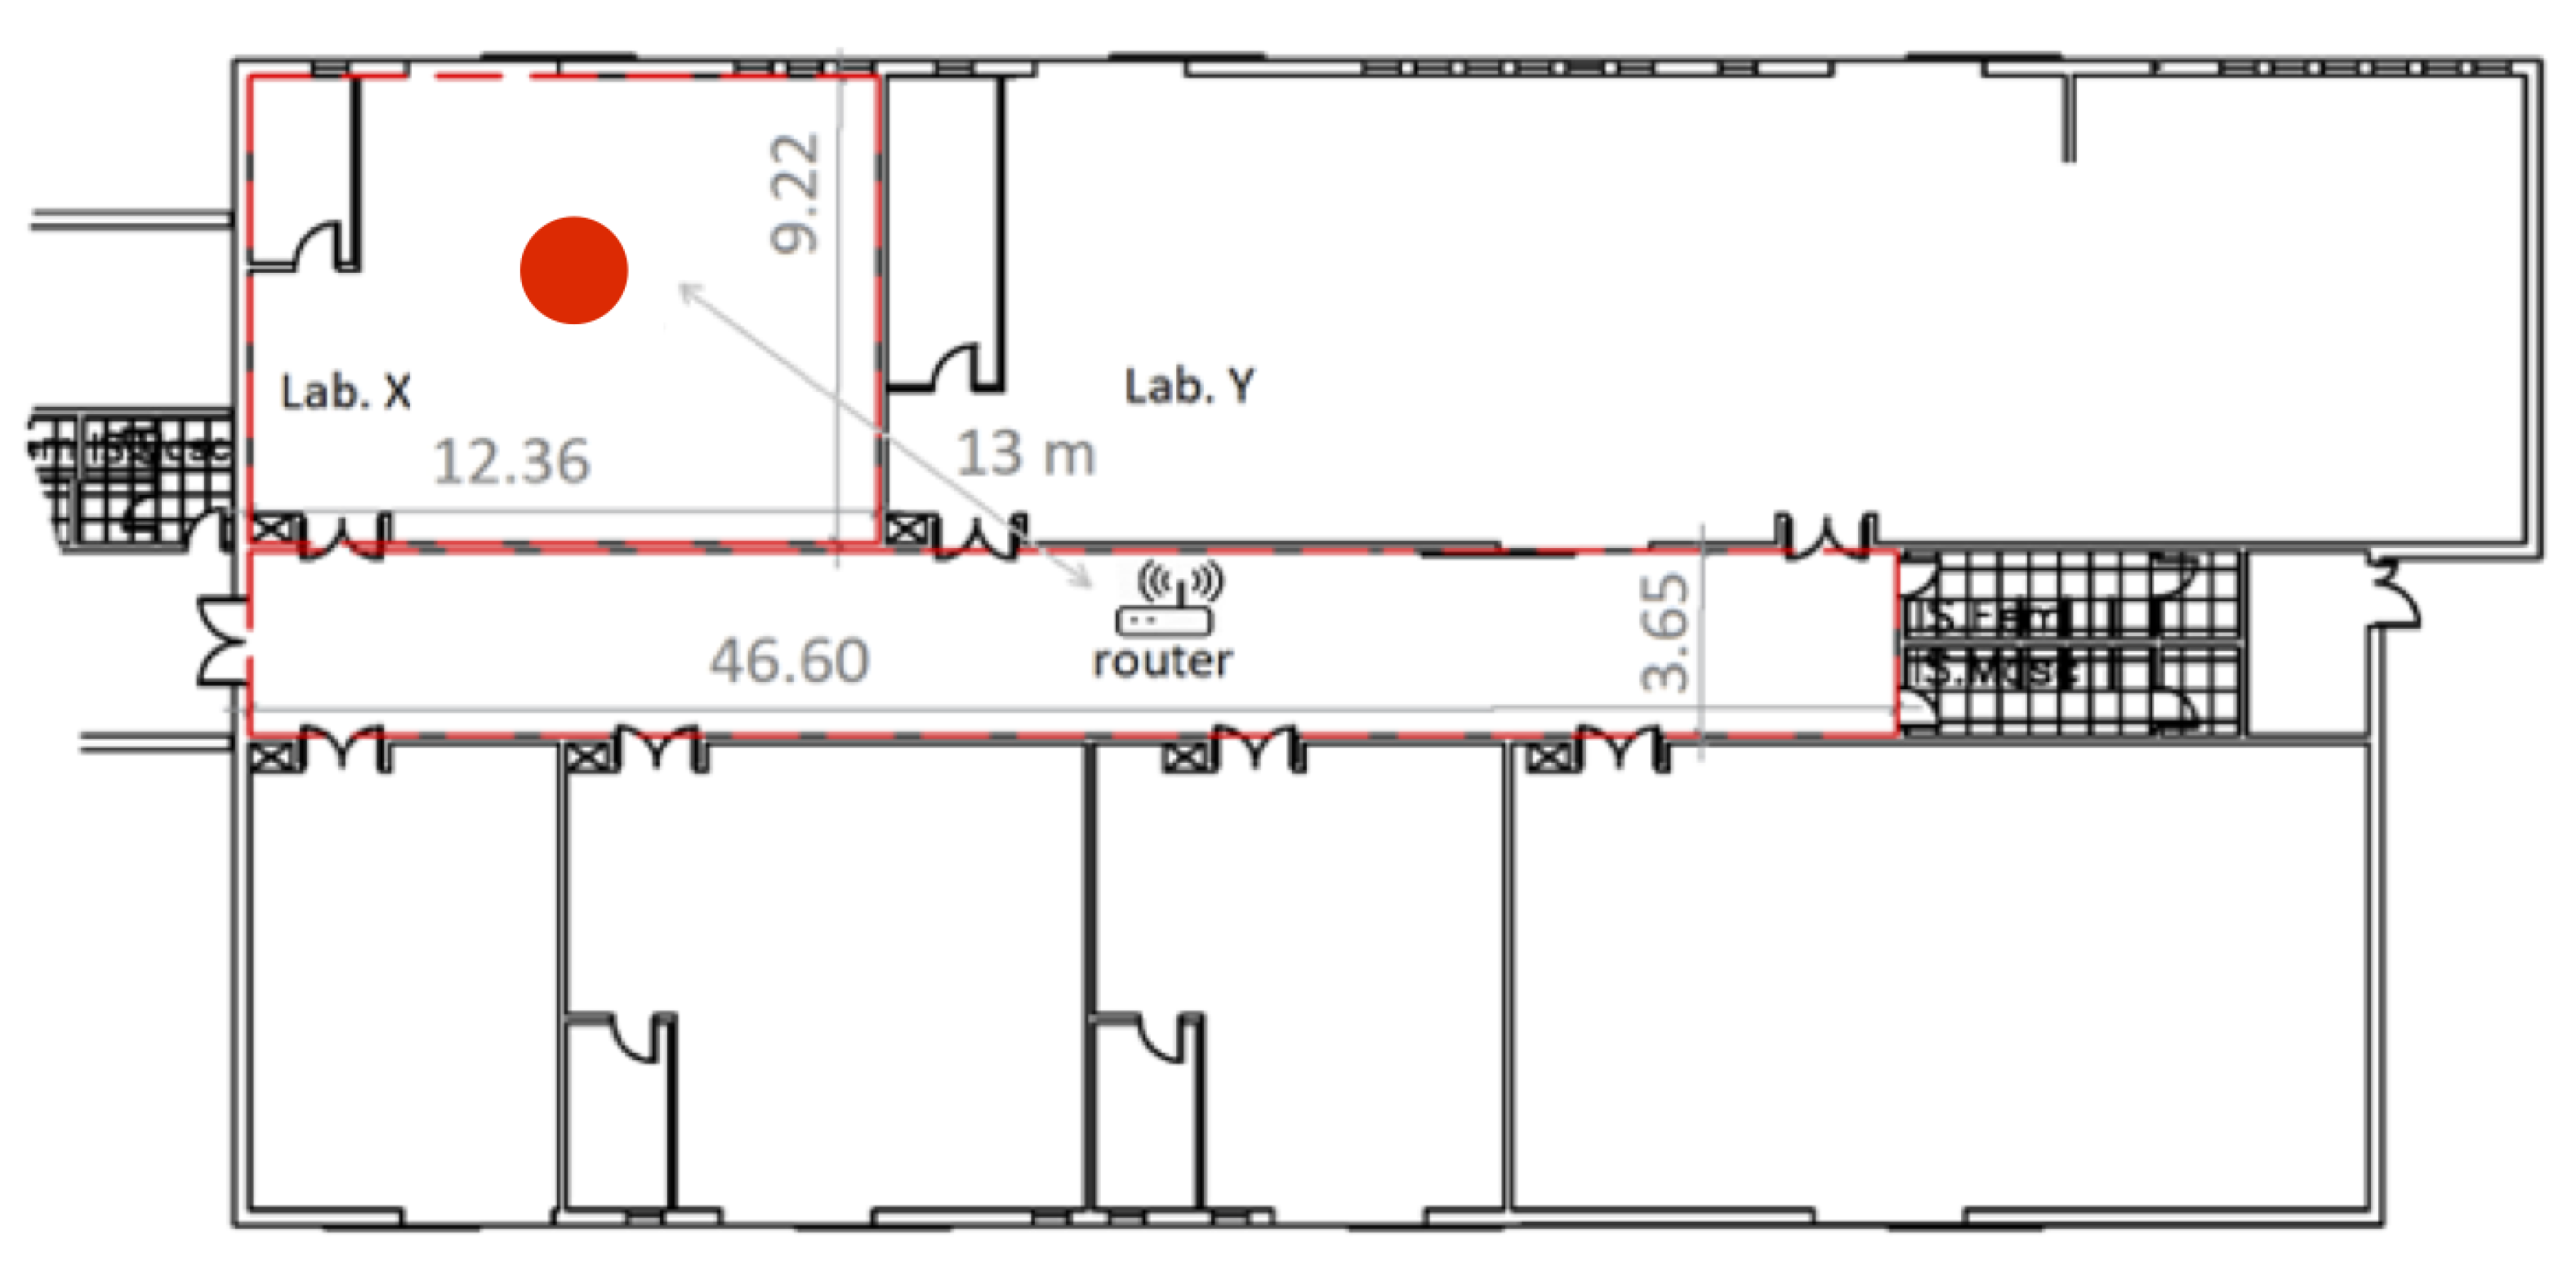
Buildings IEQ are influenced by numerous factors, such as construction quality, dwelling, isolation methods, and ventilation types. As there are people that spend more than 90% of their time inside buildings IEQ monitoring is a requirement to detect unhealthy conditions for interventions planning to improve the building quality. In order to test the system functionality, a 114 m2 room was on-site monitored while using one AirPlus acquisition module.
Figure 7 shows the indoor mapping of the room. The acquisition module was positioned on the centre of the room and the router was positioned in the corridor at a distance of about 13 m. The monitored space is naturally ventilated without any dedicated ventilation slots on the facades. Natural ventilation is performed through uncontrolled air infiltration, with just doors and windows opening. The room is typically occupied by an average of 15 people on working days from 9 a.m. to 6 p.m. The proposed solution is powered by a 230V-5V AC-DC 2A power supply.
The temperature, humidity, PM, and formaldehyde data were collected during three months. Several highly defective situations were detected by the analysis of the collected data. Typically, these situations are not early detected by the occupants in useful time. Furthermore, these situations are only detected by people after long periods of exposure.
On the one hand, data analysis leads us to conclude that the IEQ is typically below healthy standards. The tests that were conducted showed that, under certain conditions, IEQ values can be considerably different than those that are considered to be healthy for standards. On the other hand, the use of the mobile computing software available for data access render the occupants more sensitive to the importance of IEQ, and help them to maintain better environmental conditions according to the consulted data.
The results that were achieved show the efficiency of the proposed architecture to collect and process the environmental data in real-time, as well as to provide reliable data for IEQ assessment. The monitored data can be used to detect IEQ patterns for effective intervention planning in enhanced living environments and occupational health. Moreover, the analysis of the monitored data can identify multiple defective situations which can be related to occupants’ habits and behaviours that impact negatively the IEQ.
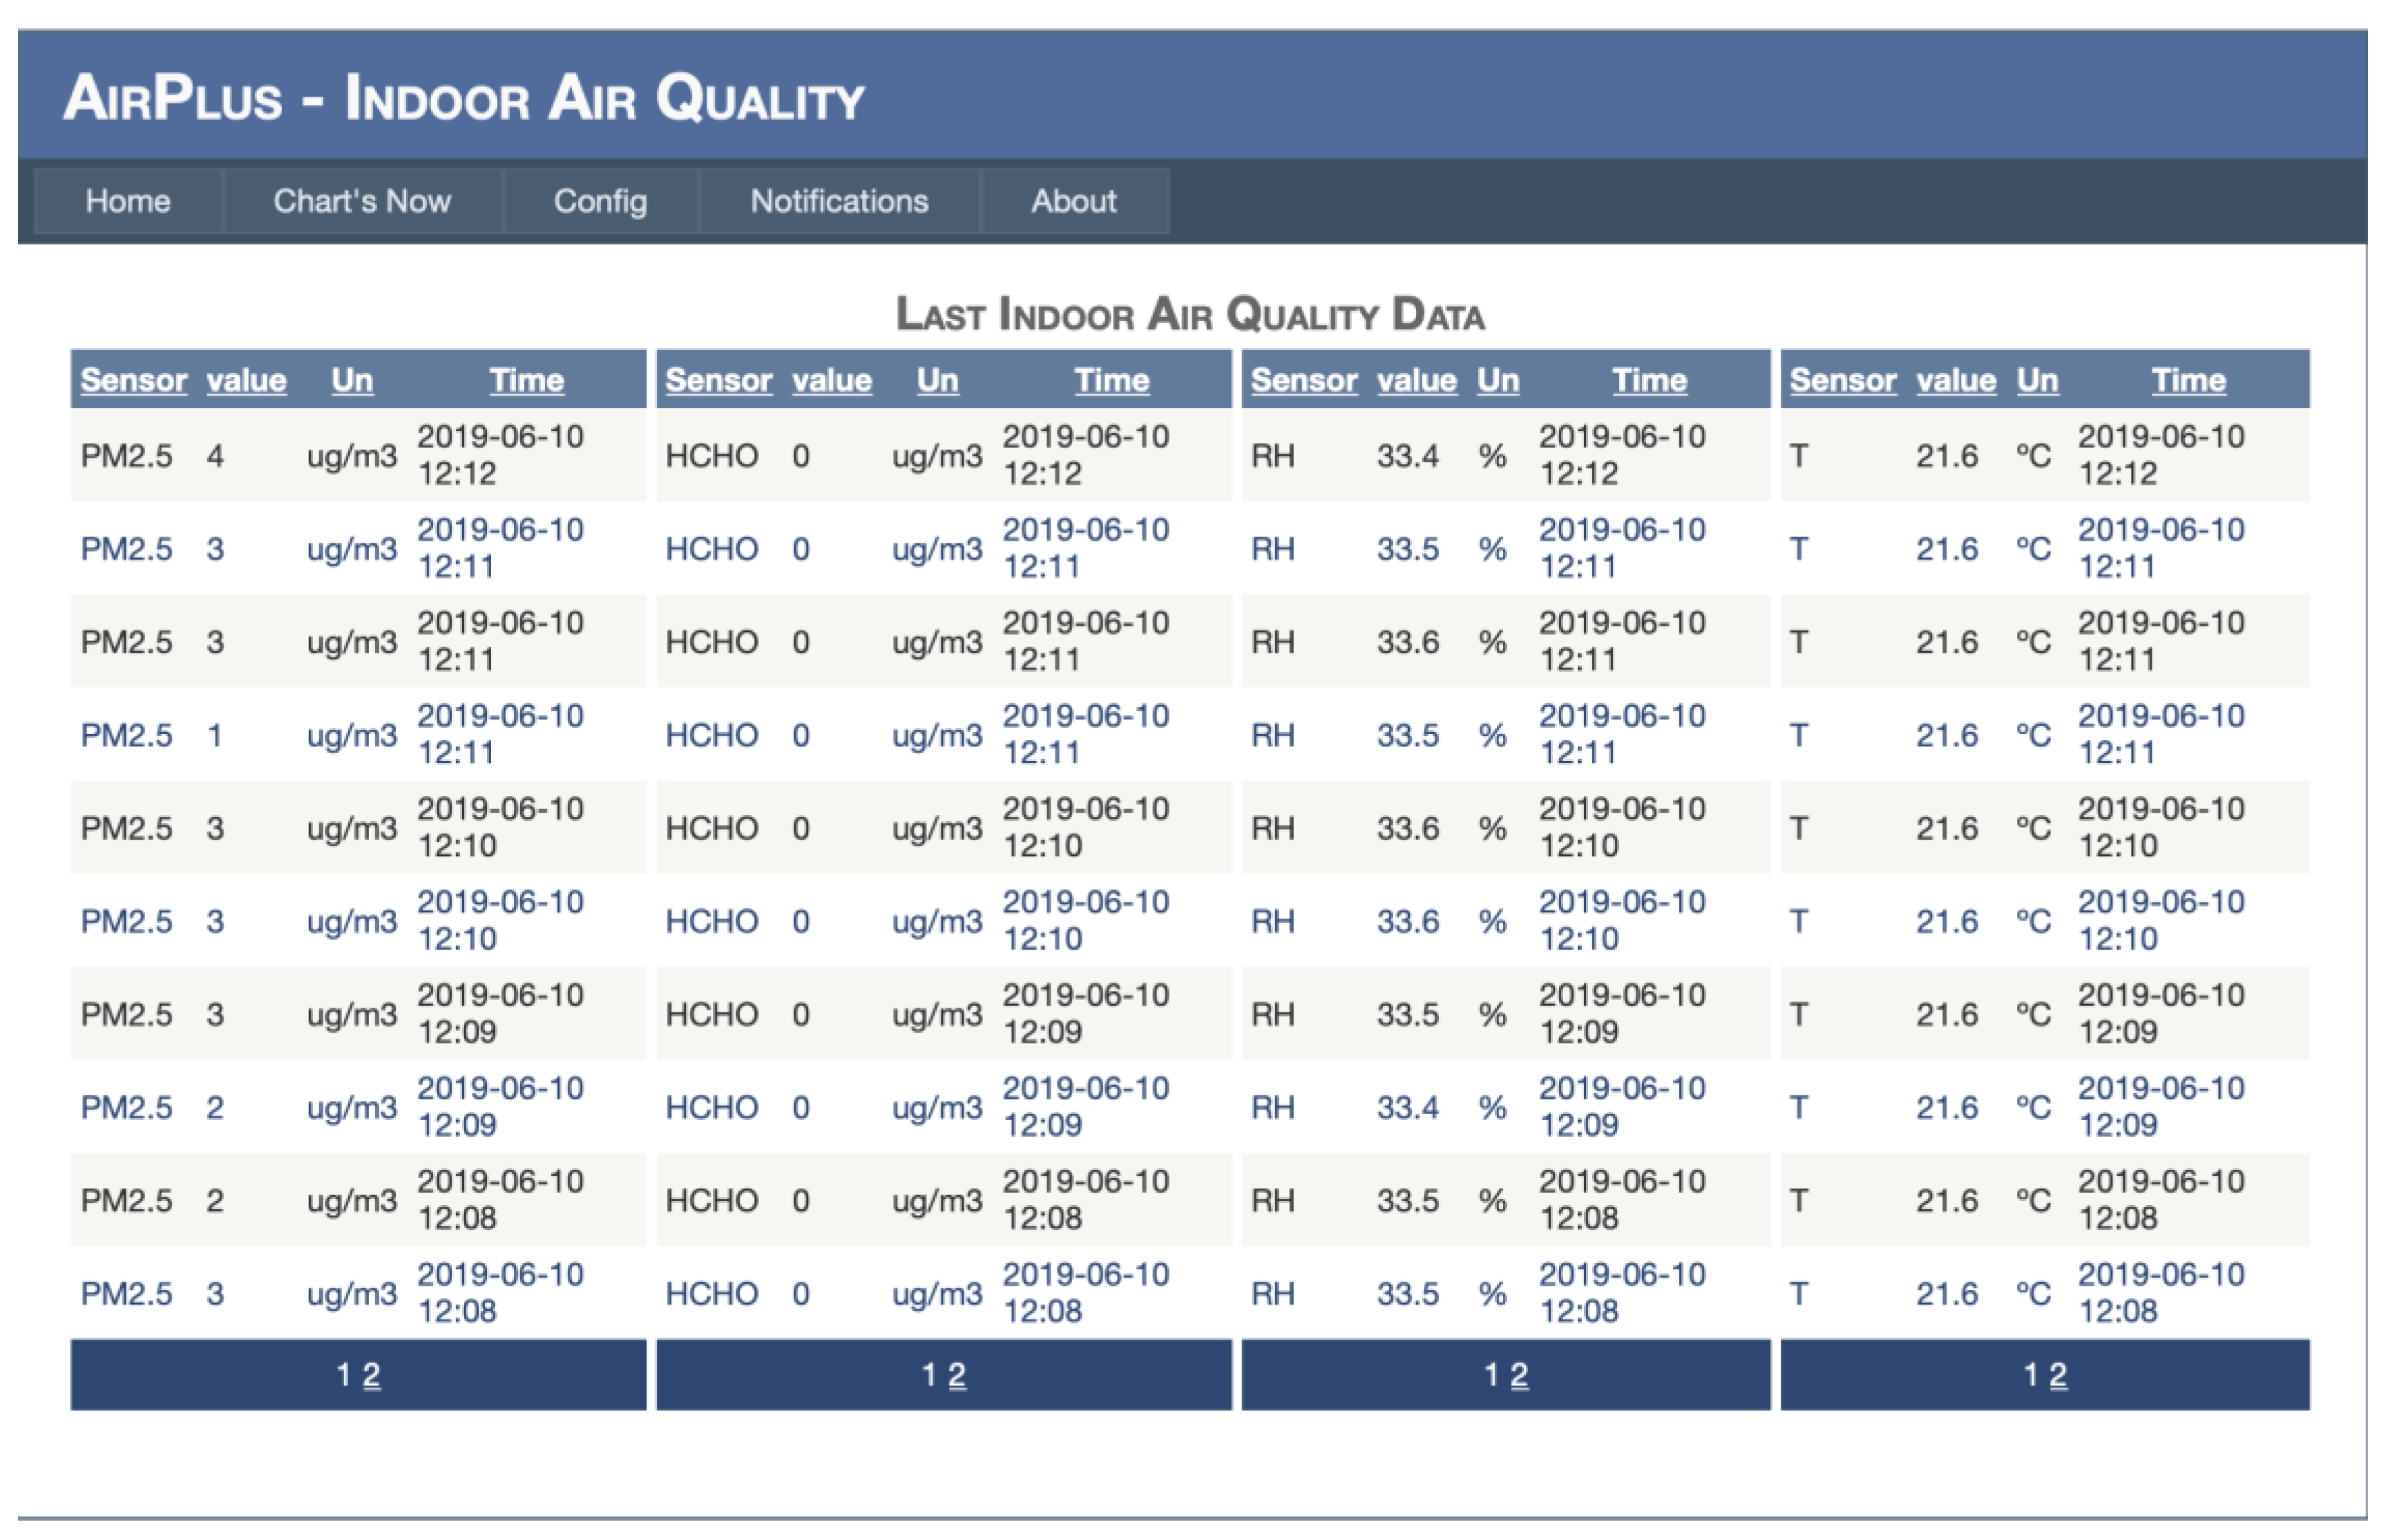
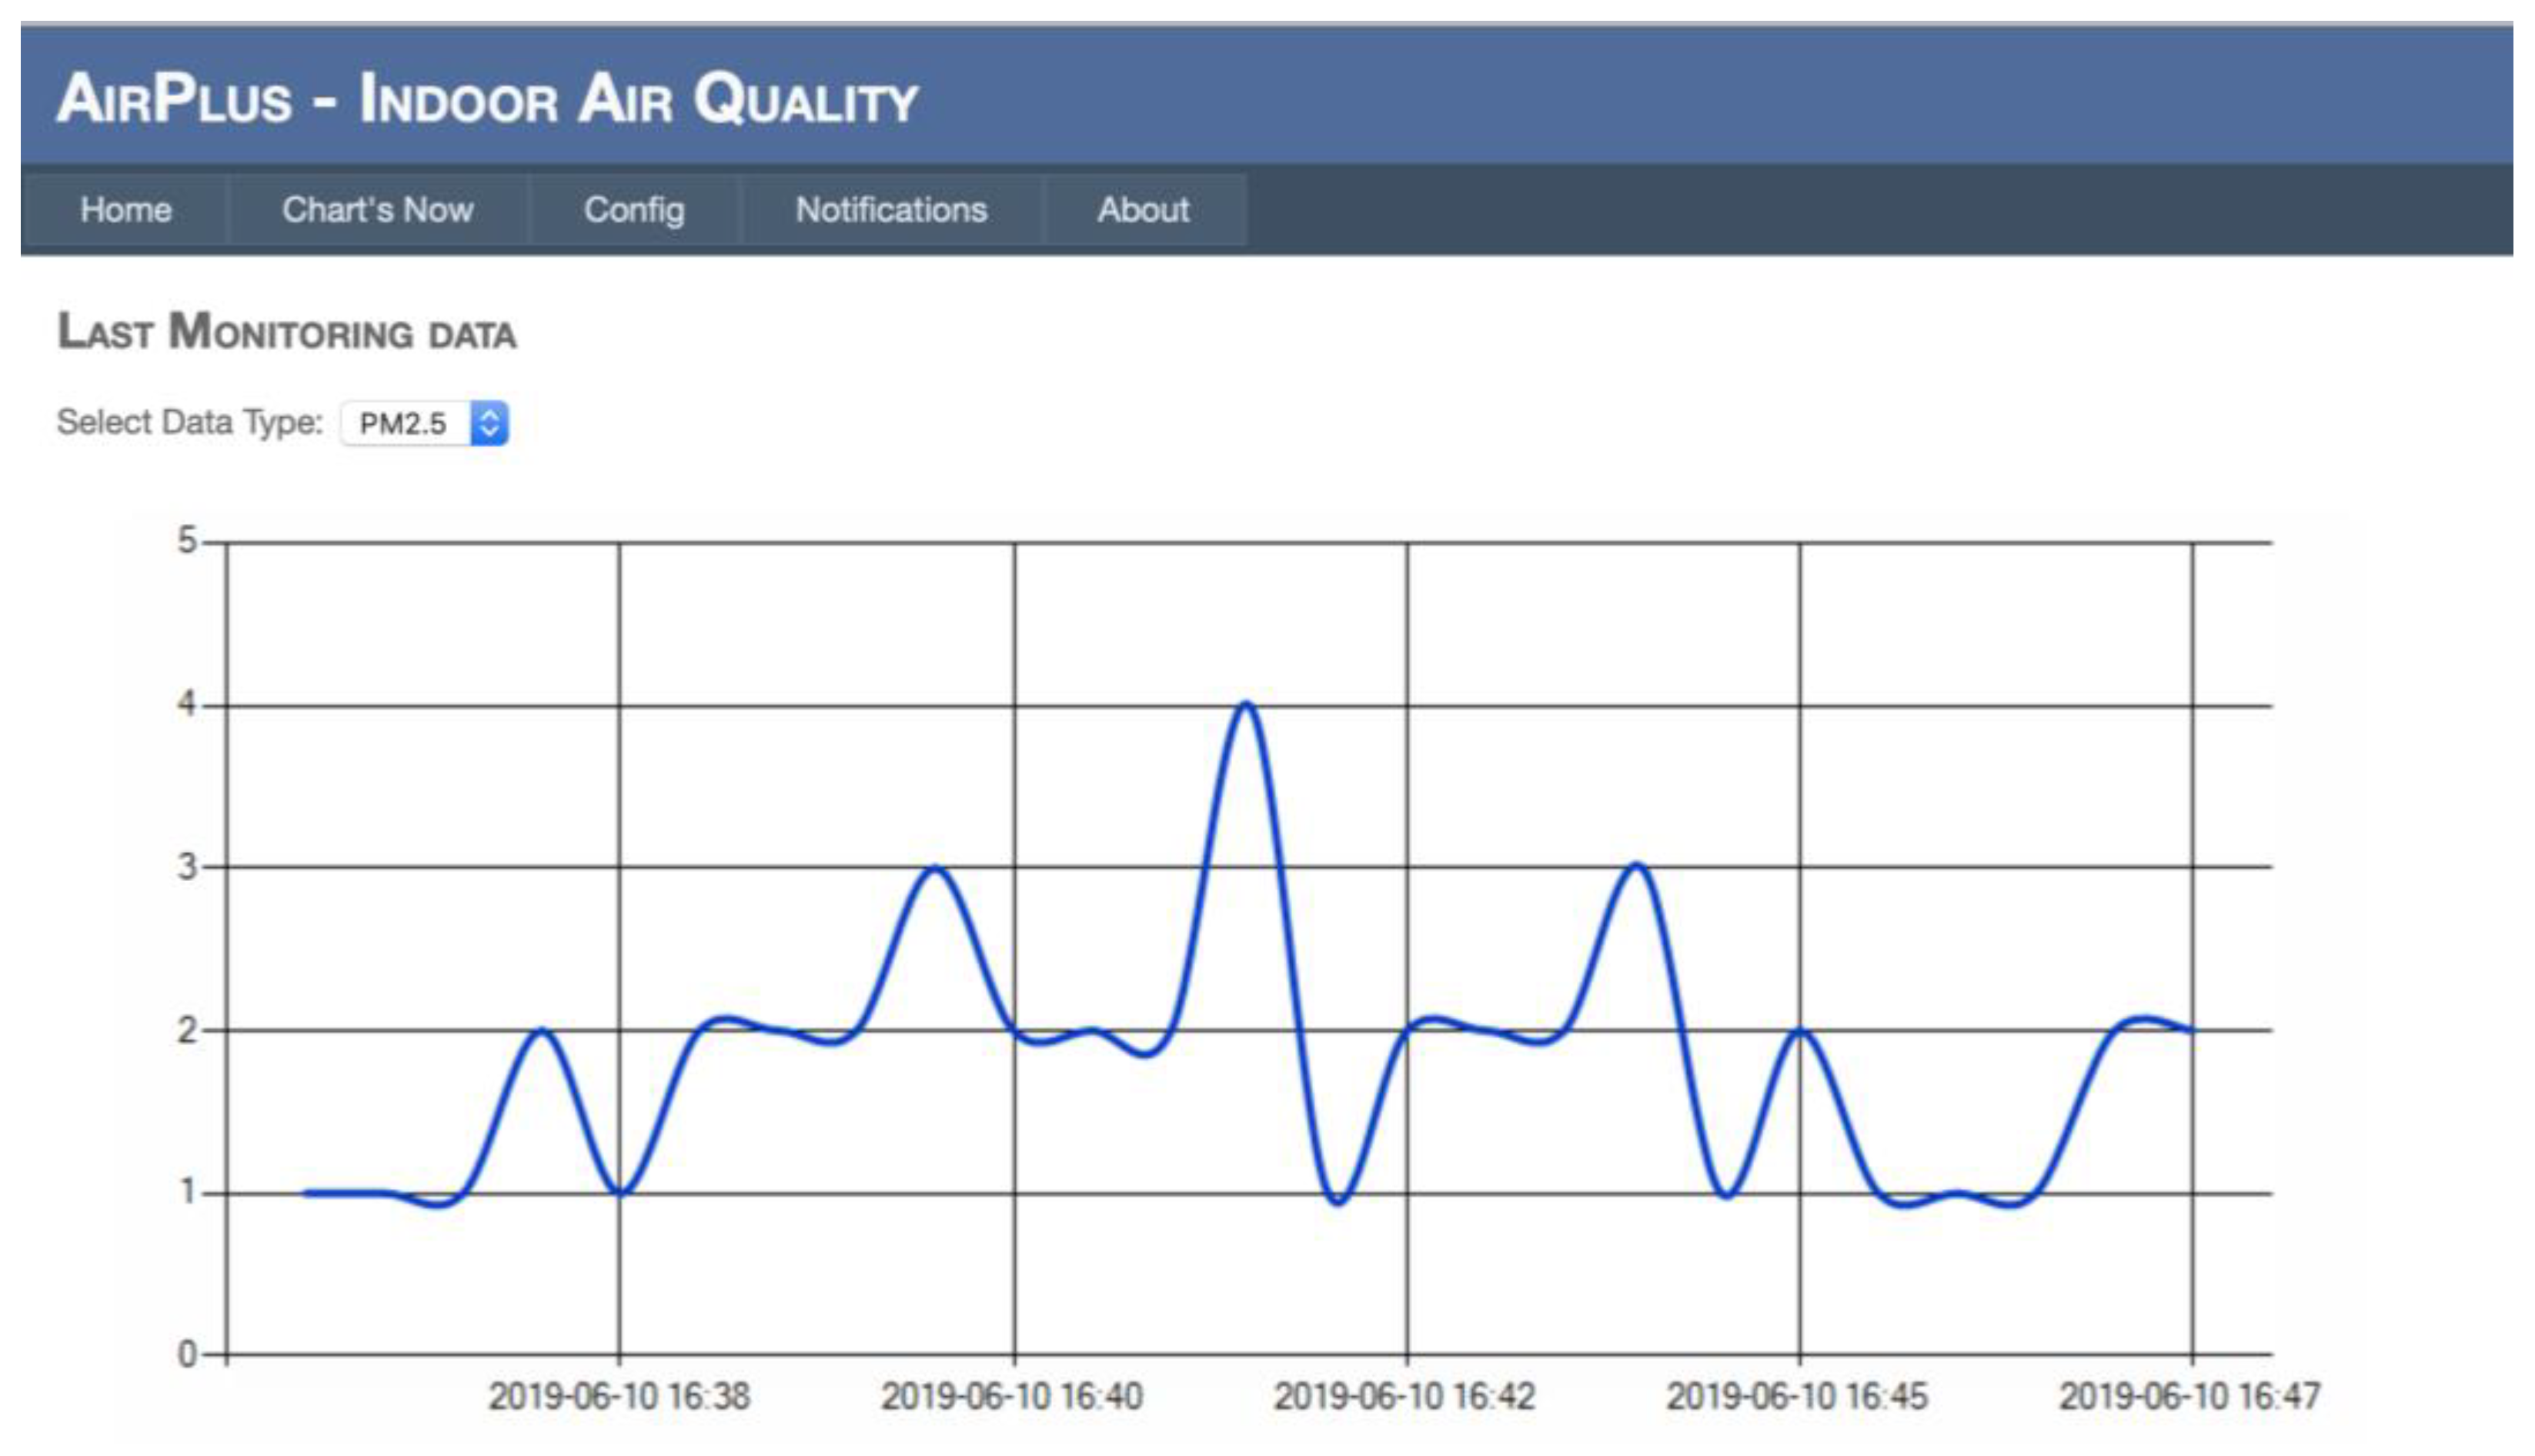
The AirPlusWeb has been developed to be an indoor quality integrated management system. This web solution incorporates several features for data analysis and visualization in numerical and chart representation. First, the proposed software allows for the building manager to call the occupants to consult the last collected data in real-time. Second, this web platform provides a chart representation of the data that were collected which can be used to detect IEQ patterns. The AirPlusWeb provides a notification history for data consulting. The chart representation seems to be efficient when compared to the numeric platform, because the end user can detect high IEQ variations and test the effectiveness of the interventions easily.
Figure 8 shows the PM monitored data from the tests. This chart representation allows for quick access and assessment of the IEQ, as the user can check the data in real-time anywhere, anytime. Furthermore, the end user can easily select the specific parameter wanted and analyse it by using a dropdown list menu.
In sum, the web platform is a decision-making tool to plan interventions on the indoor environment to increase IEQ as well as to ensure the effectiveness of the interventions provided.
Smartphone usage in the western world has significantly increased. At present, smartphones incorporate a tool kit of features regarding not only the connectivity technologies available, but also relevant processing power and data visualization capabilities. Smartphones incorporate indispensable daily routine functionalities and provide a significant variety of applications, such as data consulting, communication, education, scheduling, and entertainment applications. Furthermore, most smartphones use touch screens. They provide Internet access throughout several communications technologies, such as Wi-Fi and cellular networks. They enable other features, such as GPS navigation and media players; they incorporate powerful cameras [
69]. The communications regulator Ofcom states that 93% of United Kingdom population use smartphones and the users typically spend more time while using the smartphone with Internet when compared with other gadgets, such as personal computers. This indicates that people are closely intertwined to smartphones that enable Internet access anytime, anywhere, and for several proposes [
70]. Mobile computing enables the pervasive connectivity of the Internet through smartphones. It stimulates considerable changes in a daily routine, because people have developed skills and behaviours, such as social networks and home remote control [
71]. Taking into account all of the reasons described above, a smartphone application has been proposed to enable the user to carry their IEQ data in his pocket for every moment use. This mobile computing software provides several features for data consulting and analytics, but also for configuration. The user can access the mobile application, in order to: check the last collected data, check the history of the indoor parameters, and configure the setpoints for notifications.
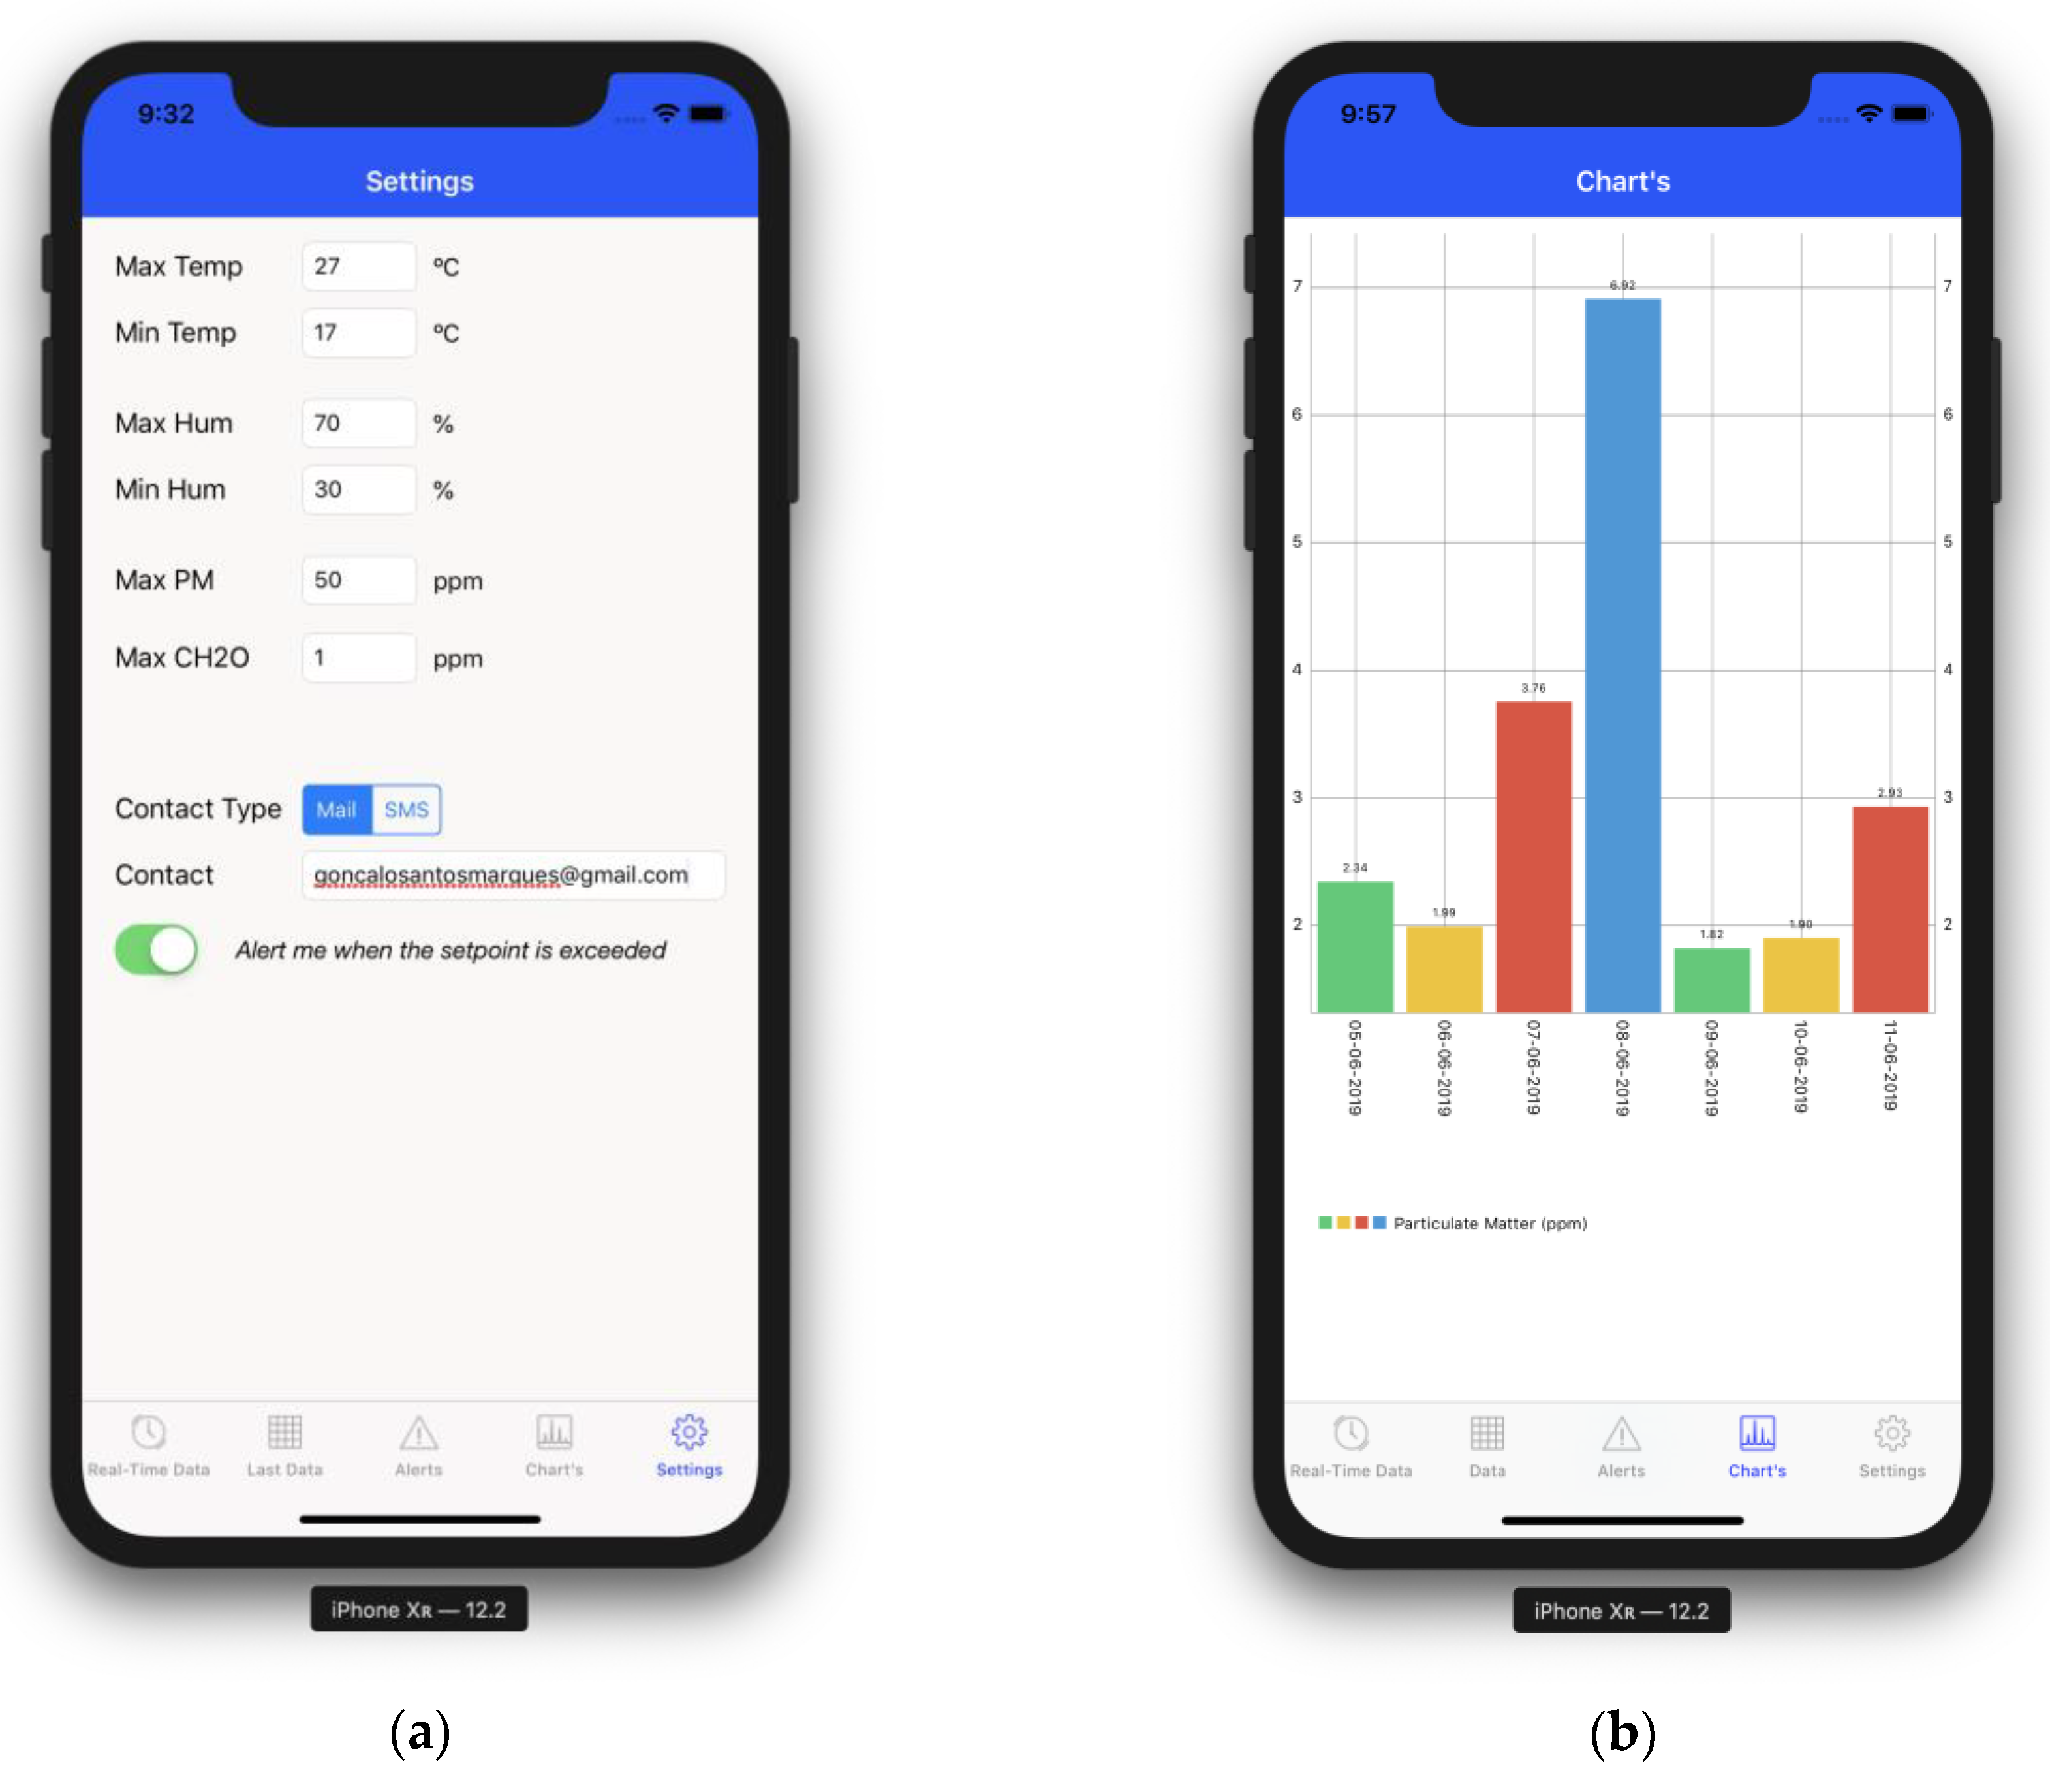
Figure 9a presents the settings feature of the mobile application. This feature provides a useful and easy notification setpoint configuration to receive alerts in real-time to enable quick interventions for enhanced living environments. This functionality provides a personal configuration of the IEQ according to the user needs and space requirements.
Figure 9b shows the chart view functionality that was incorporated in the mobile app. This functionality provides enhanced visualization feature to provide a quick analysis of the IEQ. Furthermore,
Figure 9b shows the average PM levels by day. The user can analyse the variation of PM levels throughout the week.
Figure 9b shows that there is a day in which the PM levels are much more deficient than the others. Then the building manager can assess the activities that led to this poor air quality result to plan interventions to improve indoor conditions.
Moreover, the system has a significant feature regarding the notification architecture. The data collection uses an acquisition module; the data is sent to a remote database for data storage while using web services. In the middleware, the system incorporates data processing features for notifications. The collected data are validated and analysed before being inserted into the database; it takes into account the defined setpoints. These setpoints are predefined while using well-studied health values that were collected from the literature, but they can be updated while using the web platform or the mobile application. If the collected data exceeds the defined thresholds, the user receives a notification in real-time.
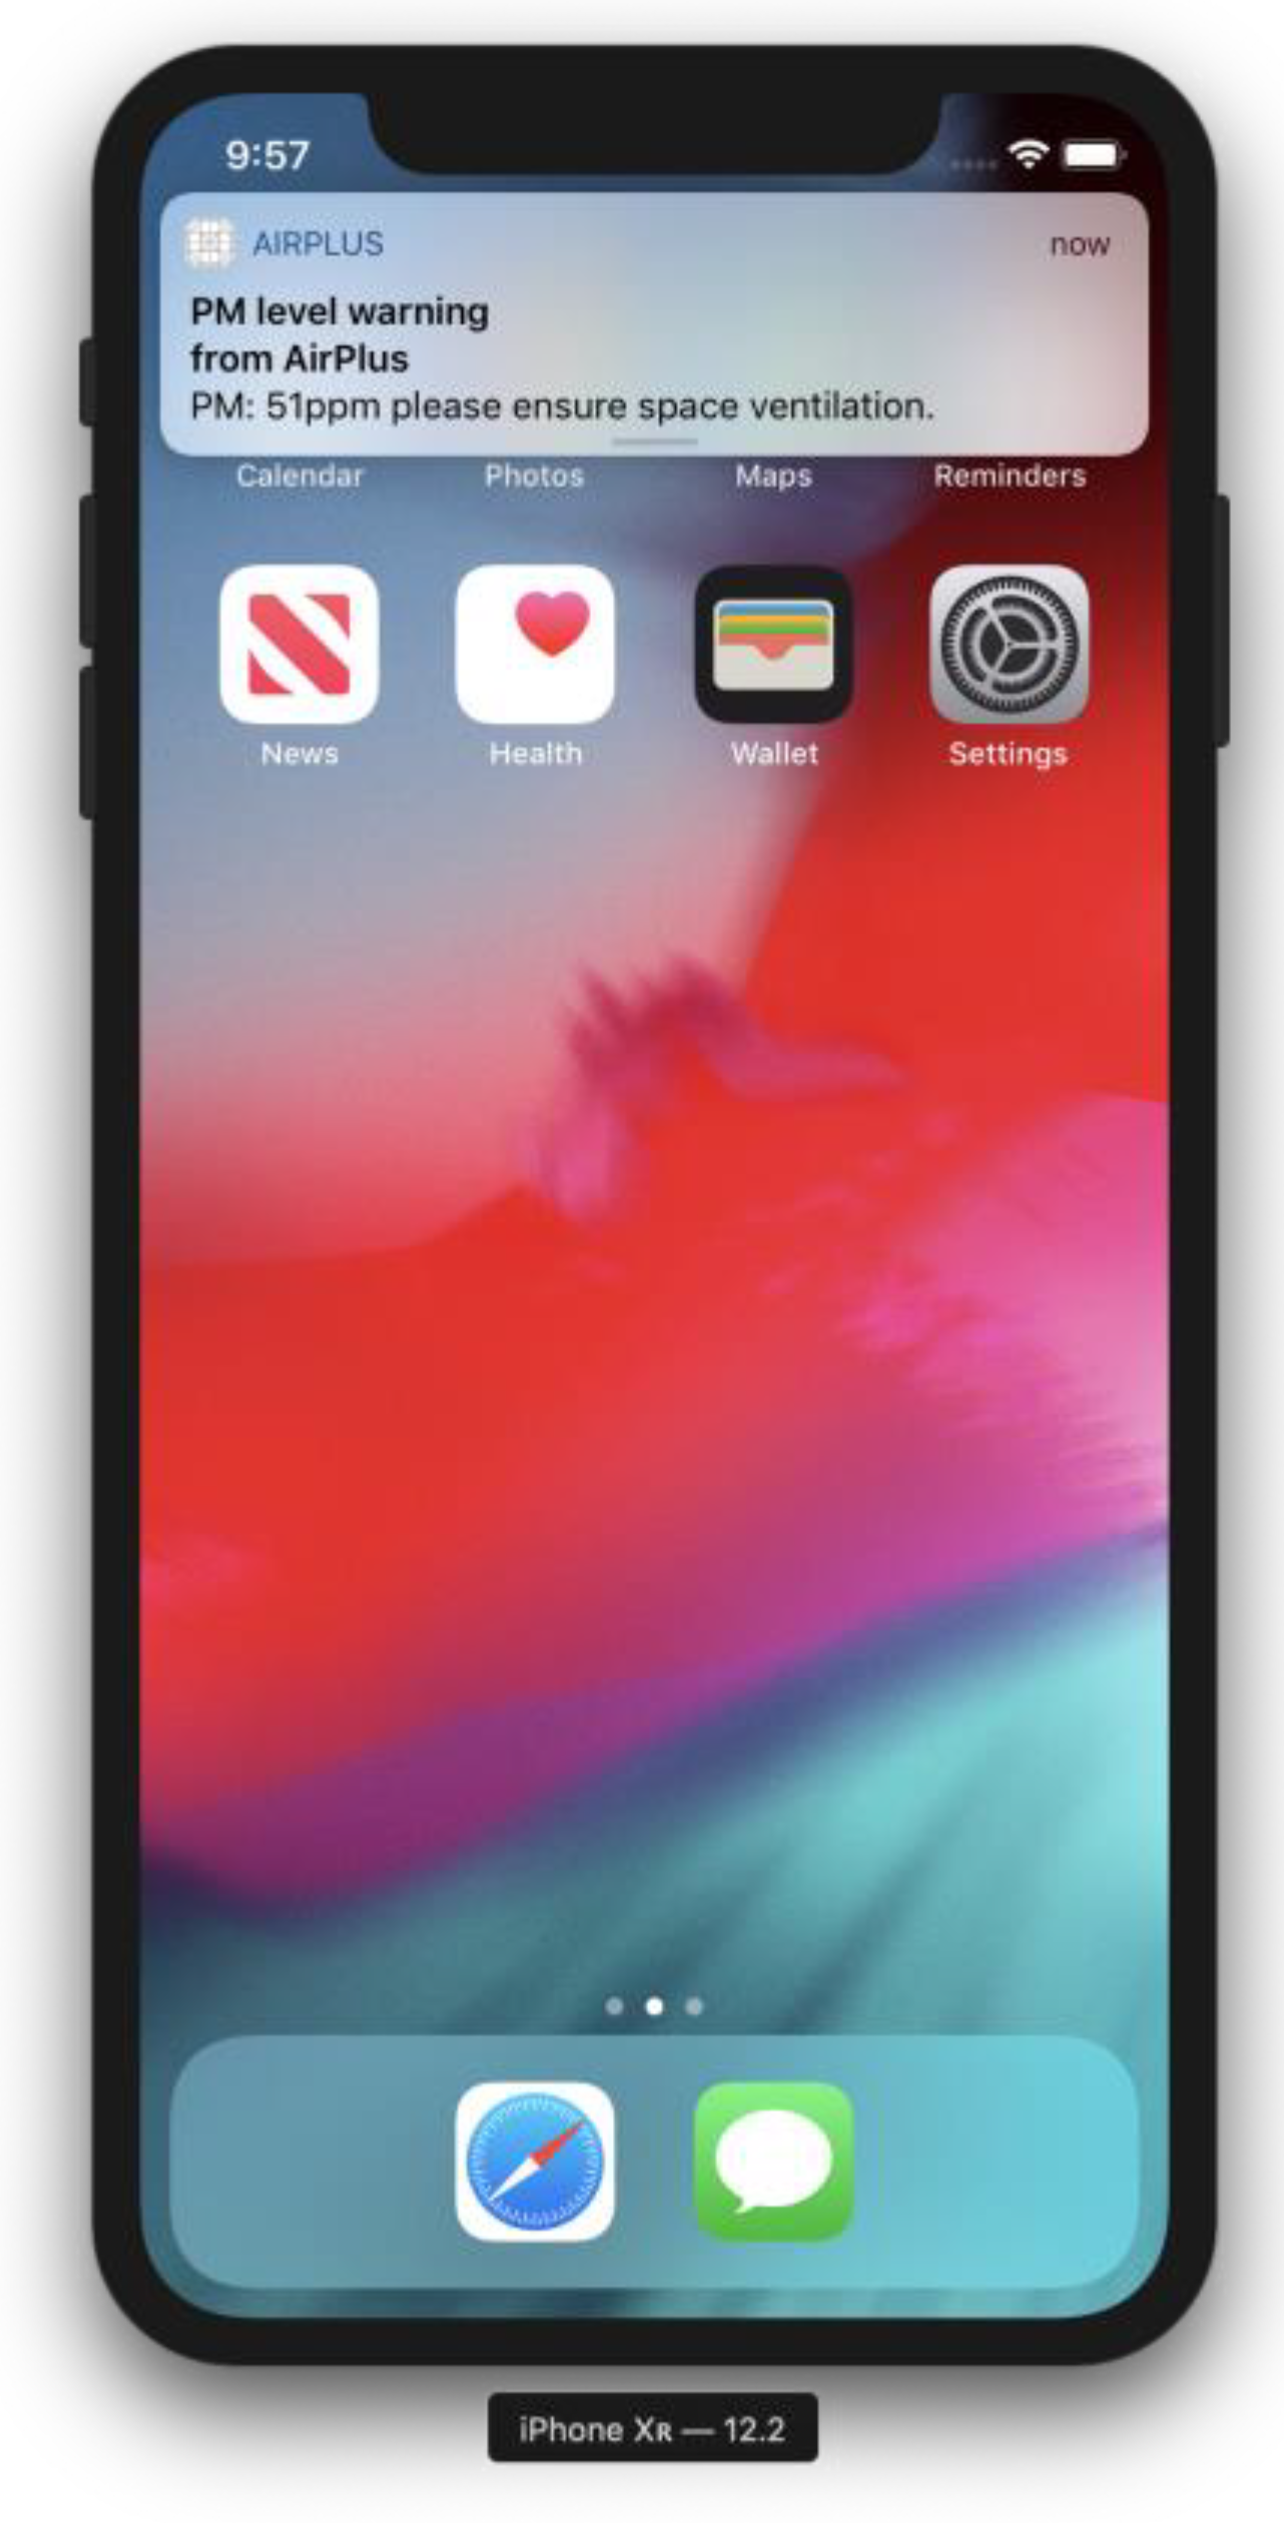
Figure 10 shows the notification alert output on the smartphone display. It is a PM notification of 51 ppm. This notification displays the parameter that triggers the alert and a message to advise the user to take action in useful time to improve IEQ while using space ventilation. These alerts are sent in real-time. They are trustful, efficient, and effective in ensuring good IEQ levels for enhanced living environments.
The results show that these notifications enable the user to act in real-time in order to improve the IEQ in useful time.
Figure 11 shows the notification system architecture. The real-time alerts functionality has numerous benefits when the purpose is reaching successful modifications in the living environment. First, the alert messages encourage behavioural transformations, as the user can be notified in real-time and pay attention to their environment. This attitude would be impossible without the system. Second, the occupants can identify in real-time defective IEQ patterns, when recurrent unhealthy events are reported for interventions planning to prevent them to occur.
The proposed IoT architecture provides a tool kit to ensure and increase IEQ at low-cost. It provides key data for supporting interventions into the monitored space, but also to support medical diagnostics. The patient’s living environment data supports medical reports by correlating health complications with conditions of the space where the patient lives.
Usually, IEQ monitoring conducted in buildings are based on random sampling while using industry equipment. However, these methods are limited by only providing information related to a specific sampling and being devoid of spatiotemporal behaviour.
Most of today’s indoor quality monitoring equipment is portable and incorporate data logging on the equipment itself. However, these devices do not provide real-time data availability and storage for effective IEQ assessment for enhanced living environments. They are expensive and do not incorporate notification features. The historic data stored of these solutions are limited to the device memory and require specific software for data downloading and manipulation. Consequently, there is a need to provide new architectures and methods for real-time IEQ monitoring at low-cost to create and store a rich dataset of occupants’ living environment. Therefore, the AirPlus is proposed as a flexible, reliable, and accurate system for real-time IEQ supervision that introduces significant evolution when compared to current systems.
The proposed IoT architecture provides a low-cost and easy to install acquisition module as well as a mobile computing technology for data analytics, visualization, and notifications when compared with other systems available in the literature. The proposed system can be installed while using only one acquisition station and the user can add more stations according to the requirements of the monitored space. It supports scalability and modularity advantages. Moreover, the AirPlus supports an easy installation process that can be done by the end user. First, this avoids the installation costs’ regarding the installation, which usually requires qualified hand labour. Second, it avoids the need to receive unknown people at home for the installation. The modularity of the system, as well as the ease of installation and configuration of the system leads to a scalable solution. Each module is automatically configured in the backend application transparently to the user when the system is first connected to the Internet network. Each module is treated in the database as an isolated system, and is then aggregated to the end-user in the backend application. In this way, it is possible to take advantage of the IoT architecture and provide a scalable solution. Subsequently, there is no need to perform advanced configurations by the user. This process is carried out automatically.
The proposed methods by authors of [
62,
65,
66,
67] do not incorporate applications for data consulting. When compared to them, AirPlus provides enhanced visualization and assessment tools for numerical and graphical representation. Moreover, when compared to [
61,
62,
64,
65,
67], which are based on WSN architecture, the proposed system provides an important advantage according to scalability and configuration. The AirPlus is based on IoT architecture, which eliminates the requirement of sensor nodes and coordinators configuration. Furthermore, none of the methods that are listed in
Table 1 incorporate easy installation, configuration, and notification features. This solution is based on the ESP8266 module, which is a cost-effective microcontroller. It can be used for processing and communication. It can be configured to reach 160 MHz of CPU clock speed, contrasting with the 16 MHz of the Arduino CPU clock speed. Moreover, the AirPlus provides formaldehyde monitoring, which is not implemented in any of the methods that are described in
Table 1. Formaldehyde is a high-volume chemical, which is used for disinfection purposes and as a preservative. Formaldehyde is genotoxic, causing DNA adduct formation, and it has a clastogenic effect exposure relationship [
48]. Therefore, it is extremely important to provide real-time formaldehyde supervision to prevent people exposure. The selection of the PMS5003ST sensor module takes into account the cost of the system, but also the accuracy of the monitored data. Furthermore, it is important to mention that the main objective of the research was to test the IoT architecture of the proposed system.
The AirPlus was designed to be used indoors with electricity source, therefore the authors do not spend efforts concerning the energy consumption and the incorporation of ultra-low-power sensors modules. The research was focused on real-time data collection, processing, visualization, analytics, and notifications.
In the future, the main objective will be to improve the system by adding a context-awareness approach to automate the HVAC (heating, ventilation, and air conditioning) equipment [
72,
73,
74,
75]. Improvements to the system hardware and software are planned to make it much more appropriate for specific purposes, such as hospitals, schools, and offices. Moreover, it is planned to update the mobile software for medical use, as the monitored data can be used to support medical diagnostics.
6. Conclusions
In this paper, an IoT architecture for IEQ real-time monitored composed of hardware acquisition module for data collection and a mobile computing software for data consulting, processing, and notifications is presented.
The proposed solution connects several technological fields and knowledge areas, such as IoT, mHealth, and AAL. AirPlus gives the opportunity to address numerous open issues in today’s societies regarding emergencies, disabilities, diseases, and remote monitoring. This system ensures cost-effective and efficient space monitoring and it provides enhanced data consulting methods by supporting mobile and web software for data analytics. The data that were collected could be accessed in real-time to ensure high-quality IEQ levels for enhanced occupational health. Furthermore, the AirPlus incorporates notification methods to alert the user in poor air quality scenarios to plan interventions in useful time to improve IEQ.
The AirPlus provides several advantages when compared to other systems, such as scalability, flexibility, modularity, easy installation, and configuration, as well as mobile computing software for data consulting and notifications. This system offers a stream of data that can be used by the occupants and the building manager to provide interventions in useful time to increase the IEQ for enhanced living environments. Moreover, the proposed system provides real-time formaldehyde supervision to prevent people exposure. Formaldehyde is a carcinogenic substance and the exposure to this pollutant is associated with asthma, lymphohematopoietic malignancies, and cancer. The results that were obtained in the tests present a significant contribution to the monitoring solutions available in the literature. Nevertheless, the system has some limitations as further experimental validation is required to improve the system calibration and accuracy.
In the future, the authors plan several hardware and software enhancements in order to adapt the system to specific fields, such as schoolrooms, residential homes for old people, and hospitals. Furthermore, the authors plan the development of a dedicated web platform for an information-sharing solution among health professionals to support the diagnosis of health problems. The authors believe that, in the near future, there will be legislation to enforce real-time monitoring of buildings for enhanced living environments, and consequently to decrease the healthcare costs with treatments that can be avoided by living under high IEQ levels.


