1. Introduction
A wireless Underground Sensor Network (WUSN) consists of groups of nodes which are responsible for data collection, transmission and reception in an underground environment [
1,
2,
3,
4]. Recent developments in electronics and wireless communications have enabled the development of low cost and low power WUSNs [
5,
6]. WUSNs can be used in a variety of applications including precision agriculture, environmental monitoring, pipe monitoring and mine monitoring [
4]. However, WUSNs have two major limitations; namely, Radio Frequency (RF) transmission in soil and lack of access to an energy supply. RF transmission is the most challenging aspect of WUSNs due to the high attenuation of the electromagnetic (EM) signal in soil [
1]. Signals are often required to travel through dense soils with a high density or water content, and generally through a non-isotropic and non-homogenous soil mixture with different boundaries; both of which can attenuate the signal sharply. The variability of these conditions and complexity of the behaviour of signal attenuation with respect to these parameters makes accurate estimation of EM signal attenuation in soil challenging.
The signal attenuation is caused by reflection, refraction, absorption and scattering of the electromagnetic wave, which affects the electromagnetic signal travel through different media [
2]. The complex dielectric permittivity is one of the main parameters of a medium that expresses this interaction with electromagnetic radiation, and for soil it is dependent on the constituent components of the soil including volumetric water content. There are several models which predict dielectric properties of the soil from soil mixtures, all of which aim to estimate the effect of these parameters on signal attenuation [
7,
8]. Hence, estimation of signal attenuation in soil also depends on the estimation of the complex dielectric permittivity; which can also be determined directly from Vector Network Analyser (VNA) measurements [
9,
10] or extracted from Time Domain Reflectometry (TDR) measurements [
11] without the need to know soil composition.
Electromagnetic waves are also attenuated as they travel in free space, this attenuation is usually described as the Free Space Path Loss (
). A model exists which is used for the calculation of the attenuation of the signal between two points (transmitter and receiver of signal) based on a clear line of sight (no obstacles at either of nodes [
12,
13,
14]. The Friis transmission equation for electromagnetic signals in open space is given by Equation (1) [
12,
13,
14]:
where
is the received transmission power as a function of distance,
is the transmission power,
are the transmitter and receiver gain,
d is the distance between transmitter and receiver,
is the wavelength of the signal and
L is a propagation independent system loss factor. This transmitted power relationship can also be represented in logarithmic form using the transmission link budget, which describes the general relation between the transmitted and received power
considering the loss in free space, Equation (2) [
1,
2,
11,
12,
13], where the symbols have the same meaning as in Equation (1) but now
is the path loss in free space:
Considering propagation dependent factors, then from Equation (1), the ratio of the transmitter power and receiver power is given by the ratio of the distance over the signal wavelength and the FSPL (
) can therefore be derived in decibel form as [
5]:
where
is the total free space path loss in dB,
d is the distance in meters, between the sensors, ƒ is frequency in Hz and
c is the speed of light in meters per second. From Equation (3) it is clear that the FSPL depends on the distance between two nodes and the frequency of the signal.
To model the attenuation of the signal in a medium such as soil, the FSPL can be modified to include the attenuation due to the medium (
), such that Equation (2) becomes:
This is referred to as the modified-Friis model. The total path loss (
) of the signal is the summation of the medium path loss and the free space path loss, and has been shown to be given by Equation (5) [
5]:
where
is the signal attenuation coefficient and
is the phase shifting coefficient, and which are given by Equations (6) and (7), respectively;
where
,
is the magnetic permeability of the soil,
is the real part of the complex dielectric permittivity and
is the imaginary part of the dielectric permittivity. As shown in Equations (6) and (7), the values of
and
are directly related to the dielectric properties of the soil. Research published by Akyildiz [
1] used the Peplinski mixing model to calculate the real and imaginary parts of the complex dielectric permittivity of the soil based on the composition and volumetric water content of the soil [
1,
15]. By substituting Equation (5) into Equation (4) [
16], the modified-Friis model for total power received through a medium by the receiver is given by Equation (8):
The CRIM-Fresnel model, initially proposed by Bogena [
17], is another model for estimating the attenuation of a signal in soil and uses complex refractive index. The CRIM-Fresnel model also takes the attenuation of the signal due to reflection into account. The total attenuation of the signal is introduced as the sum of soil attenuation as well as the signal reflection [
17]. The total attenuation of the EM signal (
) based on this model is given by Equation (9) [
2]:
where
is the soil attenuation coefficient and d is the distance,
is the attenuation due to the reflection of the signal. The attenuation coefficient,
, is calculated by Equation (10) and the attenuation due to the reflection,
, is given by Equation (11):
where R is the reflection coefficient and is given by Equation (12) as:
The permittivity of the soil in the CRIM-Fresnel model is calculated based on the Complex Refractive Index Model (CRIM). This model calculates the soil dielectric permittivity by using the permittivity of solid (
), water (
) and air (
) at a certain frequency, based on the fact that the only loss source is water [
17].
The CRIM-Fresnel model is claimed by [
17] to be a better estimation for the signal propagation in soil compared to the modified-Friis model due to the fact that the proposed mixing model to gain soil properties used in the modified-Friis was not developed based on a large data set. However, the CRIM-Fresnel model itself was also not validated by a range of test trials. The modified-Friis model estimates the attenuation of EM signals mainly based on the effect of phase shifting on the signal, while CRIM-Fresnel considers the effect of the material absorption and signal reflection. Estimation of signal attenuation for a soil sample with real and imaginary parts of complex dielectric permittivity of
= 13.25 and
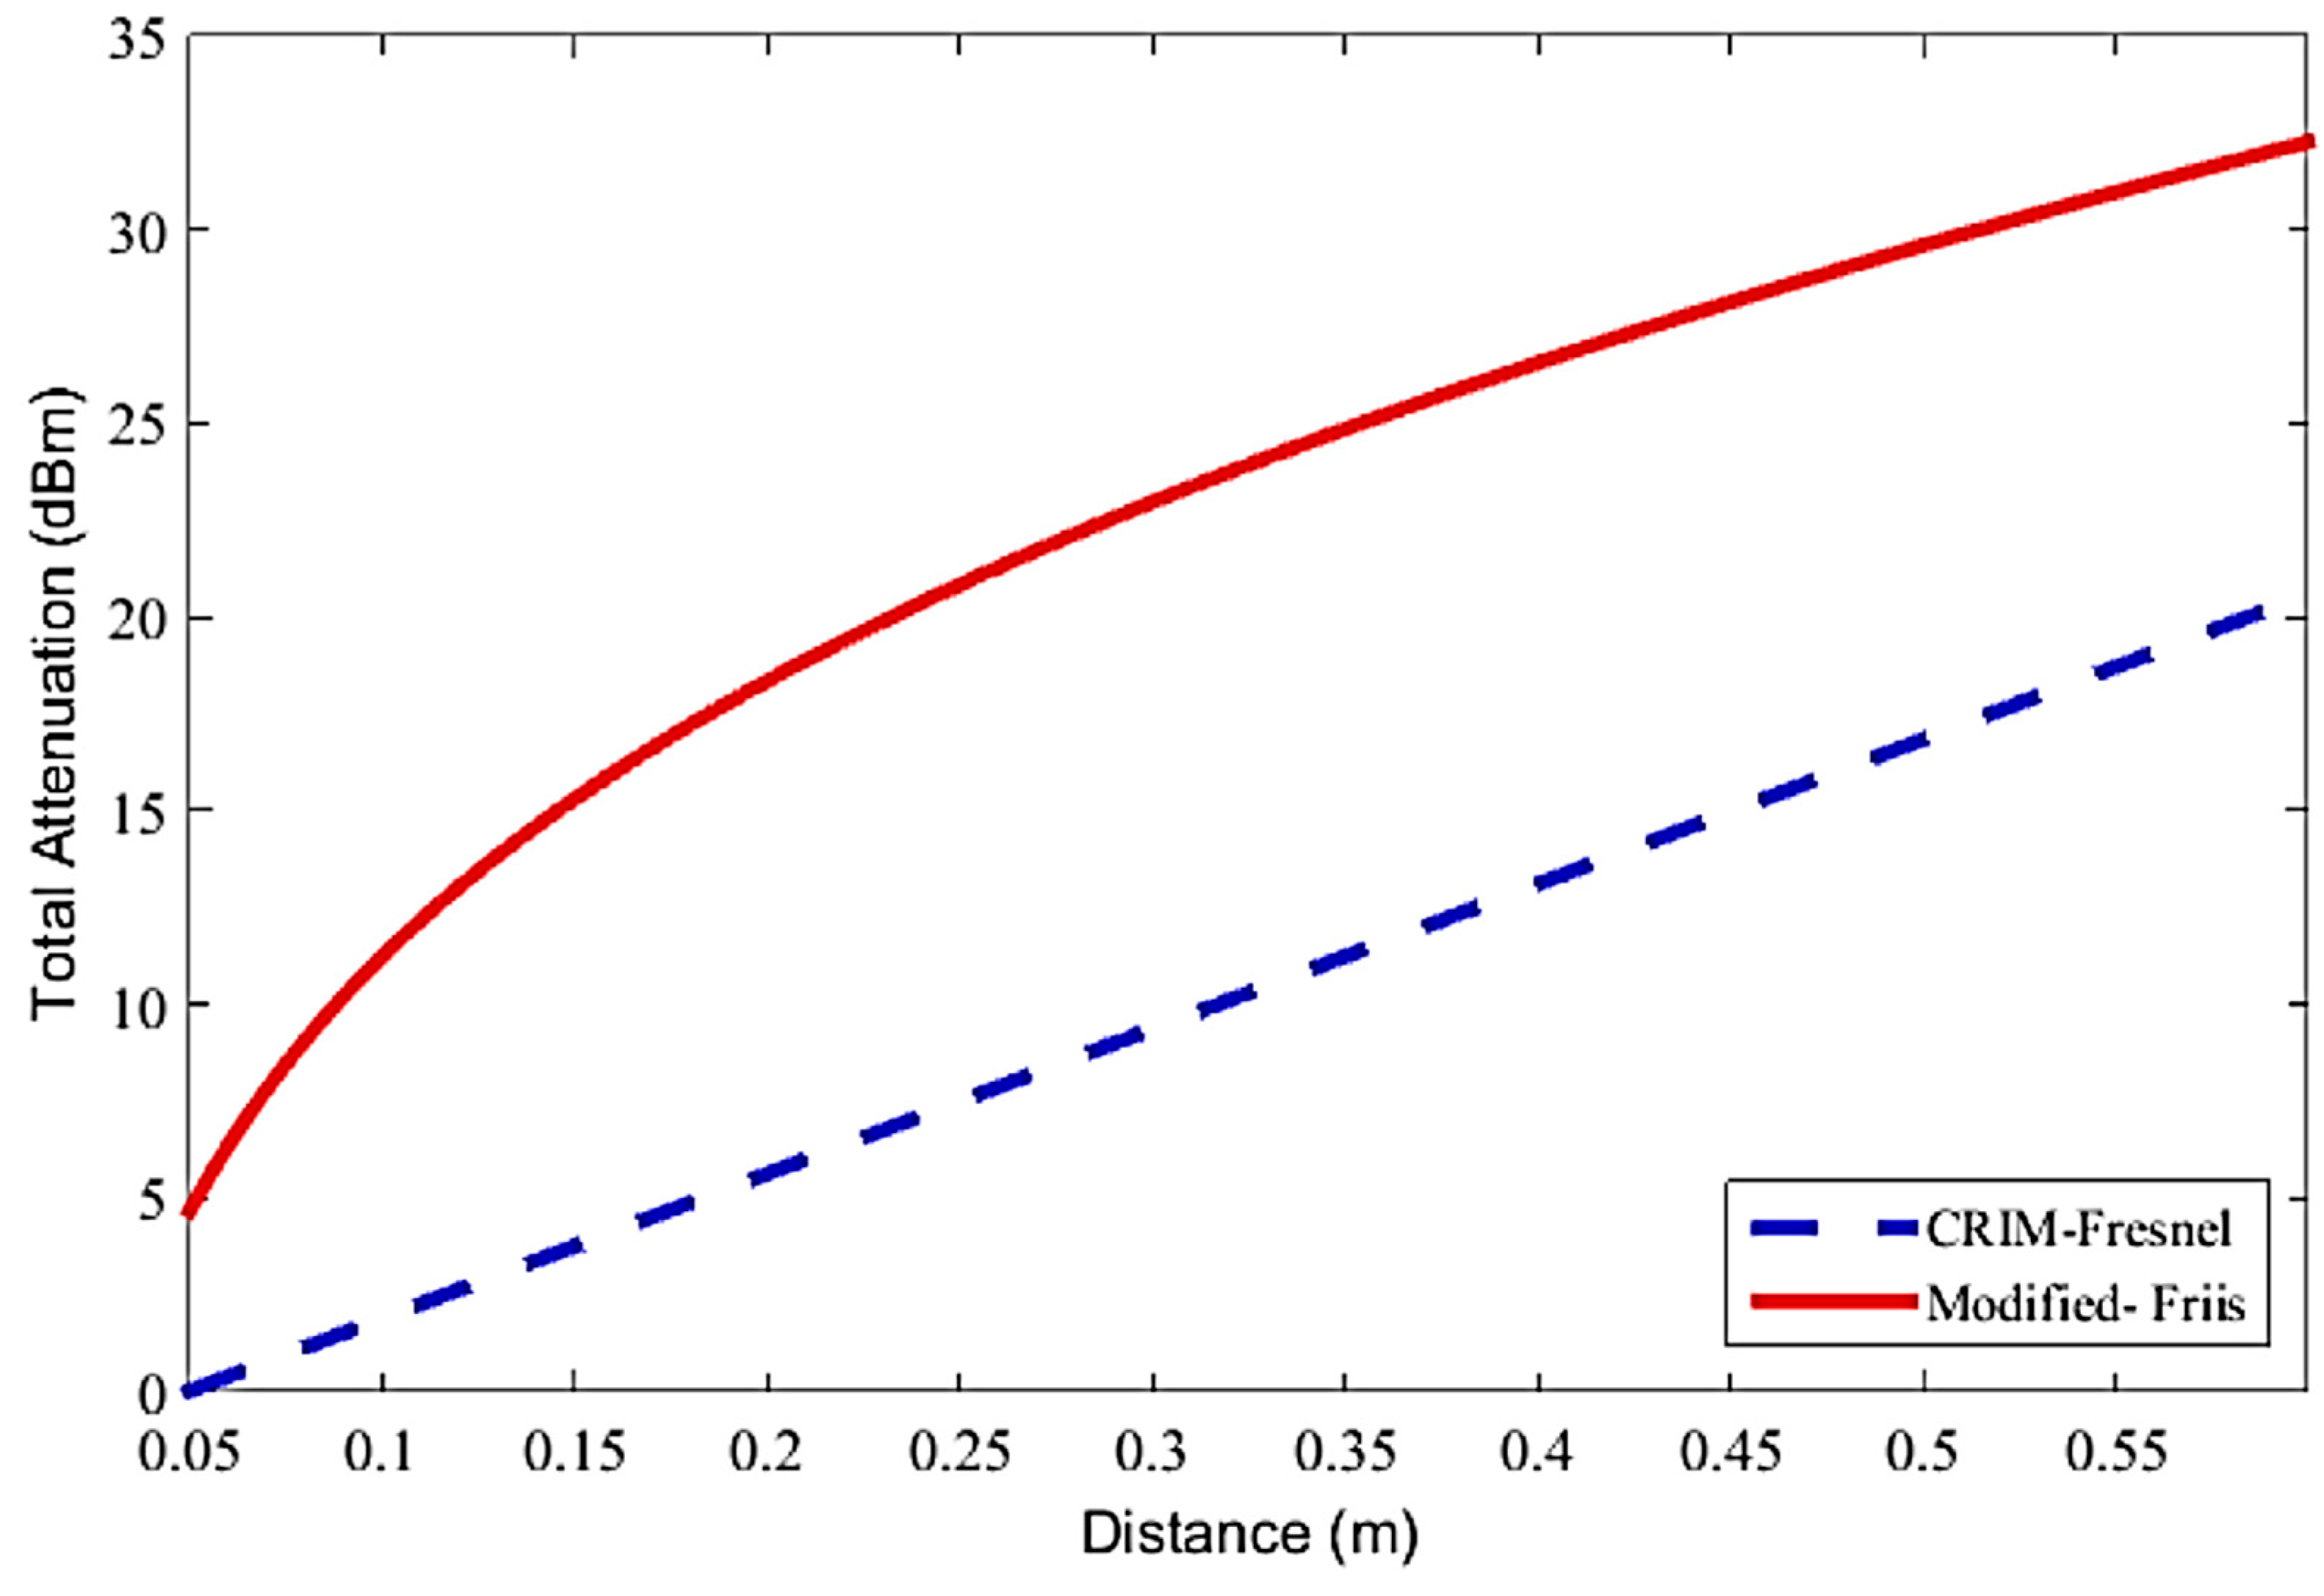
= 2.18 at 434 MHz is shown in
Figure 1 for the two different models. Results below 0.05 m are omitted as near field effects not accounted for in the models are present this close to the transmitter.
The comparison of RF propagation models presented in
Figure 1 shows that the estimated values for the attenuation of the signal by the modified-Friis and the CRIM-Fresnel models are significantly different from each other. As is shown, the modified-Friis estimates the signal attenuation in dB as a non-linear function while in contrast; the CRIM-Fresnel model estimates the attenuation of the EM signals as a linear function in dB. These differences suggest a need for further investigation into the accuracy of these models by comparing the predicted values from the models with measured values from laboratory or field trials. Hence, in this paper, the applicability of these two most commonly used signal attenuation models (modified-Friis and CRIM-Fresnel) are investigated and analysed for a variety of soil types and conditions, with specific EM propagation measurements being undertaken for comparison. The following section describes the methodology for EM attenuation measurement in soil, as well as extraction of soil permittivity parameters. This is followed by presentation and discussion of the comparison of experimental attenuation measurement with the prediction from the two models.
2. Experimental Methodology
As it is difficult to conduct tests for various soil types and conditions in the field, a laboratory test set-up was developed to allow the investigation of the signal attenuation for a range of soil types and water contents. Several aspects need to be considered in the design of the test bed used to measure the signal attenuation in the laboratory to avoid negative/unwanted effects on the tests and ensure reliability of the measurements. The following are the main aspects which were considered for development of the test setup: (1) Pathway of RF signal in soil sample; (2) Soil container shape and geometry; (3) Elimination of the environmental interferences (i.e., reflection of signal); (4) Soil composition and compaction methods; (5) Measurement techniques.
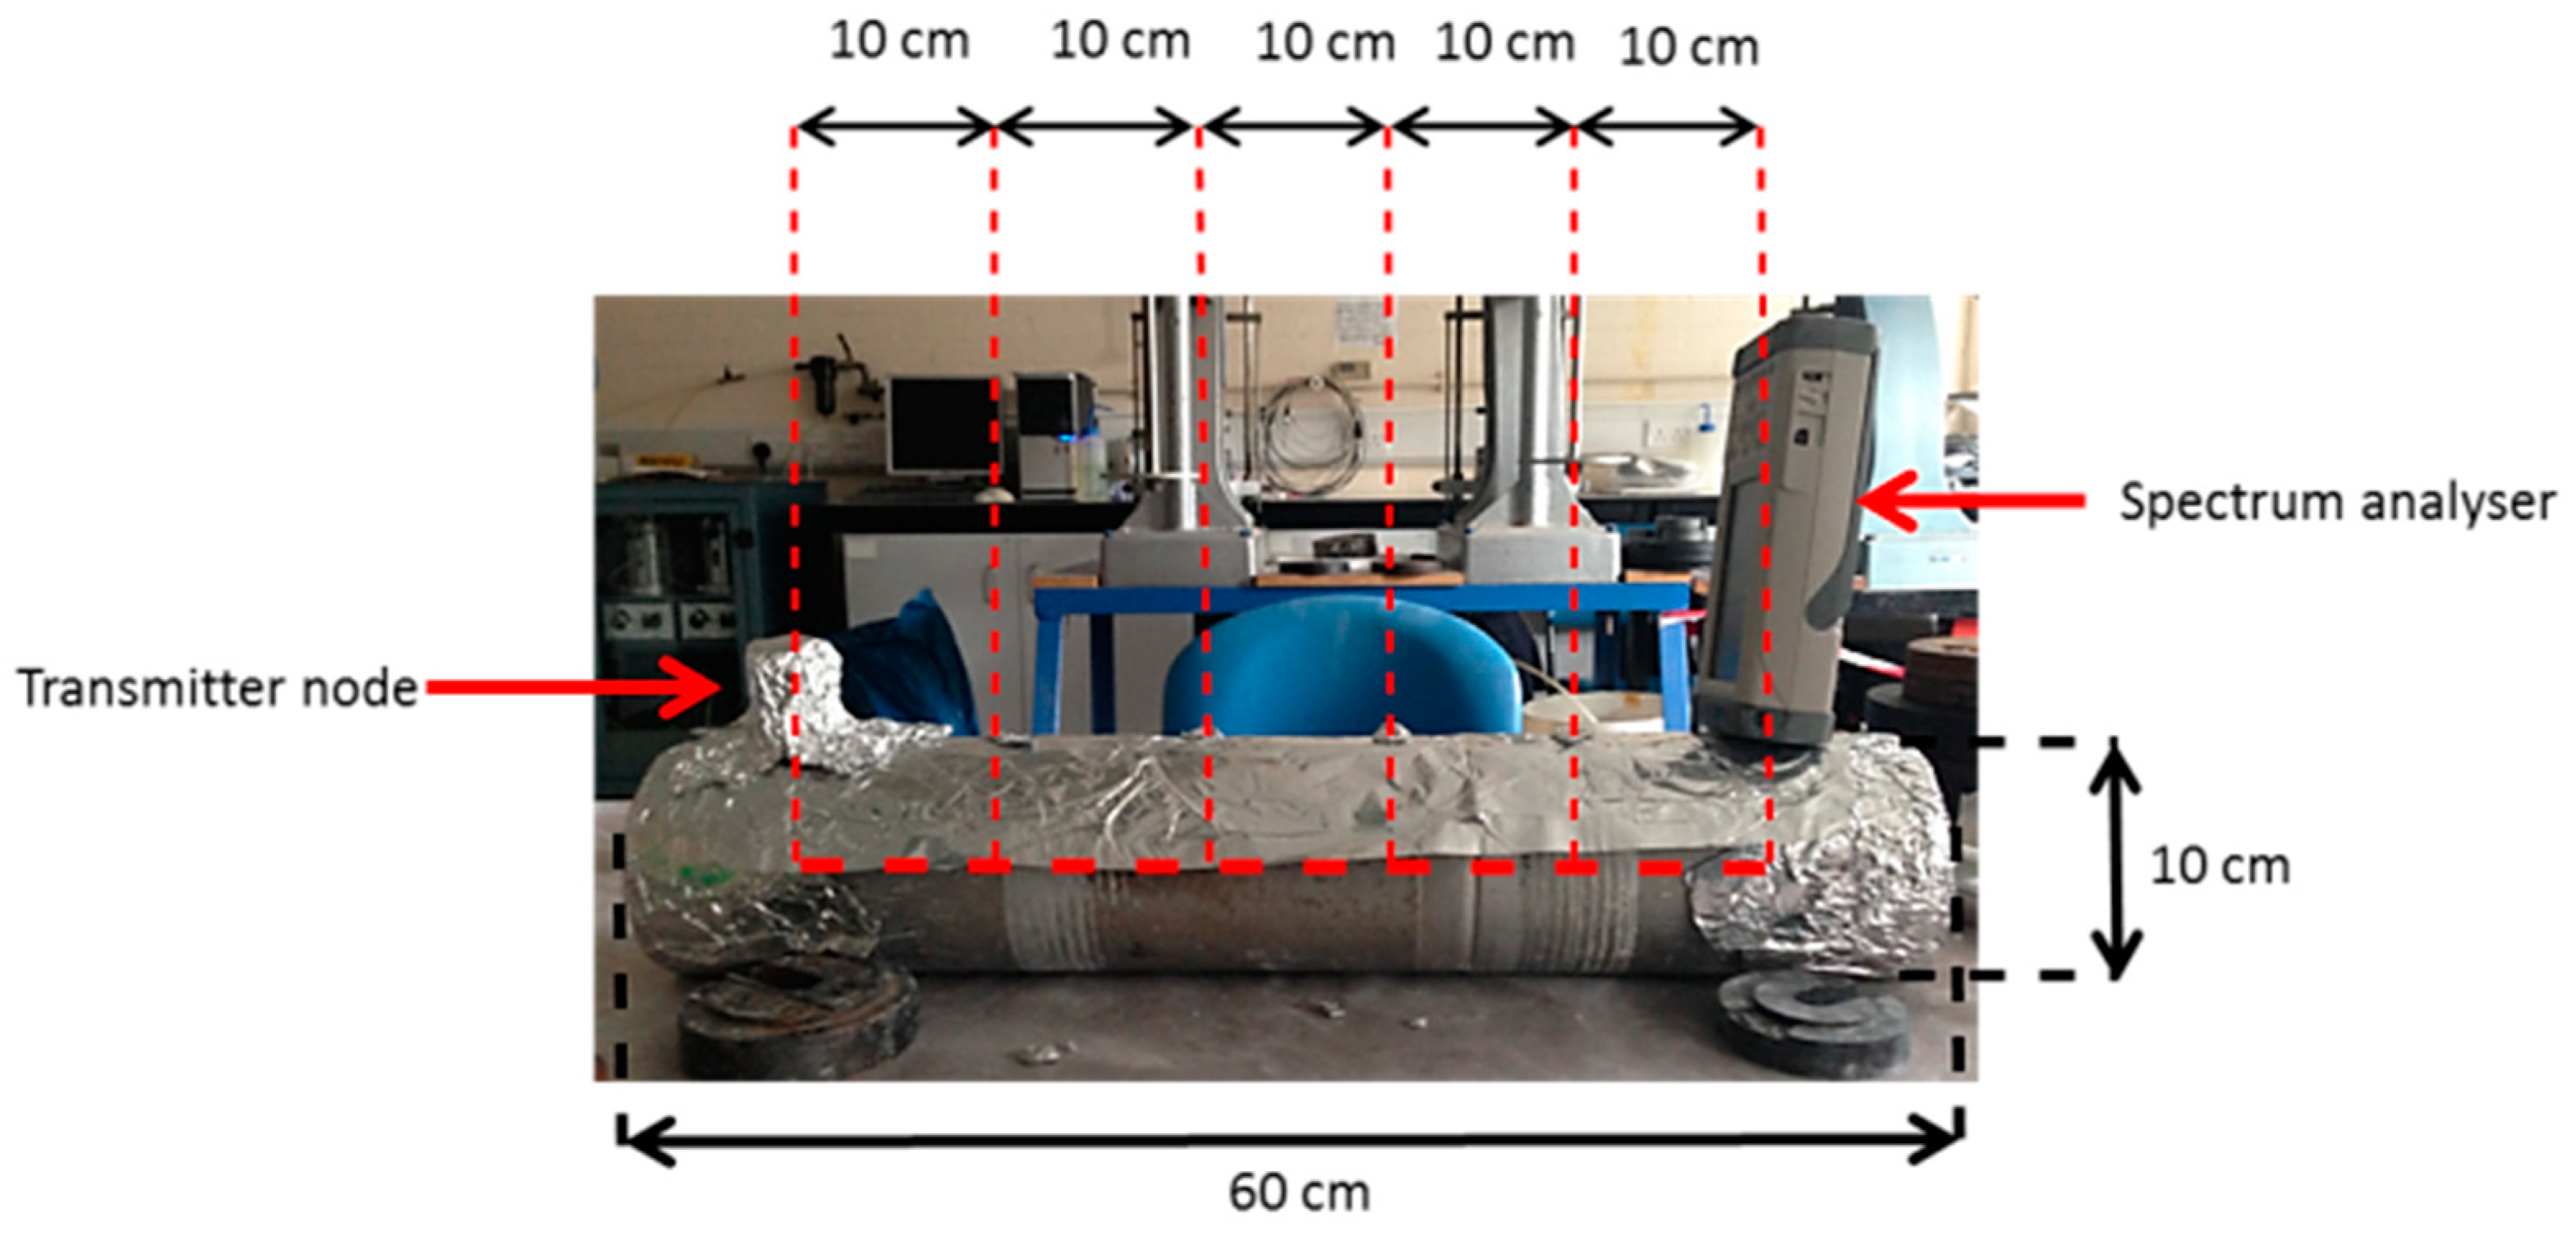
The ideal setup for RF attenuation tests would be to have an infinitely large container to remove any effect from the container on the measurements. However, this is not practical, as preparation of soil samples for a large container would not be feasible. Initially, a plastic container was selected for the purpose of the tests. However, initial tests showed that environmental EMI (Electromagnetic interference) contaminations adversely affected the readings. Therefore, for the purpose of these tests, an aluminium container with dimensions of 60 cm (length) × 10 cm (diameter) was chosen as the sample mould for measuring the EM signal strength along specific distances (
Figure 2). Six holes were placed along the container at 10 cm apart from each other for signal measurement. The container was designed to have five measurement points including the last position at 50 cm. However, after initial testing it was observed that at the data from the 50 cm point was contaminated by the environmental interferences. This was caused by less shielding and soil at the end of the container and therefore, external signals could affect the signals more easily. Due to the inconsistencies in the data, although measurements were taken at this point, they were not included in the paper. A cylindrical shape was used for the container in order to ensure a maximum contact between the compaction rammer (4.5 kg rammer with the diameter of 10 cm) and soil surface at the edges of the container (avoiding sharp corners which the rammer cannot get to). In addition, a diameter of 10 cm was selected for the container based on the size of the rammer used for compaction the soil sample.
The soil used in this experiment was a mixture of Leighton Buzzard Sand and English China Clay with three different gravimetric water contents, 10%, 20% and 30%. The mixing and compaction of the samples as well as gravimetric water content (GWC) determination were carried out based on the British Standard [
18]. The prepared soil sample was placed in the container and the signal strength was measured at certain distances (holes along the container) from the transmitter. For the purpose of these tests three separate soil samples were prepared for each soil condition and the measurements were repeated five times at each location (total of 15 samples for each location and soil condition). The logarithmic averages of these measurements were then calculated and used for the comparison. The soil was changed between each set of measurements (three soil samples for each condition) in addition, the delay between measurements at each location was minimised in order to avoid changes in soil condition and homogeneousness to affect the results. Due to the large attenuation of RF signals in soil higher frequency Industrial, Scientific and Medical (ISM) bands (i.e., 2.4 GHz) are not used in underground Wireless System Networks (WSNs). 434 MHz is one of the most commonly used ISM band for long range WSNs and was selected for the purpose of this research. The transmitter node used in this research was a previously developed 434 MHz node for underground WSN with a bandwidth of 150KHz (Frequency Shift Keying, FSK modulation). The transmitter output power was fixed at 10 dBm for all tests. A signal spectrum analyser (PSA 2702 RF) was used to measure the signal intensity at specific positions. The frequency range of the spectrum analyser was approximately from 1 MHz to 2700 MHz and has a noise floor limitation of −96 dBm at −20 dBm reference level. A 434 MHz isotropic Omnidirectional quarter wavelength antenna was used in this experiment as a full wavelength antenna could not be placed in the container due to size limitations. The frequency used in these trials was 434 MHz and the distance between the holes was calculated based on the near-field and far-field radiation to avoid the near-field radiation effect of the signal transmission [
19].
After some initial signal transmission tests, it was discovered that the difference between the permittivity of the materials (soil and container) caused the signals to be reflected (at the container and soil boundary) back into the container resulting in a wave guide action causing inconsistent measurements. In order to limit the effect of the container acting as a wave guide, it was earthed to the ground to cancel eddy current effects that were generated on the wall of the container. Results from the metallic container with the earth connection appeared to be consistent and not affected by the reflection and waveguide effect.
Figure 3 shows the final setup for the container.
To ensure that the comparison of the models was justified, identical soil permittivities were used as an input for both models. The Peplinski mixing model and the CRIM model were not used to determine the complex permittivity. Rather, the real and imaginary parts of the complex permittivity of the soil, used in the simulations, were determined from Time Domain Reflectometry measurements using the Topp model [
11]. Topp [
11,
20] have shown that the difference between the dielectric permittivity by these different methods is within 3 to 40 for the change of the volumetric water content (VWC) ranged 0 to 0.55. This complex permittivity was then used as an input into both the modified-Friis and the CRIM-Fresnel models to estimate signal attenuation for comparison with the measured values of the signal attenuation along the 10 to 50 cm path. The comparison between the models and the measured results is described in the next section.
3. Results and Discussion
The measured attenuation of the EM signal transmitted through the soil in the container was compared with the estimated values for the attenuation calculated based on the modified-Friis and CRIM-Fresnel models.
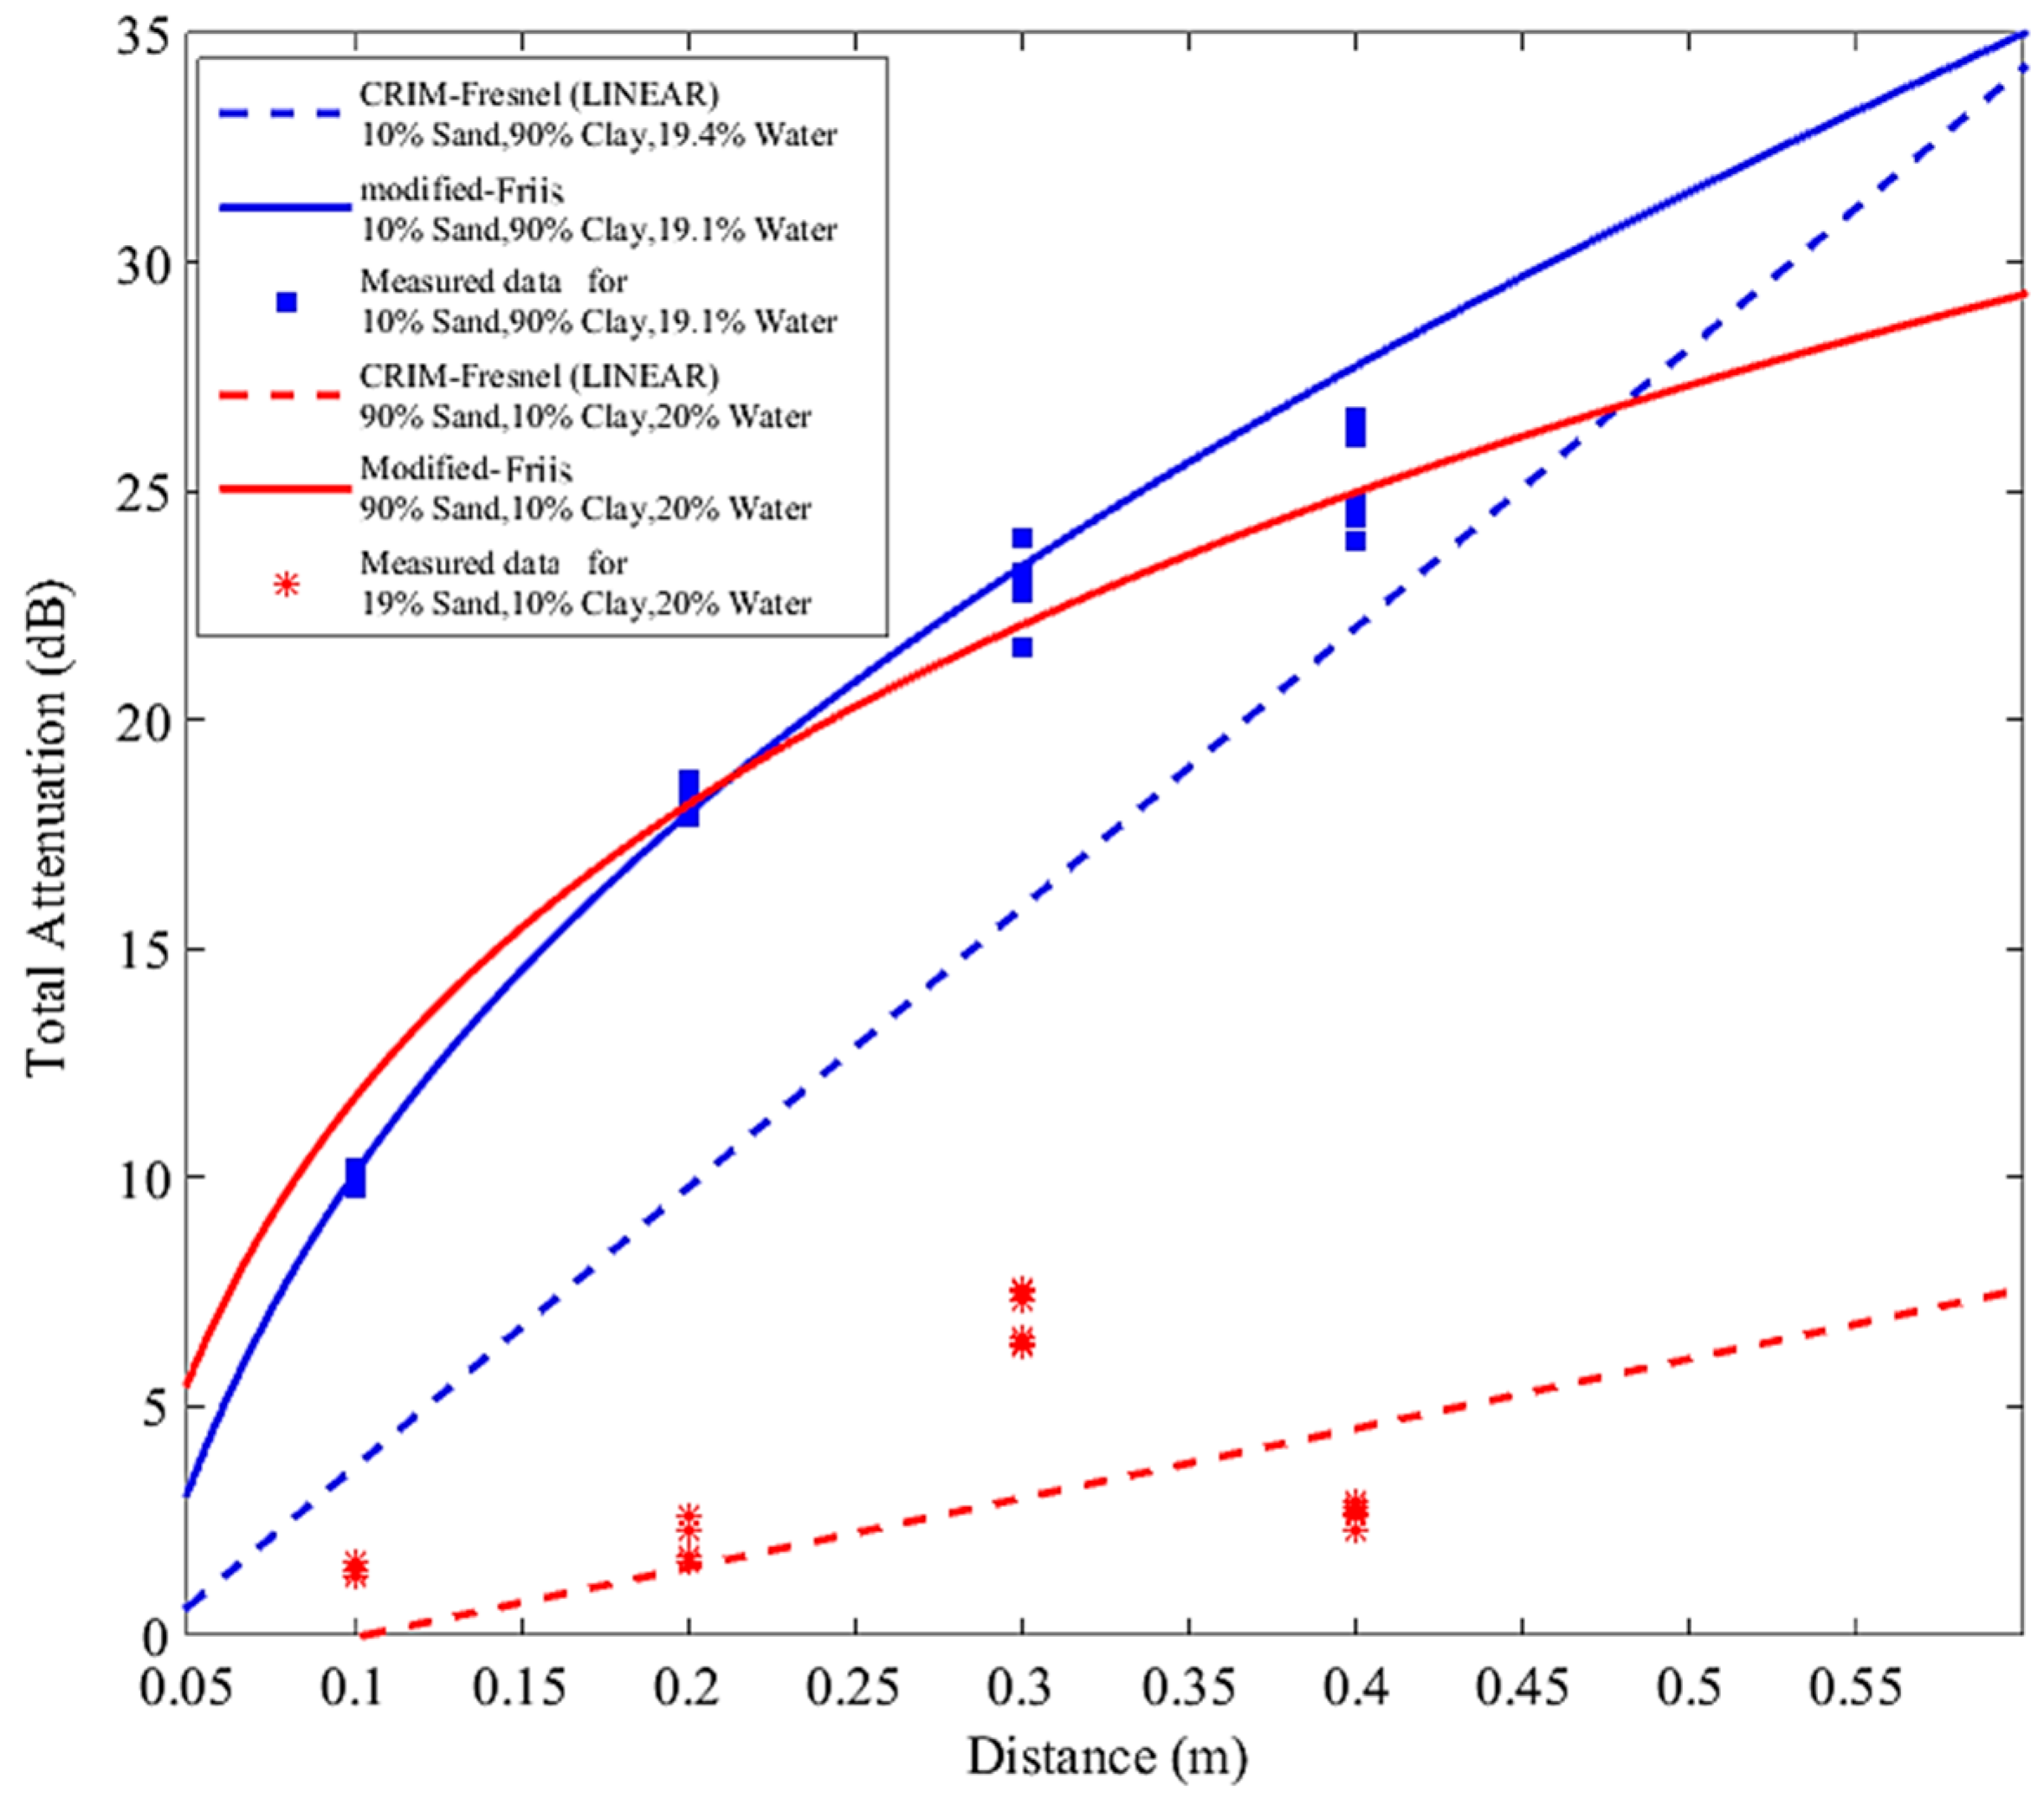
The initial test was carried out using a soil mixture of 90% sand and 10% clay, with a 19.4% gravimetric water content (GWC) and 10% sand and 90% clay, with a 19.1 % GWC. The result from the test can be seen in
Figure 4.
From
Figure 4, it can be seen that the estimated attenuation of the signal by both models is broadly different as expected. In addition, it can be seen that the modified-Friis model provides a better estimation of the attenuation for the soil samples with high clay content while the CRIM–Fresnel model provides a better approximation for the soil with high sand content. These comparisons showed an inconsistency in the accuracy of the models across the range of soil compositions. The modified-Friis model is shown to have a better accuracy in soils with higher permittivity values compared to CRIM-Fresnel model while CRIM-Fresnel model provides a better approximation in lower permittivity soils. The test was repeated on more soil mixtures in terms of the proportions of sand and clay to get a better understanding of the applicability of the findings.
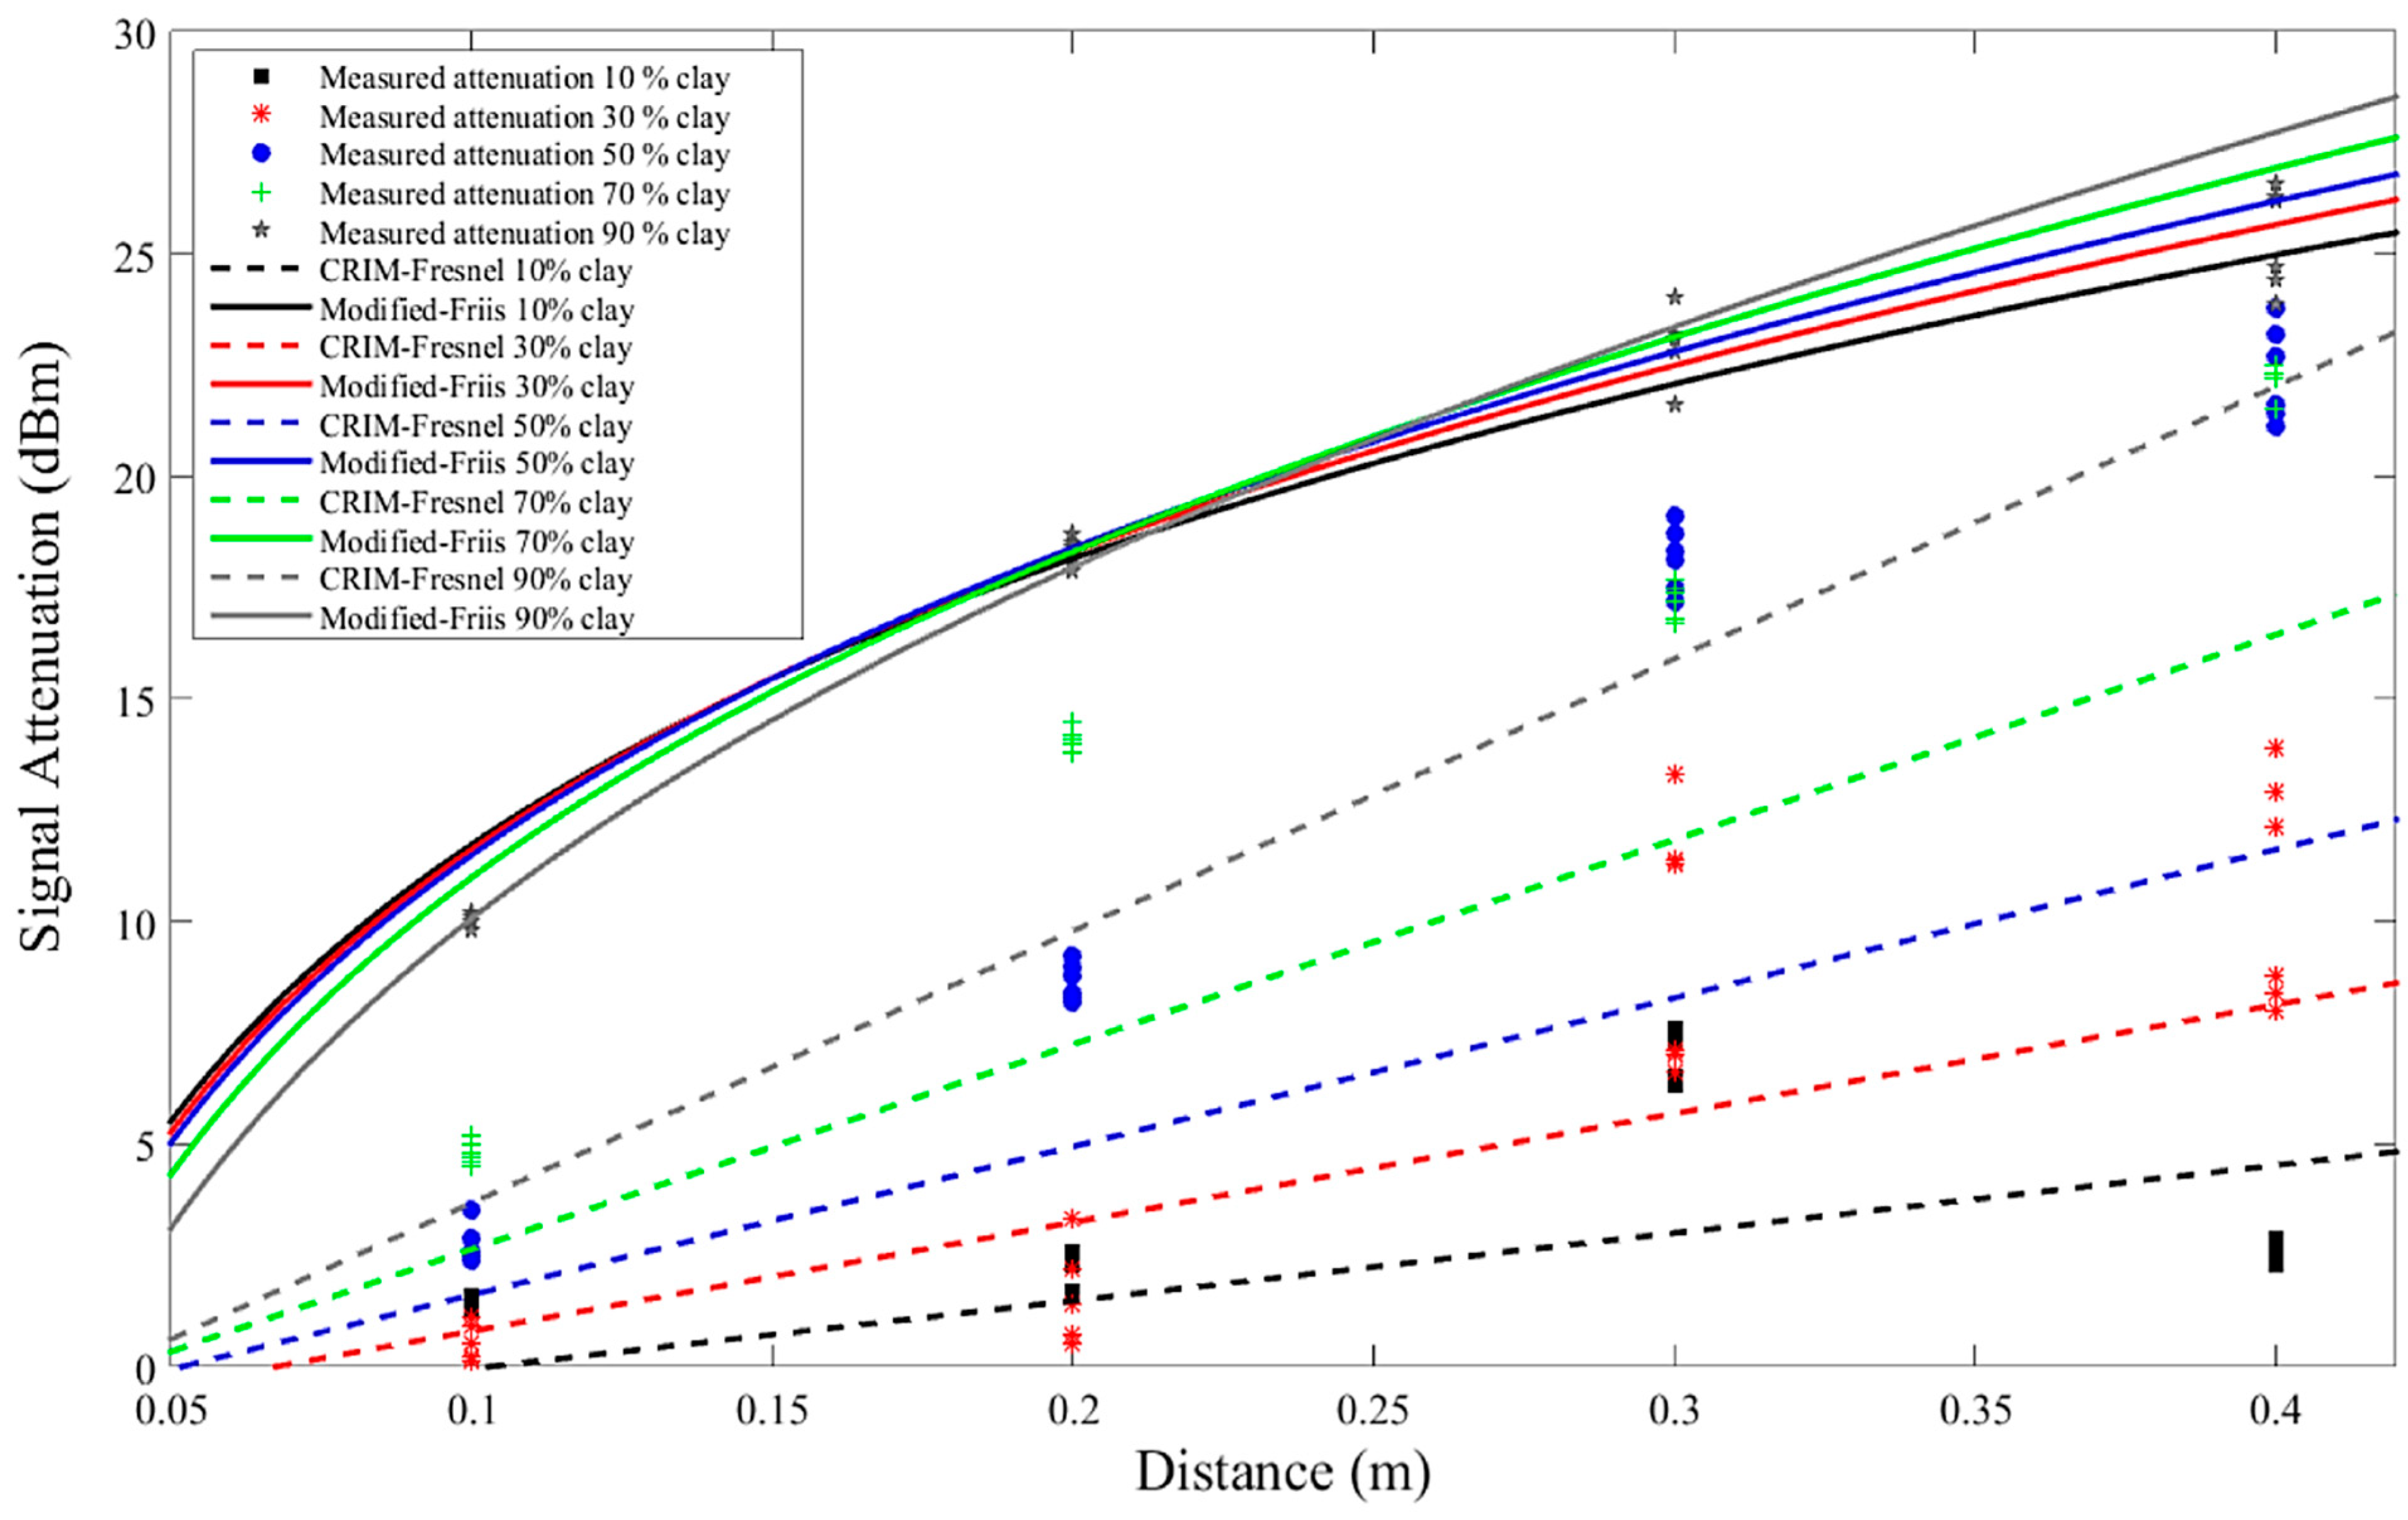
Figure 5 shows the experimental attenuation values for a 434 MHz carrier frequency in samples with varying composition at 20% GWC as compared to the values predicted by the models in order to investigate the effect of clay content on model performance.
As can be seen from
Figure 5, the amount of clay present in the soil has a direct effect on the attenuation of the signal; with an increase in clay content comes a rise in the attenuation of the signal. This is in line with the literature [
15,
21]. It can also be seen from this figure that both the CRIM-Fresnel and the modified-Friis models fail to estimate the attenuation of the signal accurately for all the soil compositions. However it can also be seen from this figure that the CRIM-Fresnel provides a better estimation at lower clay content samples compared to the modified-Friis model. For example at 10% clay content the modified-Friis model had a root mean square error (RMSE) of 16.6 while CRIM-Fresnel model had an RMSE of 2.35. In contrast the modified-Friis model estimated the attenuation of the signal in higher clay content samples with higher accuracy compared to the CRIM-Fresnel model. As an example, in the sample with a 90% clay content the modified-Friis model had an RMSE of 1.13, while the CRIM-Fresnel model had an RMSE of 6.67. To understand the effect of GWC on the models prediction accuracy the attenuation values for a 434 MHz carrier frequency in soil samples with 50% clay and 50% sand and with varying GWC were measured; the results as compared to the simulation values are displayed in
Figure 6.
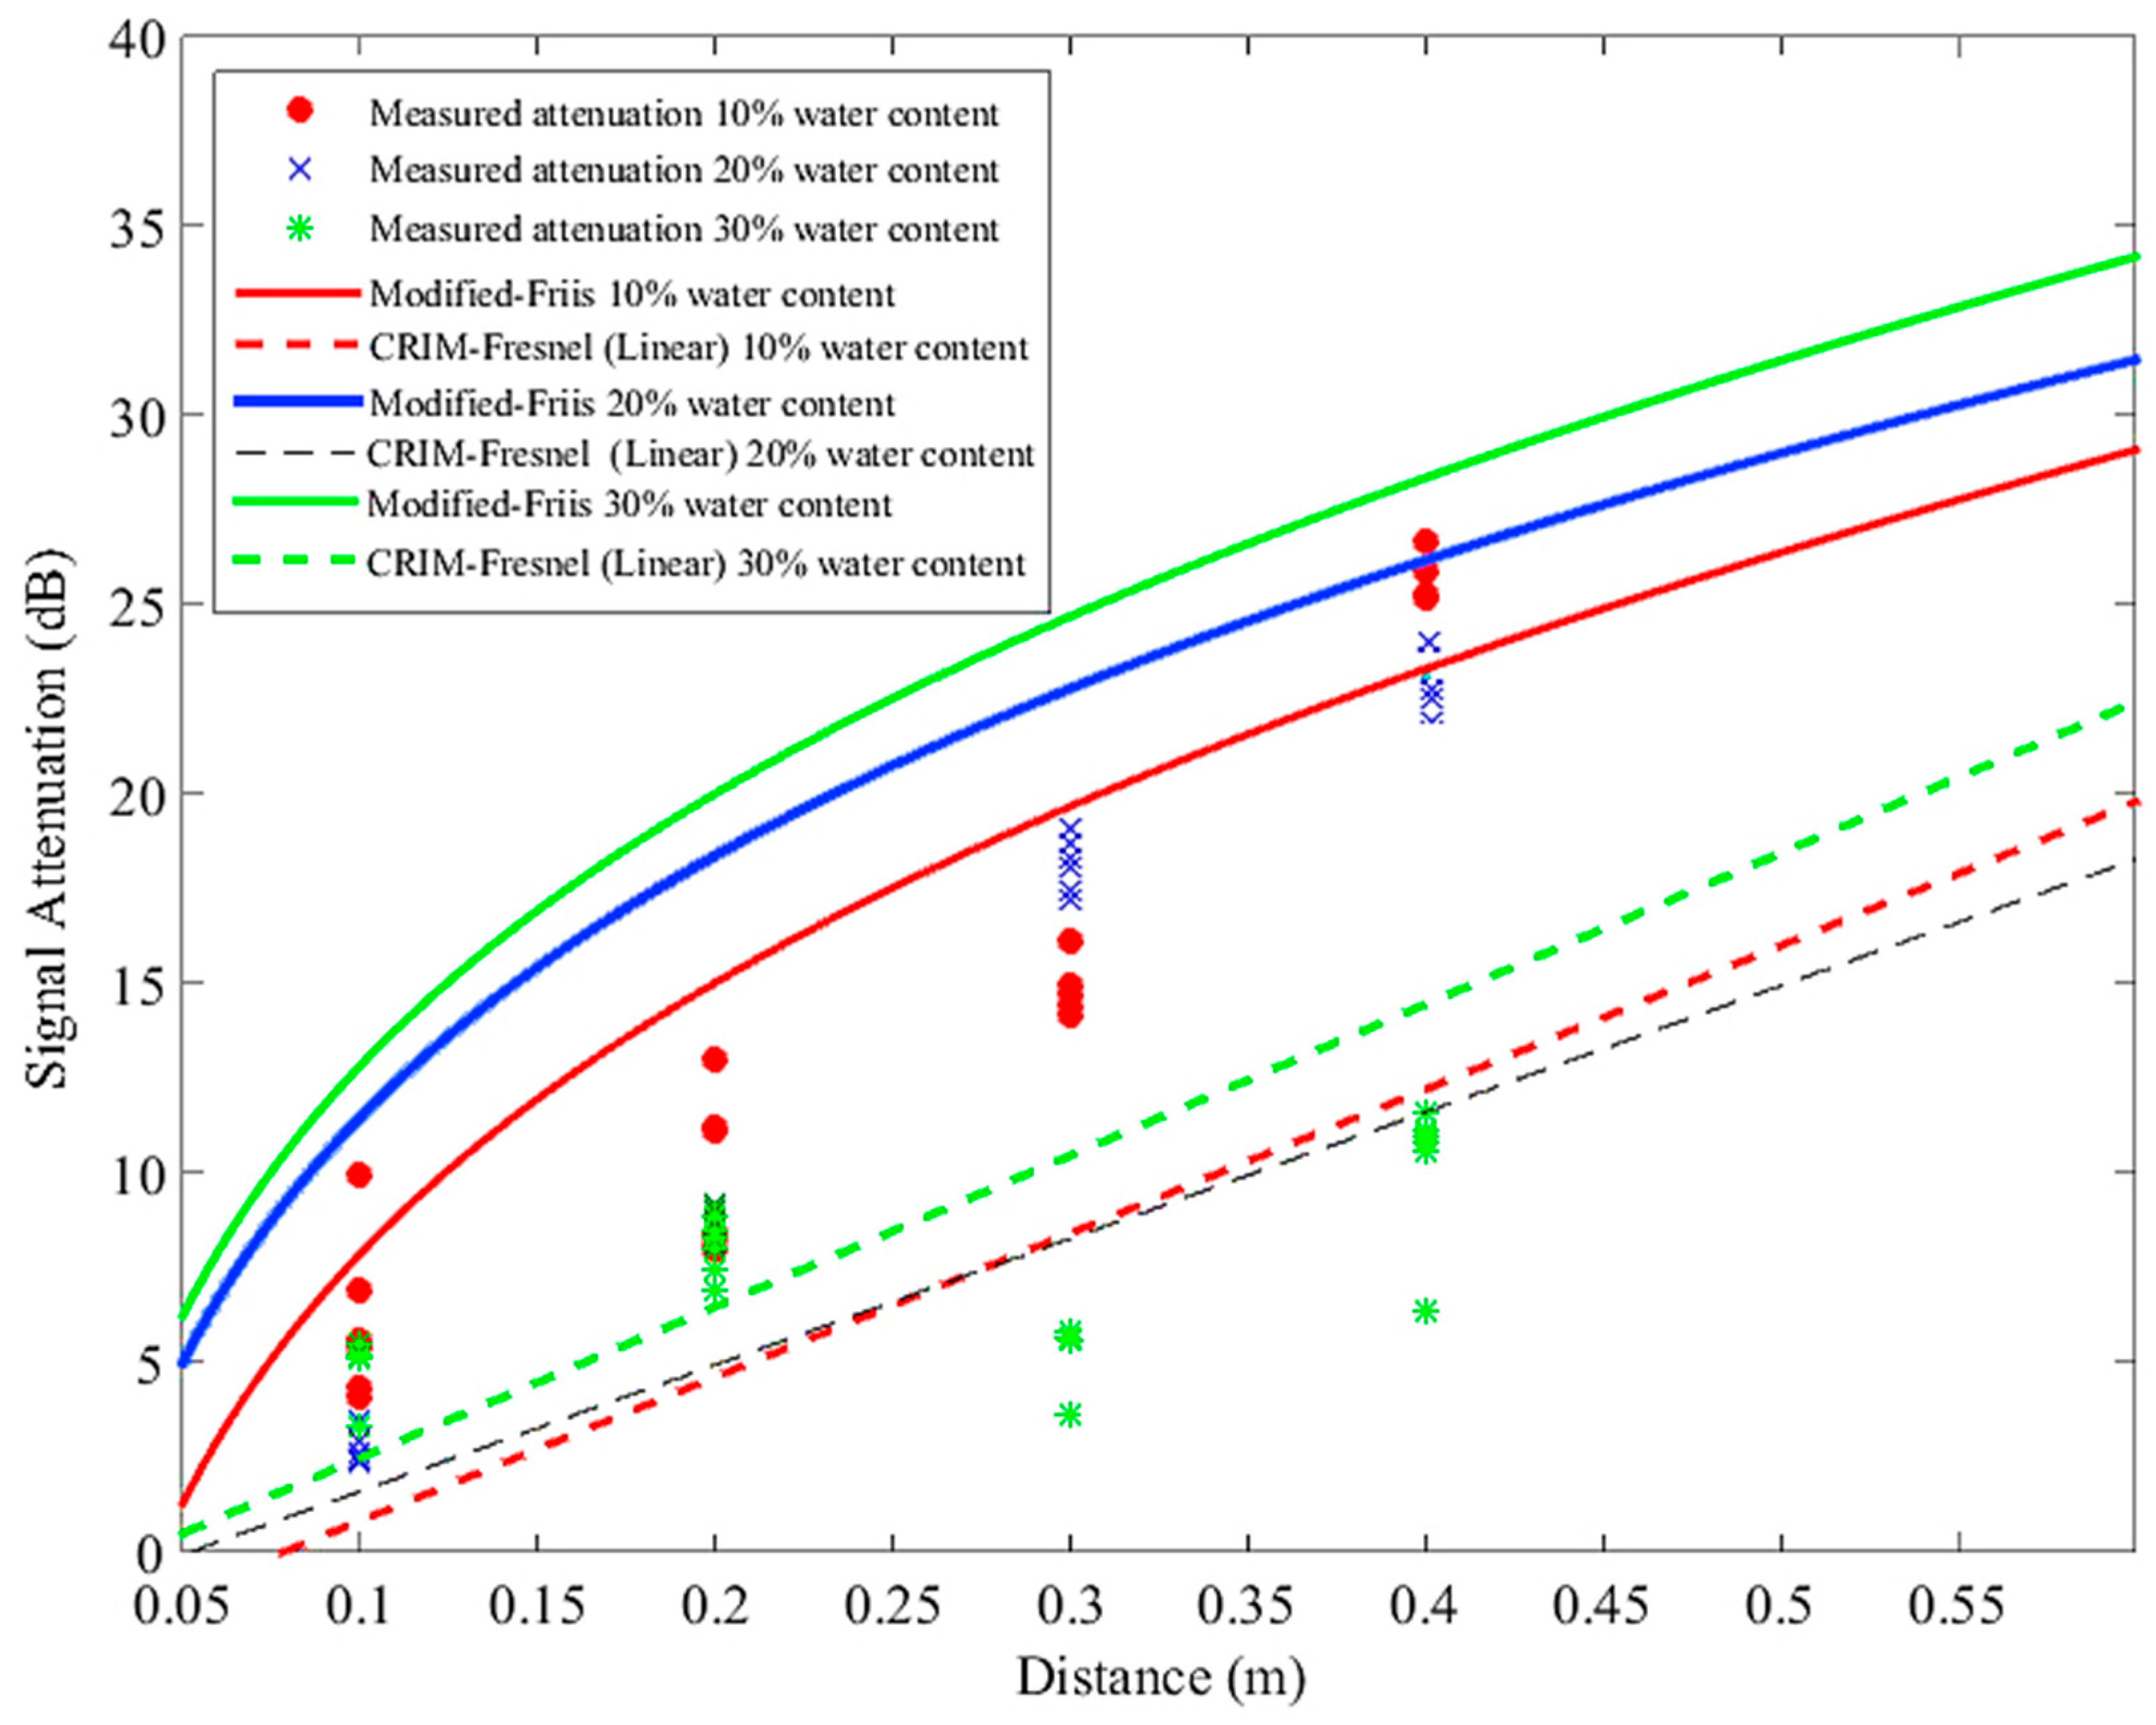
Both of the models failed to provide an accurate estimation for samples at all of the GWC range. However, based on the RMSE values of the models at different gravimetric water contents, the modified-Friis model provided a better estimation at lower GWC compared to the CRIM-Fresnel model. As an example at 10% water content the modified Friis had an RMSE value of 3.54, while CRIM-Fresnel model had an RMSE of 8.59. In contrast, at 30% GWC the modified Friis model had an RMSE value of 14.85 while the CRIM-Fresnel model had an RMSE of 3.52, which shows that the CRIM-Fresnel model provides a better estimation at higher water content values.
From the results shown in
Figure 6 it can be concluded that the CRIM-Fresnel model is more suitable for estimating the attenuation in soils with a high water content (>20%) and lower clay content (<50%), while the modified-Friis model provides a better approximation for samples with a lower water content (<20%) and higher clay content (>50%). This is mainly caused by the high effect of the imaginary part of the dielectric permittivity on the estimation values of the CRIM-Fresnel model. In addition, the CRIM-Fresnel model provides a linear estimation of the attenuation of the signal with an increase of distance. This is not similar to the fundamental behaviour of the signal and will result in larger estimation errors for the signal attenuation (over estimation) at larger distances.
Based on the attenuation it can be concluded that the transmission of the EM signals in soil is mostly dependent on the soil properties and in particular the percentage of clay present, volumetric water content, porosity and the bulk density in the soil. A soil composition with a high percentage of clay will tend to have more bound water and a high bulk density which adversely effects the propagation of the signal in certain distances. The available attenuation models have been found to have different applicability for these different soil conditions, thus, it is essential to choose the most appropriate model for the local soil conditions when estimating EM attenuation in soil.


