Open-Source Wireless Cloud-Connected Agricultural Sensor Network


Abstract
1. Introduction
2. Materials and Methods
2.1. Hardware
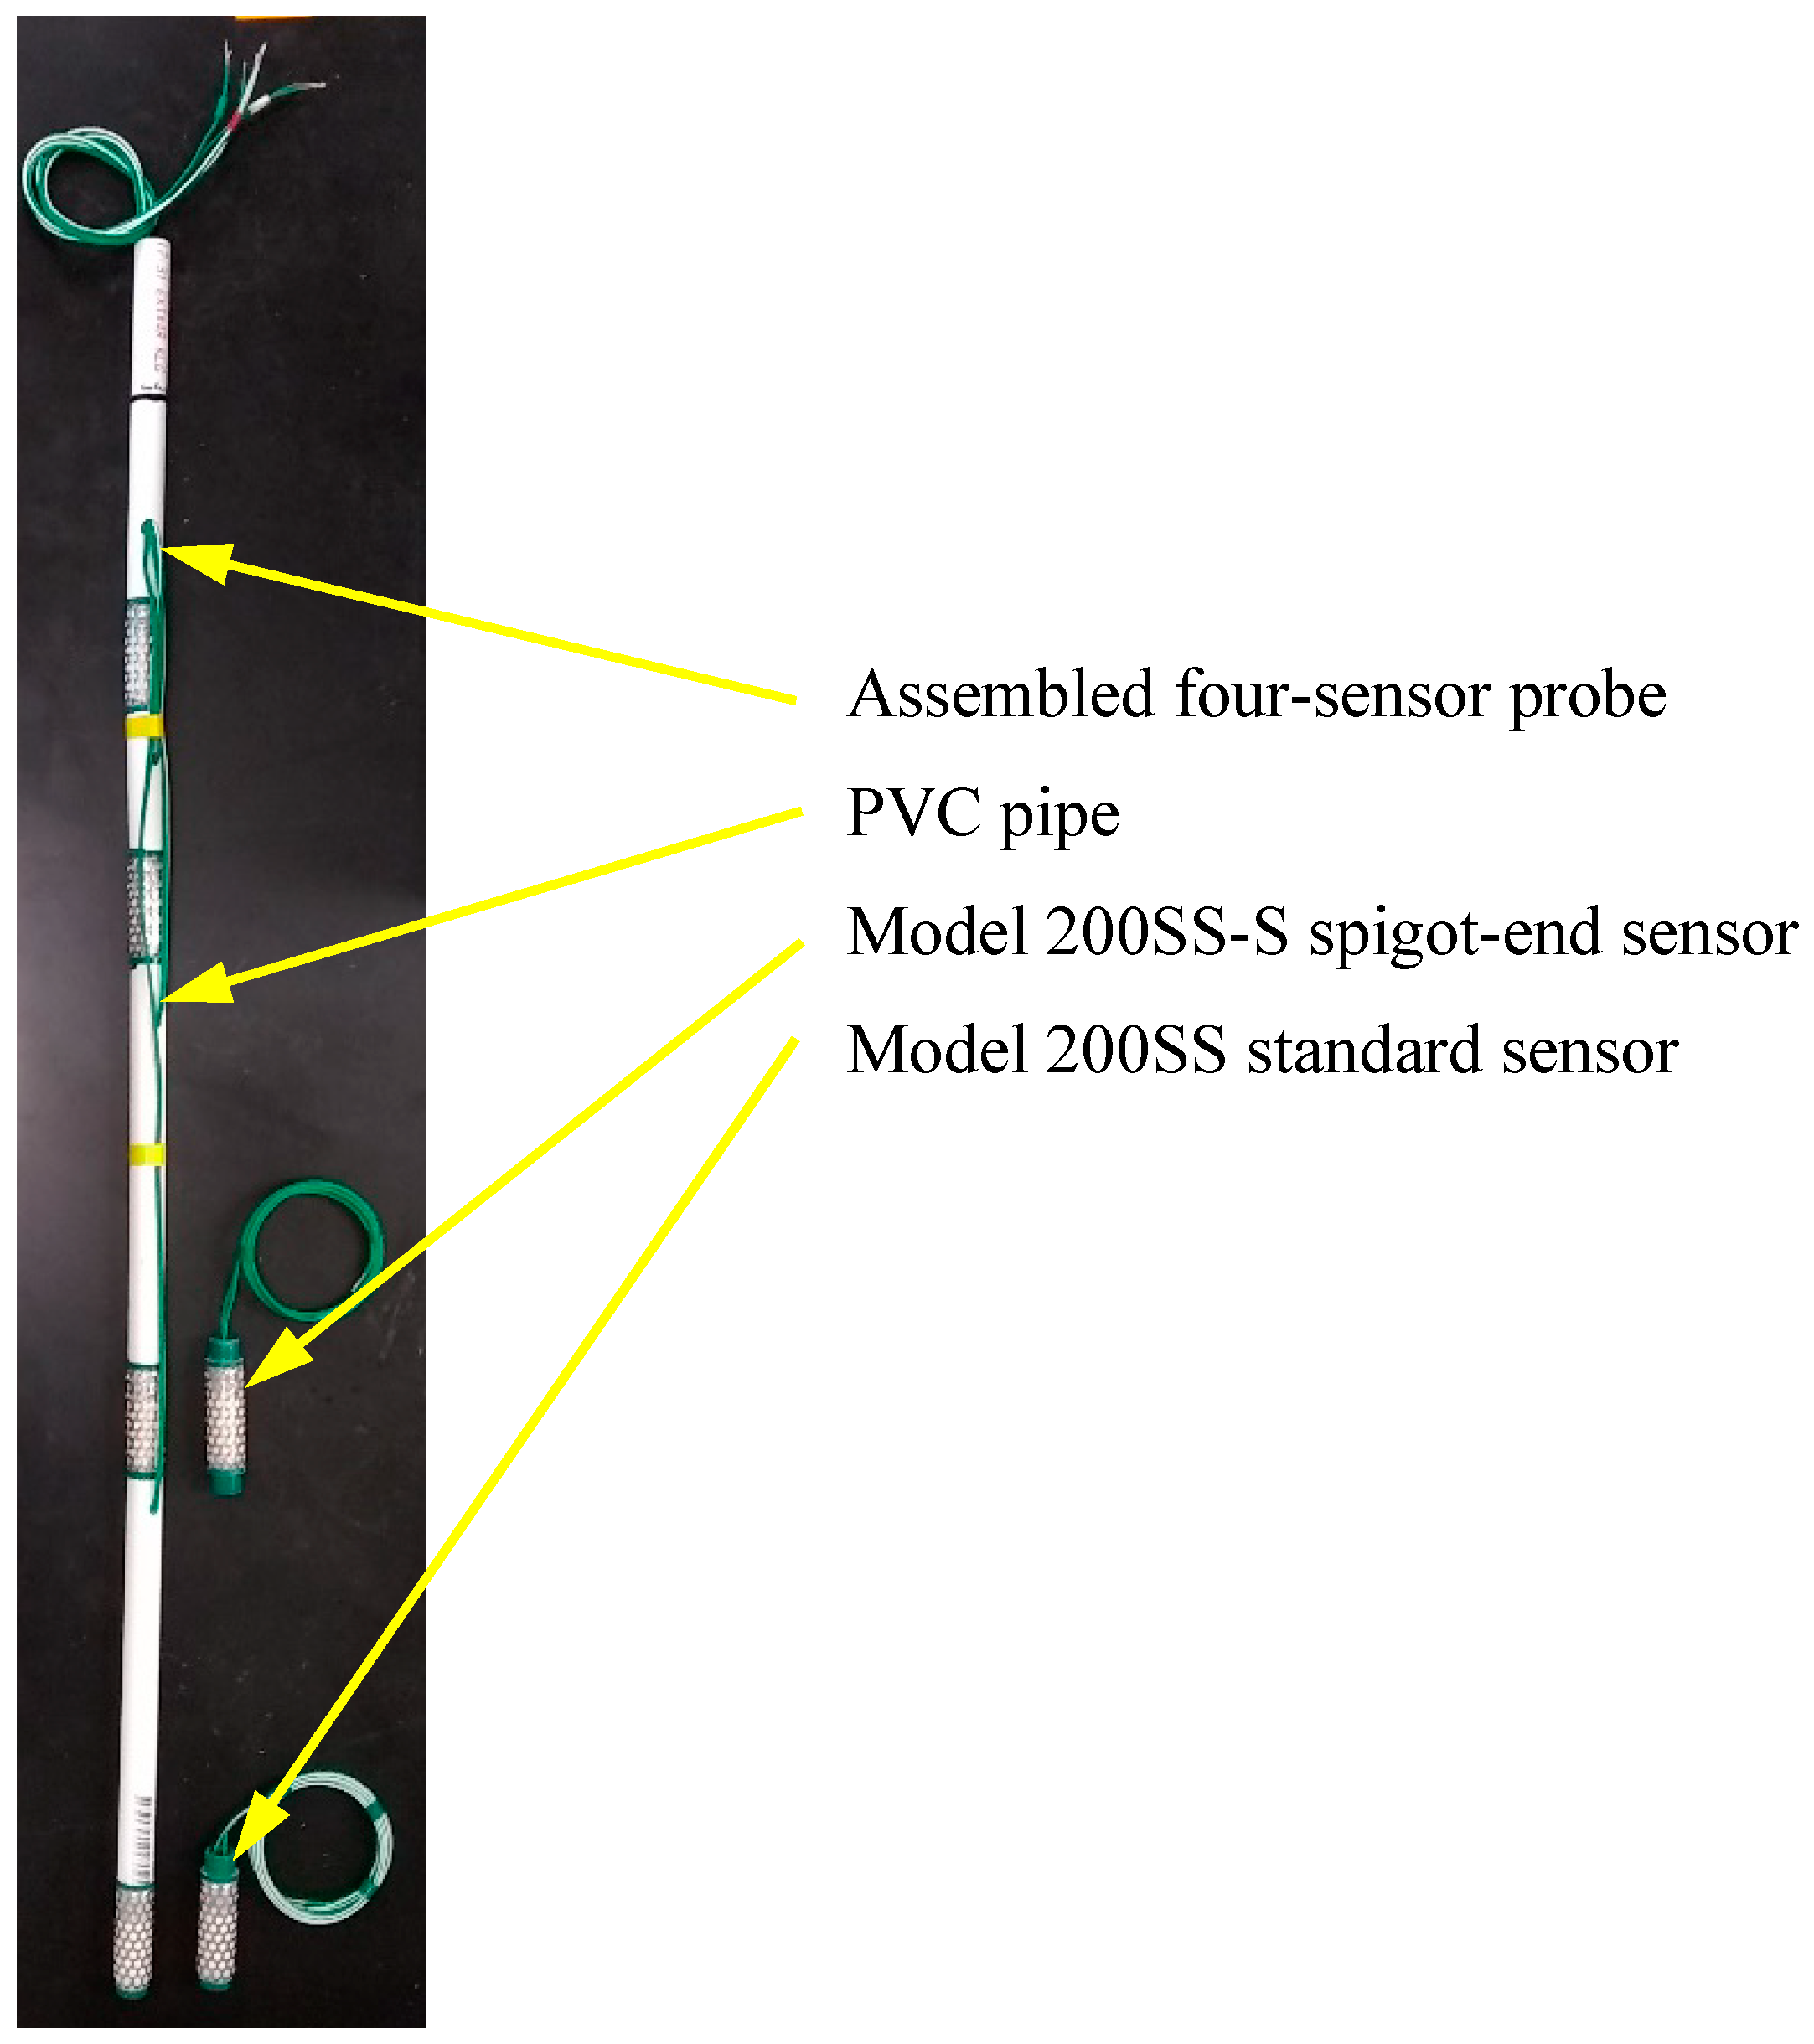
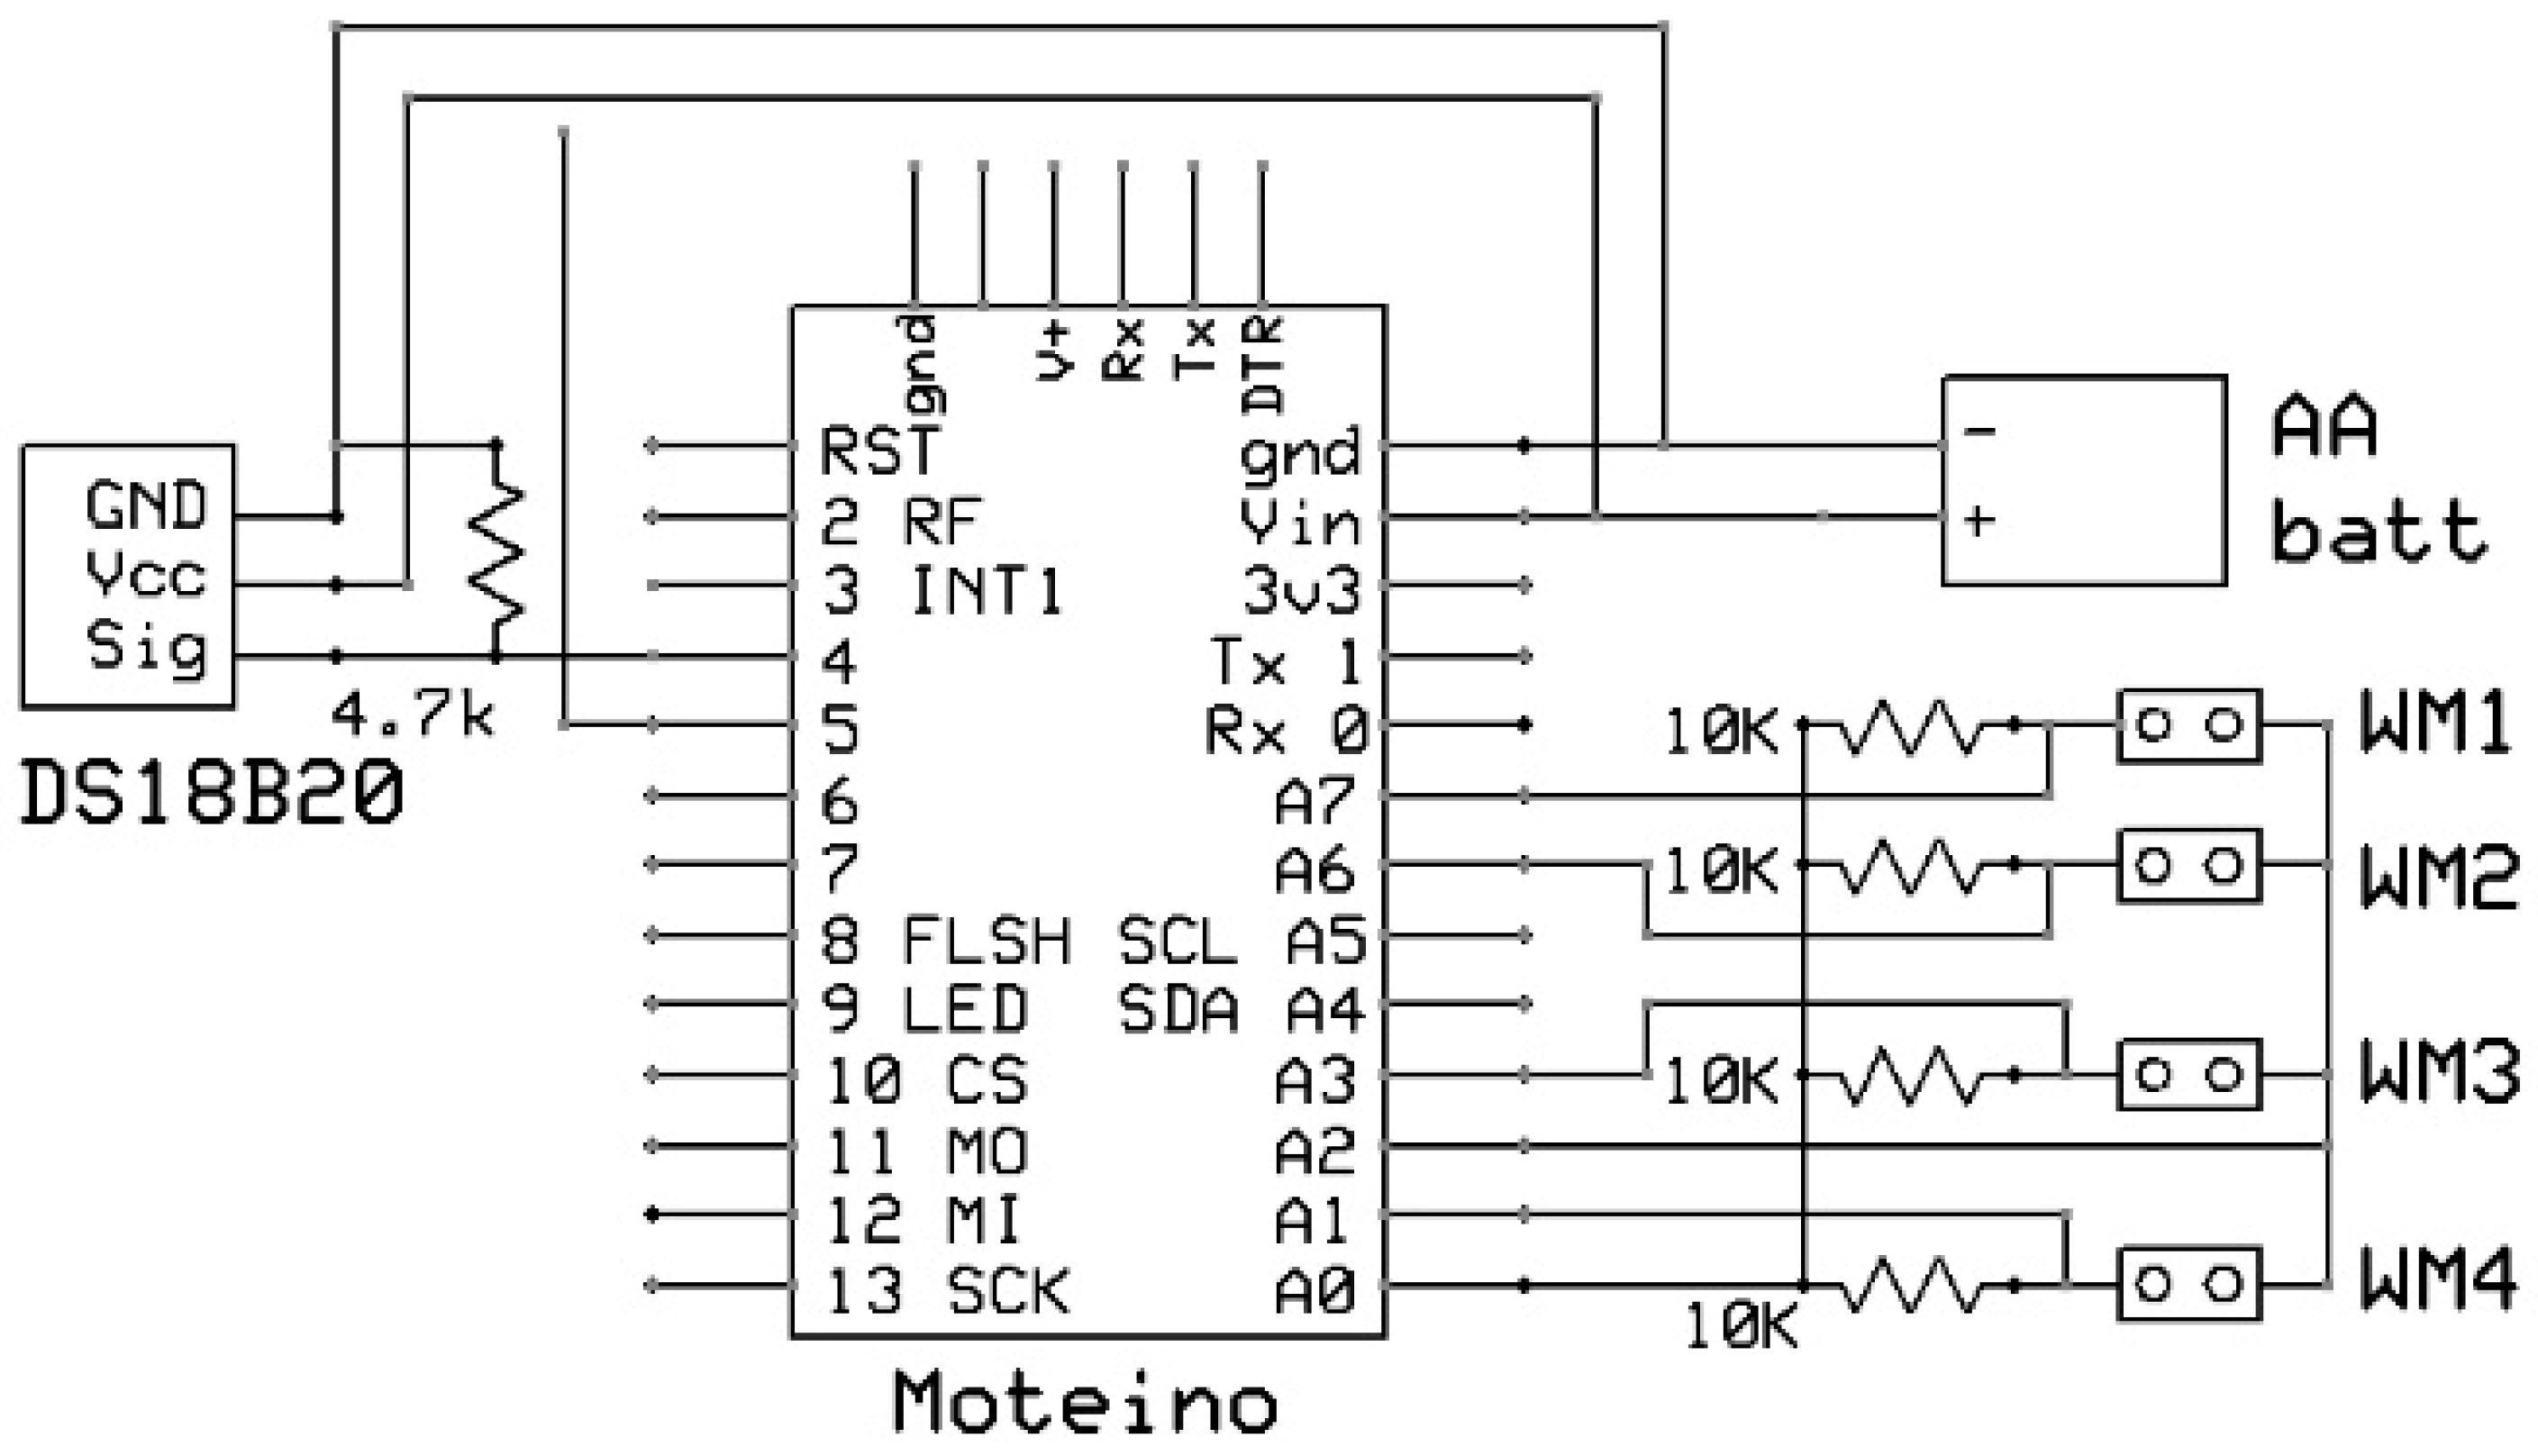
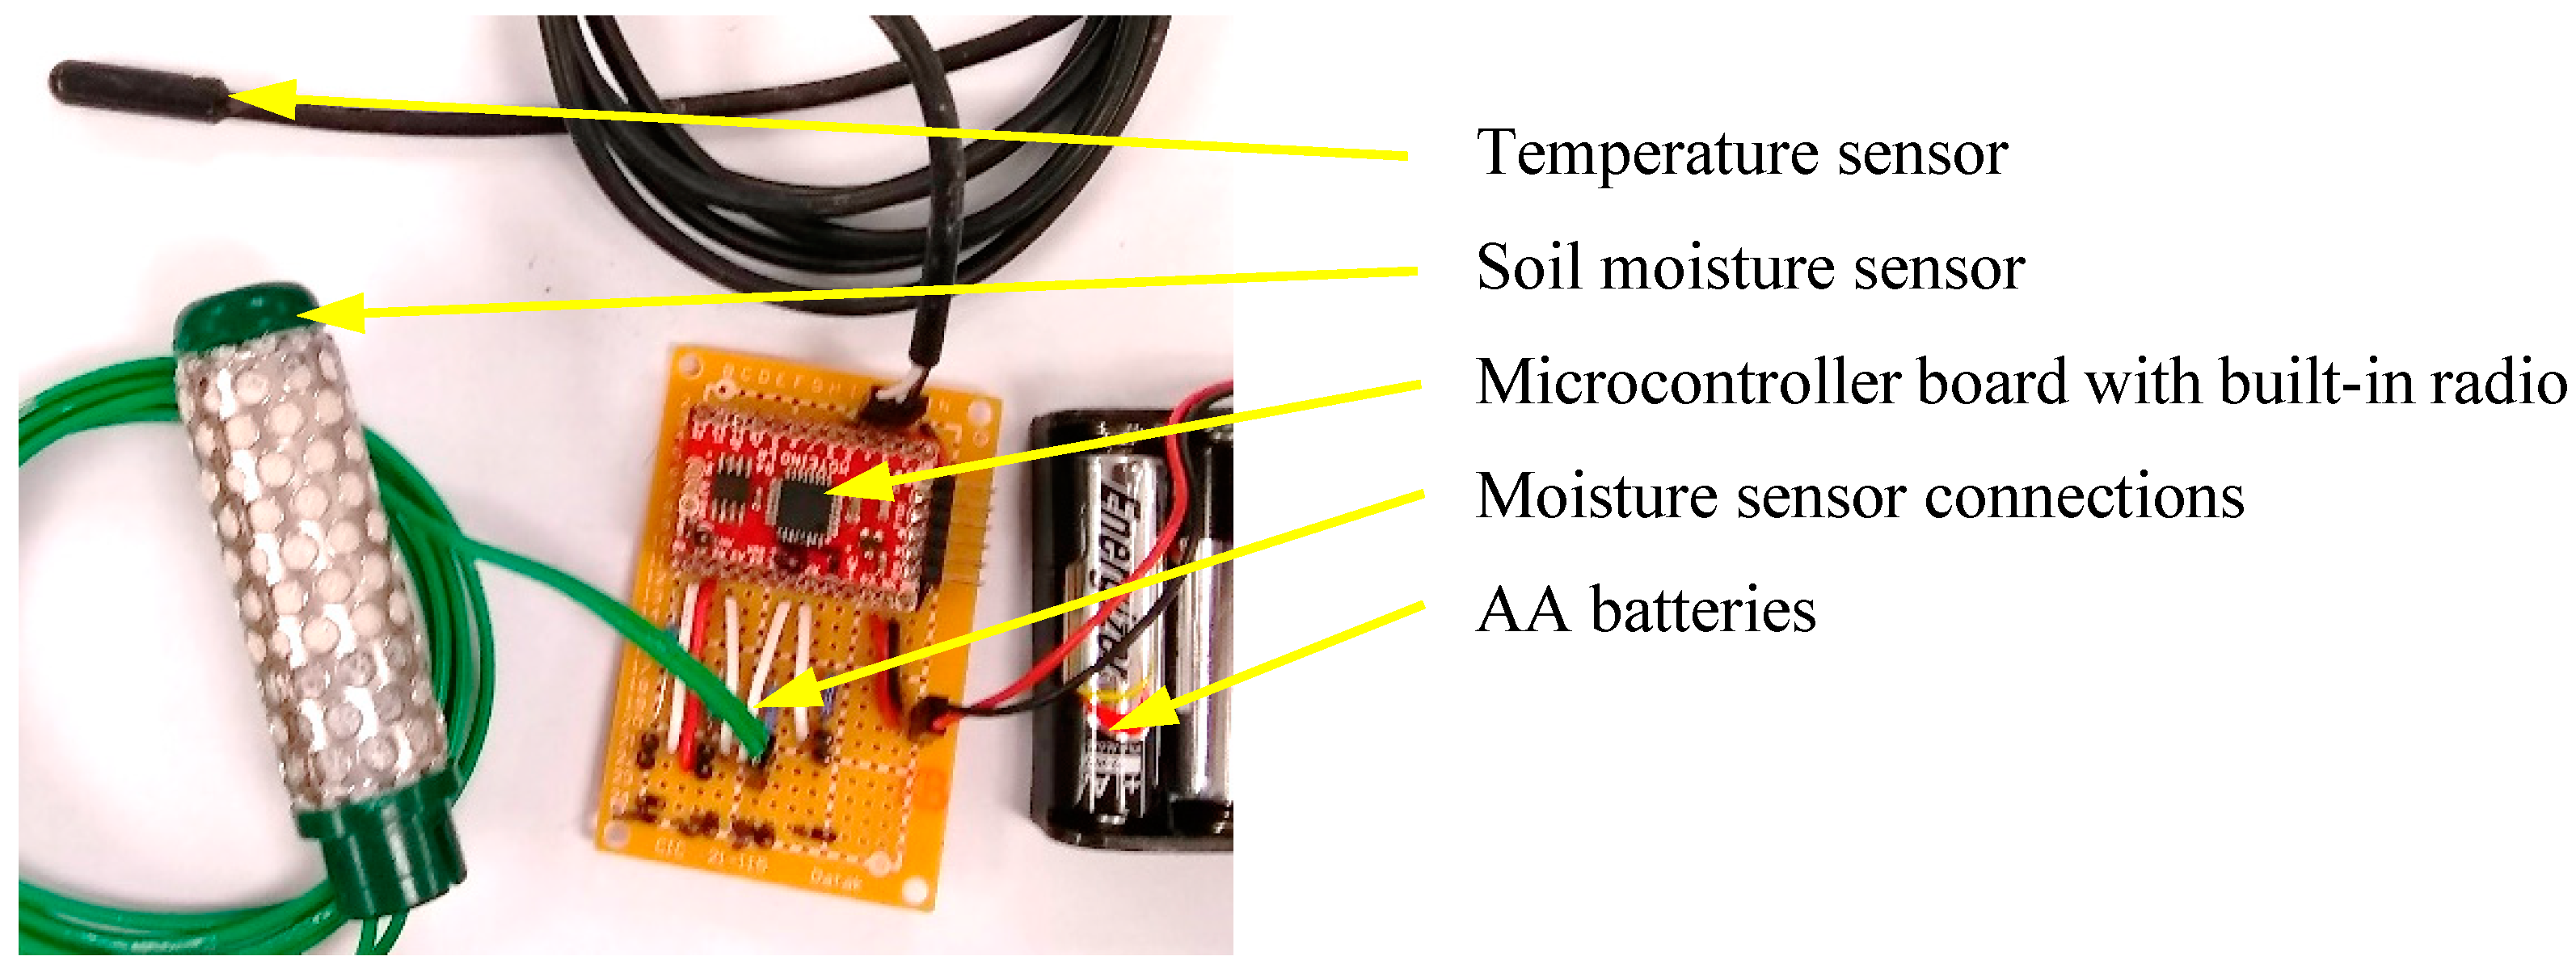
2.1.1. Sensor Nodes
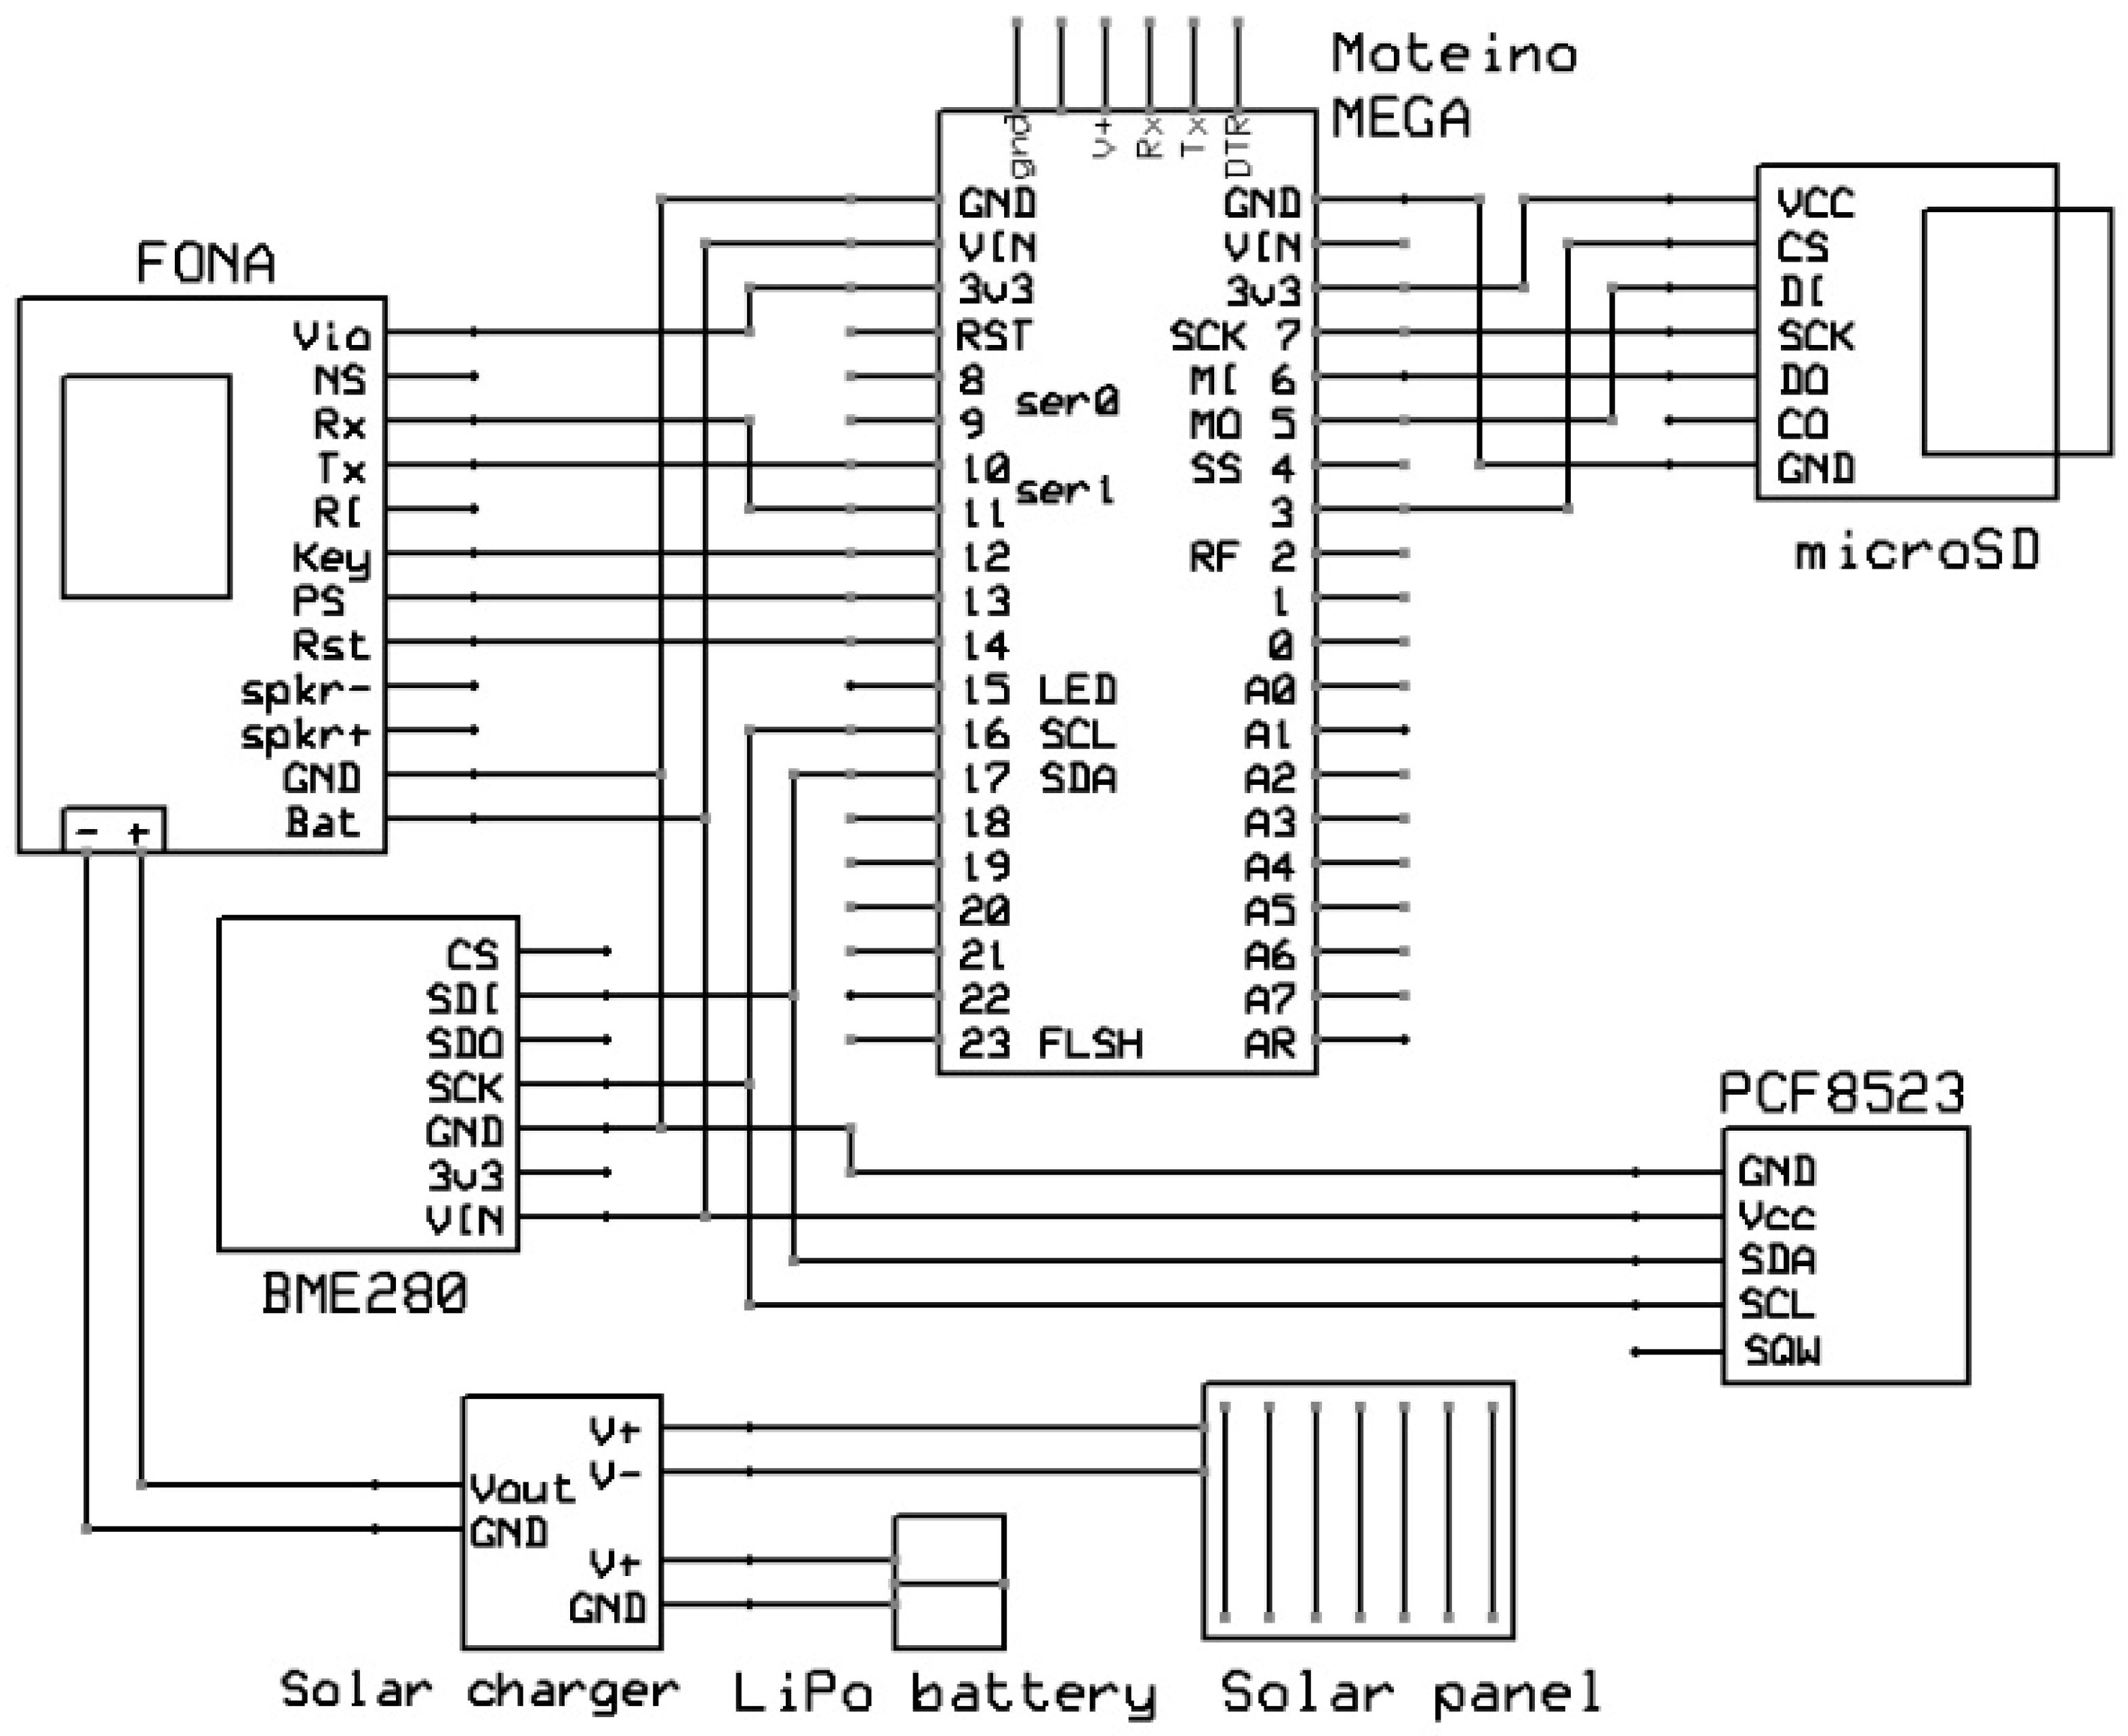
2.1.2. Cellular Gateway
2.2. Software
2.2.1. Microcontroller Programming
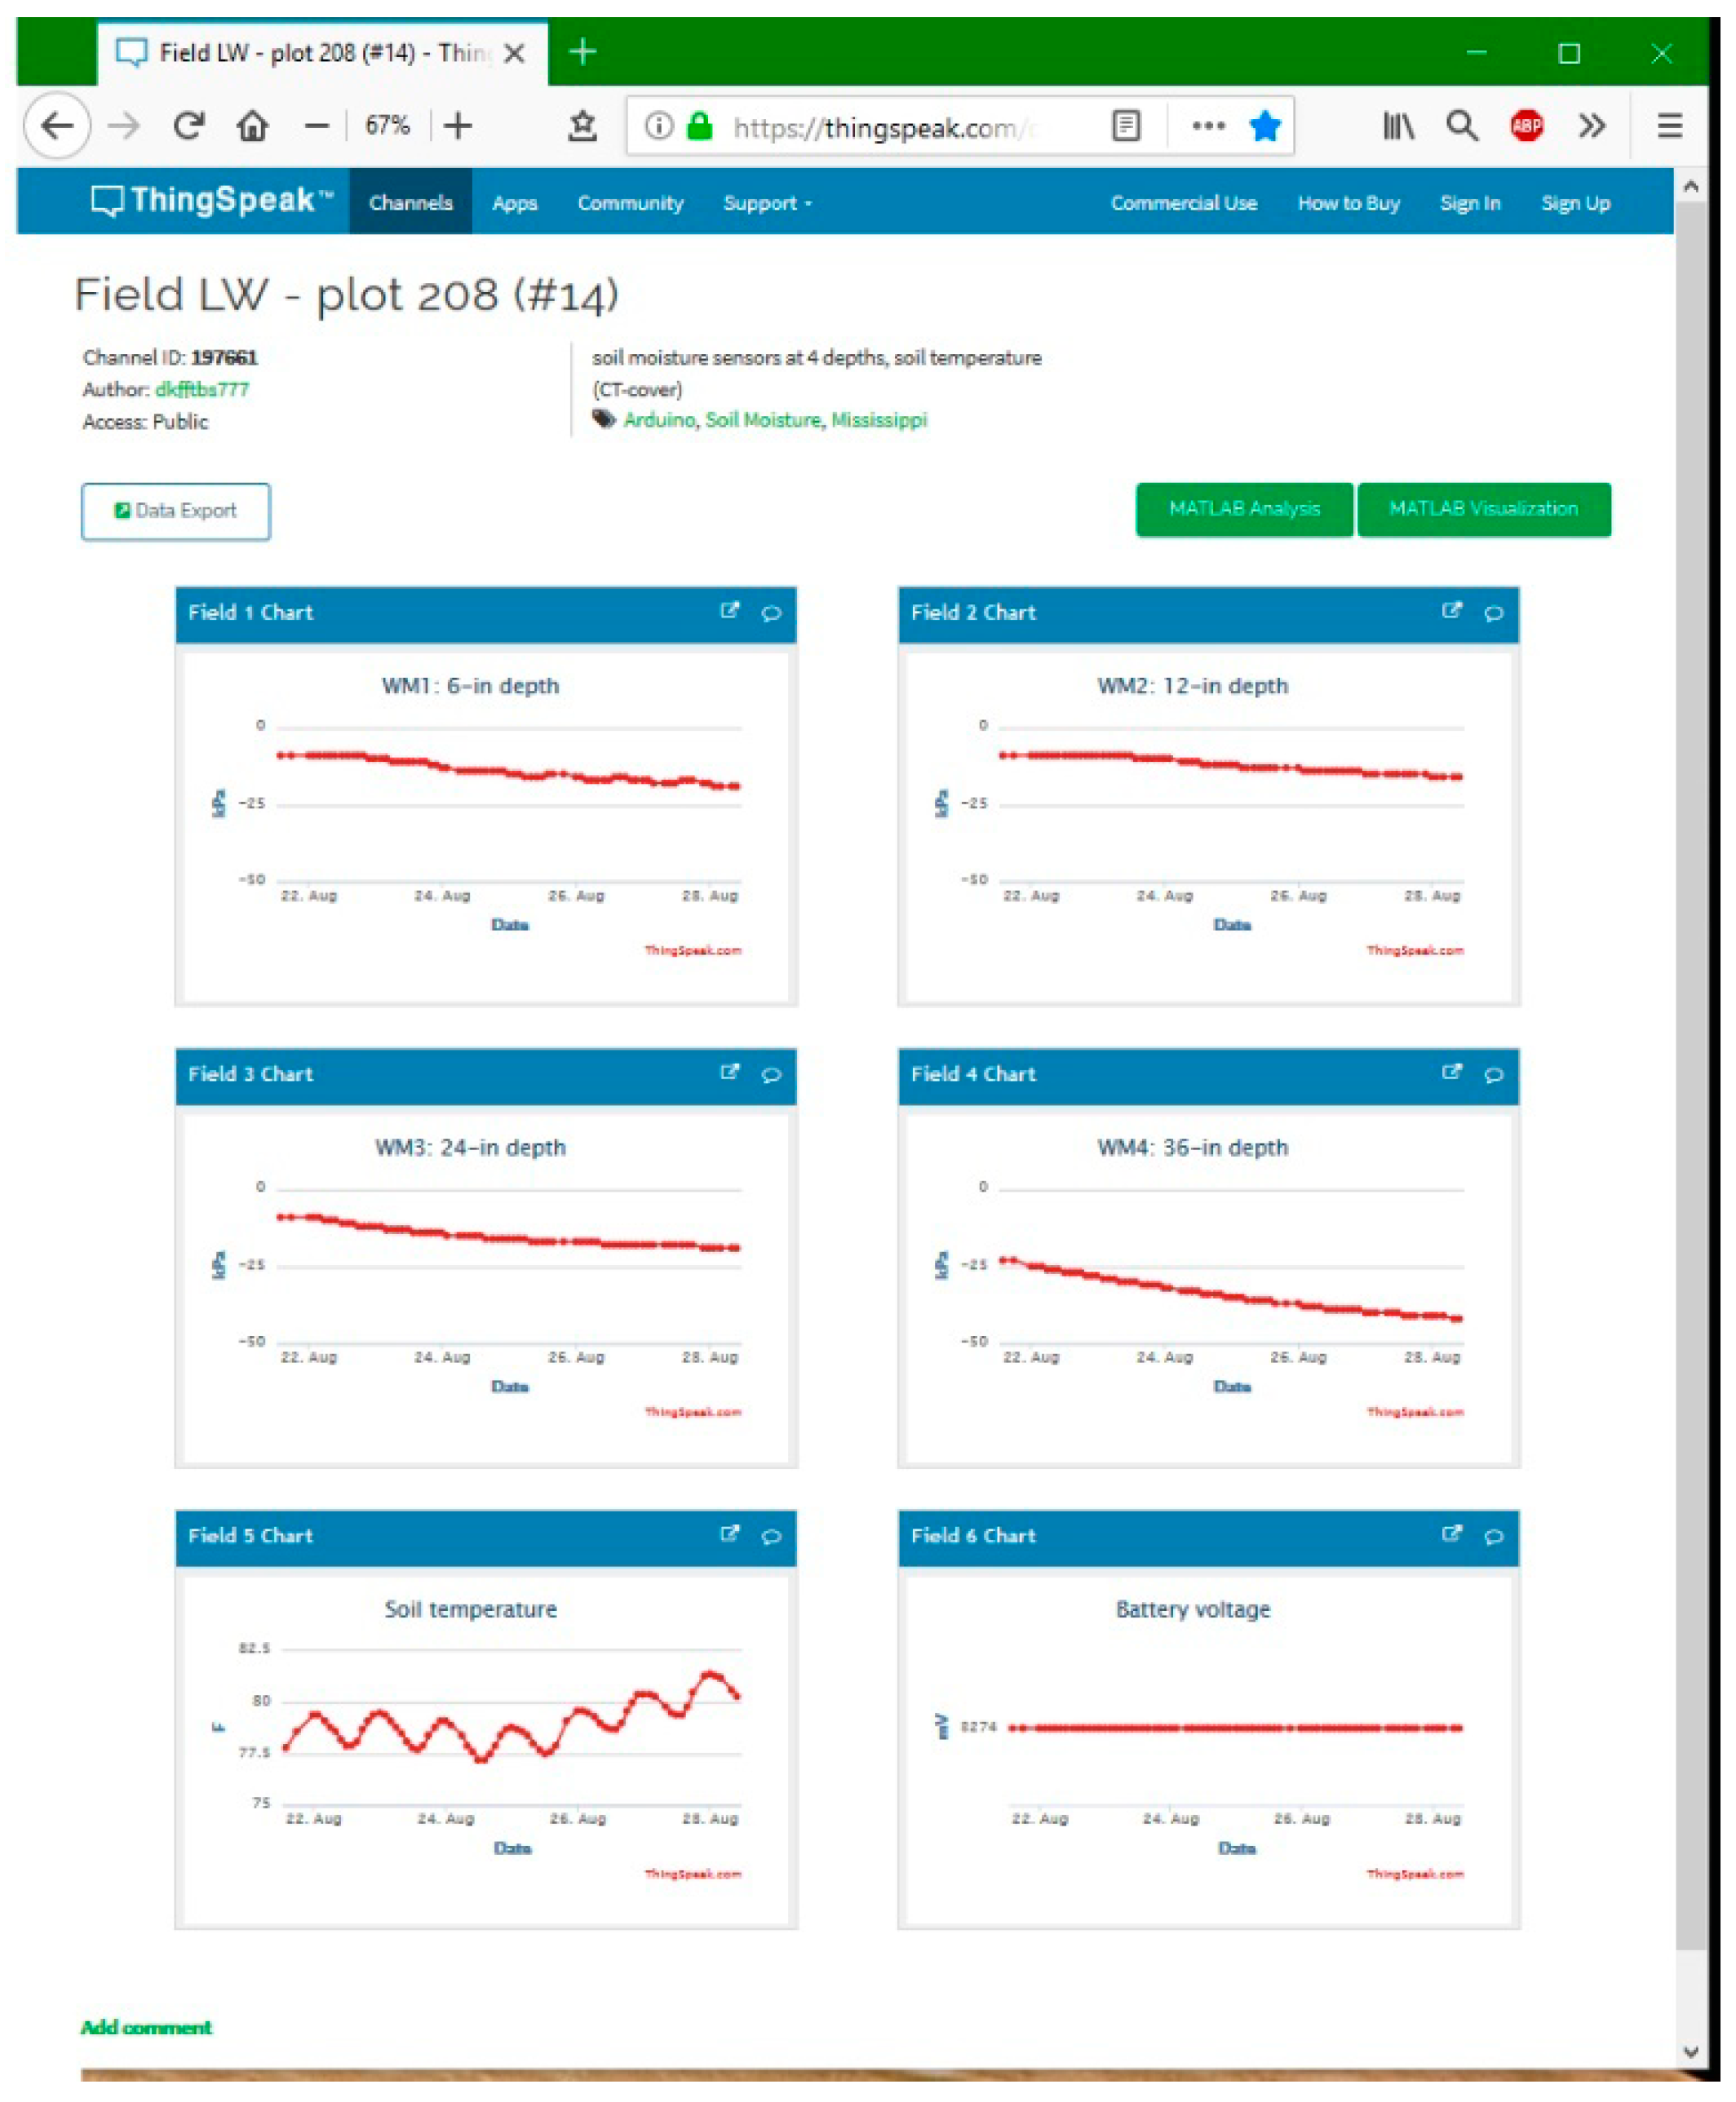
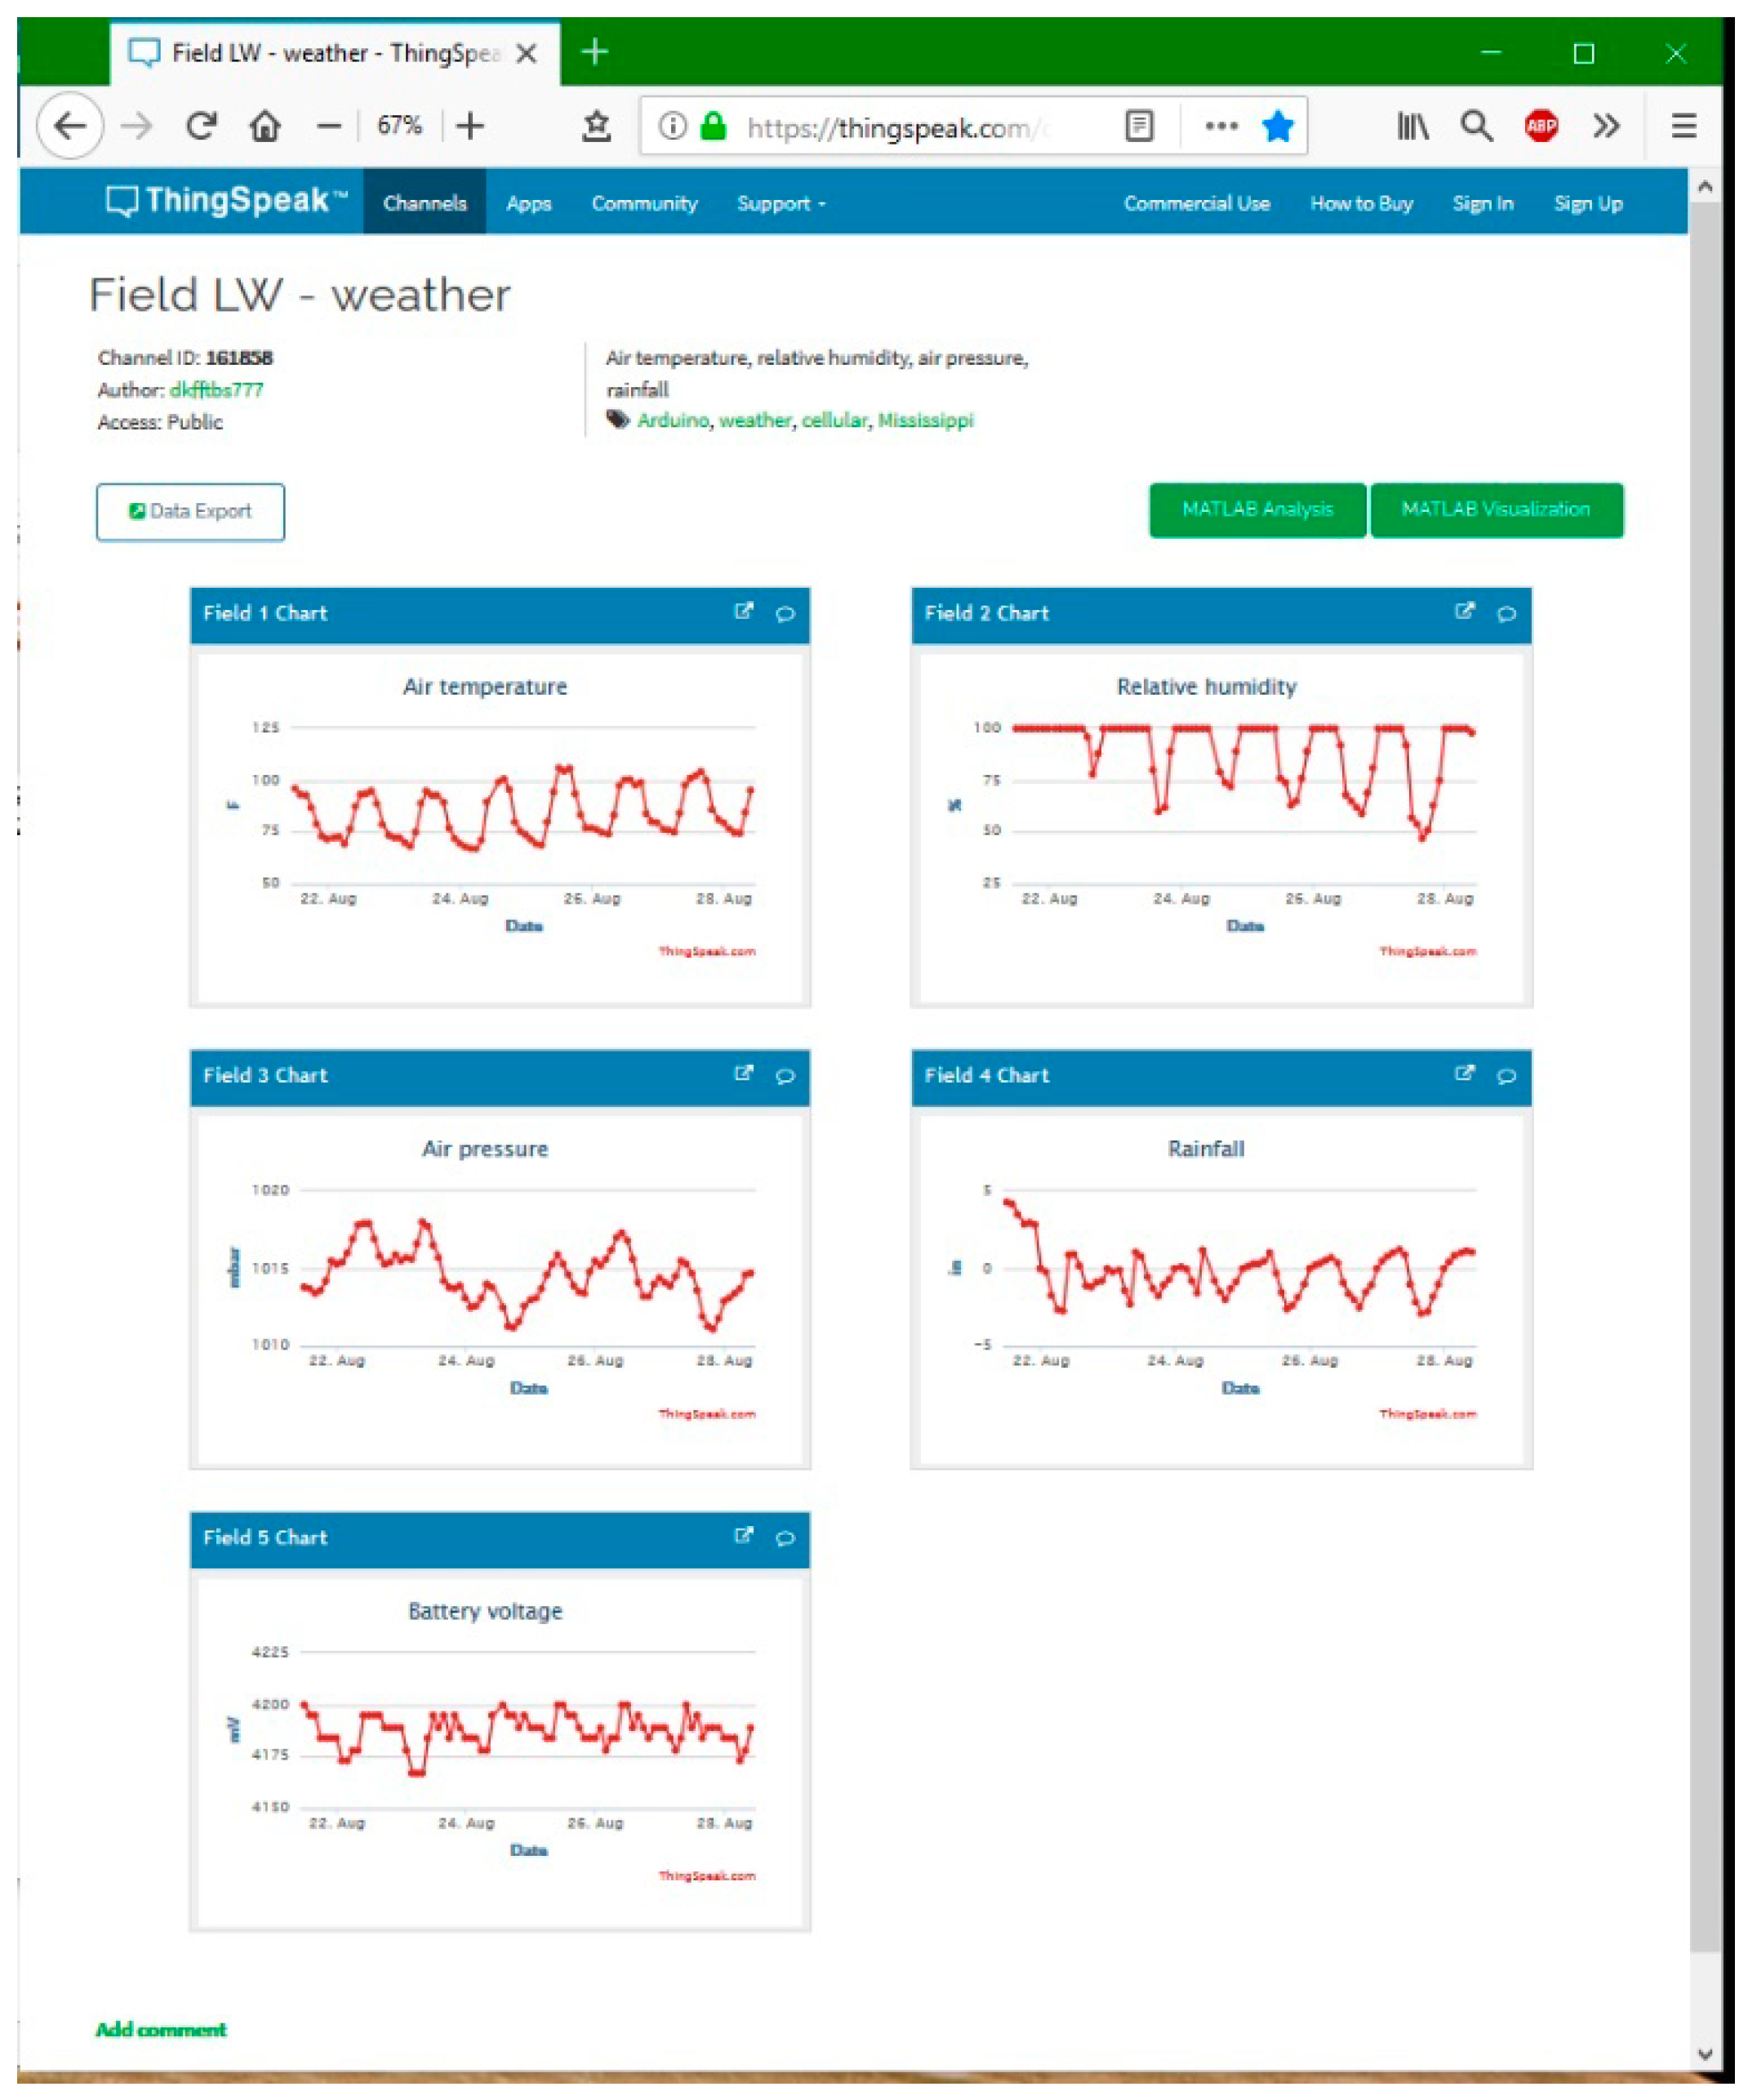
2.2.2. Internet Website
3. Results and Discussion
4. Conclusions
Author Contributions
Funding
Conflicts of Interest
Disclaimer
References
- Pearce, J.M. Building research equipment with free, open-source hardware. Science 2012, 6100, 1303–1304. [Google Scholar] [CrossRef] [PubMed]
- Fisher, D.K.; Gould, P.J. Open-source hardware is a low-cost alternative for scientific instrumentation and research. Mod. Instrum. 2012, 1, 8–20. [Google Scholar] [CrossRef]
- Kera, D. Science artisans and open science hardware. Bull. Sci. Technol. Soc. 2018, 2, 97–111. [Google Scholar] [CrossRef]
- Garcia-Sanchez, A.J.; Garcia-Sanchez, F.; Garcia-Haro, J. Wireless sensor network deployment for integrating video-surveillance and data-monitoring in precision agriculture over distributed crops. Comput. Electron. Agric. 2011, 75, 288–303. [Google Scholar] [CrossRef]
- Mafuta, M.; Zennaro, M.; Bagula, A.; Ault, G.; Gombachika, H.; Chadza, T. Successful deployment of a wireless sensor network for precision agriculture in Malawi. Int. J. Distrib. Sens. Netw. 2013, 2013, 1–13. [Google Scholar] [CrossRef]
- Bitella, G.; Rossi, R.; Bochicchio, R.; Perniola, M.; Amato, M. A novel low-cost open-hardware platform for monitoring soil water content and multiple soil-air-vegetation parameters. Sensors 2014, 14, 19639–19659. [Google Scholar] [CrossRef] [PubMed]
- Ferrández-Pastor, F.J.; García-Chamizo, J.M.; Nieto-Hidalgo, M.; Mora-Pascual, J.; Mora-Martínez, J. Developing ubiquitous sensor network platform using Internet of Things: Application in precision agriculture. Sensors 2016, 16, 1141. [Google Scholar] [CrossRef] [PubMed]
- Payero, J.; Mirzakhani-Nafchi, A.; Khalilian, A.; Qiao, X.; Davis, R. Development of a low-cost Internet-of-Things (IoT) system for monitoring soil water potential using Watermark 200SS sensors. Adv. Internet Things 2017, 7, 71–86. [Google Scholar] [CrossRef]
- Payero, J.O.; Nafchi, A.M.; Davis, R.; Khalilian, A. An Arduino-based wireless sensor network for soil moisture monitoring using Decagon EC-5 sensors. Open J. Soil Sci. 2017, 7, 288–300. [Google Scholar] [CrossRef]
- Fisher, D.K.; Fletcher, R.S.; Anapalli, S.S.; Pringle, H.C., III. Development of an open-source cloud-connected sensor-monitoring platform. Adv. Internet Things 2018, 8, 1–11. [Google Scholar] [CrossRef]
- Hassan, A.M. Web-based irrigation management for open canals using wireless sensor networks. In Proceedings of the 2013 IEEE Conference on Wireless Sensor (ICWISE), Kuching, Malaysia, 2–4 December 2013; pp. 102–107. [Google Scholar]
- Faustine, A.; Mvuma, A.N.; Mongi, H.J.; Gabriel, M.C.; Tenge, A.J.; Kucel, S.B. Wireless sensor networks for water quality monitoring and control within Lake Victoria Basin: Prototype development. Wirel. Sens. Netw. 2014, 6, 281–290. [Google Scholar] [CrossRef]
- Anisi, M.H.; Abdul-Salaam, G.; Abdullah, A.H. A survey of wireless sensor network approaches and their energy consumption for monitoring farm fields in precision agriculture. Precis. Agric. 2015, 16, 216–238. [Google Scholar] [CrossRef]
- Ojha, T.; Misra, S.; Raghuwanshi, N.S. Wireless sensor networks for agriculture: The state-of-the-art in practice and future challenges. Comput. Electron. Agric. 2015, 118, 66–84. [Google Scholar] [CrossRef]
- Narayanan, R.P.; Sarath, T.V.; Vineeth, V.V. Survey on motes used in wireless sensor networks: Performance and parametric analysis. Wirel. Sens. Netw. 2012, 8, 51–60. [Google Scholar] [CrossRef]
- Shock, C.C.; Barnum, J.M.; Seddigh, M. Calibration of Watermark soil moisture sensors for irrigation management. In Proceedings of the International Irrigation Show, San Diego, CA, USA, 1–3 November 1998; pp. 139–146. [Google Scholar]


| Component | Part Number | Supplier | Cost ($) |
|---|---|---|---|
| Microcontroller board | Moteino with RFM95 radio | LowPowerLab | 23 |
| Batteries, holder | AA | Adafruit Industries | 4 |
| Miscellaneous (protoboard, headers, resistors, PVC) | 4 | ||
| Weatherproof enclosure | NBF-32002 | Mouser Electronics | 9 |
| Soil temperature sensor | DS18B20 | Adafruit Industries | 10 |
| Soil moisture sensors (4) | 200SS | Irrometer Company | 30 ea |
| Total | 170 |
| Component | Part Number | Supplier | Cost ($) |
|---|---|---|---|
| Microcontroller/radio board | Moteino MEGA | LowPowerLab | 32 |
| Weather sensor | BME280 | Adafruit Industries | 20 |
| MicroSD card, board | Sparkfun Electronics | 7 | |
| Clock/calendar | PCF8523 | Adafruit Industries | 5 |
| Cellular modem/antenna | FONA | Adafruit Industries | 50 |
| Solar charger | Adafruit Industries | 17 | |
| Solar panel | 7.2 V, 100 mA | Newark element14 | 8 |
| Rechargeable battery | 3.7 V LiPo, 2000 mAh | Adafruit Industries | 12 |
| Weatherproof enclosure | NBF-32002 | Mouser Electronics | 9 |
| Miscellaneous (protoboard, headers, jumper wire) | 3 | ||
| Total | 163 | ||
| SIM card, cellular data plan | 2 MB/month, 12 months | Embedded Works | 2/month |
© 2018 by the authors. Licensee MDPI, Basel, Switzerland. This article is an open access article distributed under the terms and conditions of the Creative Commons Attribution (CC BY) license (http://creativecommons.org/licenses/by/4.0/).
Share and Cite
Fisher, D.K.; Woodruff, L.K.; Anapalli, S.S.; Pinnamaneni, S.R. Open-Source Wireless Cloud-Connected Agricultural Sensor Network. J. Sens. Actuator Netw. 2018, 7, 47. https://doi.org/10.3390/jsan7040047
Fisher DK, Woodruff LK, Anapalli SS, Pinnamaneni SR. Open-Source Wireless Cloud-Connected Agricultural Sensor Network. Journal of Sensor and Actuator Networks. 2018; 7(4):47. https://doi.org/10.3390/jsan7040047
Chicago/Turabian StyleFisher, Daniel K., Lisa K. Woodruff, Saseendran S. Anapalli, and Srinavasa R. Pinnamaneni. 2018. "Open-Source Wireless Cloud-Connected Agricultural Sensor Network" Journal of Sensor and Actuator Networks 7, no. 4: 47. https://doi.org/10.3390/jsan7040047
APA StyleFisher, D. K., Woodruff, L. K., Anapalli, S. S., & Pinnamaneni, S. R. (2018). Open-Source Wireless Cloud-Connected Agricultural Sensor Network. Journal of Sensor and Actuator Networks, 7(4), 47. https://doi.org/10.3390/jsan7040047