Article

A Benchmark for Image Forgery Detection and Localization on Social Media Images

by
Md. Mehedi Rahman Rana
1,*,
Md. Anisur Rahman
1,
Kamrul Hasan Talukder
1,
Syed Md. Galib
2 and
Nazmul Siddique
3,*
1
Computer Science and Engineering Discipline, Khulna University, Khulna 9208, Bangladesh
2
Department of Computer Science and Engineering (CSE), Jashore University Science and Technology (JUST), Jashore 7408, Bangladesh
3
School of Computing, Engineering and Intelligent Systems, Ulster University, Magee Campus, Northland Road, Londonderry BT48 7JL, UK
*
Authors to whom correspondence should be addressed.
J. Sens. Actuator Netw. 2026, 15(3), 40; https://doi.org/10.3390/jsan15030040
Submission received: 17 March 2026 / Revised: 1 May 2026 / Accepted: 11 May 2026 / Published: 19 May 2026
(This article belongs to the Section Big Data, Computing and Artificial Intelligence)

Abstract

The widespread manipulation of digital images on social media has significantly undermined public trust in visual content and created major challenges for automated forgery detection. These challenges are further intensified by platform-induced degradations such as compression, resizing, and filtering, which often obscure forensic traces. This work develops FIDD-6000, a large-scale benchmark dataset for image forgery detection and localization, containing 6000 social media images, including 1000 authentic and 5000 manipulated samples, with pixel-level ground-truth masks annotated across three forgery categories, splicing, copy-move, and retouching, all created under realistic post-processing conditions. Each manipulated image is accompanied by a pixel-level ground-truth mask indicating the tampered regions. To assess the challenges posed by social media-based image manipulation, we evaluate 15 state-of-the-art image forgery localization methods on FIDD-6000, including approaches based on JPEG compression artifacts, sensor-noise analysis, and error level analysis. Experimental results show that these methods perform poorly on the proposed dataset, revealing their limited effectiveness in detecting forged images that have undergone social media-specific compression and transformation. This performance gap highlights the need for more robust and advanced machine learning and deep learning approaches capable of handling the complexity of modern image manipulations. Therefore, FIDD-6000 provides a valuable resource for researchers by offering a rigorous benchmark for developing, evaluating, and comparing next-generation forgery detection and localization methods.

1. Introduction

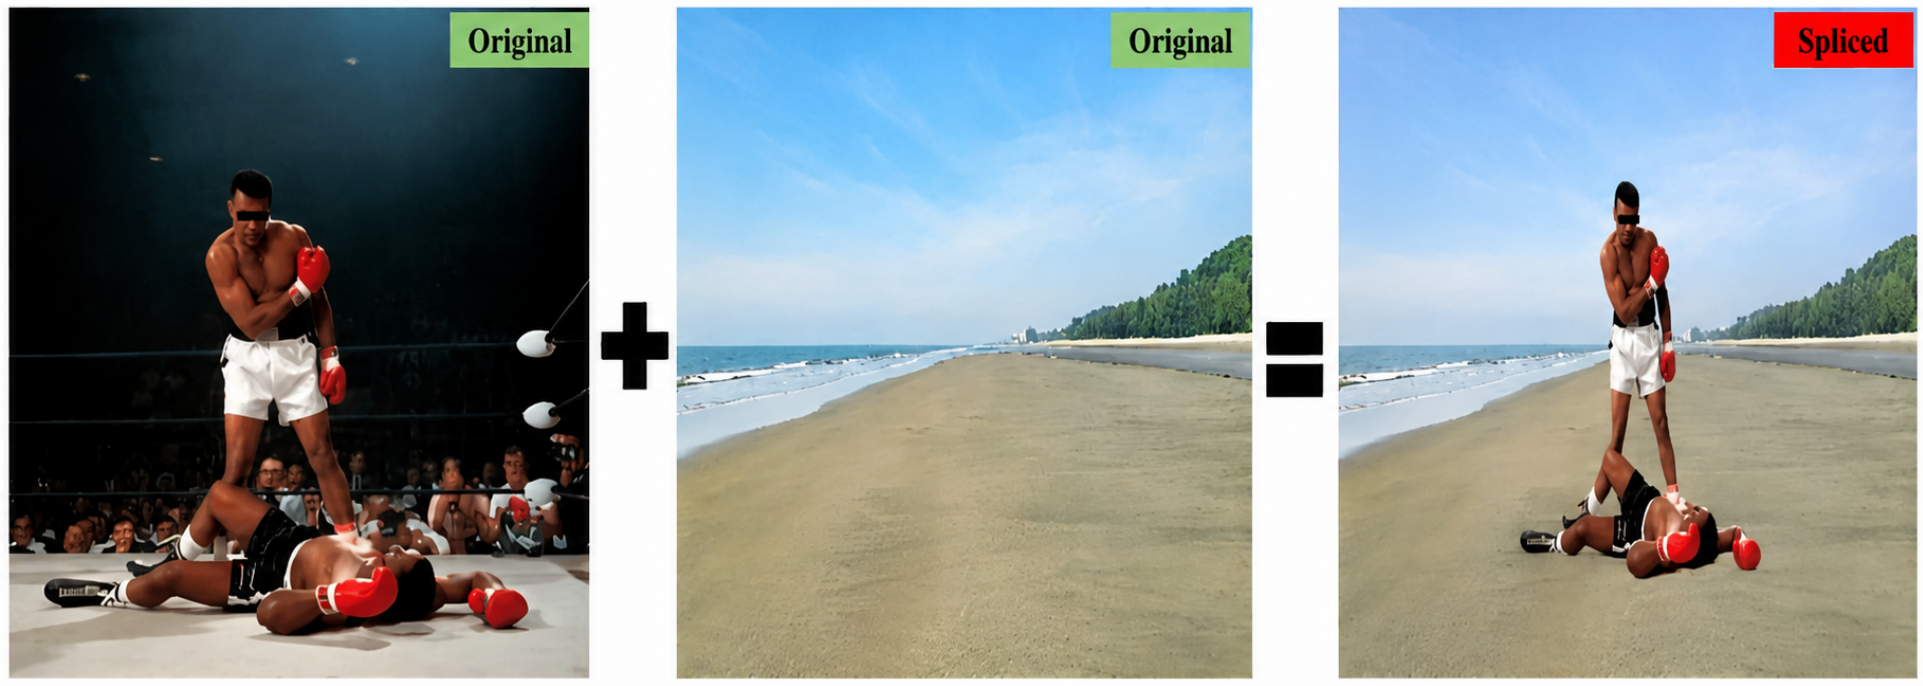
Image forgery (also known as image manipulation) refers to the deliberate alteration of a digital image with the intent to mislead, misinform, or conceal information [1]. Image manipulation is characterized by changes to the visual content of an image that alter its semantic meaning while often trying to preserve visual realism [2]. Unlike benign editing (e.g., adjusting brightness or cropping for aesthetic purposes), forgeries are created to deceive viewers, misrepresent events, or fabricate evidence. Figure 1 illustrates an instance of digital image manipulation. In this manipulated image, two original images have been merged to create a visually convincing forgery. The first image features legendary American professional boxer and social activist Muhammad Ali, captured in an athletic stance while boxing on a track. The second image depicts a natural outdoor setting of a sea beach. By replacing the original track background with the sea beach scene, the resulting forged third image gives the illusion that Muhammad Ali is boxing on the shore. In the age of rampant digital misinformation, the ability to detect manipulated images on social media has become critically important [1]. Fake images—whether spliced composites, subtly retouched photos, or duplicated-object hoaxes—can spread rapidly online, often fooling large audiences. Social networking platforms like Facebook, Twitter, and Instagram routinely apply compression or downscaling to user-uploaded images. These transformations degrade image quality and can obscure the telltale traces that forgery algorithms rely on [2]. As a result, identifying forgeries “in the wild web” (rather than in controlled datasets) is an ongoing challenge for the research community.
The motivation for this research study is to offer a more robust benchmark for evaluating forgery detection algorithms on social media images, which are often subjected to significant post-processing transformations like compression and resizing. The value of this work lies in the comprehensive nature of the dataset, which includes a wide range of manipulation types (e.g., splicing, copy-move, and retouching), pixel-level annotations, and metadata that provide crucial contextual information for advancing studies on misinformation and image manipulation detection.
Several publicly available datasets have facilitated advancements in image forgery detection research by providing standardized benchmarks for evaluation. Traditional datasets (e.g., CASIA v1.0/v2.0 [3], Columbia [4], CoMoFoD [5], and COVERAGE [2]) contain manipulated images (splicing [6] or copy-move [7] forgeries) with ground-truth masks, but these images are often high-quality and not representative of social media uploads. More recent efforts have turned to “in the wild” forgeries. For instance, web forgeries (Wild Web dataset [8]) were collected, and a large-scale evaluation of splicing localization algorithms on images with various amounts of JPEG degradation was conducted. They found that the performance of many algorithms dropped substantially in realistic web images, often below the true-positive localization rate of 20% in high-confidence settings [8] when tested on low-quality, compressed images, highlighting the difficulty of detecting forgeries in images subjected to typical social media transformations such as compression, resizing, and re-sharing. These platform-induced degradations obscure crucial forgery clues, such as compression artifacts and noise inconsistencies, which traditional methods rely on for accurate detection. This performance gap emphasizes the challenge of developing forgery detection algorithms that can maintain high accuracy in the dynamic, often distorted environment of social media and underscores the need for datasets like FIDD-6000 to address these real-world conditions. The performance gap in image forgery detection is starkly illustrated by results from the SMIFD dataset [9], where many traditional forgery detection methods showed significant performance degradation under realistic social media conditions. In response, researchers have proposed learning-based methods (e.g., convolutional neural networks like ManTra-Net [10], SPAN [11]) which often outperform hand-crafted features, especially when trained on large corpora of synthetic forgeries. However, deep models still struggle to generalize to unseen real manipulations and low-quality images [12].
Researchers have developed numerous passive image forgery detection [2] techniques (i.e., not requiring pre-embedded watermarks) that exploit intrinsic artifacts left by common editing operations. Broadly, these techniques leverage clues such as (a) JPEG compression artifacts [13]—e.g., double-compression inconsistencies or misaligned block grids introduced when spliced regions come from images with different JPEG histories; (b) color filter array (CFA) artifacts [14] from camera demosaicing—which may be disrupted in tampered regions since splicing or copy-move can break the original camera’s pixel correlation patterns; (c) sensor-noise patterns [15]—assuming that each camera sensor’s noise or local noise variance is consistent across an authentic image, but forged regions may exhibit noise-level discrepancies; (d) resampling or interpolation artifacts [16]—e.g., an inserted object that was resized or rotated leaves behind periodic correlations in the pixel grid; (e) error-level analysis (ELA) [17]—recompressing an image and examining the error residual can reveal portions that have different compression histories and others such as lighting inconsistencies or shadows (beyond the scope of this paper). Each method has had success in controlled experiments. However, their robustness on real-world social media images is limited; for example, heavy JPEG recompression [13] can confuse algorithms based on compression artifacts, and downsampling can destroy high-frequency clues from noise or CFA [14] patterns. The main objectives of this research study are as follows:
  • To develop a challenging benchmark dataset, namely, FIDD-6000, for image forgery detection and localization using social media images, which supports the development and comparison of more robust machine learning- and deep learning-based methods, particularly in light of the limited accuracy achieved by state-of-the-art classical algorithms on this dataset.
  • To evaluate the performance of existing state-of-the-art image forgery detection and localization algorithms on the proposed dataset.
The work presented herein introduces several important contributions to the domain of digital image forgery detection and localization, particularly in the context of social media images. These contributions address both the lack of realistic benchmark datasets and the limited robustness of existing forgery detection techniques under platform-induced transformations such as recompression, resizing, and filtering. In addition to providing a new benchmark resource, this research study offers a systematic evaluation of widely used classical forgery localization algorithms, thereby revealing their practical limitations under real-world conditions. Through this combined dataset and benchmarking effort, this study establishes a stronger foundation for future research aimed at developing more reliable machine learning- and deep learning-based image forgery detection methods.
  • Dataset: We developed FIDD-6000, a large-scale dataset of 6000 social media-sourced images with pixel-level annotations, manipulation motives, and binary masks for splicing, copy-move, inpainting, and retouching. As an enhanced and extended version of our previous work, FIDD-1500 [18], this dataset addresses the pressing need for forgery benchmarks that capture social media recompression and transformation effects while also identifying the blind spots of current techniques and establishing FIDD-6000 as a critical benchmark for future research, with practical guidance for combining classical algorithms or integrating them with deep learning approaches to improve robustness.
  • Benchmarking: We conduct a comprehensive evaluation of 15 widely cited image forgery localization algorithms (non-aligned double quantization (NADQ) [8], aligned double quantization variants (ADQ1–3) [13], two color filter array (CFA1–2) [14], two local noise analysis techniques (NOI and NVI) [15], Resampling Detection [16], error-level analysis (ELA) [17], block artifact grid (BAG) [19], content-aware grid inconsistency (CAGI) [20], discrete cosine transform (DCT) [21], ghost (GHO) [18] and JPEG Ghosts [18]). All algorithms are implemented in MATLAB under standardized conditions, and their outputs are compared quantitatively and qualitatively.
  • Performance Insights: We report detailed results across metrics including true-positive rate (TPR), false-positive rate (FPR), and accuracy, showing that the highest TPR achieved was 83.34% (by ADQ1 [13]), while other methods struggled under platform-induced transformations.
The structure of this paper is outlined as follows: Section 2 surveys the related works, providing an overview of existing image forgery detection datasets and algorithms, and situates FIDD-6000 within this landscape. Section 3 presents the problem statement of this research study. Section 4 describes the research methodology, including the construction of the FIDD-6000 dataset, the details of the fifteen benchmarked forgery algorithms, and the experimental protocol. Section 5 analyzes the results, discussing the implications of our findings and evaluating the strengths and limitations of current approaches. Section 6 outlines prospective directions for future research. Finally, Section 7 concludes this study by summarizing the contributions and underscoring the significance of FIDD-6000 in advancing resilient and generalizable image forgery detection.

2. Background and Related Works

The widespread use of digital imaging devices and social media platforms has greatly increased the creation and circulation of images. While this has enhanced communication and information sharing, it has also facilitated image forgery, in which digital images are intentionally manipulated to deceive or misrepresent reality [2]. Such manipulations have been used in political misinformation, journalism, and legal disputes, making reliable forgery detection an important research challenge [22].

2.1. Background of Image Forgery Detection

Image forgery detection methods are generally categorized into active and passive (blind) approaches [1]. Active methods embed authentication information, such as digital watermarks or cryptographic signatures, at the time of image capture for later verification [23]. Although effective, these methods are impractical for large-scale online use because they require specialized hardware and are vulnerable to common operations such as recompression [23]. In contrast, passive methods analyze intrinsic inconsistencies in the image itself [24], including JPEG/compression artifacts [13,19], camera and scene inconsistencies such as CFA [14] and PRNU [25], frequency-domain anomalies [21], and geometric resampling traces [15,16]. These methods are broadly applicable, but their performance often degrades under social media-induced transformations such as recompression, resizing, and filtering [24].
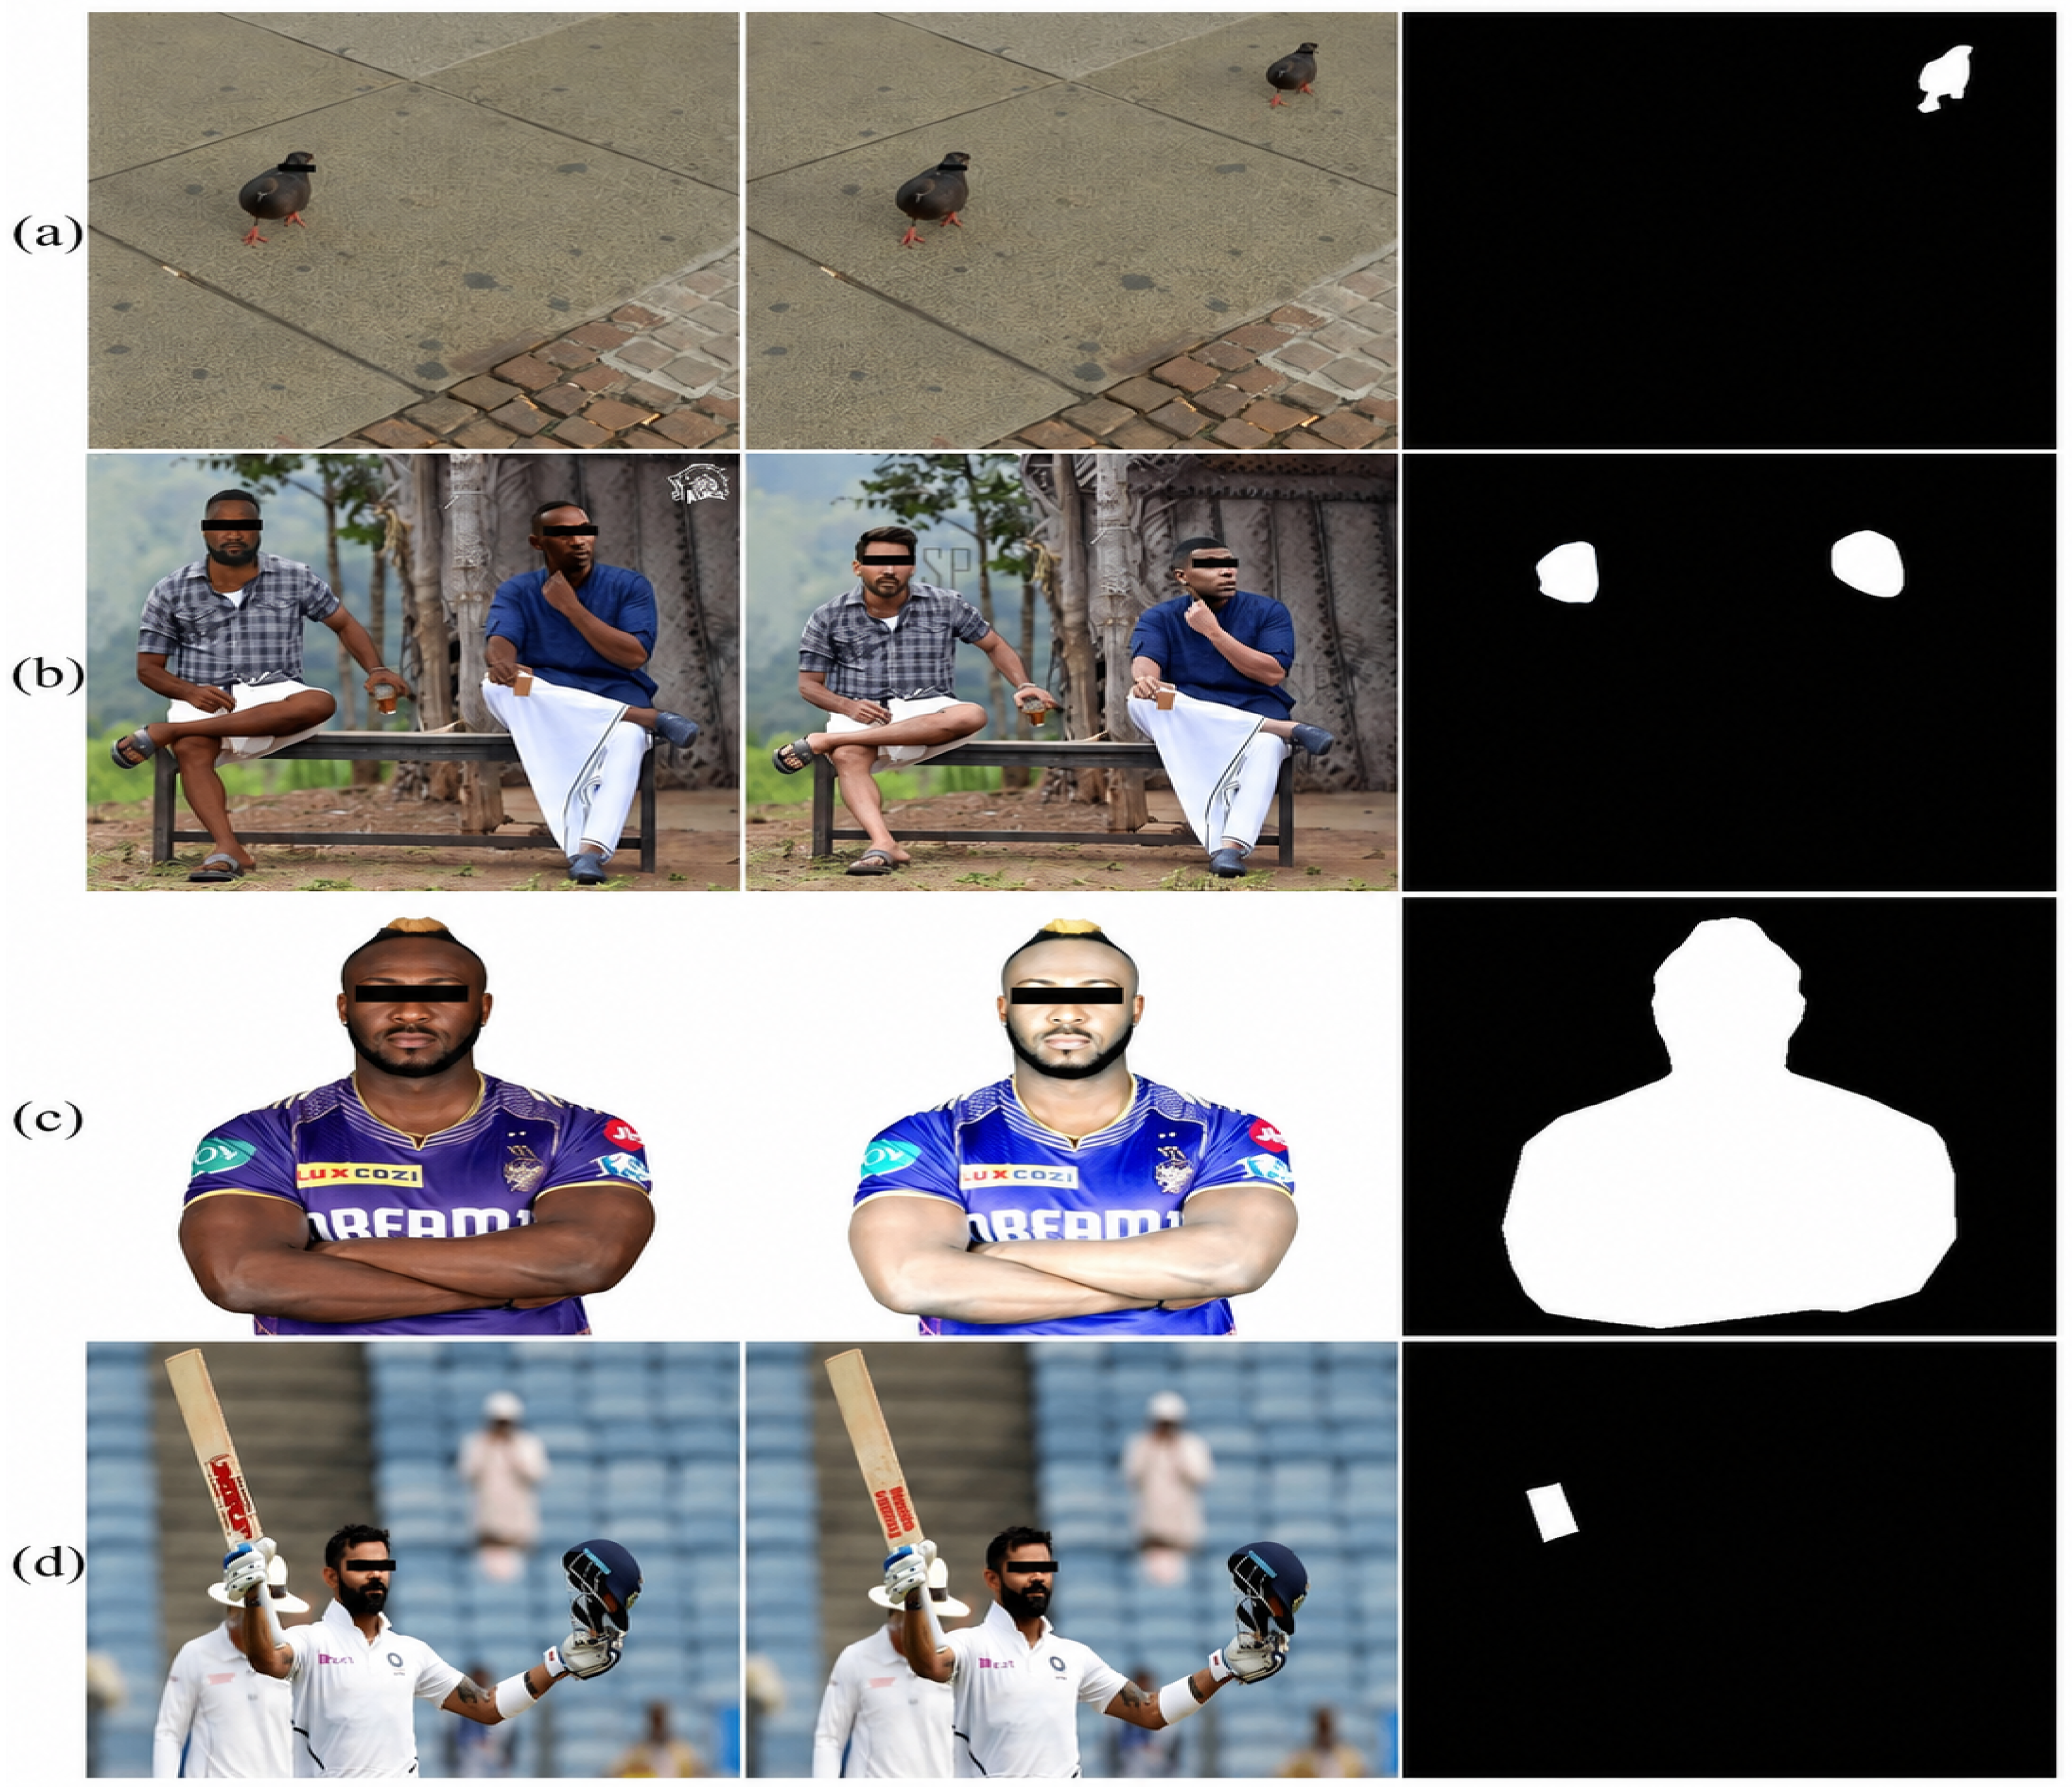
Image forgery includes several manipulation types [24]. Splicing [6] combines content from different images and often introduces compression or noise inconsistencies. Copy-move [7,26] duplicates regions within the same image to hide or replicate objects, while retouching [27] modifies image content without inserting external regions. Other manipulations include resampling [24], inpainting [27,28], morphing and face-swapping [23], and AI-generated forgeries or deepfakes [29]. Figure 2 shows representative examples from FIDD-6000. These manipulations affect pixel statistics, frequency content, sensor traces, and perceptual cues in different ways [30].

2.2. Image Forgery Datasets

Over the past two decades, many datasets have been introduced for image forgery detection. They differ in scale, image quality, manipulation type, annotation level, and realism. Early datasets were relatively small and focused on simple manipulations, whereas later datasets expanded to include splicing, copy-move, retouching, inpainting, and deepfakes [31,32]. These differences directly affect the evaluation and generalizability of forgery detection methods [33,34].

2.2.1. CASIA v1.0 and CASIA v2.0 [3]

CASIA v1.0 [3] was among the earliest large-scale benchmarks and contains about 800 images, including 100 authentic and 700 manipulated samples, mainly splicing forgeries. However, its grayscale format, low resolution, and limited diversity reduce its relevance to modern forgery analysis. CASIA v2.0 [3] significantly expanded this benchmark to 12,614 images with higher-resolution color images and more diverse manipulation types. Despite its popularity, many manipulations remain visually simple, and its extensive use has raised concerns about overfitting and dataset bias.

2.2.2. Columbia Datasets [4]

The Columbia Uncompressed Image Splicing Detection Dataset [4] is an early benchmark containing high-resolution TIFF images for splicing detection. Its color format makes it useful for analyzing color inconsistencies, but its limited scale and exclusive focus on splicing reduce its applicability [35]. The Columbia Color and Columbia Gray datasets [4] further support splicing localization by providing pixel-level masks. However, they remain small, focus only on splicing, and do not reflect realistic post-processing or social media transformations.

2.2.3. MICC and Coverage  [2,36]

The MICC datasets [36] are widely used for copy-move forgery detection. MICC-F220, MICC-F600, and MICC-F2000 vary in scale and complexity, but all focus exclusively on copy-move manipulation. Similarly, the Coverage dataset [2] provides pixel-level annotations and more challenging duplicated regions with geometric transformations. Although these datasets are valuable for benchmarking copy-move detection, their restricted scope and lack of social media-style post-processing limit their usefulness in practical scenarios.

2.2.4. NIST16 and CoMoFoD [5,37]

NIST16 [37], introduced under the NIST Media Forensics program, includes realistic high-resolution manipulations such as splicing, copy-move, and inpainting, along with pixel-level masks. It is more diverse than earlier datasets, but its relatively small size and laboratory-generated manipulations make it less representative of modern social media conditions. CoMoFoD [5] is one of the largest copy-move datasets and includes various post-processing operations and binary masks. However, it remains restricted to copy-move forgeries and does not fully capture real-world online image transformations.

2.2.5. Wild Web and IMD2020 [38,39]

Wild Web [39] is a realistic benchmark composed of forged images collected directly from web and social media sources. Its major strength is realism under uncontrolled conditions, but it contains no authentic images, making false-positive evaluation difficult. IMD2020 [38] includes real-life manipulated images paired with authentic counterparts and masks, along with additional synthetic and real images for sensor-noise analysis. Although valuable, its synthetic subsets often exhibit more uniform processing patterns than real social media content.

2.2.6. Deepfake Datasets: Celeb DF and DFDC [40,41]

Celeb DF [40] and DFDC [41] are major deepfake benchmarks. Both are video datasets, though still frames can be extracted for image-level analysis. Celeb DF offers improved visual realism but is limited by celebrity-domain bias, whereas DFDC provides large-scale demographic diversity but is computationally demanding and primarily focused on face-swapping manipulations.

2.2.7. AbhAs and SMIFD [9,42]

AbhAs [42] was developed as a realistic splicing benchmark using both camera-captured and internet images, but it remains limited in scale and manipulation diversity [28]. SMIFD 1000 [9] is more directly relevant to social media forgery detection because it contains images collected from social platforms and provides rich annotations, including pixel-level masks and manipulation metadata. However, its relatively small size still limits its usefulness for large-scale benchmarking and deep learning.
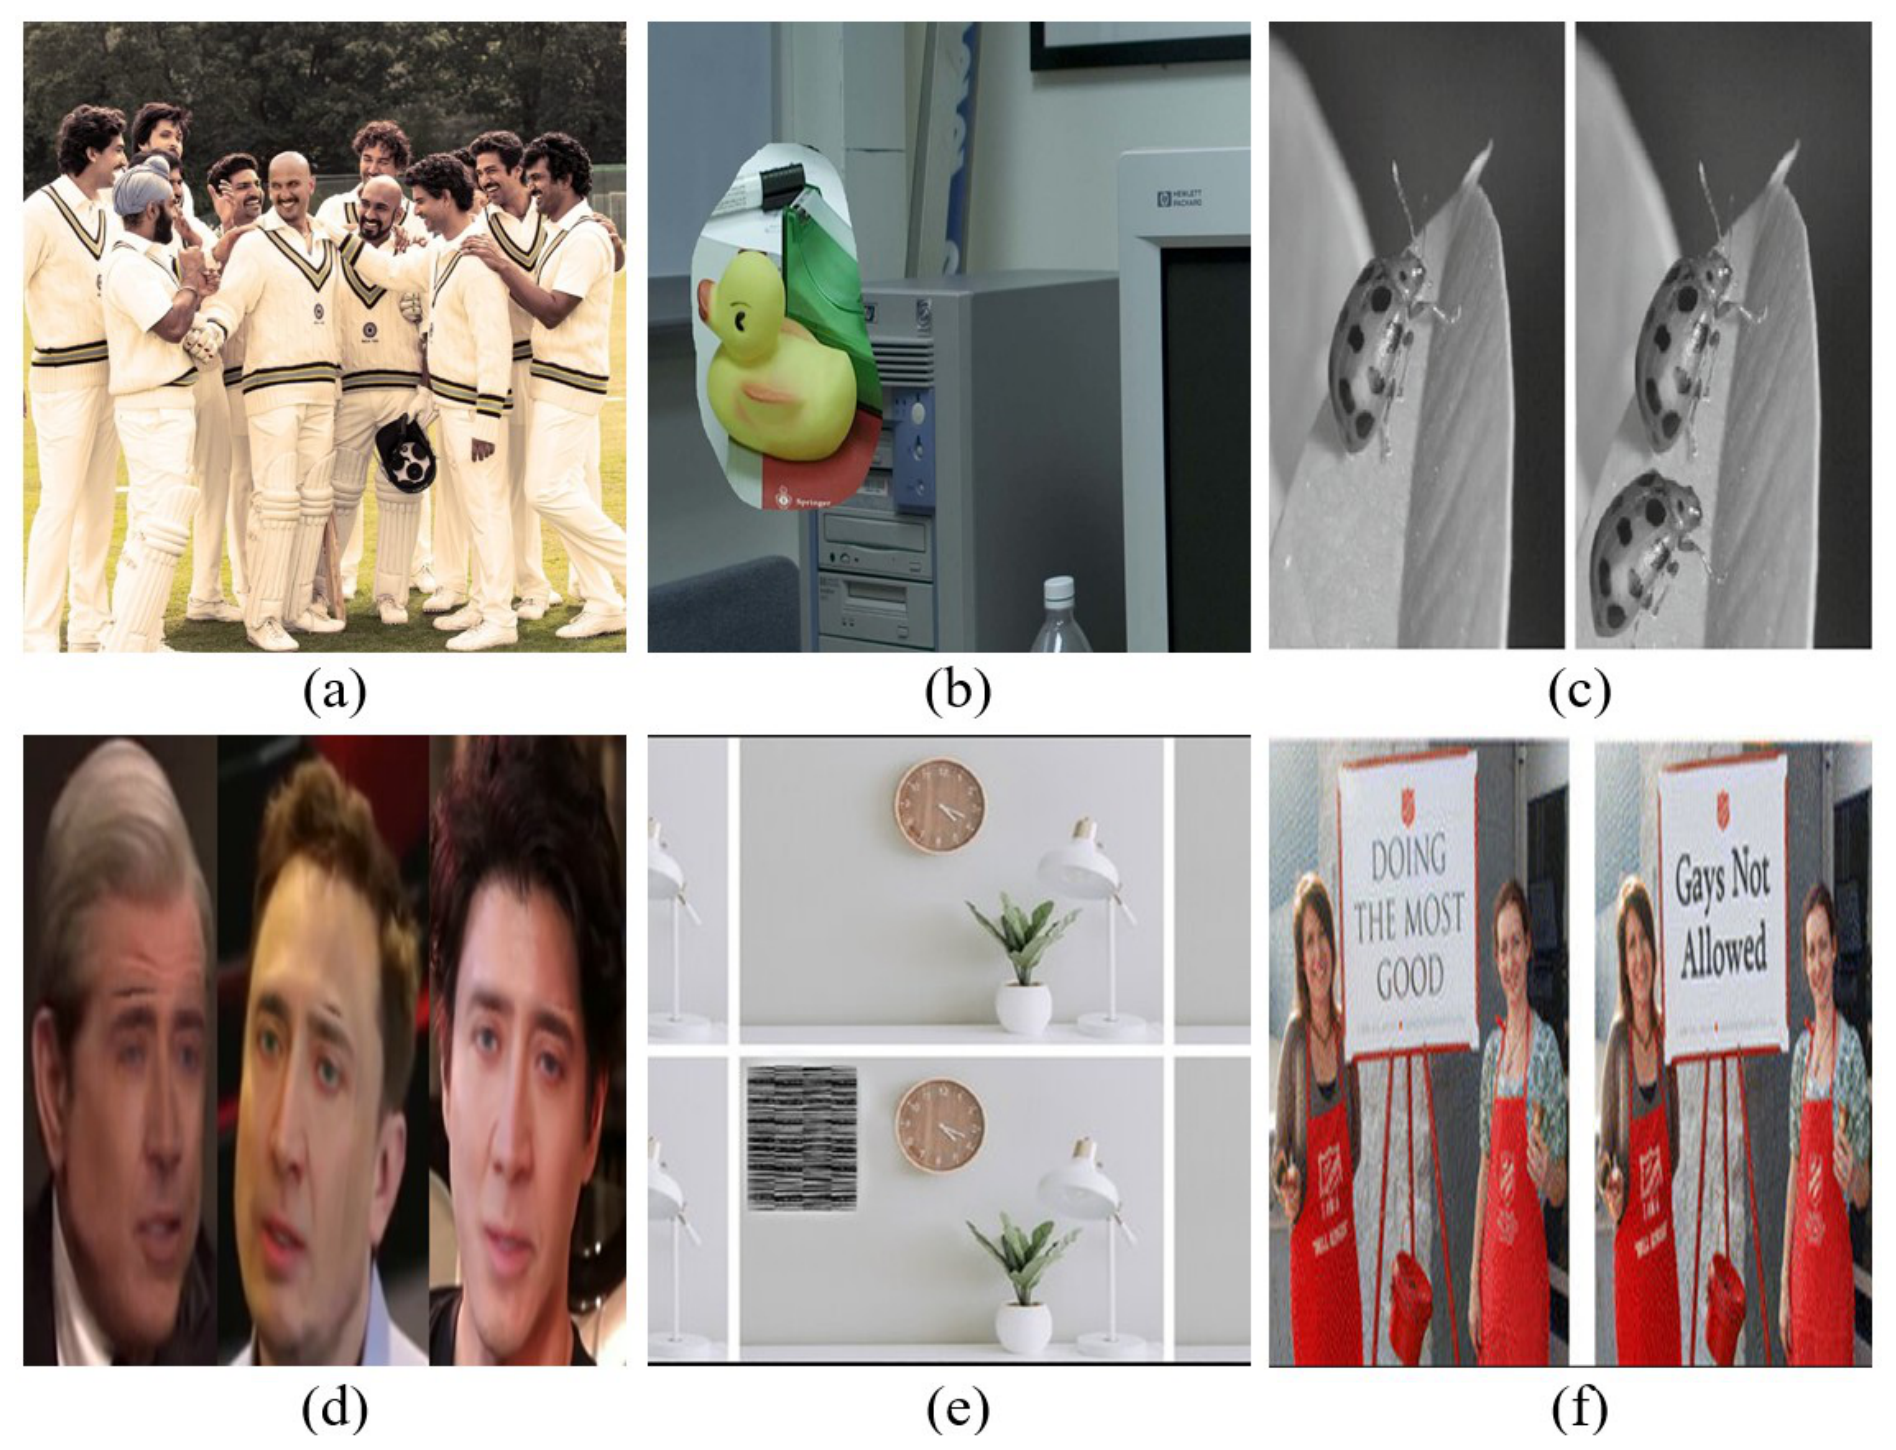
Figure 3 shows examples from representative datasets. Table 1 presents a comparison of different image manipulation datasets in terms of their release year, tampering types, image characteristics, realism, annotation availability, and major limitations. Overall, existing benchmarks have advanced the field significantly, but no single dataset sufficiently combines large scale, diverse manipulation types, pixel-level ground truth, and realistic social media transformations. This gap motivates the development of FIDD-6000.

2.3. Forgery Localization Algorithms

Forgery localization algorithms attempt not only to classify an image as authentic or manipulated but also to identify the tampered region. Classical passive approaches remain important because they are interpretable, training-independent, and suitable for benchmarking.
JPEG-based methods are among the most widely used. Early work exploited block artifact inconsistencies [6], while later methods focused on double JPEG compression [13]. Aligned compression produces periodic patterns in DCT histograms [21], whereas non-aligned compression creates block-grid inconsistencies [13]. These cues form the basis of detectors such as ADQ and related variants [8,13,19]. JPEG Ghosts [18] further detects tampered regions by recompressing an image at multiple quality levels and analyzing residual differences [37]. These methods can be effective when manipulated regions have distinct compression histories, but they often fail after uniform recompression, which is common on social media.
CFA-based methods analyze demosaicing artifacts introduced by the camera imaging pipeline [31,43]. Since spliced regions may disrupt these regular patterns, CFA inconsistencies can reveal tampering [14]. Such methods are useful for multi-camera splicing, but their performance degrades when source and target regions share similar CFA characteristics or when post-processing obscures the signal.
Noise-based methods [44] assume that authentic images exhibit relatively consistent sensor noise, while manipulated regions may show anomalous local noise patterns. Techniques based on variance estimation and wavelet-domain statistics have been used to reveal splicing and copy-move operations [45]. However, compression and resampling often suppress these cues, and textured regions can produce false positives.
CAGI [20] extends block artifact analysis by detecting JPEG grid inconsistencies while reducing confusion from natural image content, improving over BAG [19]. Nevertheless, it still depends on sufficiently strong grid anomalies and becomes less reliable when social media platforms apply uniform recompression.
Resampling-based methods [46] detect geometric manipulations such as scaling and rotation by exploiting interpolation artifacts [45]. These methods are useful when forgeries involve geometric transformation, but their effectiveness decreases after compression or platform-level resizing, which can obscure or globalize the resampling traces [33,34].
Radial Basis Function (RBF) [47,48] interpolation is a potential tool for detecting resampling artifacts in image forensics. While we did not implement RBF interpolation in this study, we recognize its theoretical relevance. RBF interpolation could serve as a principled model for simulating resampling operations or as a tool to detect inconsistencies by fitting local RBF models to pixel neighborhoods and comparing them to observed pixel values after resizing. Although we focused on conventional methods in this benchmark, RBF interpolation may suppress detectable interpolation periodicities, especially under social media compression, which could complicate the detection of resampling artifacts. This characteristic highlights the potential for future research to explore RBF interpolation in forgery detection, offering a promising alternative approach to current techniques.
Error-level analysis (ELA) [17] is a heuristic approach that recompresses an image and visualizes the difference between the original and recompressed versions [49]. It is popular because it is simple and provides intuitive visual cues [49,50]. However, ELA is not statistically rigorous, is highly sensitive to edges and textures, and performs poorly after uniform recompression. In addition, concerns remain regarding its reproducibility and formal validation [26,50,51].
This review focuses on classical algorithms because they provide transparent, interpretable, and reproducible baselines that allow us to clearly understand the inherent challenges of forgery localization on the FIDD-6000 dataset. Unlike deep learning methods [1,52], which rely heavily on a large number of labeled training data and complex model architectures, classical algorithms do not depend on training data distributions. This makes them particularly useful for identifying and analyzing the specific challenges posed by social media-based image transformations, such as compression, resizing, and other distortions, which can obscure forensic features and complicate forgery detection. Table 2 compares the classical image forgery localization algorithms evaluated in this study in terms of their underlying principles, strengths, and weaknesses.
In summary, classical passive forgery localization algorithms remain useful baselines, but their performance declines markedly on web and social media images because compression, resizing, and stylistic post-processing often suppress the forensic traces on which they rely [13,14,44]. Although deep learning approaches have shown promising results on datasets such as CASIA [3] and NIST16 [37], they also face challenges in generalizing to social media-specific artifacts. Therefore, FIDD-6000 addresses an important gap by providing a large-scale, social media-derived benchmark for developing and evaluating more robust forgery detection and localization methods.

3. Research Problem Formulation

This research study addresses the problem of image forgery detection and localization in social media-transformed images. Although many existing forensic methods perform well on benchmark datasets, their performance degrades significantly when images are shared through social media platforms. This is because platform-specific operations, such as compression, resizing, filtering, and format conversion, suppress or distort the forensic traces required for reliable tampering analysis.
Let an original image be denoted by
I R H × W × C ,
where H, W, and C represent the image height, width, and number of channels, respectively. Each image in the dataset is categorized into one of two classes:
y { 0 , 1 } ,
where y = 0 indicates an authentic image (i.e., an image that has not been altered in any way) and y = 1 indicates a manipulated image (i.e., an image that has undergone some form of tampering, such as splicing, copy-move, or retouching).
For manipulated images, the tampered region is represented by a pixel-level binary mask:
M { 0 , 1 } H × W ,
where each element M ( i , j ) of the mask is defined as:
M ( i , j ) = 1 , if pixel ( i , j ) belongs to a tampered region , 0 , otherwise .
For authentic images (those that have not been manipulated), M = 0 , indicating that no tampered region exists.
Since the images are processed by social media platforms before they are analyzed, the available input is not original image I, but the transformed image:
I s = T ( I ) ,
where T ( · ) denotes the social media transformation operator. This operator models the various platform-induced operations that typically alter the image when it is uploaded to social media. These operations include recompression (where image quality is reduced for faster loading times), resizing (to fit the image within platform-specific dimensions or aspect ratios), and filtering (applying artistic effects or noise reduction). These transformations, which are often applied automatically and without user intervention, can significantly distort or eliminate the statistical, frequency-domain, and sensor-level traces that traditional forgery detection methods typically rely on. As a result, detecting forgeries in images that have undergone such social media processing becomes a more challenging task.
Let the dataset be defined as
D = ( I n s , y n , M n ) n = 1 N ,
where N is the total number of images, I n s is the n-th social media-transformed image, y n is its image-level label, and M n is its corresponding ground-truth mask.
The research problem consists of two coupled tasks:
  • Forgery Detection: Determine whether a given image I s is authentic or manipulated;
  • Forgery Localization: If manipulated, identify the forged pixels or regions.
Formally, the detection task can be expressed as learning a mapping
f θ : R H × W × C [ 0 , 1 ] ,
where θ denotes the model or algorithm parameters, and
y ^ = f θ ( I s )
is the predicted probability that the image is manipulated. The final predicted label is obtained by thresholding:
y ˜ = 1 , if y ^ τ , 0 , otherwise ,
where τ [ 0 , 1 ] is the decision threshold.
Similarly, the localization task is defined as learning a mapping
g ϕ : R H × W × C [ 0 , 1 ] H × W ,
where ϕ denotes the localization parameters and
M ^ = g ϕ ( I s )
is the predicted tampering probability map. The binary localization result is then given by
M ˜ ( i , j ) = 1 , if M ^ ( i , j ) δ , 0 , otherwise ,
where δ [ 0 , 1 ] is the pixel-level threshold.
Therefore, the overall forgery analysis problem is to estimate a function
F : I s ( y ˜ , M ˜ ) ,
such that the predicted image-level label y ˜ and pixel-level mask M ˜ are as close as possible to the ground-truth label y and mask M.
The corresponding empirical optimization objective can be written as
L = λ 1 L det + λ 2 L loc ,
where
L det = 1 N n = 1 N l det ( y n , y ^ n ) ,
and
L loc = 1 N n = 1 N l loc ( M n , M ^ n ) .
Here, L det is the image-level detection loss, L loc is the pixel-level localization loss, l det ( · , · ) denotes a classification loss function, l loc ( · , · ) denotes a localization loss function, and λ 1 , λ 2 0 control their relative importance.
Since this research study also benchmarks existing algorithms on the proposed dataset, the evaluation problem can be formulated as follows. Let
A = { A 1 , A 2 , , A K }
be the set of K evaluated forgery detection and localization algorithms. The goal is to assess each algorithm on D and determine the best-performing algorithm,
A * = arg max A k A P ( A k ; D ) ,
where P ( A k ; D ) denotes the overall performance of algorithm A k on dataset D , measured using metrics such as TPR, FPR, precision, F1-score, MCC, and IoU. Here, A * represents the algorithm that achieves the best overall performance on the proposed dataset according to the selected evaluation criteria.
For each image I n D , the ground-truth class label is defined as
y n { 0 , 1 } ,
where
y n = 0 , if I n is an authentic ( original ) image , 1 , if I n is a manipulated ( fake ) image .
Let M n ( x , y ) be the output map generated by an algorithm for image I n . To identify whether the image is fake or original, the maximum anomaly score is first computed as
s ( I n ) = max ( x , y ) M n ( x , y ) .
Here, s ( I n ) denotes the image-level anomaly score of the n-th image, defined as the maximum response value in the output map. It represents the strongest forgery evidence detected anywhere in the image and is therefore used as a single scalar score for image-level classification. Then, using a decision threshold T, the predicted image-level label is obtained as
y ^ n = 1 , if s ( I n ) > T ( predicted as fake ) , 0 , if s ( I n ) T ( predicted as original ) .
Thus, an image is identified as fake when the maximum response of the forgery map exceeds the threshold, indicating the presence of suspicious manipulated regions; otherwise, it is identified as original. The predicted label y ^ n is then compared with the ground-truth label y n to compute the evaluation metrics and determine the overall performance of each algorithm.
For localization, one common evaluation metric is Intersection over Union (IoU), defined as [35,53]
IoU ( M , M ˜ ) = | M M ˜ | | M M ˜ |
where M denotes the ground-truth manipulated region, M ˜ denotes the predicted manipulated region, and | · | represents the cardinality of pixels in the corresponding set.
Thus, the research problem can be stated formally as follows:
Given a social media-transformed image I s = T ( I ) , determine whether it is authentic or manipulated and, if manipulated, estimate a binary tampering mask M ˜ such that both the image-level prediction and the pixel-level localization remain accurate despite the degradation of forensic traces caused by social media transformations.
This formulation directly motivates the development of FIDD-6000, since existing datasets do not adequately represent the degradation patterns introduced by social media platforms, and many current methods are not robust under such realistic conditions.

4. Methodology

The methodology consists of two main components such as dataset development and dataset evaluation.

4.1. Dataset Development

The dataset development stage focuses on constructing FIDD-6000 through a systematic process of image collection, pre-processing, manipulation annotation, mask generation, verification, and quality control. This stage is designed to ensure that the dataset accurately represents real-world social media image manipulations while maintaining reliable pixel-level ground-truth information. By incorporating authentic and manipulated images collected under realistic platform-induced transformations, the dataset development process establishes a strong and practical foundation for subsequent benchmarking and analysis.
The development of FIDD-6000 follows a structured pipeline that transforms raw social media images into a verified and labeled benchmark dataset. Let the set of image sources be denoted by
S = { Instagram , Facebook , WhatsApp , X , Reddit , TikTok } .
If I s represents the set of images collected from source s S , then the complete raw image set is
I r a w = s S I s .
After image gathering, each image I I r a w undergoes pre-processing through both automated and manual operations. The automated pre-processing function, P a ( · ) , includes tasks such as resizing, normalization, and format standardization to prepare the images for analysis. The manual pre-processing function, P m ( · ) , involves tasks such as image cropping, annotating specific regions of interest, and correcting distortions caused by image acquisition or prior transformations. The processed image is then expressed as
I p = P m P a ( I ) .
Thus, the set of processed images is
I p = { I p | I I r a w } .
For each processed image I p , the manipulation region is identified and converted into a binary mask
M { 0 , 1 } H × W ,
where
M ( i , j ) = 1 , if pixel ( i , j ) belongs to the manipulated region , 0 , otherwise .
The masking operation is represented by
M = B ( I p ) ,
where B ( · ) denotes the binary masking function. The processed image and the corresponding binary mask together form the ground-truth pair
G i = ( I p , M ) , i = 1 , 2 , , | I r a w | ,
where | I r a w | denotes the total number of images in the raw dataset.
Each ground-truth pair is then passed to the annotation stage. Let the three annotators be represented by
U = { u 1 , u 2 , u 3 } .
For a given image, the label assigned by annotator u r is denoted by
y ( r ) { 0 , 1 } , r = 1 , 2 , 3 ,
where 0 and 1 represent the authentic and fake classes, respectively. The preliminary final label is determined by majority voting:
y m a j = 1 , if r = 1 3 y ( r ) 2 , 0 , otherwise .
The annotation process for the FIDD-6000 dataset involves three independent annotators who label each image as authentic or fake. To ensure the reliability and consistency of the pixel-level masks, we perform inter-annotator agreement analysis using basic metrics such as Fleiss’ kappa and Intersection over Union (IoU). These results show a satisfactory level of agreement among annotators, demonstrating the consistency of the annotations. In cases of ambiguous boundaries, such as soft blends or retouching artifacts, we provide detailed guidelines to the annotators. If majority voting does not provide a clear decision, the image is referred to an expert for final verification. The dataset development process includes thorough verification of each sample and applies a quality control measure to ensure only the most reliable samples are included in the final dataset. This process guarantees that the FIDD-6000 dataset is both reliable and consistent, handling edge cases responsibly while ensuring high-quality annotations.
If majority voting is not sufficient, the sample is referred to an expert for final decision. Let the final accepted label be denoted by y. The annotated sample is therefore represented as
X = ( I p , M , y ) .
After annotation, each sample is verified through image attribute and label verification. Let the verification function be
V ( X ) = 1 , if the annotated image is verified , 0 , otherwise .
Only verified samples are retained:
X v = { X | V ( X ) = 1 } .
The final stage evaluates the quality of annotation before inclusion in the dataset. Let Q ( X ) denote the annotation quality score of sample X, and let η be the minimum acceptable quality threshold. The threshold η is defined empirically through a combination of factors designed to ensure the reliability of the annotated data. Specifically, η is determined by evaluating the consistency of annotations across multiple annotators, the accuracy of the region marked as manipulated, and the clarity of tampered regions within the image. The threshold is set to exclude samples with low inter-annotator agreement or where the labeled tampered regions are unclear or inconsistent with expected patterns of manipulation. Furthermore, image quality factors, such as resolution and clarity of the tampered regions, are also considered in setting the threshold. In practice, only those samples whose annotation quality score Q ( X ) meets or exceeds this threshold ( Q ( X ) η ) are retained in the dataset. Samples with scores below the threshold, indicating insufficient annotation reliability, are excluded to maintain the consistency and overall quality of the final dataset. Then the final FIDD-6000 dataset is defined as
D F I D D = { X X v | Q ( X ) η } .
If the number of accepted samples is N, then
| D F I D D | = N ,
where | D F I D D | | I r a w | , indicating that the final dataset is formed as a selected subset of the total raw image collection. In this research study, the size of the proposed dataset is 6000, i.e., N = 6000.
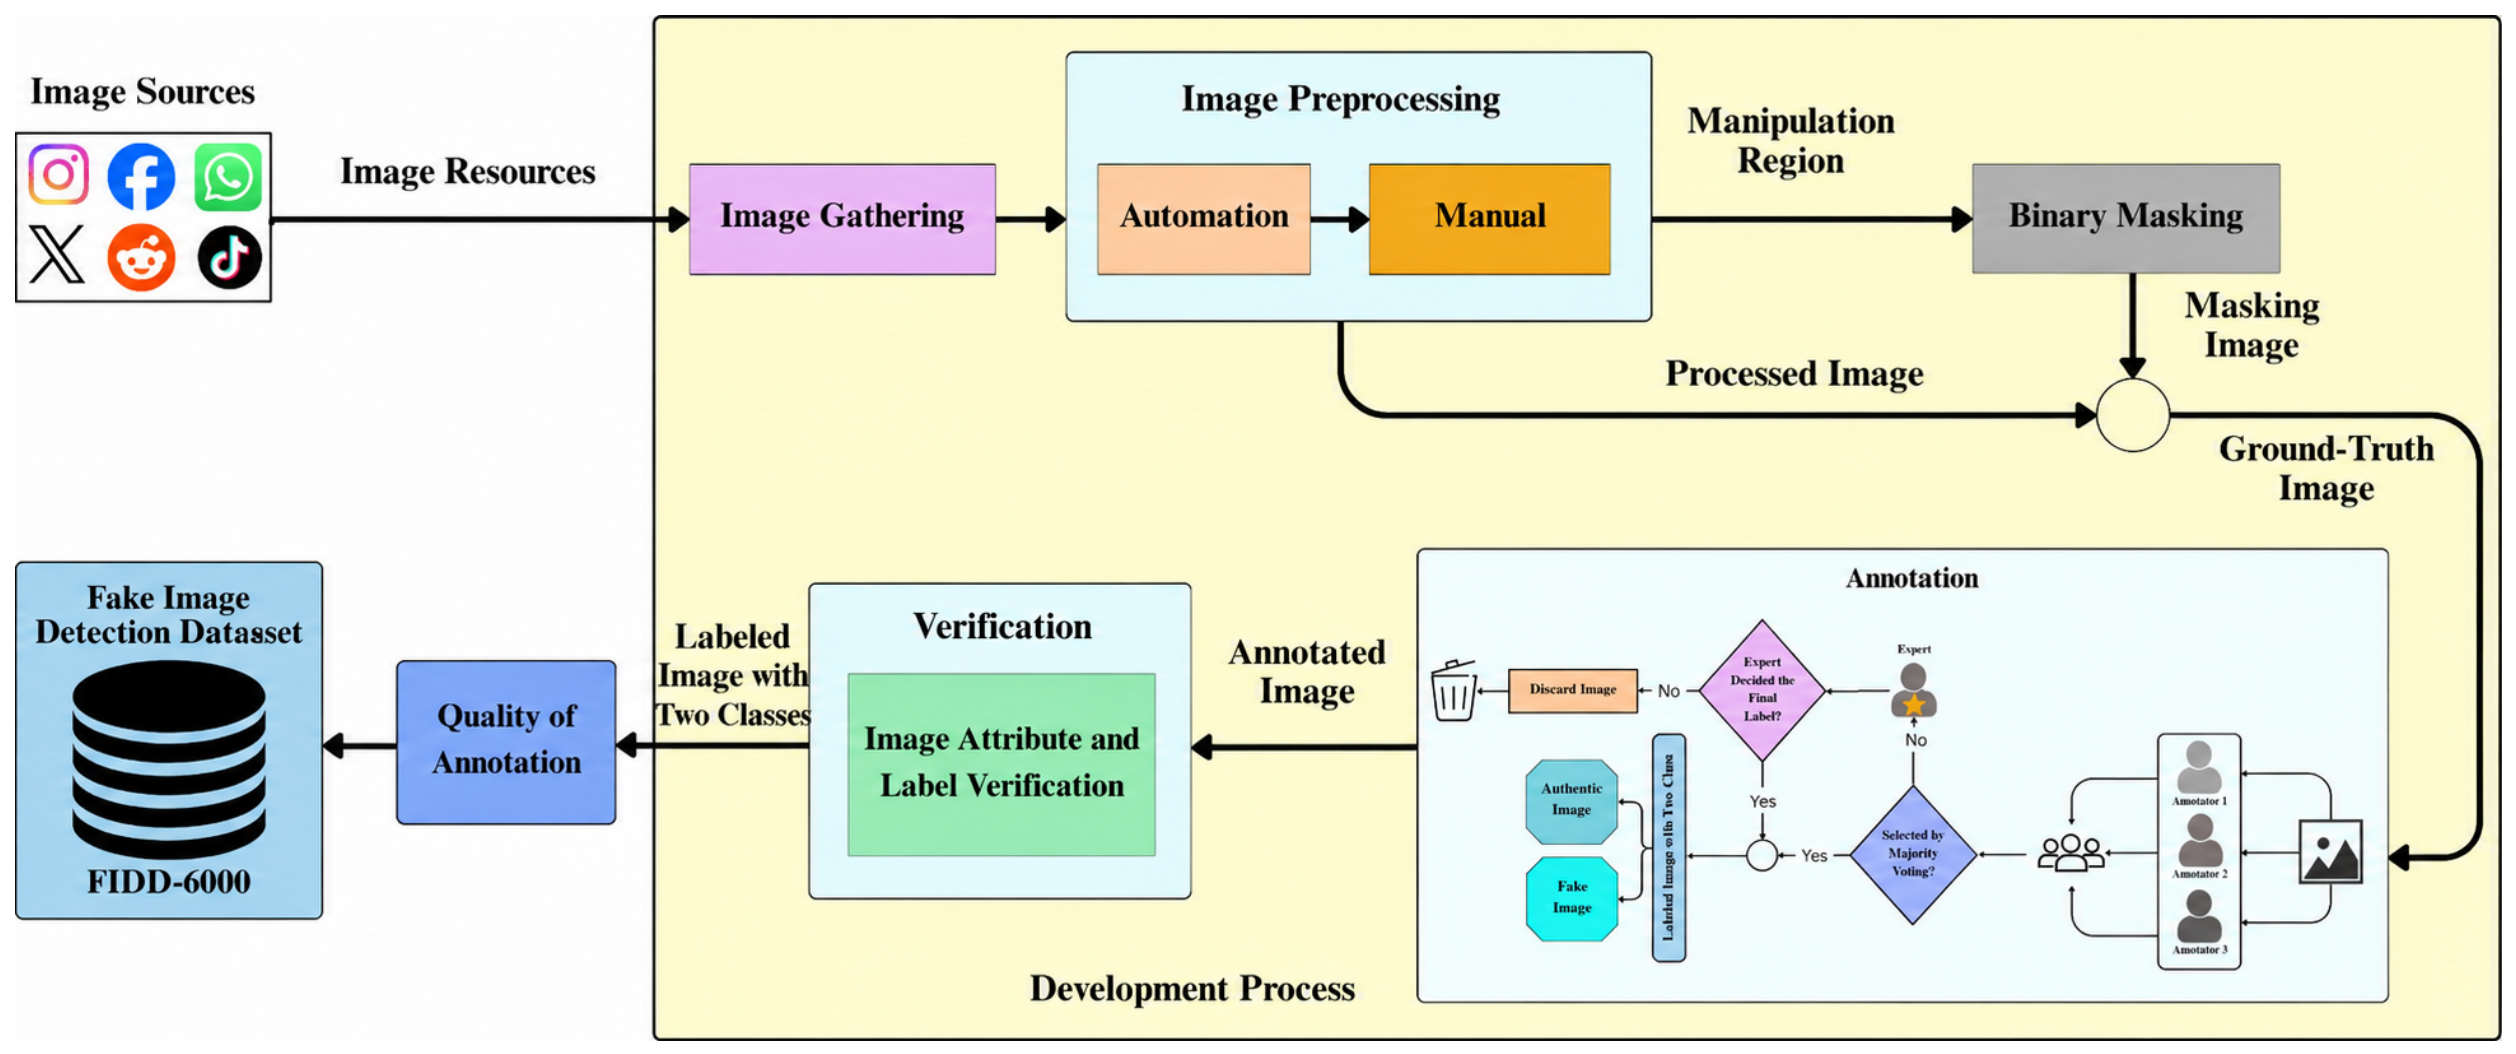
Therefore, the complete dataset development process can be summarized as
I r a w I p ( I p , M ) ( I p , M , y ) X v D F I D D ,
which corresponds to the workflow illustrated in Figure 4. This process ensures that FIDD-6000 is constructed through systematic image collection, pre-processing, binary masking, annotation, verification, and quality-controlled dataset integration.
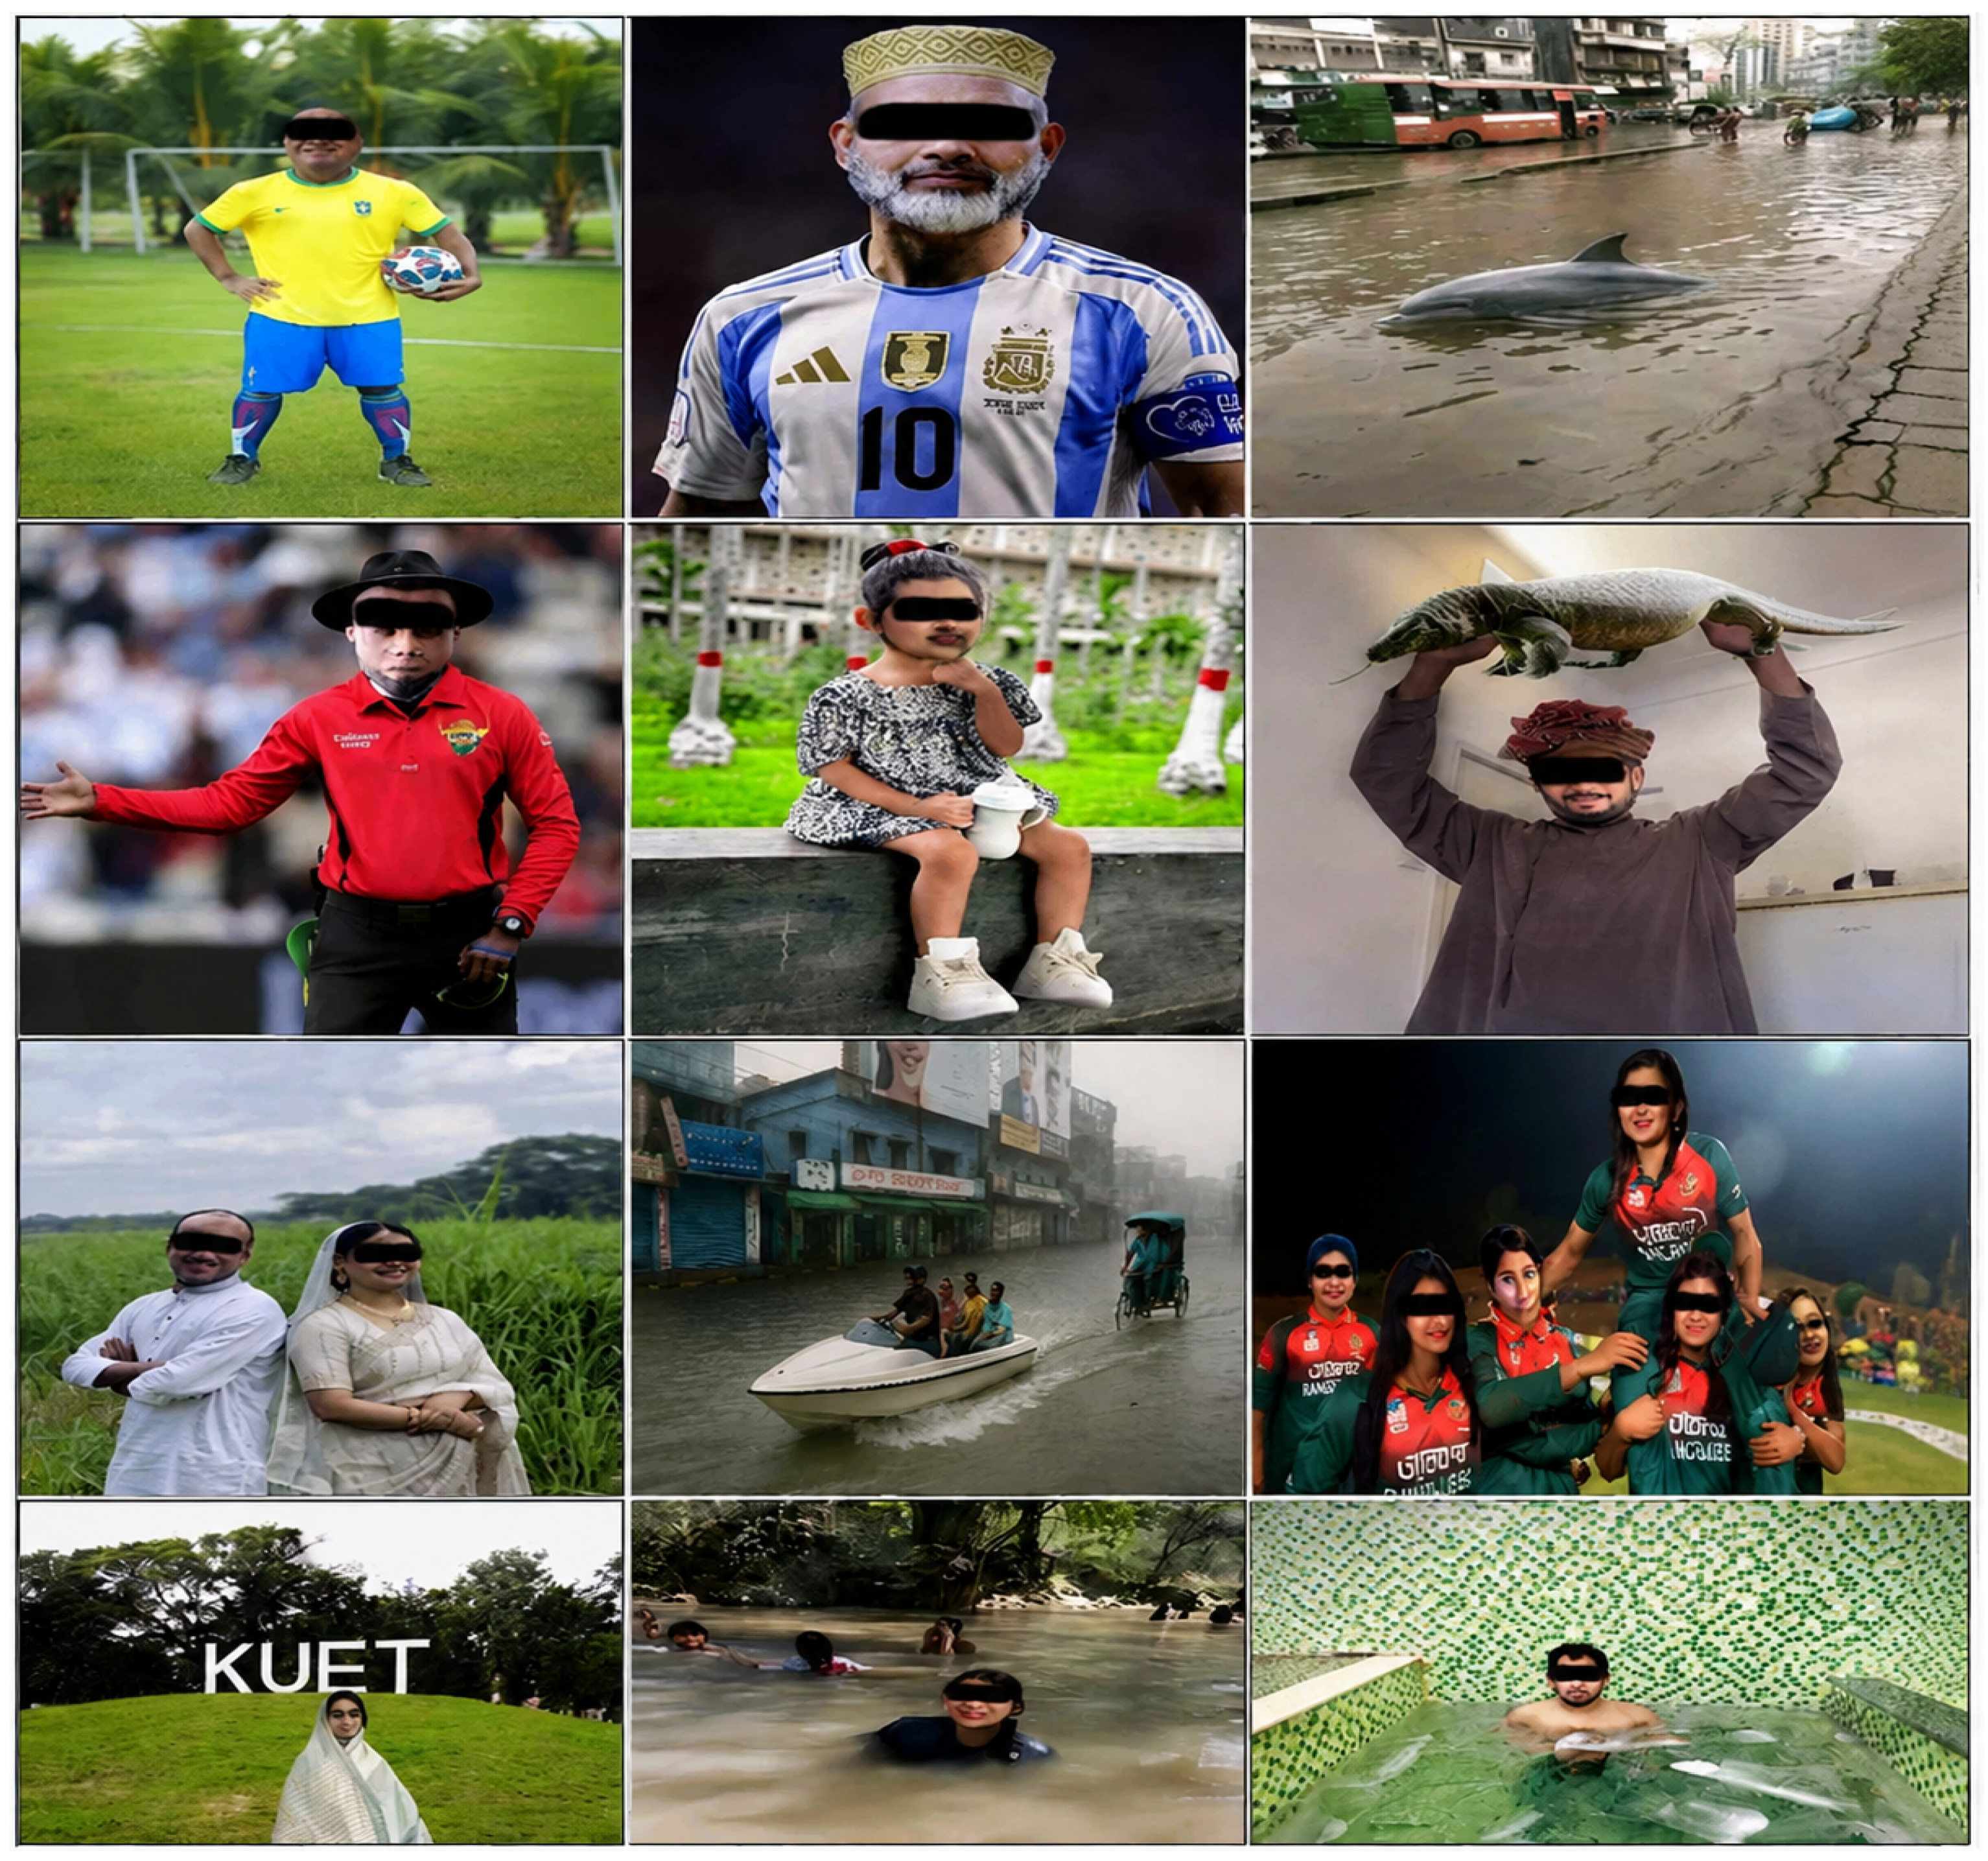
FIDD-6000’s novelty lies in its scale and realism. Compared with our previous dataset [50], which was our earlier effort with 1500 images, FIDD-6000 covers more cases and includes images gathered in 2023–2025, when image editing tools and memes had become even more sophisticated. It also contains multiple examples of popular fake image themes (e.g., natural disaster hoaxes, fake animal sightings, etc.), ensuring algorithms are tested on varied content. Figure 5 presents representative examples from the FIDD-6000 dataset. By releasing FIDD-6000 (with ground truths), we aim to provide researchers a challenging benchmark for both classical algorithms and learning-based approaches.

Descriptive Statistics of FIDD-6000

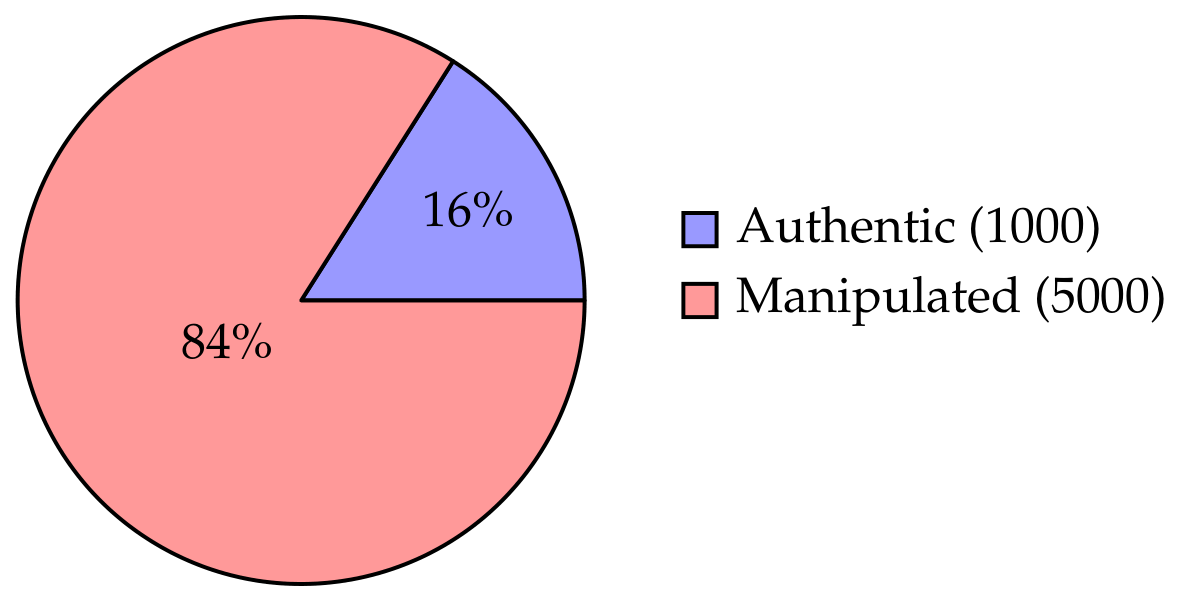
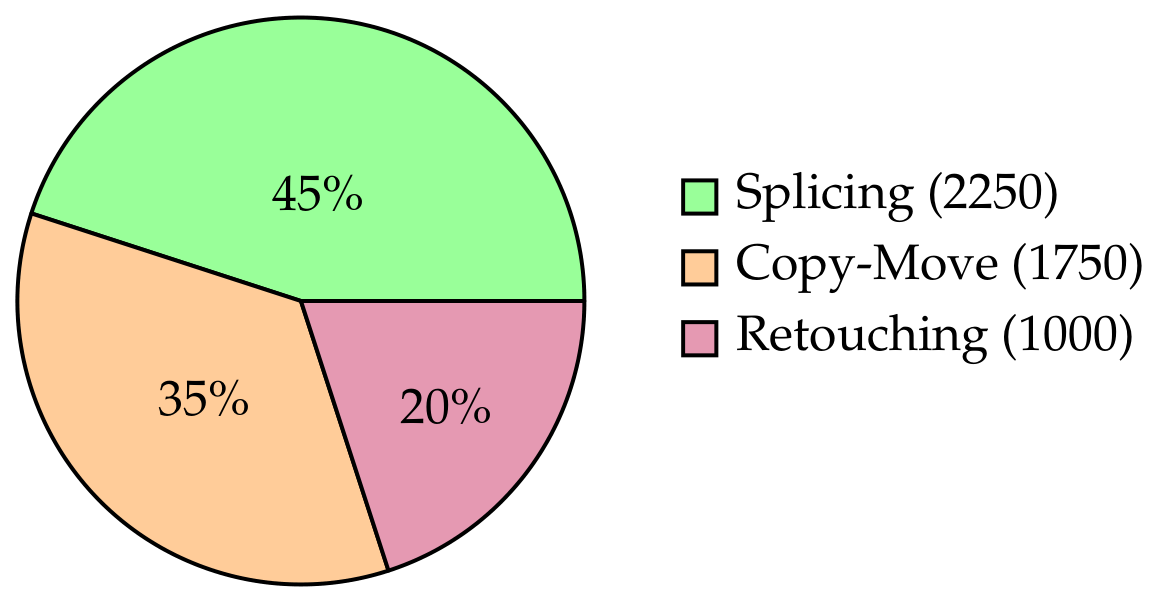
The FIDD-6000 dataset contains 6000 images, including 1000 authentic (16%) and 5000 manipulated (84%) samples, reflecting the imbalance commonly observed in real-world social media imagery. The distribution of authentic and manipulated images is shown in Figure 6. The manipulated subset includes splicing (45%), copy-move (35%), and retouching (20%), as illustrated in Figure 7. Each manipulated image is paired with a binary ground-truth mask for pixel-level evaluation. On average, splicing affects about 25% of image pixels, copy-move about 12%, and retouching about 5%, while manipulated regions overall cover roughly 15–20% of total pixels. In addition, the dataset includes pixel-level annotations, metadata, and motive labels, making FIDD-6000 a more realistic and richly annotated benchmark than earlier datasets such as CASIA [3], Columbia [4], and MICC [45]. The overall descriptive statistics are summarized in Table 3.

4.2. Benchmarking FIDD-6000 with Existing Localization Algorithms

This the second part of the Section 4. We selected 15 passive forgery detection algorithms for evaluation on FIDD-6000, focusing on well-established image manipulation localization methods that have been widely cited or used in prior benchmarks. These include the algorithms summarized in the Section 2: ADQ1-3 [13], BAG [19], NADQ [8], DCT histogram [21], CAGI [20], ELA [17], Ghost (GHO) [18], CFA1-2 [14], Resampling Detection [16], NOI [15], and NVI [15].
Where possible, we leveraged the open-source code from the authors or the community—for example, some methods were available in the MATLAB scripts from prior researchers. For consistency, however, we re-implemented all methods in MATLAB (R2022b) and verified them on known test images.

4.2.1. Experimental Setup

All experiments were carried out on a dedicated workstation configured with an Intel Core i9 CPU (3.5 GHz, 10 cores), 32 GB of RAM, and a 64-bit operating system. The evaluation of algorithms was carried out using MATLAB R2022b (MathWorks Inc., Natick, MA, USA), which provided a stable environment for implementing and testing classical image forgery techniques. To ensure fairness and reproducibility, all algorithms were executed in a single-threaded configuration, thereby avoiding the variability that can arise from parallel processing or hardware acceleration. This controlled setup guarantees that the reported performance metrics (e.g., TPR, FPR, F1-score, and processing time per image) reflect the intrinsic efficiency of each algorithm rather than hardware-specific optimizations. In addition, runtime measurements were averaged across multiple runs to mitigate the influence of random fluctuations in system load.

4.2.2. Parameter Settings

We adhered to the parameter choices recommended for the algorithms in previous studies. For ADQ-based methods, the configuration for JPEG quality detection was based on [13]. Specifically, ADQ2 required an initial estimate of JPEG quality, which we performed by searching for quality values between 50 and 100 that best matched the DCT histogram periodic artifacts [21]. ADQ3’s SVM classifiers [8] were retrained using a separate dataset of compressed versus double-compressed images. To avoid using part of the FIDD dataset for training, we synthesized training data by using a small subset of the CASIA dataset [3] and our own images with controlled double compression to train ADQ3’s model.
For the CFA [14] algorithms, which required the Bayer pattern of each image, we applied the camera pattern estimation from [52] on the image borders, which are often unmanipulated, to infer the pattern. The most common pattern found was RGGB, which is typical for consumer cameras [51]. For NOI [15], we set the size of the local window for noise estimation to 128 × 128, moving in 32-pixel strides, as this configuration offered a good balance between spatial resolution and robust noise statistics.
The output of each algorithm is a probability map or heatmap indicating the likelihood that a given pixel is forged. For algorithms that output only a decision or require thresholding, we converted their outputs into a comparable format. For instance, ELA [17] and Ghost [18] produce image difference maps, which were converted into heatmaps. Similarly, BAG [19] and CAGI [20] produce binary or scored maps of grid anomalies, which we normalized to a 0–1 forgery likelihood map. Some methods, including ADQ1 [13], ADQ2 [19], and CFA1 [14], natively output probabilistic maps, while others provide a scalar metric per pixel or block.
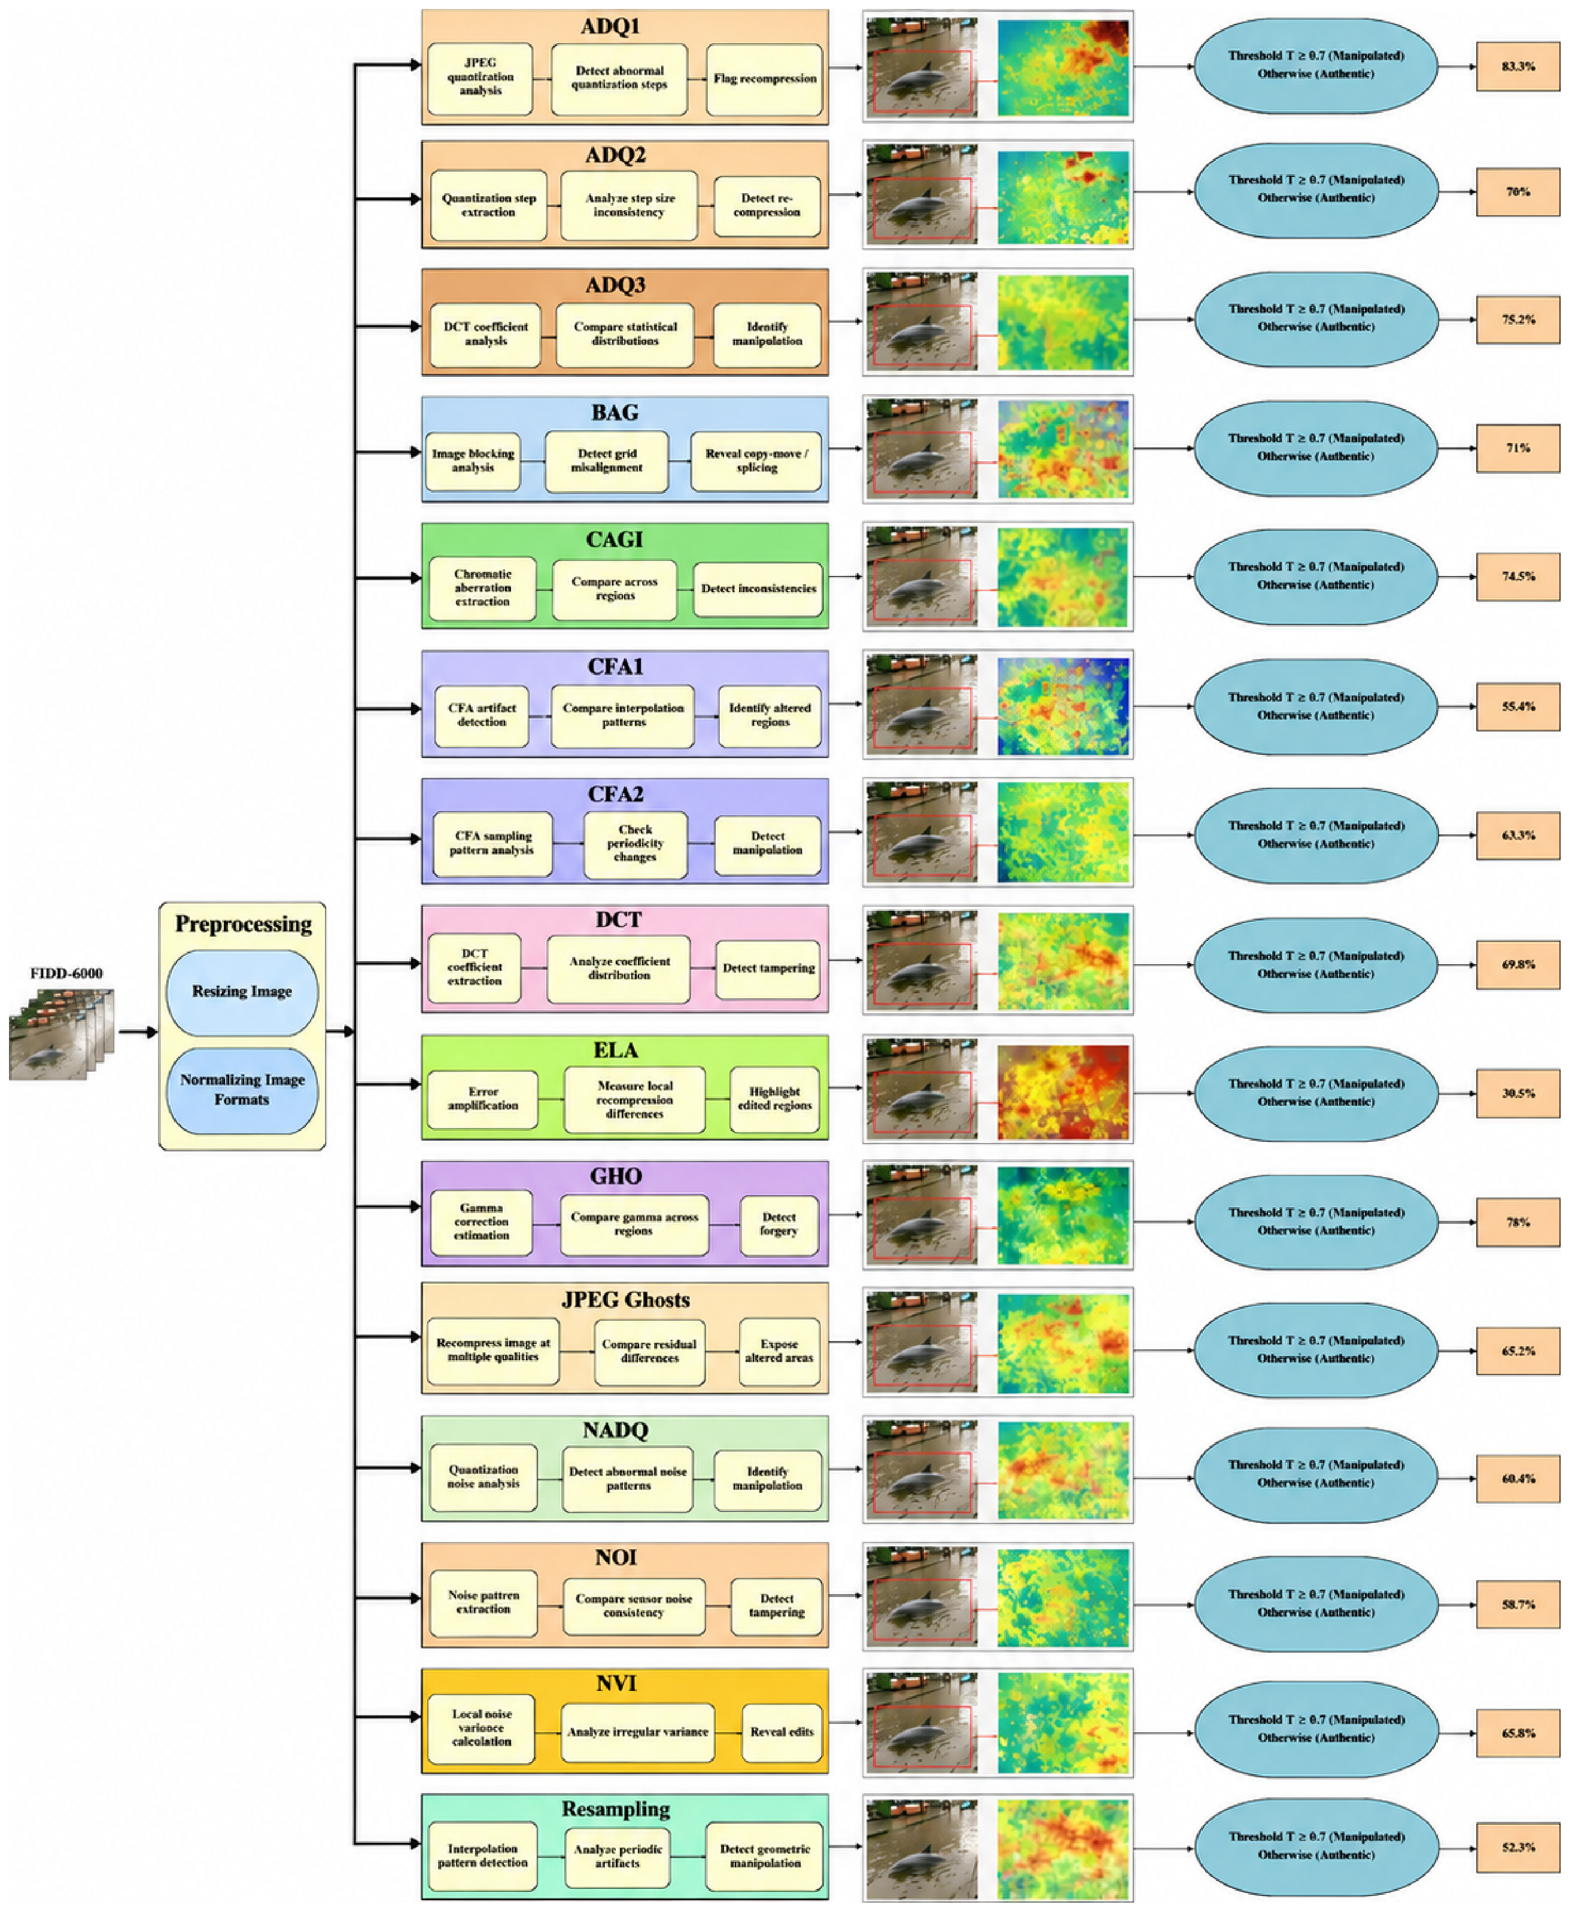
The methodology for benchmarking the 15 classical image localization algorithms on the FIDD-6000 dataset is presented in Figure 8. The process begins with the pre-processing phase, where images are resized and their formats are normalized. Following pre-processing, each algorithm applies a series of techniques such as JPEG quantization analysis, DCT coefficient analysis, and image blocking analysis to detect image manipulations like abnormal quantization steps, recompression, and tampering. For each method, the threshold classification results are presented, distinguishing between images classified as “Manipulated” or “Authentic,” with corresponding accuracy values shown alongside each algorithm’s performance.
We introduce the Mean Absolute Error (MAE) [54], which is less sensitive to class imbalance and region size, as an additional localization metric. This metric is particularly useful for ensuring that small retouching cases are not systematically underrepresented in the results, as it provides a more balanced evaluation for images with subtle manipulations.
Table 4 presents a comparative summary of the 15 classical forgery localization algorithms evaluated in this study, including their input features, analysis procedures, detection objectives, decision rules, and corresponding performance scores.
This benchmarking process allows for a comparative evaluation of the performance of each algorithm, with thresholds set to classify the images based on their authenticity. In essence, our methodology combines the creation of FIDD-6000 with the benchmarking of 15 classical algorithms under a standardized evaluation protocol, providing a realistic and reproducible foundation for future research in image forgeries.

5. Result Analysis

This section summarizes the benchmarking results obtained on the finalized FIDD-6000 dataset. The analysis is based on classical forgery localization algorithms and evaluates their behavior under social media-induced transformations such as recompression, resizing, and filtering. The goal is to examine dataset difficulty, algorithm robustness, localization quality, and computational efficiency in a unified way.

5.1. Benchmarking and Evaluation of FIDD-6000

The evaluation framework measures performance from several complementary perspectives. In particular, TPR, FPR, precision, F1-score, MCC, and IoU are used to quantify image-level detection quality, false alarm behavior, class-balanced performance, and localization accuracy. Average processing time per image is also reported to assess computational feasibility.

5.1.1. Decision Thresholding

To compute image-level detection metrics, each algorithm output is converted into a binary image-level decision through thresholding. Let M ( x , y ) denote the output map produced by an algorithm for image I. The image score is defined as
s ( I ) = max ( x , y ) M ( x , y ) ,
and the corresponding image-level decision is
y ^ ( I ) = 1 , if s ( I ) > T ( classified as manipulated ) , 0 , if s ( I ) T ( classified as authentic ) .
where T is the algorithm-specific threshold. The threshold is chosen so that the false-positive rate on a validation set of authentic images remains below 5%:
T = min τ | FP ( τ ) FP ( τ ) + TN ( τ ) | ϵ ,
where ϵ 0.05 .
For localization, the overlap between prediction and ground truth is measured at the pixel level. If Ω p denotes the predicted manipulated region and Ω g denotes the ground-truth manipulated region, then
Ω p = { ( x , y ) M ( x , y ) > T } , Ω g = { ( x , y ) G ( x , y ) = 1 } .

5.1.2. Overall Performance Metrics

Let T P , T N , F P , and F N denote the number of true positives, true negatives, false positives, and false negatives, respectively. The performance of each algorithm is evaluated using the following metrics [35,53]:
Accuracy = T P + T N T P + T N + F P + F N ,
Balanced Accuracy = 1 2 TPR + TNR ,
MCC = T P × T N F P × F N ( T P + F P ) ( T P + F N ) ( T N + F P ) ( T N + F N ) ,
IoU = T P T P + F P + F N .
Here, the true-positive rate (TPR), also referred to as recall or sensitivity, denotes the proportion of forged images correctly detected, whereas the false-positive rate (FPR) represents the proportion of authentic images that are incorrectly classified as manipulated. Precision measures the proportion of images predicted as manipulated that are actually forged, and the F1-score provides the harmonic mean of precision and TPR. Accuracy reflects the overall fraction of correctly classified samples. Since the FIDD-6000 dataset is imbalanced (16% genuine and 84% fake), we also consider balanced accuracy, which accounts for both classes equally. In addition, the Matthews Correlation Coefficient (MCC) provides a balanced measure of classification quality by considering all four entries of the confusion matrix, while Intersection over Union (IoU) measures the overlap between predicted manipulated regions and the corresponding ground-truth regions.
To support compact comparison, two additional summary measures are useful. The first is the discrimination margin,
Δ = TPR FPR ,
where a larger Δ indicates better separation between manipulated and authentic images. The second is a simple efficiency-aware score,
Ψ = MCC + IoU 2 × Avg . Time ,
which jointly reflects reliability, localization quality, and runtime.
Table 5 compares the benchmark datasets commonly associated with each evaluated algorithm and contrasts their typical reported behavior in conventional settings with their measured TPR, FPR, precision, F1-score, MCC, average processing time, and IoU on FIDD-6000. These metrics are calculated at the pixel level against the ground-truth masks. We also report the F1-score (which balances precision and recall) and the average processing time per image for completeness.
TPR = true-positive rate, FPR = false-positive rate, F1 = pixel-level F1-score, Time = average processing time per image (in seconds). The best results in each column are bolded.

5.1.3. Quantitative and Comparative Analysis

Let A k denote the k-th evaluated algorithm with performance vector
p k = TPR k , FPR k , F 1 k , MCC k , IoU k , t k ,
where t k is the average processing time. From Table 5, ADQ1 achieves the best overall performance with TPR = 83.3 % , MCC = 0.520 , and IoU = 75.2 % . CAGI [20], Ghost (manual), and ADQ3 also perform strongly, confirming that compression-aware methods are the most robust on FIDD-6000. In contrast, ELA [7] performs the worst, with TPR = 30.5 % , F 1 = 0.27 , and IoU = 28.7 % .
A useful comparison is the discrimination margin
Δ k = TPR k FPR k ,
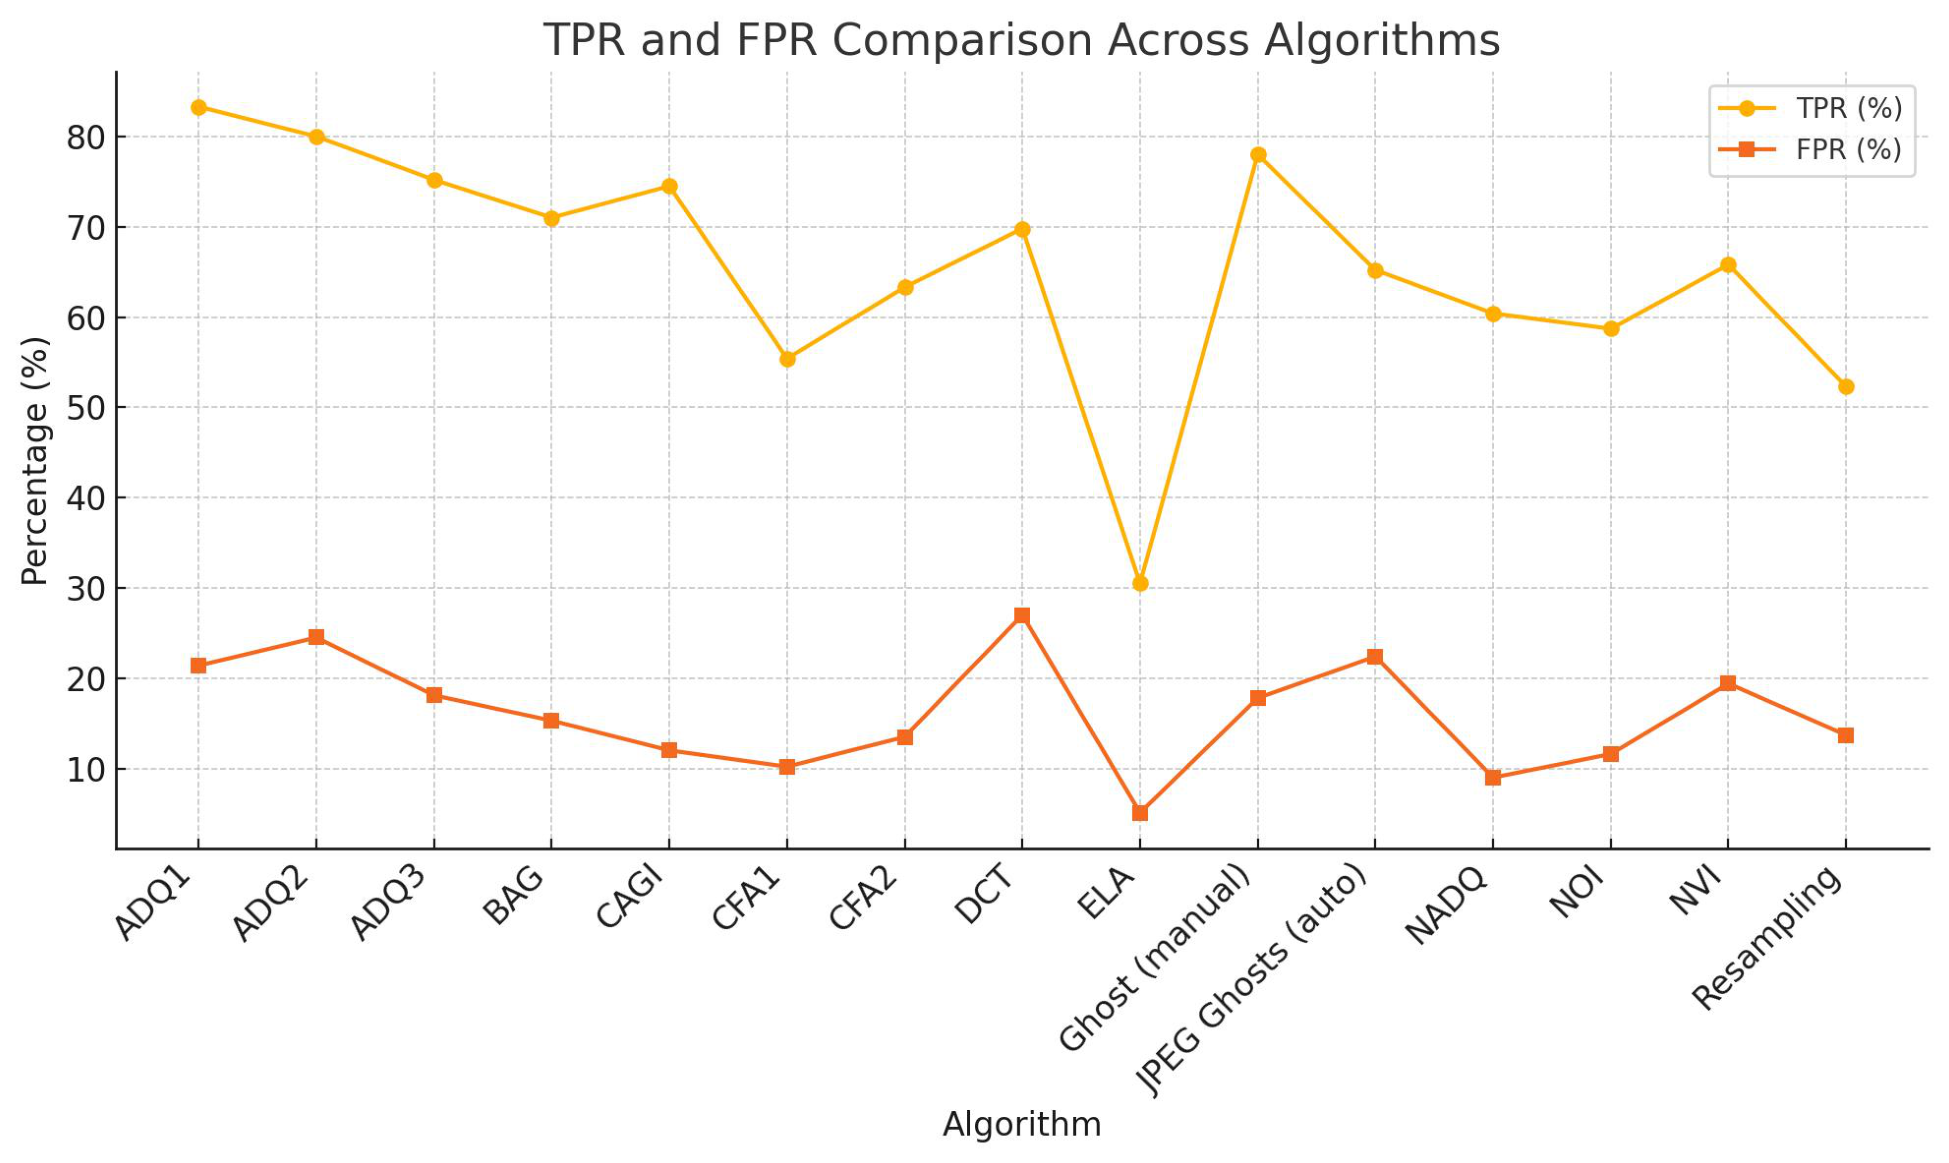
where larger values indicate better separation between manipulated and authentic images. Under this measure, ADQ1, CAGI [20], Ghost (manual), and ADQ3 remain the strongest methods. Although ELA [7] has the lowest FPR, its TPR is also extremely low, showing that its low false alarm rate results mainly from weak detection. The consistency among F1-score, MCC, and IoU further supports this ranking, indicating that the best methods are not only stronger in detection but also more reliable in localization.
The methods can be grouped as
G 1 = { ADQ 1 , CAGI , Ghost ( manual ) , ADQ 3 } ,
G 2 = { BAG , ADQ 2 , DCT , CFA 2 , NADQ , NOI , NVI } ,
G 3 = { ELA , Resampling , CFA 1 } .
This shows that compression-based methods preserve more useful forensic evidence than CFA-, noise-, or interpolation-based methods after social media processing. In particular, CAGI [20] improves over BAG [19], and Ghost (manual) performs better than Ghosts (auto), indicating the benefit of content-aware filtering and guided region analysis.
To combine performance and runtime, an efficiency-aware score can be written as
Ψ k = MCC k + IoU k 2 t k .
Although ELA [7], DCT [22], Resampling [16], CFA1 [5], and NOI [2] are fast, their detection quality is limited. ADQ1 remains the most practical method because of its strong statistical performance with relatively low runtime.

5.1.4. Visual Analysis

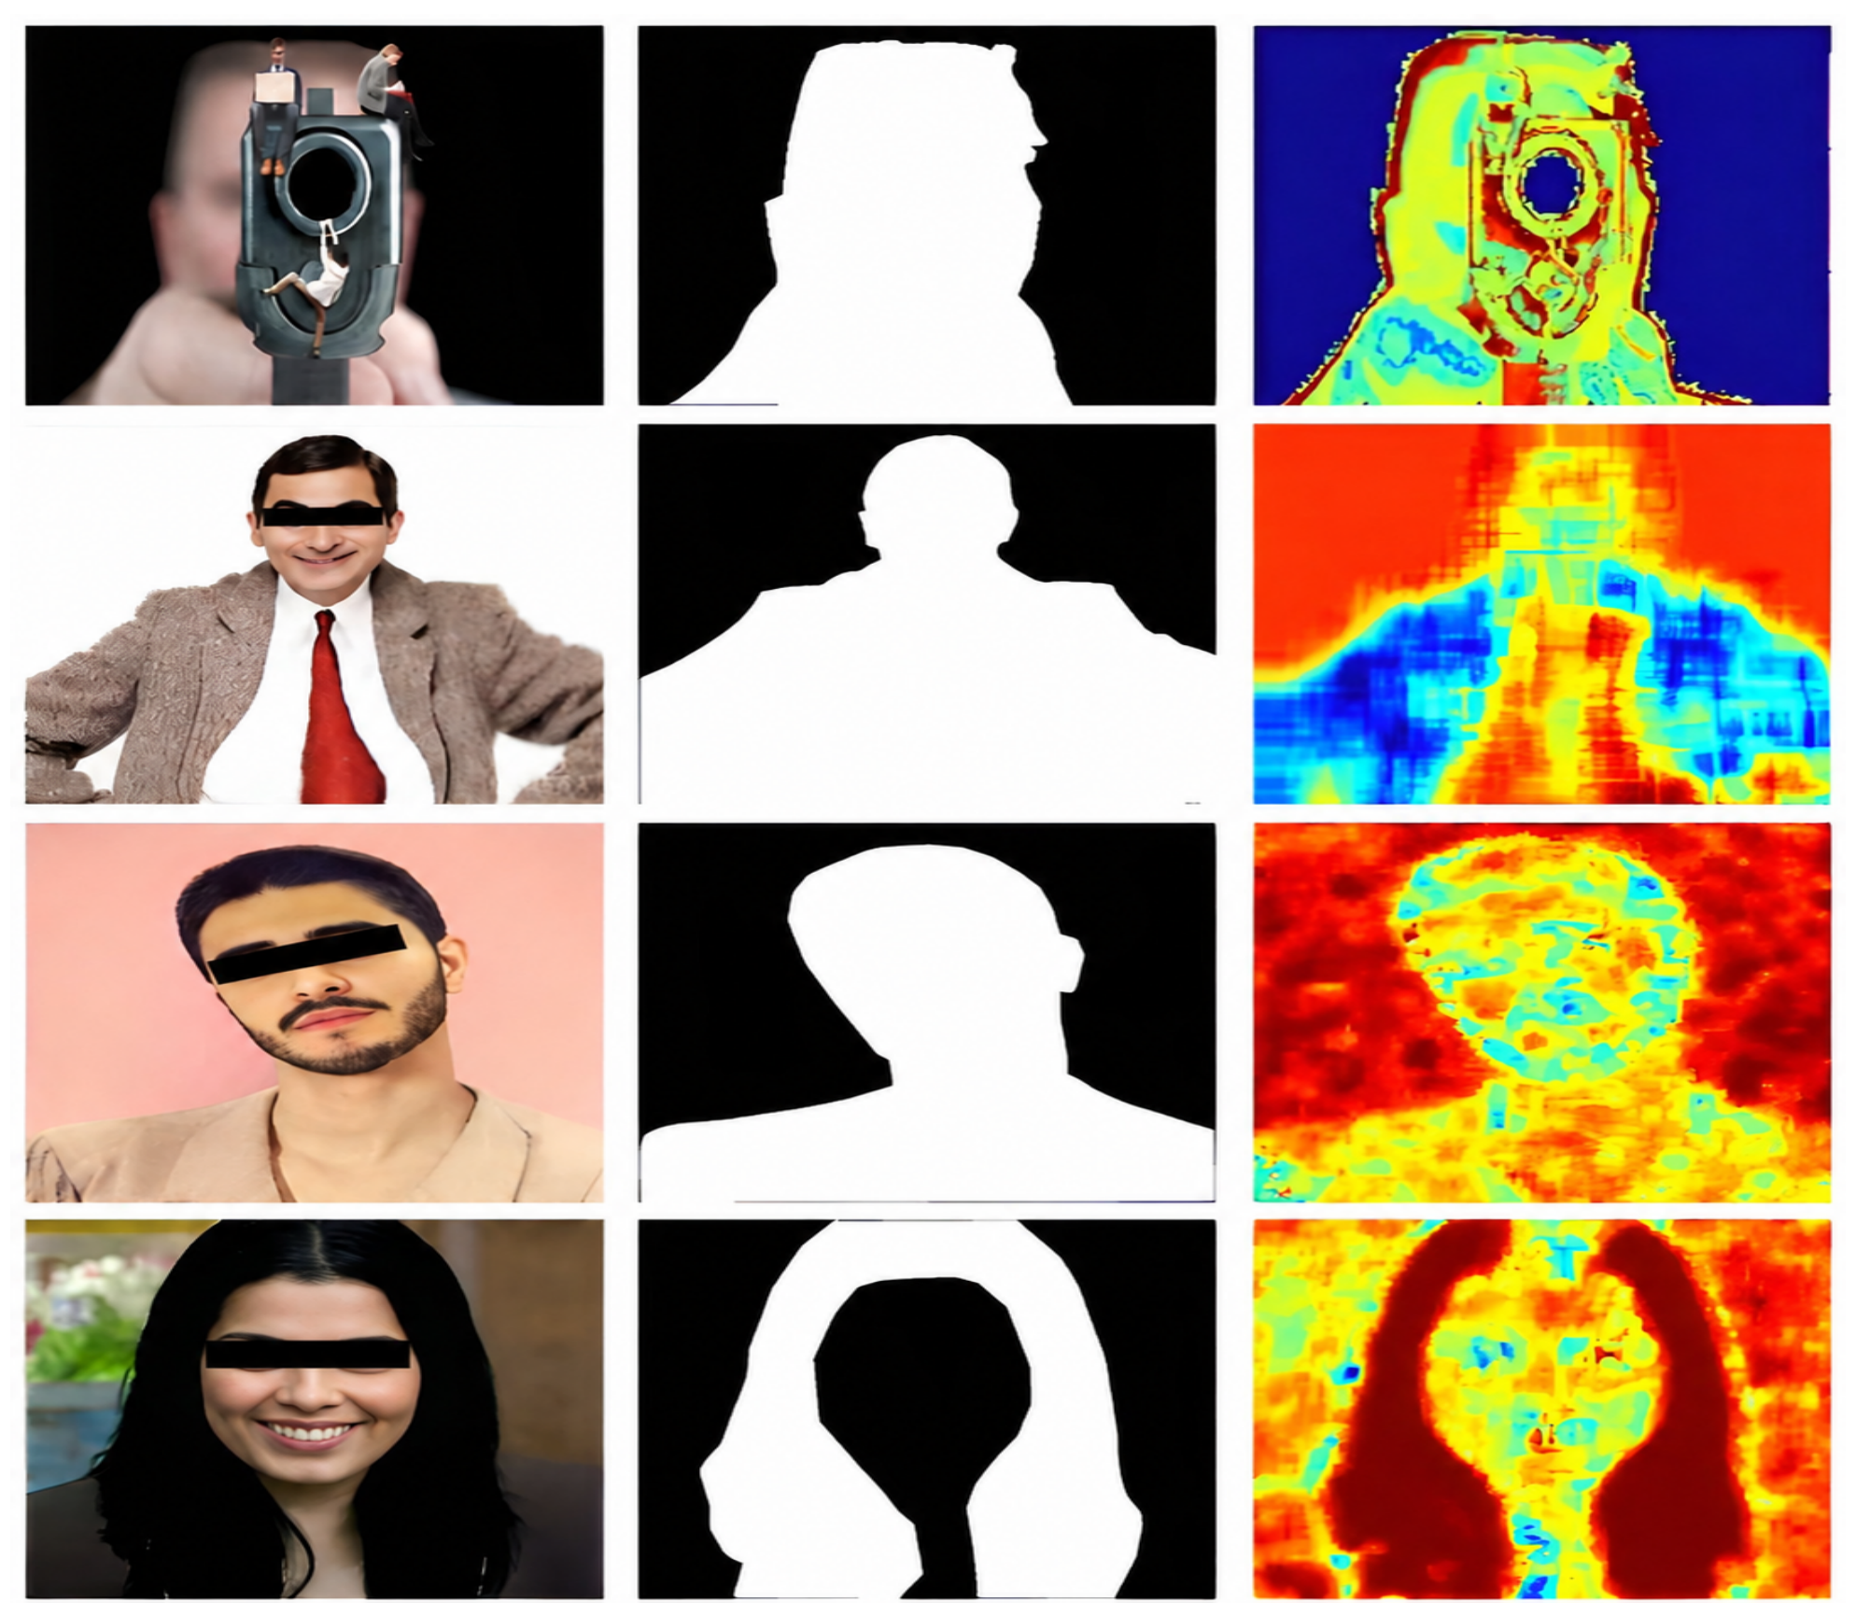
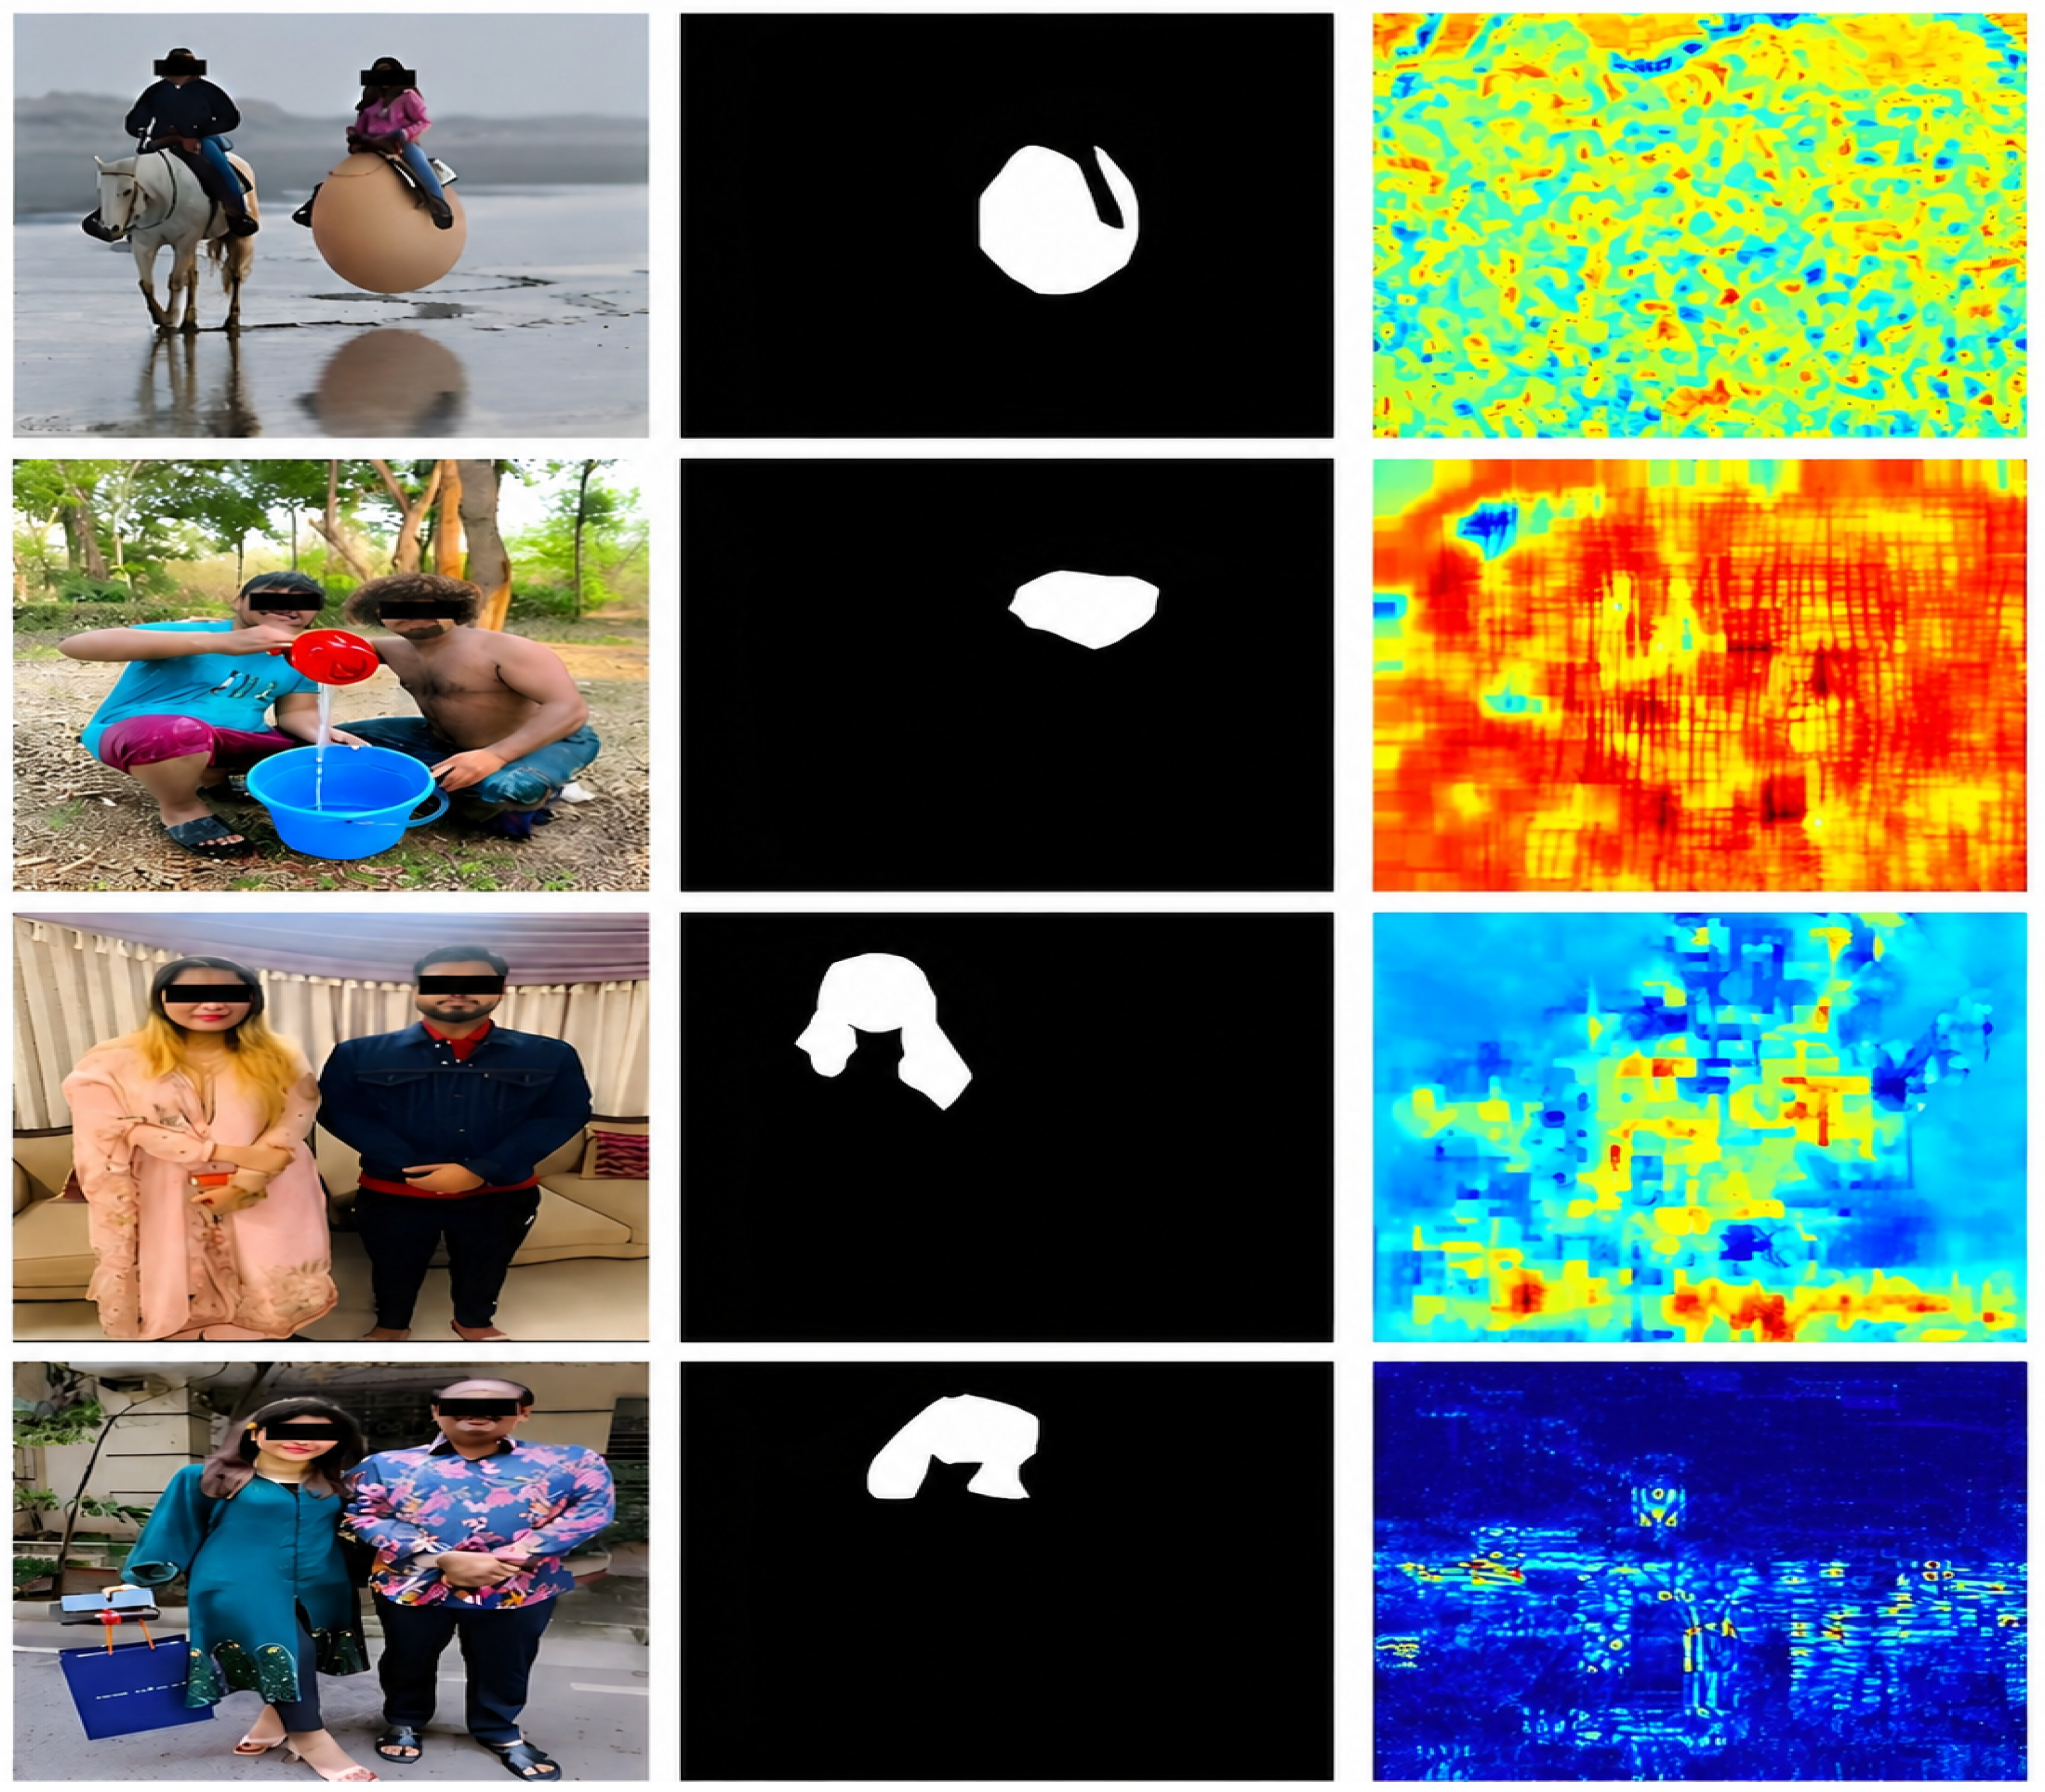
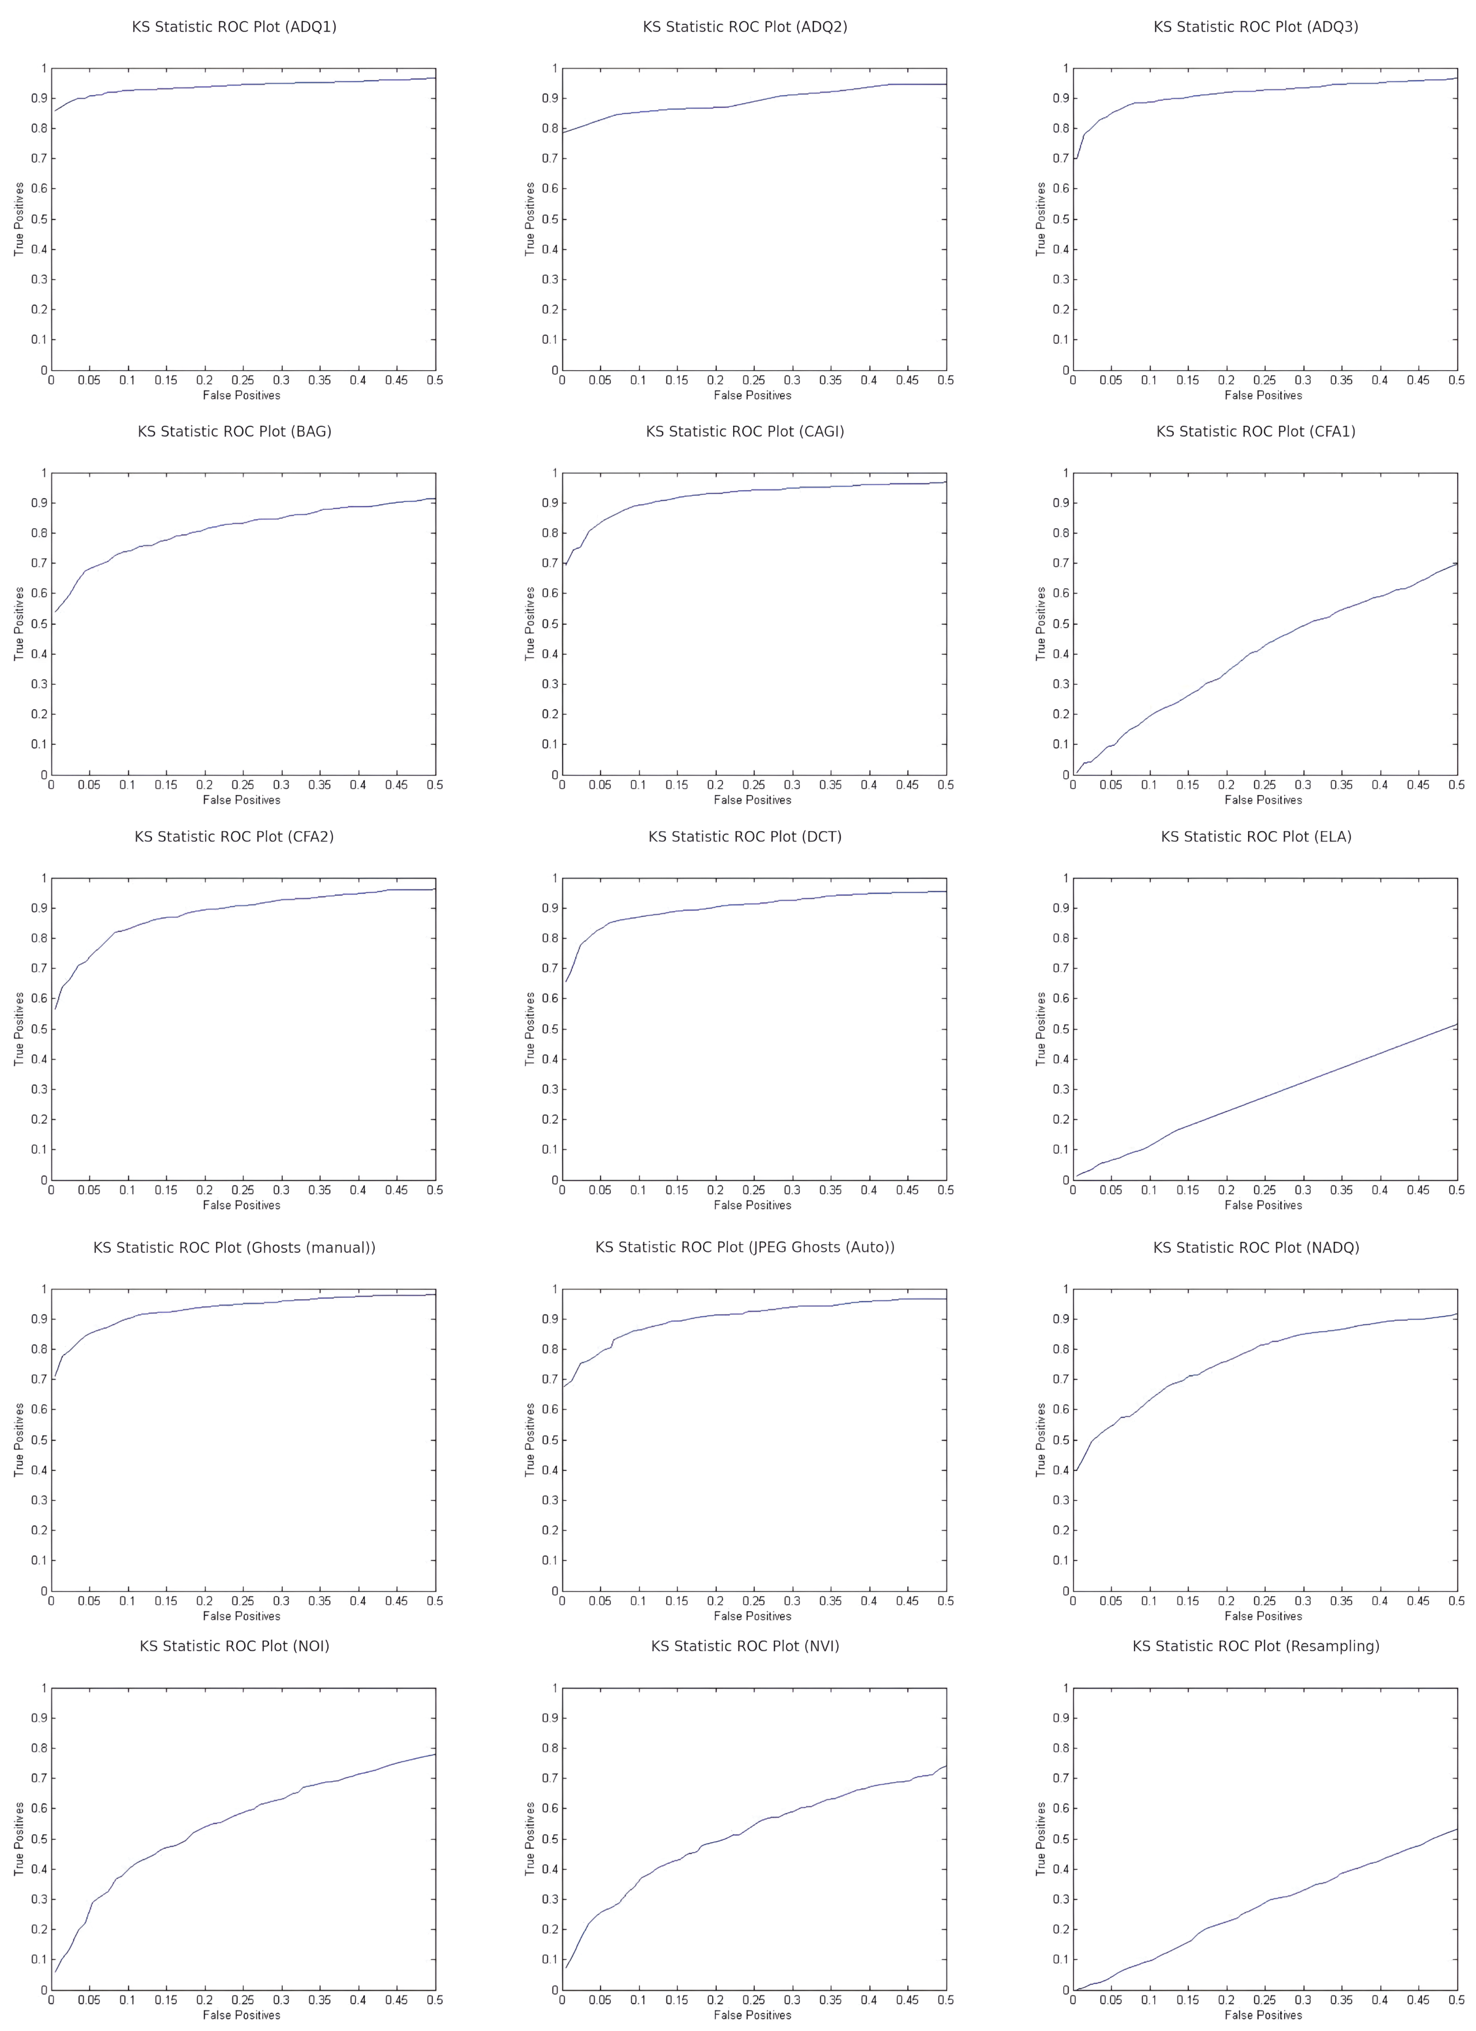
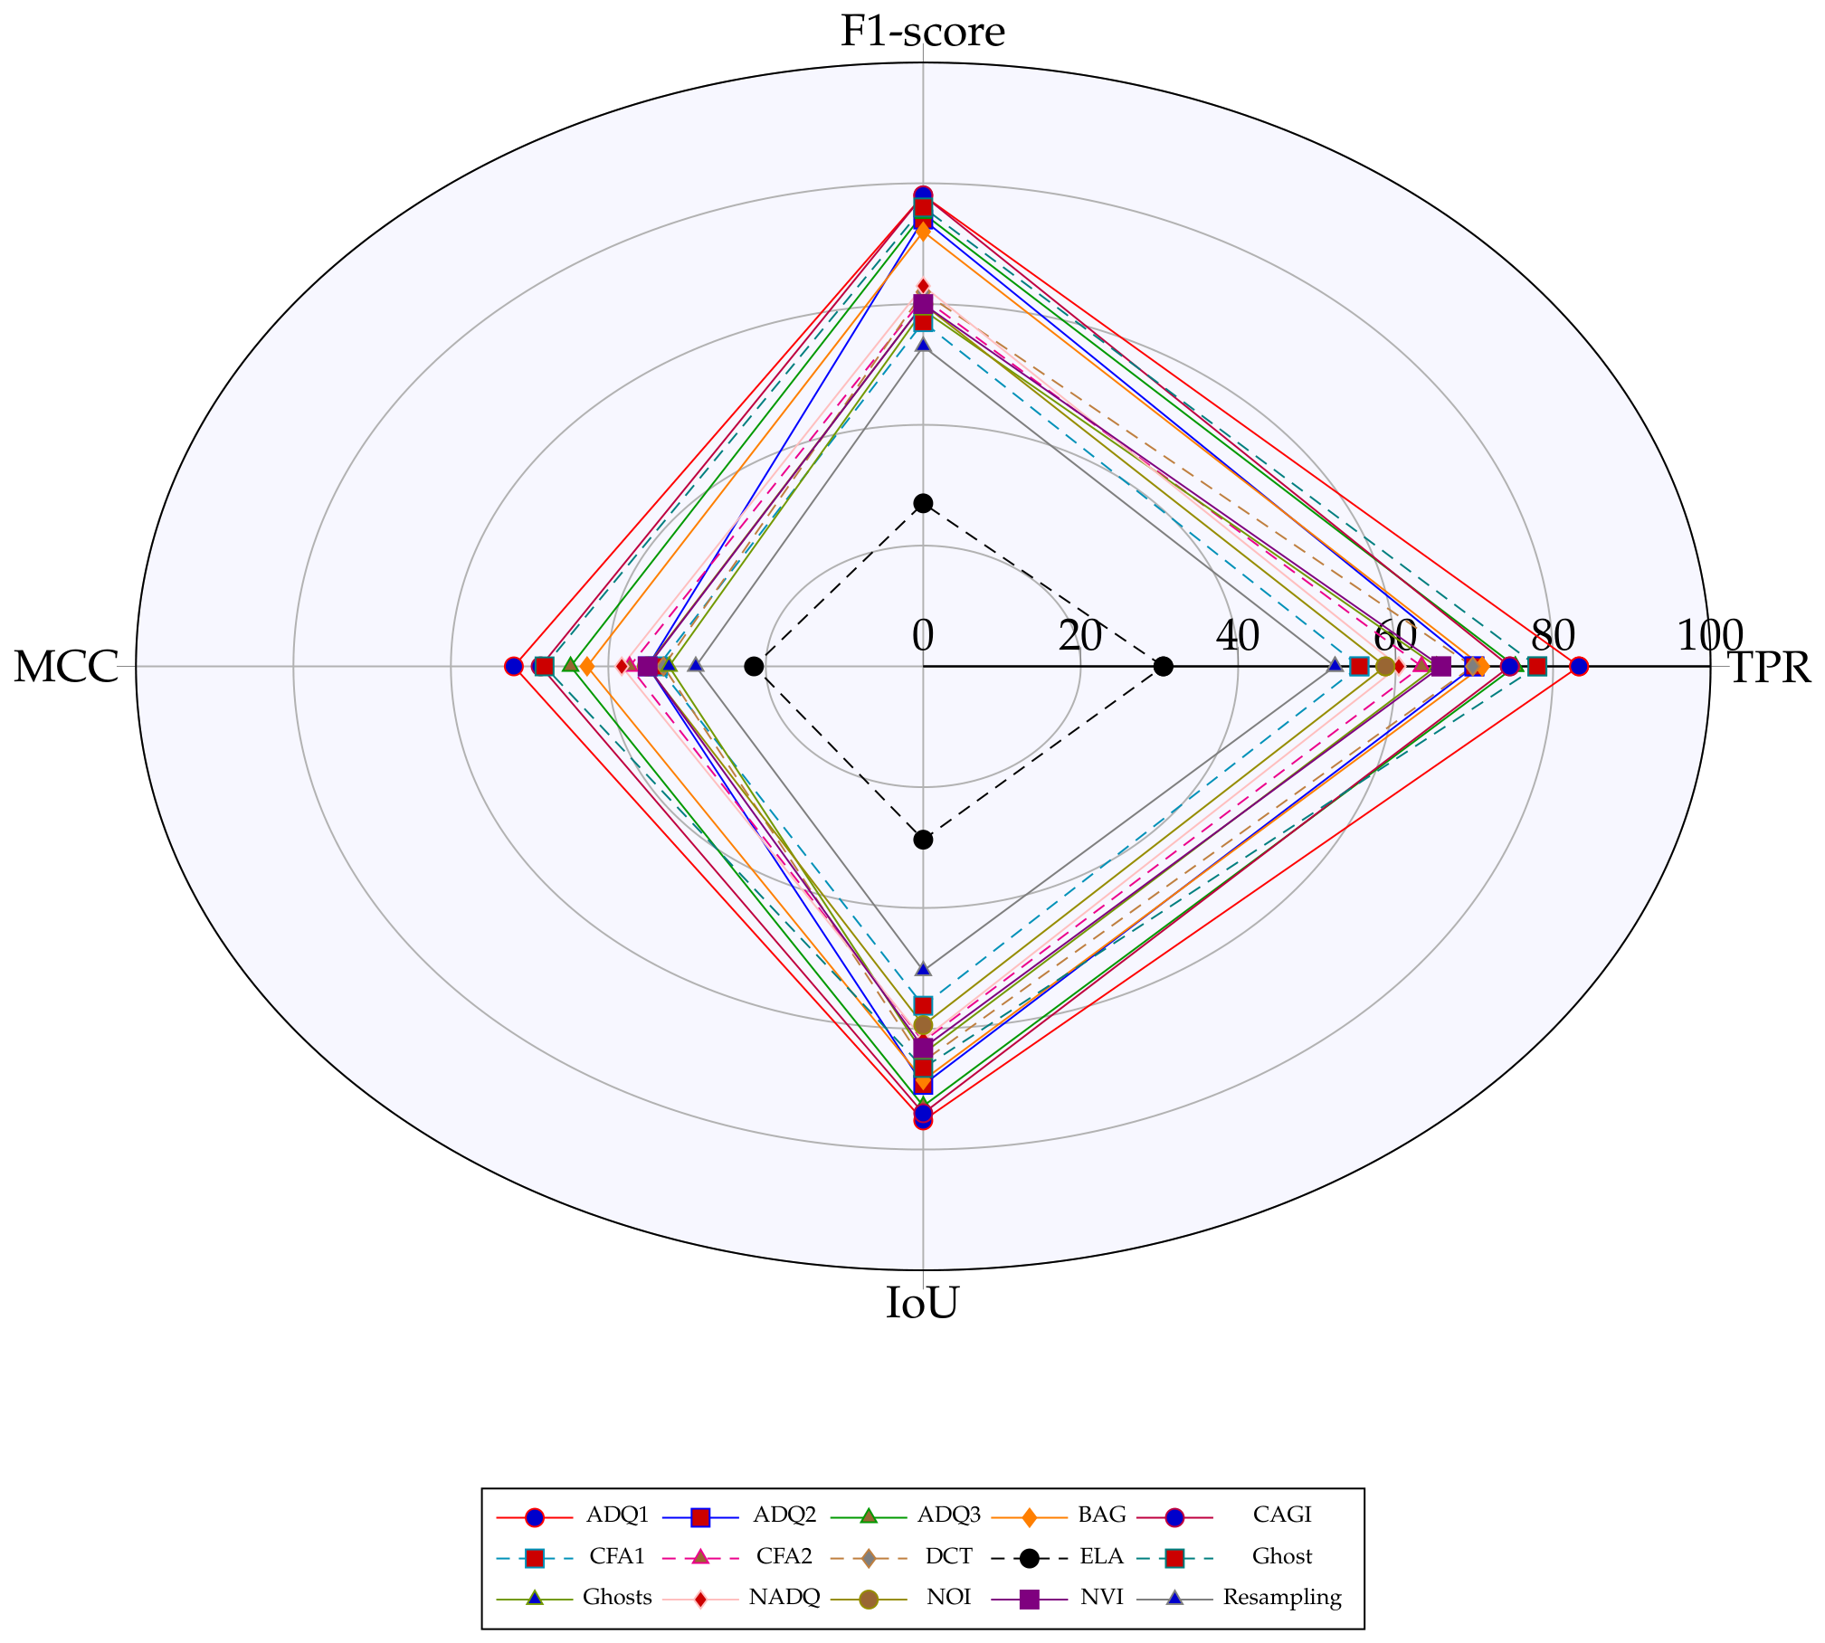
Visual analysis supports the numerical findings. Figure 9 presents successful examples in which ADQ1 [13], ADQ2 [19], Ghosts [18], and BAG [19] localize manipulated regions with varying quality. Figure 10 presents failure cases, showing that ELA [17], Resampling [16], CFA1 [14], and NOI [15] are strongly affected by compression, downsampling, demosaicing loss, and texture confusion. Figure 11 adds ROC-based visual evidence using the KS statistic. The comparison of the evaluated algorithms across multiple metrics is succinctly presented in Figure 12, while Figure 13 summarizes comparative behavior among competitive methods.
These visual representations complement Table 5 from at least three perspectives:
V 1 = qualitative localization success ( Figure 9 ) ,
V 2 = qualitative localization failure ( Figure 10 ) ,
V 3 = global discrimination behavior ( Figures 11 and 13 ) .
Together, these views show that the strongest methods are not only statistically better, but also visually more stable across different forgery cases.
Figure 9 shows qualitative examples of successful forgery localization on manipulated images from FIDD-6000. The first column presents the input image, the second column shows the ground-truth binary mask, and the third column displays the outputs of different algorithms. ADQ1 [13] and ADQ2 [19] localize manipulated regions reasonably well, although some edge noise remains. Ghosts (manual) [18] performs better when JPEG quality differences are visible, while BAG [19] works well under strong grid misalignment but is less effective on uniformly compressed images. These visual results support the quantitative findings and highlight both the strengths and limitations of classical forgery methods on social media images.
Figure 10 presents representative failure cases from FIDD-6000, where several classical methods fail to accurately detect or localize the manipulated regions. ELA [17], Resampling [16], CFA1 [14], and NOI [15] are particularly affected by social media-induced compression, global downsampling, obscured demosaicing traces, and natural texture variations, highlighting the limitations of classical forgery detection on real-world images.

5.1.5. Direct Performance Comparisons on Established Datasets

To contextualize the FIDD-6000 results, we compare them with outcomes reported on established datasets, including CASIA [3], Wild Web [39], MICC [36], SMIFD [9], IMD2020 [38], Coverage [2], and Columbia [4]. On controlled datasets such as CASIA v2.0 [3], Coverage [2], and Columbia [4], methods like ADQ1 [13] and CAGI [20] often achieve TPRs above 80%. However, performance drops substantially on more challenging datasets such as Wild Web [39], MICC [36], SMIFD [9], and IMD2020 [38], where images are more realistic and manipulations are more diverse. Compared with these benchmarks, FIDD-6000 is particularly difficult because it focuses on social media-sourced images affected by recompression, resizing, and other platform-induced transformations. Therefore, FIDD-6000 provides a more realistic benchmark for evaluating the robustness of forgery detection algorithms under real-world conditions.

5.1.6. Image-Level Detection Result

Image-level detection follows the same ordering as pixel-level performance. ADQ1 detected manipulations in roughly 83% of forged images, Ghost (manual) in 78%, and CAGI in 75.5%, whereas ELA only detected about 30% of forged images. Thus, methods with a stronger TPR at the pixel level also remain stronger when the image is treated as a whole:
Image Detection Rate TPR .
Figure 11 shows the ROC curves of 15 forgery detection algorithms, summarized using the Kolmogorov–Smirnov statistic. ADQ, Ghosts, Noise Based, and CAGI show stronger discrimination, whereas ELA, CFA, NADQ, and Resampling perform more weakly under social media-compressed conditions.
Figure 12 provides a compact multi-metric comparison of the evaluated algorithms using TPR, F1-score, MCC, and IoU. The plot shows that ADQ1 has the largest overall coverage across the four axes, confirming it as the strongest all-round performer on FIDD-6000. CAGI, ADQ3, and Ghost (manual) also occupy relatively large areas, indicating strong and balanced performance in both detection and localization. In contrast, ELA, CFA1, and Resampling exhibit much smaller profiles, reflecting weaker sensitivity, poorer localization quality, and lower overall robustness. Moderate performers such as ADQ2, BAG, DCT, CFA2, NADQ, NOI, NVI, and Ghosts (auto) fall between these two extremes, with strengths on some metrics but less consistent overall behavior.
The spider plot also highlights useful pairwise comparisons. CAGI performs better than BAG because its values are consistently higher on F1-score, MCC, and IoU, indicating that the content-aware mechanism improves both reliability and localization. Similarly, Ghost (manual) outperforms Ghosts (auto), showing that guided region analysis is more effective than fully automatic scanning. Among the CFA-based methods, CFA2 performs better than CFA1, although both remain weaker than the leading JPEG-based methods. The noise-based methods, NOI and NVI, show moderate but relatively balanced profiles, whereas ELA remains the weakest method overall.
These observations are broadly consistent with Figure 11, where ADQ, Ghosts, Noise Based, and CAGI show stronger discrimination according to the Kolmogorov–Smirnov statistic, while ELA, CFA, NADQ, and Resampling remain weaker under social media-compressed conditions. However, the spider plot refines this interpretation by showing not only discrimination strength but also the balance between detection quality and localization accuracy. In particular, ADQ1, ADQ3, CAGI, and Ghost (manual) emerge as the most reliable methods across multiple criteria, while ELA, CFA1, and Resampling remain consistently weak in both the spider plot and ROC-based analysis.

5.1.7. False Positives on Authentic Images

False-positive analysis on the 1000 authentic images shows that most algorithms remain cautious on untampered content. ADQ and Ghost-based methods produce some false alarms because global social media recompression can itself resemble a forensic cue. This explains why ADQ1 and ADQ3 occasionally highlight authentic images.
ELA rarely flags authentic images, but this behavior is again linked to its weak sensitivity. The relation between authentic-image false alarms and overall FPR may be expressed as [35,53]
FPR = false alarms on authentic images total authentic images .
Figure 13 compares the true-positive rate (TPR) and false-positive rate (FPR) of 15 popular image forgery detection algorithms on the FIDD-6000 dataset.

5.1.8. Average Processing Time per Image

The timing column of Table 5 highlights the computational cost disparity. The fastest were ELA (0.06 s per image), DCT (0.08 s), Resampling (0.08 s), CFA1 (0.1 s), and NOI (0.1 s)—essentially negligible runtime. ADQ1 and ADQ2 were also very fast (0.25 s each). In contrast, ADQ3 took 14.3 s per image on average—over 50× slower—due to its intensive likelihood computations. CFA2 and NVI also took multiple seconds (2–3 s) due to their iterative nature. Ghost methods took 4.7 s because we tested multiple qualities. These times mean that if one were deploying these detectors at scale, methods like ADQ1, CAGI (3.6 s), etc., would be feasible, but ADQ3 might be too slow without optimization. It is noteworthy that even the slowest (14 s) is not terrible for offline analysis, but it would be impractical to run ADQ3 on thousands of images in real time. One might then reserve heavy algorithms for secondary analysis.
In this study, we restricted benchmarking on FIDD-6000 to classical image forgery algorithms rather than deep learning approaches. This choice ensures transparent, reproducible baselines that highlight the dataset’s inherent challenges—particularly the impact of social media transformations—without the confounding influence of training or model optimization. Deep learning approaches typically require large-scale training, hyperparameter tuning, and transfer learning from external datasets. Their performance can vary widely depending on training protocols, architectures, and computational resources. In contrast, classical forgery algorithms (e.g., ADQ [13], CFA [14], DCT [12], and ELA [17]) operate without training, making them deterministic, reproducible, and directly comparable across datasets. For benchmarking a new dataset such as FIDD-6000, such transparent baselines provide a fair and unbiased reference point. Future work can build upon these baselines by exploring advanced deep learning methods.

6. Discussion and Future Work

FIDD-6000 serves both as a new dataset resource and as a challenging benchmark for forgery detection under realistic social media transformations. The comparative evaluation shows that no classical method is consistently reliable across all manipulation types and post-processing conditions. Although ADQ1 achieved the strongest overall performance, the results of all fifteen algorithms reveal that social media-induced recompression, resizing, and format conversion substantially weaken the forensic cues on which classical methods depend. This confirms the value of FIDD-6000 not only as an evaluation platform for existing techniques, but also as a basis for developing more robust forgery detection systems.
The results indicate that compression-aware methods, especially ADQ1-, ADQ3-, CAGI-, and Ghost-based analysis, remain more effective than CFA-, noise-, and resampling-based approaches. Their relative advantage suggests that compression inconsistencies survive social media processing more often than sensor-level or interpolation-based traces. However, even the best methods still produce either false positives, missed detections, or reduced localization quality. This limitation can be expressed through the gap
Δ = TPR FPR ,
where a larger Δ indicates better discrimination between manipulated and authentic images. While ADQ1 and CAGI achieve relatively large margins, none of the tested methods approaches an ideal detector with both a high TPR and a near-zero FPR. Similarly, the overall reliability of a method must be judged jointly through detection and localization:
R = α F 1 + β MCC + γ IoU ,
where α , β , γ 0 are weighting coefficients. Under this view, methods that appear strong on a single metric but weak on others cannot be considered practically robust.
A major finding of this study is that social media transformations fundamentally alter the forgery detection problem. If I denotes an original manipulated image and T ( · ) denotes the transformation applied by a platform, then the observed image is
I s = T ( I ) ,
where T may include recompression, resizing, filtering, and metadata removal. Classical detectors are therefore required to infer forgery from I s rather than from I, even though many discriminative traces are partially removed by T . This explains why algorithms that perform well on conventional datasets often degrade on FIDD-6000. In particular, methods based on CFA, sensor noise, or resampling are more vulnerable because their underlying signals are easily suppressed by post-processing.
The results also suggest that dependable forgery analysis in social media images should not rely on a single forensic cue. A more practical strategy is a multi-signal framework in which different detectors provide complementary evidence:
S ( I s ) = k = 1 K w k f k ( I s ) ,
where f k ( I s ) denotes the response of the k-th detector and w k is its contribution weight. Such a formulation naturally motivates hybrid or ensemble approaches that combine compression-based, noise-based, CFA-based, and learned features. Since different methods fail under different conditions, fusion offers a more promising direction than further reliance on any single handcrafted algorithm.
Future work should proceed in three directions. First, FIDD-6000 can be expanded to include emerging manipulation categories such as deepfakes, neural rendering, and generative inpainting, increasing both manipulation diversity and application relevance. Second, trainable fusion models should be developed using outputs from multiple forgery detectors as structured inputs. Third, more robust learning-based methods should be benchmarked on FIDD-6000 to study how well they generalize under realistic social media degradation. In this sense, FIDD-6000 is not only a dataset, but a strategic testbed for evaluating, comparing, and improving the next generation of image forgery detection and localization methods.

7. Conclusions

This research study introduces FIDD-6000, a large-scale benchmark dataset for image forgery detection and localization in social media images, and evaluates fifteen widely used classical forgery algorithms on this dataset. The results show that although these methods perform well on conventional benchmarks, their effectiveness drops considerably under social media-induced transformations such as recompression, resizing, and format conversion. No single algorithm provides robust performance across all manipulation types, confirming that current classical approaches are insufficient for reliable real-world social media forgery analysis.
The benchmarking results indicate that JPEG-based methods, particularly ADQ, CAGI, and ghost-based analysis, remain comparatively more effective than CFA-, noise-, and resampling-based methods. However, even the best-performing methods suffer from false positives, missed detections, or reduced localization quality. These findings suggest that dependable forgery analysis on social media images requires a multi-stage and multi-signal strategy rather than reliance on any single forensic cue.
A key contribution of this work is the establishment of FIDD-6000 as a realistic and reproducible benchmark for future research. By providing manipulated social media images together with pixel-level ground-truth masks, the dataset fills an important gap left by existing benchmarks that do not adequately capture social media degradations. As such, FIDD-6000 offers a strong platform for the systematic evaluation and comparison of both classical and learning-based methods.
Future work will extend the dataset to include newer manipulation types, such as deepfakes, neural rendering, and generative inpainting, and will explore hybrid and ensemble models that combine multiple forensic signals to improve robustness under real-world conditions.

Author Contributions

Conceptualization, M.M.R.R., M.A.R., K.H.T., S.M.G. and N.S.; Methodology, M.M.R.R., M.A.R., K.H.T., S.M.G. and N.S.; Software, M.M.R.R., M.A.R. and S.M.G.; Validation, M.M.R.R., M.A.R., K.H.T., S.M.G. and N.S.; Formal analysis, M.M.R.R., K.H.T. and N.S.; Investigation, M.M.R.R. and M.A.R.; Resources, M.M.R.R., M.A.R., K.H.T., S.M.G. and N.S.; Data curation, M.M.R.R., M.A.R. and K.H.T.; Writing—original draft, M.M.R.R.; Writing—review and editing, M.M.R.R., M.A.R., K.H.T., S.M.G. and N.S.; Visualization, M.M.R.R.; Supervision, M.A.R., K.H.T., S.M.G. and N.S.; Project administration, M.A.R., K.H.T. and S.M.G.; Funding acquisition, N.S. All authors have read and agreed to the published version of the manuscript.

Funding

This research study was supported by the Information and Communication Technology (ICT) Division of the Government of the People’s Republic of Bangladesh through the award of an ICT Fellowship (Reference No. 56.00.0000.052.33.001.23-57).

Institutional Review Board Statement

All images included in the FIDD-6000 dataset were collected from publicly available content on social media platforms that permit the use of such materials for academic research and non-commercial purposes under their respective terms of service. This real-world dataset was created solely for research and educational use, with no intent of commercial exploitation. To preserve privacy and ethical standards, all images containing human faces are used strictly for scientific illustration of image forgery detection techniques, not for any form of identification or personal representation. The images do not include any personally identifiable information, and no individual has been targeted, profiled, or associated with any specific data point. Accordingly, the inclusion of these figures does not violate any copyright or privacy rights, as the work constitutes a fair and transformative academic use under applicable copyright principles. Even then, if anyone has any objections, we will remove their image from our database. So, this work fully complies with the ethical principles for research involving publicly available data and adheres to fair use provisions under relevant copyright law.

Informed Consent Statement

Not applicable.

Data Availability Statement

We plan to make the FIDD-6000 dataset publicly available for research purposes through the following link: https://github.com/Mehedicse11/FIDD-6000 (accessed on: 17 March 2026). Given that a substantial portion of the images was sourced from social media, privacy and copyright issues must be carefully considered. To mitigate these concerns, we have ensured that all images are either: (i) already in the public domain through fact-checking reports and open media archives or (ii) used under the principles of fair use for academic research, particularly in cases where the manipulated content has been widely circulated in news or social media as part of public discourse. Nevertheless, users of FIDD-6000 are advised to handle the dataset responsibly and ethically, as some images may contain identifiable individuals or be associated with sensitive sociopolitical contexts. Additionally, the motive annotations (e.g., propaganda, satire, and misinformation) in the dataset are based on the best available evidence from fact-checking sources. While we have aimed for accuracy and transparency, we acknowledge that such categorizations may involve a degree of subjectivity and may not be universally agreed upon. These annotations are provided to enhance reproducibility and encourage critical engagement while maintaining transparency about their interpretive nature. Takedown Process: A takedown process is in place for any content that is found to be in violation of copyright or privacy rights. Requests for takedown will be handled promptly upon notification. De-Identification/Redaction Policy: We ensure that any identifiable information about individuals in the images is either redacted or de-identified before the release of the dataset. Users are strongly encouraged to handle the dataset in compliance with privacy and ethical guidelines.

Acknowledgments

The authors like to thank the Information and Communication Technology (ICT) Division of the Government of the People’s Republic of Bangladesh. We used the Large Language Model ChatGPT (Version: GPT-4.5) to enhance the structure of the sentences in this paper.

Conflicts of Interest

The authors declare that they have no conflicts of interest.

References

  1. Singh, S.; Kumar, R. Image forgery detection: Comprehensive review of digital forensics approaches. J. Comput. Soc. Sci. 2024, 7, 877–915. [Google Scholar] [CrossRef]
  2. Shallal, I.; Rzouga Haddada, L.; Essoukri Ben Amara, N. Image forgery detection with focus on copy-move: An overview, real-world challenges and future directions. Appl. Sci. 2025, 15, 11774. [Google Scholar] [CrossRef]
  3. Dong, J.; Wang, W.; Tan, T. CASIA image tampering detection evaluation database. In Proceedings of the 2013 IEEE China Summit and International Conference on Signal and Information Processing (ChinaSIP), Beijing, China, 6–10 July 2013; pp. 422–426. [Google Scholar] [CrossRef]
  4. Ng, T.-T.; Hsu, J.; Chang, S.-F. Columbia Image Splicing Detection Evaluation Dataset; DVMM Laboratory, Columbia University: New York, NY, USA, 2009; Available online: https://www.ee.columbia.edu/ln/dvmm/downloads/AuthSplicedDataSet/ (accessed on 29 April 2026).
  5. Tralic, D.; Zupancic, I.; Grgic, S.; Grgic, M. CoMoFoD—New database for copy-move forgery detection. In Proceedings of the 55th International Symposium ELMAR-2013, Zadar, Croatia, 25–27 September 2013; pp. 49–54. Available online: http://www.vcl.fer.hr/comofod (accessed on 10 December 2025).
  6. Pan, W.; Ma, W.; Wu, X.; Liu, W. High frequency component enhancement network for image manipulation detection. Electronics 2024, 13, 447. [Google Scholar] [CrossRef]
  7. Al-Qershi, O.M.; Khoo, B.E. Passive detection of copy-move forgery in digital images: State-of-the-art. Forensic Sci. Int. 2013, 231, 284–295. [Google Scholar] [CrossRef]
  8. Mareen, H.; De Neve, L.; Lambert, P.; Van Wallendael, G. Harmonizing image forgery detection & localization: Fusion of complementary approaches. J. Imaging 2024, 10, 4. [Google Scholar] [CrossRef]
  9. Rana, M.M.R.; Hasnat, A.; Rahaman, G.M.A. SMIFD-1000: Social media image forgery detection database. Forensic Sci. Int. Digit. Investig. 2022, 41, 301392. [Google Scholar] [CrossRef]
  10. Jena, R.; Singh, P.; Mohanty, M. PP-JPEG: A privacy-preserving JPEG image-tampering localization. J. Imaging 2023, 9, 172. [Google Scholar] [CrossRef] [PubMed]
  11. Guo, Z.; Zhang, B.; Fan, J.; Teng, Z.; Fan, J. Modal-guided multi-domain inconsistency learning for face forgery detection. Appl. Sci. 2024, 15, 229. [Google Scholar] [CrossRef]
  12. Pappachan, P.; Adi, N.S.; Firmansyah, G. Deep Learning-Based Forensics. In Digital Forensics and Cyber Crime Investigation: Recent Advances and Future Directions; CRC Press: Boca Raton, FL, USA, 2024; Volume 211, Available online: https://www.taylorfrancis.com/books/edit/10.1201/9781003207573/digital-forensics-cyber-crime-investigation-ahmed-abd-el-latif-lo-ai-tawalbeh-manoranjan-mohanty-brij-gupta-konstantinos-psannis (accessed on 10 December 2025).
  13. Barni, M.; Bondi, L.; Bonettini, N.; Bestagini, P.; Costanzo, A.; Maggini, M.; Tondi, B.; Tubaro, S. Aligned and non-aligned double JPEG detection using convolutional neural networks. J. Vis. Commun. Image Represent. 2017, 49, 153–163. [Google Scholar] [CrossRef]
  14. Kwan, C.; Larkin, J. Demosaicing of Bayer and CFA 2.0 patterns for low lighting images. Electronics 2019, 8, 1444. [Google Scholar] [CrossRef]
  15. Gardella, M.; Musé, P.; Morel, J.-M.; Colom, M. Forgery detection in digital images by multi-scale noise estimation. J. Imaging 2021, 7, 119. [Google Scholar] [CrossRef] [PubMed]
  16. Liang, P.; Li, Z.; Tu, H.; Zhao, H. LBRT: Local-information-refined transformer for image copy-move forgery detection. Sensors 2024, 24, 4143. [Google Scholar] [CrossRef]
  17. Abd Warif, N.B.; Idris, M.Y.I.; Wahab, A.W.A.; Salleh, R. An evaluation of Error Level Analysis in image forensics. In Proceedings of the 5th IEEE International Conference on System Engineering and Technology (ICSET), Shah Alam, Malaysia, 10–11 August 2015; pp. 23–28. [Google Scholar] [CrossRef]
  18. Singh, D.; Singh, P.; Jena, R.; Chakraborty, R.S. An image forensic technique based on JPEG ghosts. Multimed. Tools Appl. 2023, 82, 14153–14169. [Google Scholar] [CrossRef] [PubMed]
  19. Li, W.; Yuan, Y.; Yu, N. Passive detection of doctored JPEG image via block artifact grid extraction. Signal Process. 2009, 89, 1821–1829. [Google Scholar] [CrossRef]
  20. Yao, H.; Xu, M.; Qiao, T.; Wu, Y.; Zheng, N. Image forgery detection and localization via a reliability fusion map. Sensors 2020, 20, 6668. [Google Scholar] [CrossRef]
  21. Bianchi, T.; De Rosa, A.; Piva, A. Improved DCT coefficient analysis for forgery localization in JPEG images. In Proceedings of the IEEE International Conference on Acoustics, Speech and Signal Processing (ICASSP), Prague, Czech Republic, 22–27 May 2011; pp. 2444–2447. [Google Scholar] [CrossRef]
  22. Kumari, R.; Garg, H. Image splicing forgery detection: A review. Multimed. Tools Appl. 2025, 84, 4163–4201. [Google Scholar] [CrossRef]
  23. Peng, J.; Liu, C.; Pang, H.; Gao, X.; Cheng, G.; Hao, B. GP-Net: Image manipulation detection and localization via long-range modeling and transformers. Appl. Sci. 2023, 13, 12053. [Google Scholar] [CrossRef]
  24. Sharma, D.K.; Singh, B.; Agarwal, S.; Garg, L.; Kim, C.; Jung, K.-H. A survey of detection and mitigation for fake images on social media platforms. Appl. Sci. 2023, 13, 10980. [Google Scholar] [CrossRef]
  25. Qazi, T.; Ali, M.; Hayat, K.; Magnier, B. Seamless copy-move replication in digital images. J. Imaging 2022, 8, 69. [Google Scholar] [CrossRef]
  26. Farhan, M.H.; Shaker, K.; Al-Janabi, S. Copy-move forgery detection in digital image forensics: A survey. Multimed. Tools Appl. 2024, 83, 70603–70635. [Google Scholar] [CrossRef]
  27. Ahmad, M.; Khursheed, F. Digital image forgery detection approaches: A review. In Applications of Artificial Intelligence in Engineering: Proceedings of First Global Conference on Artificial Intelligence and Applications (GCAIA 2020); Springer: Singapore, 2021; pp. 863–882. [Google Scholar] [CrossRef]
  28. Barglazan, A.A.; Brad, R.; Constantinescu, C. Image inpainting forgery detection: A review. J. Imaging 2024, 10, 42. [Google Scholar] [CrossRef] [PubMed]
  29. Mohammed, A. Deep fake detection and mitigation: Securing against AI-generated manipulation. J. Comput. Innov. 2024, 4, 1. [Google Scholar] [CrossRef]
  30. He, Z.; Liu, Z.; Zhao, Z. Forgery-aware guided spatial-frequency feature fusion for face image forgery detection. Symmetry 2025, 17, 1148. [Google Scholar] [CrossRef]
  31. Li, X.; Gunturk, B.; Zhang, L. Image demosaicing: A systematic survey. In Visual Communications and Image Processing 2008; SPIE: Bellingham, WA, USA, 2008; Volume 6822, pp. 489–503. [Google Scholar] [CrossRef]
  32. Falcón-López, S.A.; Tobarra, L.; Robles-Gómez, A.; Pastor-Vargas, R. Forensic analysis of manipulated images and videos. Appl. Sci. 2025, 15, 12664. [Google Scholar] [CrossRef]
  33. Wang, Y.; Liu, L.; Huang, T. Detection of image tampering using multiscale fusion and anomalousness assessment. In Image Processing, Electronics and Computers; IOS Press: Amsterdam, The Netherlands, 2024; pp. 260–270. [Google Scholar] [CrossRef]
  34. Man, Q.; Gee, S.-J.; Cho, Y.-I. Multi-domain perception transformer for generalized forgery image detection. Appl. Sci. 2026, 16, 533. [Google Scholar] [CrossRef]
  35. Hong, C.S.; Oh, T.G. TPR-TNR plot for confusion matrix. Commun. Stat. Appl. Methods 2021, 28, 161–169. [Google Scholar] [CrossRef]
  36. Yang, J.; Lan, G.; Xiao, S.; Li, Y.; Wen, J.; Zhu, Y. Enriching facial anti-spoofing datasets via an effective face swapping framework. Sensors 2022, 22, 4697. [Google Scholar] [CrossRef]
  37. Farid, H. Exposing digital forgeries from JPEG ghosts. IEEE Trans. Inf. Forensics Secur. 2009, 4, 154–160. [Google Scholar] [CrossRef]
  38. Novozamsky, A.; Mahdian, B.; Saic, S. IMD2020: A large-scale annotated dataset tailored for detecting manipulated images. In Proceedings of the IEEE/CVF Winter Conference on Applications of Computer Vision Workshops (WACVW), Snowmass Village, CO, USA, 1–5 March 2020; pp. 71–80. [Google Scholar] [CrossRef]
  39. Peng, J.; Li, Y.; Liu, C.; Gao, X. The circular U-Net with attention gate for image splicing forgery detection. Electronics 2023, 12, 1451. [Google Scholar] [CrossRef]
  40. Man, Q.; Cho, Y.-I. Exposing face manipulation based on generative adversarial network-transformer and fake frequency noise traces. Sensors 2025, 25, 1435. [Google Scholar] [CrossRef] [PubMed]
  41. Wan, D.; Cai, M.; Peng, S.; Qin, W.; Li, L. Deepfake detection algorithm based on dual-branch data augmentation and modified attention mechanism. Appl. Sci. 2023, 13, 8313. [Google Scholar] [CrossRef]
  42. Gokhale, A.L.; Thepade, S.D.; Aarons, N.R.; Pramod, D.; Kulkarni, R. AbhAS: A novel realistic image splicing forensics dataset. J. Appl. Secur. Res. 2022, 17, 80–102. [Google Scholar] [CrossRef]
  43. Chambino, L.L.; Silva, J.S.; Bernardino, A. Multispectral face recognition using transfer learning with adaptation of domain specific units. Sensors 2021, 21, 4520. [Google Scholar] [CrossRef] [PubMed]
  44. Mahdian, B.; Saic, S. Using noise inconsistencies for blind image forensics. Image Vis. Comput. 2009, 27, 1497–1503. [Google Scholar] [CrossRef]
  45. Mahdian, B.; Saic, S. Detection of resampling supplemented with noise inconsistencies analysis for image forensics. In Proceedings of the 2008 International Conference on Computational Sciences and Its Applications (ICCSA), Perugia, Italy, 30 June–3 July 2008; pp. 546–556. [Google Scholar] [CrossRef]
  46. Yang, R.; You, K.; Pang, C.; Luo, X.; Lan, R. CSTAN: A deepfake detection network with CST attention for superior generalization. Sensors 2024, 24, 7101. [Google Scholar] [CrossRef] [PubMed]
  47. Noorizadegan, A.; Chen, C.-S.; Cavoretto, R.; De Rossi, A. Efficient truncated randomized SVD for mesh-free kernel methods. Comput. Math. Appl. 2024, 164, 12–20. [Google Scholar] [CrossRef]
  48. Casciola, G.; Montefusco, L.B.; Morigi, S. Edge-driven Image Interpolation using Adaptive Anisotropic Radial Basis Functions. J. Math. Imaging Vis. 2010, 36, 125–139. [Google Scholar] [CrossRef]
  49. Gunawan, T.S.; Hanafiah, S.A.M.; Kartiwi, M.; Ismail, N.; Za’bah, N.F.; Nordin, A.N. Development of photo forensics algorithm by detecting Photoshop manipulation using Error Level Analysis. Indones. J. Electr. Eng. Comput. Sci. 2017, 7, 131–137. [Google Scholar] [CrossRef]
  50. Rana, M.M.R.; Rahman, M.A.; Talukder, K.H. FIDD-1500: Fake image detection dataset. In Proceedings of the 26th International Conference on Computer and Information Technology (ICCIT), Cox’s Bazar, Bangladesh, 13–15 December 2023; pp. 1–6. [Google Scholar] [CrossRef]
  51. Zhang, J.; Tohidypour, H.R.; Nasiopoulos, P.; Liu, L.; Wang, Z.; Cao, E.; Ladenegan, O. Leveraging Bayer pattern analysis for authenticity detection of real and fake images. In Proceedings of the 2024 International Conference on Computational Science and Computational Intelligence (CSCI), Las Vegas, NV, USA, 11–13 December 2024; pp. 15–25. [Google Scholar] [CrossRef]
  52. Dai, G.; Chen, K.; Huang, L.; Chen, L.; An, D.; Wang, Z.; Wang, K. CECL-Net: Contrastive learning and edge-reconstruction-driven complementary learning network for image forgery localization. Electronics 2024, 13, 3919. [Google Scholar] [CrossRef]
  53. Hong, J.; Luo, Y.; Mou, M.; Fu, J.; Zhang, Y.; Xue, W.; Xie, T.; Tao, L.; Lou, Y.; Zhu, F. Convolutional neural network-based annotation of bacterial type IV secretion system effectors with enhanced accuracy and reduced false discovery. Brief. Bioinform. 2020, 21, 1825–1836. [Google Scholar] [CrossRef] [PubMed]
  54. Hao, S.; Li, S. A weighted mean absolute error metric for image quality assessment. In 2020 IEEE International Conference on Visual Communications and Image Processing (VCIP); IEEE: Piscataway, NJ, USA, 2020; pp. 330–333. [Google Scholar] [CrossRef]
Figure 1. The illusion of the beach battle: a seamless digital fight forgery crafted to perfection.
Jsan 15 00040 g001
Figure 2. Examples of common image manipulations from FIDD-6000: Row (a) shows copy-move, Row (b) splicing, Row (c) retouching, and Row (d) inpainting. Columns include the original images, manipulated versions, and binary masks highlighting tampered areas for each forgery type.
Jsan 15 00040 g002
Figure 3. Examples of tampered images from different benchmark datasets: (a) copy-move from SMIFD [9], (b) cut-paste from Columbia Color [4], (c) copy-move from CASIA [3], (d) deepfake from Celeb-DF [40], (e) splicing from IMD2020 [38], and (f) inpainting from the Wild Web dataset [39].
Jsan 15 00040 g003
Figure 4. Workflow of the FIDD-6000 dataset development process, showing image collection from social media platforms, pre-processing, binary mask generation, annotation, verification, and final dataset construction.
Jsan 15 00040 g004
Figure 5. Representative samples from the FIDD-6000 dataset, covering diverse manipulation types including copy-move, splicing, retouching, and inpainting. The examples highlight variations in scene content, editing complexity, and manipulation motives, demonstrating the dataset’s broad coverage and suitability for benchmarking forgery detection under realistic social media conditions.
Jsan 15 00040 g005
Figure 6. Distribution of authentic and manipulated images in the FIDD-6000 dataset, showing the proportion of original (16%) and tampered (84%) images.
Jsan 15 00040 g006
Figure 7. Composition of manipulated images in the FIDD-6000 dataset, showing the percentage share of splicing, copy-move, and retouching operations.
Jsan 15 00040 g007
Figure 8. Comparative summary of the 15 classical forgery localization algorithms evaluated on FIDD-6000, including their main input parameters, analysis procedures, detection objectives, decision rule, and reported performance. The colors represent different thresholds of manipulation, with each color indicating the extent of the manipulation detection. The red frames highlight areas that show a significant change or manipulation when compared to the original image.
Jsan 15 00040 g008
Figure 9. Manipulated image detection from the FIDD-6000 dataset. Column 1 shows the original images, and Column 2 shows the corresponding binary ground-truth masks, where 1 represents manipulated regions and 0 represents authentic regions. Column 3 presents the localization outputs from four different algorithms: ADQ1 [13], ADQ2 [19], Ghosts [18], and BAG [19]. The heatmaps in Column 3 highlight the regions identified by each algorithm as tampered. The colors in the thermal-like images represent different levels of heat detected in the subjects. The warmer colors (e.g., red, orange, and yellow) highlight areas of higher intensity, while the cooler colors (e.g., blue and green) represent areas of lower intensity. These color-coded heatmaps help visualize the variations in the subjects’ features. The comparison across methods demonstrates how different algorithms identify and localize forged regions with varying levels of precision and sensitivity.
Jsan 15 00040 g009
Figure 10. Representative examples of failure cases in manipulation localization from the FIDD-6000 dataset. Column 1 presents the original tampered images, while Column 2 shows the corresponding binary ground-truth masks that highlight the tampered regions. Column 3 illustrates the outputs of selected forensic localization methods. The rows correspond to the following algorithms (from top to bottom): ELA [17], Resampling [16], CFA1 [14], and NOI [15]. In Column 3, the heatmaps represent the areas identified by each algorithm as manipulated, with warmer colors (e.g., red, orange, and yellow) indicating higher confidence in the detection of forgery. These examples demonstrate the limitations of the methods, where certain small or subtle manipulations may be missed or misclassified by the algorithms, highlighting the challenges in achieving accurate localization in such cases.
Jsan 15 00040 g010
Figure 11. ROC analysis of 15 image forgery detection algorithms using Kolmogorov–Smirnov statistic.
Jsan 15 00040 g011
Figure 12. Spider plot comparing TPR, F1-score, MCC, and IoU of the 15 image forgery detection algorithms on FIDD-6000.
Jsan 15 00040 g012
Figure 13. Comparison of TPR and FPR of 15 forgery detection algorithms on the FIDD-6000 dataset. ADQ1 and Ghost (manual) achieve the highest TPR values, indicating stronger sensitivity to manipulated images, whereas ELA shows the lowest FPR but also the weakest TPR, reflecting under-detection. Overall, the figure highlights the trade-off between forgery sensitivity and false alarm rate across all evaluated methods.
Jsan 15 00040 g013
Table 1. Comparison of different image manipulation datasets.
Dataset
(Short Name)
Release
Year
Tampering
Types
Original
/Fake
Typical
Image Size
FormatsRealistic?Binary
Masks?
Post-
Processing
in Set
ColorMain
Drawback
CASIA v1.0 [3]2009Splicing451/462384 × 256JPEGModerate
(lab splices)
NoLimited
(JPEG,
boundary
softening)
ColorLow resolution,
no masks,
limited variety.
CASIA v2.0 [3]2009/
2013
Splicing,
Copy-Move
7491/5123
(12,614 total)
∼240 × 160
to
900 × 600
BMP/TIFF/
JPEG/PNG
ModerateNoMixed
compression
and edits
Color/
Gray
No masks,
heterogeneous
quality;
still mostly
lab-made edits.
Columbia
Uncompressed
(DVMM) [4]
2006Splicing95/88757 × 568
and
1152 × 768
TIFF
(uncompressed)
High
(manual
Photoshop)
YesMinimal
(little/no
compression)
ColorOnly splicing;
smaller scale;
little social media
degradation.
Columbia Color
& Gray [4]
2009 (Color);
2009 (Gray)
Splicing180/183
(color); ≈933
912 blocks
(gray)
Color:
757 × 568 and
1152 × 768;
Gray:
128×128
JPEG (color);
BMP (gray)
Moderate
(lab)
Color: yes;
gray: no
MinimalColor
and
Gray
Gray set is
block-level
(not full images);
limited realism;
older content.
MICC-F220 [36]2011Copy-Move110/110∼722 × 480
to
800 × 600
JPEGModerateNoTransforms
(T/R/S)
ColorNo pixel masks;
lower resolutions;
focused only
on CMFD.
MICC-F600 [36]2013–2014Copy-Move440/160
(+160 GT
masks)
∼800 × 533
to
3888 × 2592
JPEG, BMPHigh
(hand-made,
realistic)
Yes
(for
tampered)
Varied edits
to blend
ColorClass imbalance;
CMFD
only.
MICC-F2000 [36]2011Copy-Move1300/7002048 × 1536JPEGModerateNoTransforms
(T/R/S)
ColorNo pixel masks;
fixed resolution.
COVERAGE [2]2016Copy-Move
with SGO
100 original–
forged pairs
Varied;
∼4 × 105 px
avg.
JPEGHigh
(SGO
ambiguity)
Yes
(dup/
forged
masks)
Rotation,
scaling,
illumination,
etc.
ColorSmall; CMFD-only
but challenging
due to SGO.
NIST16/
Nimble’16 [37]
2016Splicing,
Copy-Move,
Removal/
Inpainting
Ref. originals
+ 564
forged
High-res
(avg. ≈
3460 × 2616)
Mostly
JPEG
(varied)
HighYesHeavy
(compression,
resizing,
etc.)
ColorAccess/licensing;
distribution skew;
not all social media
artifacts.
NIST16/
Nimble’16 [37]
2016Splicing,
Copy-Move,
Removal/
Inpainting
Ref. originals
+ 564 forged
High-res
(avg. ≈
3460 × 2616)
Mostly
JPEG
(varied)
HighYesHeavy
(compression,
resizing, etc.)
ColorAccess/licensing;
distribution skew;
not all
CoMoFoD [5]2013–2014Copy-Move260/260 base
sets (+13,520
small and 3120
large
post-processed
variants)
512 × 512
(200 sets) and
3000 × 2000
(60 sets)
PNG/JPEGModerate
–high
Yes
(two
masks/set)
JPEG,
blur, noise,
color changes
ColorCMFD-only;
synthetic
post-processing
dominates.
Wild Web
(WEB) [39]
2016Splicing in
the Wild
0/13,577
unique web
images
(evaluation on
80 cases/90
sub-cases;
101 masks)
VariedWeb formatsVery high
(real-world)
Yes
(per case
/sub-case)
Uncontrolled
(as-found)
ColorNo clean
originals for
many items;
de-dup/
attribution
issues.
IMD2020
(real-life
subset) [38]
2020Splicing,
Copy-Move,
Removal
≈2010/2010
(real-life pairs)
Varied;
real camera
JPEG/PNG
(varied)
High
(real-life)
YesAs-found
(OSN-like)
ColorHeterogeneous
sources; extended
set mixes
synthetic and real.
Celeb-DF
(video) [40]
2020Face-Swap
Deepfakes
590 real/5639
fake videos
Varied
video res.
MP4High
(improved
synthesis)
NoGeneration and
compression
artifacts
ColorVideo-only
(image frames
need extraction);
celebrity-domain
bias.
DFDC
(video) [41]
2020Face-Swap
Deepfakes
>100k videos
(paid actors)
VariedMP4HighNoMany generation
pipelines and
re-encodes
ColorVideo-only;
huge size
and computational cost;
licensing.
AbhAS [42]2020Splicing
(Realistic)
NR publiclyVariedJPEG
(typical)
High
(realistic
splices)
UnclearRealistic
manual edits
ColorSize details not
clearly public;
access via paper.
SMIFD-1000 [9]2022Splicing,
Copy-Move,
Retouching
(Social Media)
Total 1000
(split NR)
Social media
resolutions
(varied)
Mixed web
formats
Very high
(in the wild)
Yes
(pixel-level),
+ motive
metadata
OSN transforms
(compression,
resizes, filters)
ColorReal-world
noise can
confound
classic
methods;
some metadata
missing.
Table 2. Classical image forgery localization algorithms evaluated in this study.
AlgorithmPrincipleStrengthsWeaknesses
ADQ1 [13]Detect aligned double JPEG compression via DCT histogram periodicity [21]Simple and fast; effective for double-compressed areasWeak when the full image is recompressed
ADQ2 [19]Statistical double JPEG detectorBetter localization than ADQ1Assumes partial double compression
ADQ3 [13]Bayesian double JPEG localizationSensitive to subtle tamperingComputationally expensive; prone to false alarms after platform recompression
BAG [19]Block artifact grid inconsistency detectionEffective for shifted splicesWeak if grids align or are globally recompressed
CAGI [20]Content-aware JPEG grid inconsistency detectionSuppresses some false positivesNeeds strong grid anomalies
CFA1 [14]Single-feature demosaicing inconsistency analysisFast and interpretableCoarse localization; sensitive to compression
CFA2 [14]Fine-grained CFA probability mappingBetter localization for multi-camera splicesWeak when camera patterns are similar
DCT [21]Frequency-domain coefficient anomaly analysisDetects several compression-related editsSensitive to texture and threshold choice
ELA [17]Recompress-and-difference heuristicEasy visual interpretationHigh false positives; unreliable after uniform recompression
GHO [18]JPEG ghost localization at guessed qualityPrecise when compression histories differLess useful after global recompression
JPEG Ghosts [18]Multi-quality automated ghost analysisNo prior quality knowledge neededComputationally slow; noisy maps possible
NADQ [8]Non-aligned double JPEG detectionEffective for shifted gridsWeak when grids align
NOI [15]Noise inconsistency segmentationGeneral-purpose and intuitiveOver-segmentation in textured regions
NVI [15]Local noise variance estimationSensitive to subtle noise changesCompression artifacts can interfere
Resampling [16]Detection of interpolation periodicityUseful for geometric manipulationsPlatform downsampling can hide local traces
Table 3. Descriptive statistics of the FIDD-6000 dataset, including distribution of authentic vs. manipulated images, manipulation types, and average pixel-level tampered areas.
CategoryNumber of ImagesPercentage (%)Avg. Tampered Pixels (%)
Authentic Images100016%
Manipulated Images (Total)500084%15–20%
   Splicing225045% of manipulated∼25%
   Copy-Move175035% of manipulated∼12%
   Retouching100020% of manipulated∼5%
Total Dataset Size6000100%
Table 4. Parameters of the 15 classical forgery localization algorithms used in the evaluation of FIDD-6000.
AlgorithmInput Feature/ParameterAnalysis ProcedureDetection ObjectiveDecision RuleScore
ADQ1JPEG quantization analysisDetect abnormal quantization stepsFlag recompression T 0.7 manipulated, otherwise authentic83.3%
ADQ2Quantization step extractionAnalyze step size inconsistencyDetect recompression T 0.7 manipulated, otherwise authentic70.0%
ADQ3DCT coefficient analysisCompare statistical distributionsIdentify manipulation T 0.7 manipulated, otherwise authentic75.2%
BAGImage blocking analysisDetect grid misalignmentReveal copy-move/splicing T 0.7 manipulated, otherwise authentic71.0%
CAGIChromatic aberration extractionCompare across regionsDetect inconsistencies T 0.7 manipulated, otherwise authentic74.5%
CFA1CFA artifact detectionCompare interpolation patternsIdentify altered regions T 0.7 manipulated, otherwise authentic55.4%
CFA2CFA sampling pattern analysisCheck periodicity changesDetect manipulation T 0.7 manipulated, otherwise authentic63.3%
DCTDCT coefficient extractionAnalyze coefficient distributionDetect tampering T 0.7 manipulated, otherwise authentic69.8%
ELAError amplificationMeasure local recompression differencesHighlight edited regions T 0.7 manipulated, otherwise authentic30.5%
GHOGamma correction estimationCompare gamma across regionsDetect forgery T 0.7 manipulated, otherwise authentic78.0%
JPEG GhostsRecompress image at multiple qualitiesCompare residual differencesExpose altered areas T 0.7 manipulated, otherwise authentic65.2%
NADQQuantization noise analysisDetect abnormal noise patternsIdentify manipulation T 0.7 manipulated, otherwise authentic60.4%
NOINoise pattern extractionCompare sensor-noise consistencyDetect tampering T 0.7 manipulated, otherwise authentic58.7%
NVILocal noise variance calculationAnalyze irregular varianceReveal edits T 0.7 manipulated, otherwise authentic65.8%
ResamplingInterpolation pattern detectionAnalyze periodic artifactsDetect geometric manipulation T 0.7 manipulated, otherwise authentic52.3%
Table 5. Comparison between commonly reported benchmark dataset performance and FIDD-6000 performance for the evaluated forgery localization algorithms. Best values in the FIDD-6000 dataset results are shown in bold.
AlgorithmCommonly Reported Benchmark DatasetTypical Reported Performance on Benchmark DatasetTPR (%)FPR (%)PrecisionF1-ScoreMCCAvg. Time (s)IoU (%)
ADQ1CASIA/Columbia/NIST16Strong under double-JPEG conditions83.321.40.9510.780.5200.2475.2
ADQ2CASIA/Columbia/NIST16Strong under aligned double-JPEG conditions70.024.50.9350.740.3500.2869.3
ADQ3CASIA/Columbia/NIST16Competitive on JPEG recompression benchmarks75.218.10.9540.750.44814.372.8
BAGColumbia/CASIAEffective for block-grid inconsistency detection71.015.30.9590.720.4271.568.5
CAGIColumbia/CASIA/NIST16Improved over BAG in controlled settings74.512.00.9690.780.4863.674.0
CFA1Columbia/CASIAEffective when CFA traces are preserved55.410.20.9640.570.3370.1056.2
CFA2Columbia/CASIAMore accurate than coarse CFA analysis in benchmark settings63.313.50.9590.610.3732.962.1
DCTCASIA/ColumbiaCompetitive for compression-related anomaly analysis69.827.00.9280.620.3300.0865.4
ELACASIA/mixed web-image benchmarksOften useful as a heuristic visual indicator30.55.10.9680.270.2150.0628.7
Ghost (manual)Columbia/CASIAStrong when different JPEG histories are present78.017.80.9560.760.4814.766.5
Ghosts (auto)Columbia/CASIAModerate to strong on recompression-based benchmarks65.222.40.9360.590.3234.764.1
NADQCASIA/Columbia/NIST16Effective for non-aligned double-JPEG detection60.49.00.9710.630.3831.361.8
NOICASIA/Columbia/IMD-style benchmarksModerate when noise inconsistency is preserved58.711.60.9620.600.3510.1059.4
NVICASIA/Columbia/IMD-style benchmarksModerate under controlled noise conditions65.819.40.9440.600.3502.163.2
ResamplingCASIA/Columbia/copy-move benchmarksEffective when interpolation traces remain detectable52.313.70.9500.530.2890.0850.4
Disclaimer/Publisher’s Note: The statements, opinions and data contained in all publications are solely those of the individual author(s) and contributor(s) and not of MDPI and/or the editor(s). MDPI and/or the editor(s) disclaim responsibility for any injury to people or property resulting from any ideas, methods, instructions or products referred to in the content.