Abstract
In Japan, natural disasters occur frequently. Serious disasters may cause damage to traffic networks and telecommunication infrastructures, leading to the occurrence of isolated disaster areas. In this article, unmanned aerial vehicles (UAVs) are used for data collection instead of unavailable ground-based stations in isolated disaster areas. Detailed information about the damage situation will be collected from the user equipment (UE) by a UAV through a fly–hover–fly procedure, and then will be sent to the disaster response headquarters for disaster relief. However, mission completion time minimization becomes a crucial task, considering the requirement of rapid response and the battery constraint of UAVs. Therefore, the author proposed a three-dimensional UAV flight trajectory, discussing the optimal flight altitude and placement of hovering points by transforming the original problem of K-means clustering into a location set cover problem (LSCP) that can be solved via a genetic algorithm (GA) approach. The simulation results have shown the feasibility of the proposed method to reduce the mission completion time.
1. Introduction
In Japan, natural disasters such as earthquakes, tsunamis and typhoons occur frequently. These disasters may cause significant damage to communication infrastructure such as base stations and cables. In 2011, approximately 29,000 base stations were reported to be shut down after the Great East Japan Earthquake [1]. In addition, damages to access to the outside world result in the occurrence of isolated disaster areas [2]. Due to the cutoff of the national highway, Yamamoto, Miyagi, was completely isolated until 4 days after the disaster [3].
Because of the difficulty in obtaining disaster information from the isolated disaster areas, the early deployment of rescue teams is hindered. Therefore, it is necessary to introduce communication systems which do not rely on existing communication infrastructures on the ground.
Non-terrestrial networks (NTNs), which include platforms operating between 0.1 and 2000 km altitudes such as unmanned aerial vehicles (UAVs), high-altitude platforms (HAPs), low-earth-orbit satellites (LEO), etc., are nowadays popular as post-disaster communication solutions. For non-real-time temporary data collection missions in isolated disaster areas [4], the use of UAVs, which are also commonly known as drones, is considered suitable because of their low cost, high mobility, and high flexibility.
2. Related Works
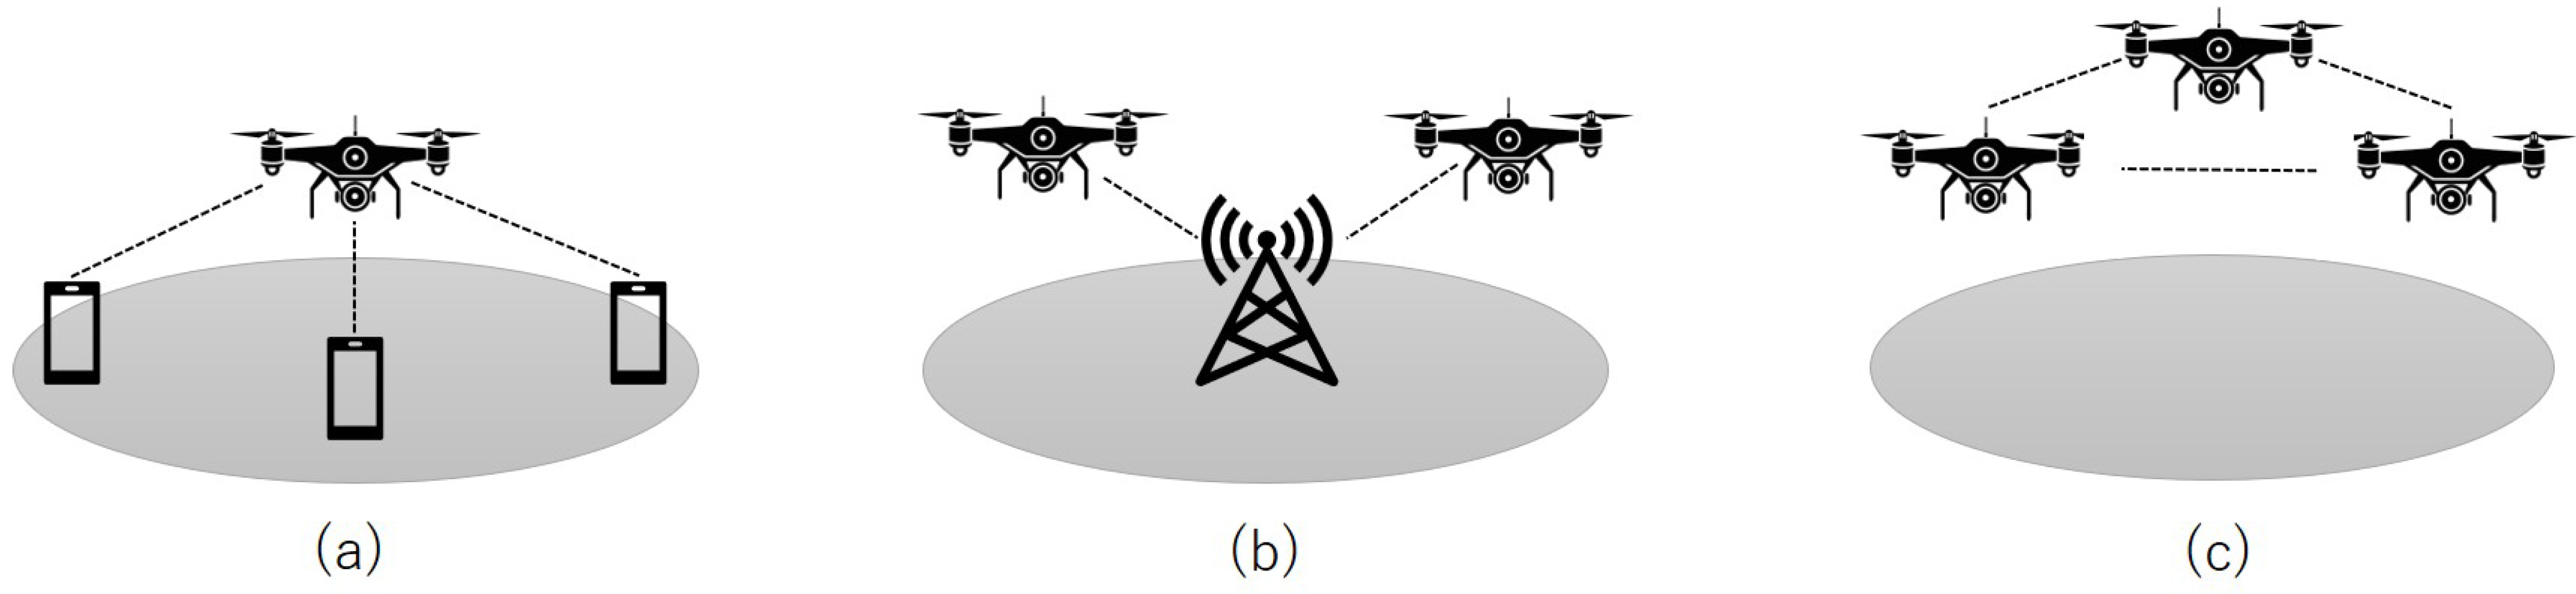
UAVs offer significant potential for wireless communication applications [5,6,7,8]. In general, wireless interfaces are compatible with various types of UAVs and can operate on both unlicensed Wi-Fi and licensed cellular frequency bands. Equipping UAVs with wireless communication capabilities paves the way for a wide range of new application domains, owing to the nature of technical enablers, e.g., channel modeling for aerial networks [6] and edge AI [9]. Within these domains, UAVs can typically assume one of three primary communication roles, as illustrated in Figure 1: (a) Aerial base stations (or access points)—UAVs can be deployed to provide wireless networking and communication services in specific geographic areas [10]. (b) UAVs as UE (user equipment) nodes—UAVs can utilize existing infrastructure (such as cellular networks or Wi-Fi) to communicate with each other or with ground-based devices [11]. (c) Aerial networks: UAVs can form an aerial network for specific applications, e.g., extending the coverage and enhancing the reliability of existing wireless networks [12], sensor network aggregators [13], post-disaster surveillance [14], or even a sensor network itself for localization purpose of ground-based wireless emitters [15]. Not only restricted to theoretical works, the practicality of UAV-based networks was also partially evaluated in field experiments [9,16,17].
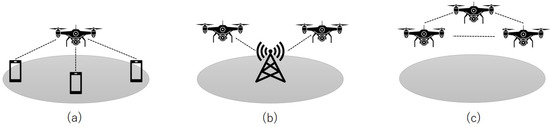
Figure 1.
UAV-based wireless communication networks. (a) UAVs as flying BS; (b) UAVs as UE; (c) UAVs as aerial NW.
This paper focuses on the first scenario, which attempts to establish an aerial network to gather sensing data from IoT devices or smartphones in isolated post-disaster areas. UAV-based data collection has been discussed in several previous studies as summarized in Table 1. In [18], the article dealt with the issue of improving rural connectivity. Path planning and UAV relays were conducted to improve quality in rural areas. Unfortunately, the paper only focused on the connectivity. In [19], the authors considered an obstacle-aware deployment of a UAV, where path optimization in obstacle-heavy environments was conducted. The UAV in this paper was employed as a relay rather than a data collector as considered in this paper. In [20], the authors proposed a disaster monitoring system via multi-UAV coordination. The paper only focused on UAV coordination but did not consider how to optimize data collection. In [21], a UAV-based surveillance system was introduced where multi-UAV collaboration was achieved via Deep Reinforcement Learning (DRL). Since this system was specific to surveillance, it is not generally applicable to the scenario of data collection considered in this paper.

Table 1.
Related works.
There were also works that focused on the use of UAVs for data collection. The author of [14] optimized the two-dimensional trajectory with the multi-armed bandit (MAB) algorithm, considering the energy consumption of the UAV and the UEs, to maximize the throughput. In [22], the throughput maximization problem was transformed to a constrained Markov decision-making process (CMDP), considering the energy consumption of the UEs. In addition, the author of [23] aimed to minimize mission completion time by optimizing the transmission power of UEs and the flight trajectory. In [24], flight altitude, trajectory, velocity and link scheduling were considered for completion time minimization. Unfortunately, all these works were restricted to the 2D optimization of trajectory as compared to the 3D trajectory optimization in this paper. The relation between the flight altitude and the coverage is shown in [25], where higher altitude brings larger coverage via a high-altitude platform (LAP) rather than a UAV. In [26], three-dimensional locations of the UAV are decided with K-means clustering, without a discussion of data transmission. In [27], a three-dimensional trajectory is optimized to maximize the energy efficiency, considering the presence of wind. The author of [28] proposed a maximal weighted area (MWA) algorithm to solve the three-dimensional placement problem of UAV base stations. Unfortunately, these works did not discuss the completion time or the time restriction of collecting data.
Different from the above-mentioned conventional works, in this article, we focus on the 3D optimization of the flight altitude of the UAV, examining the completion time reduction effect by adopting the three-dimensional trajectory and a scheduling mechanism to minimize the time required for the data collection process.
3. System Architecture
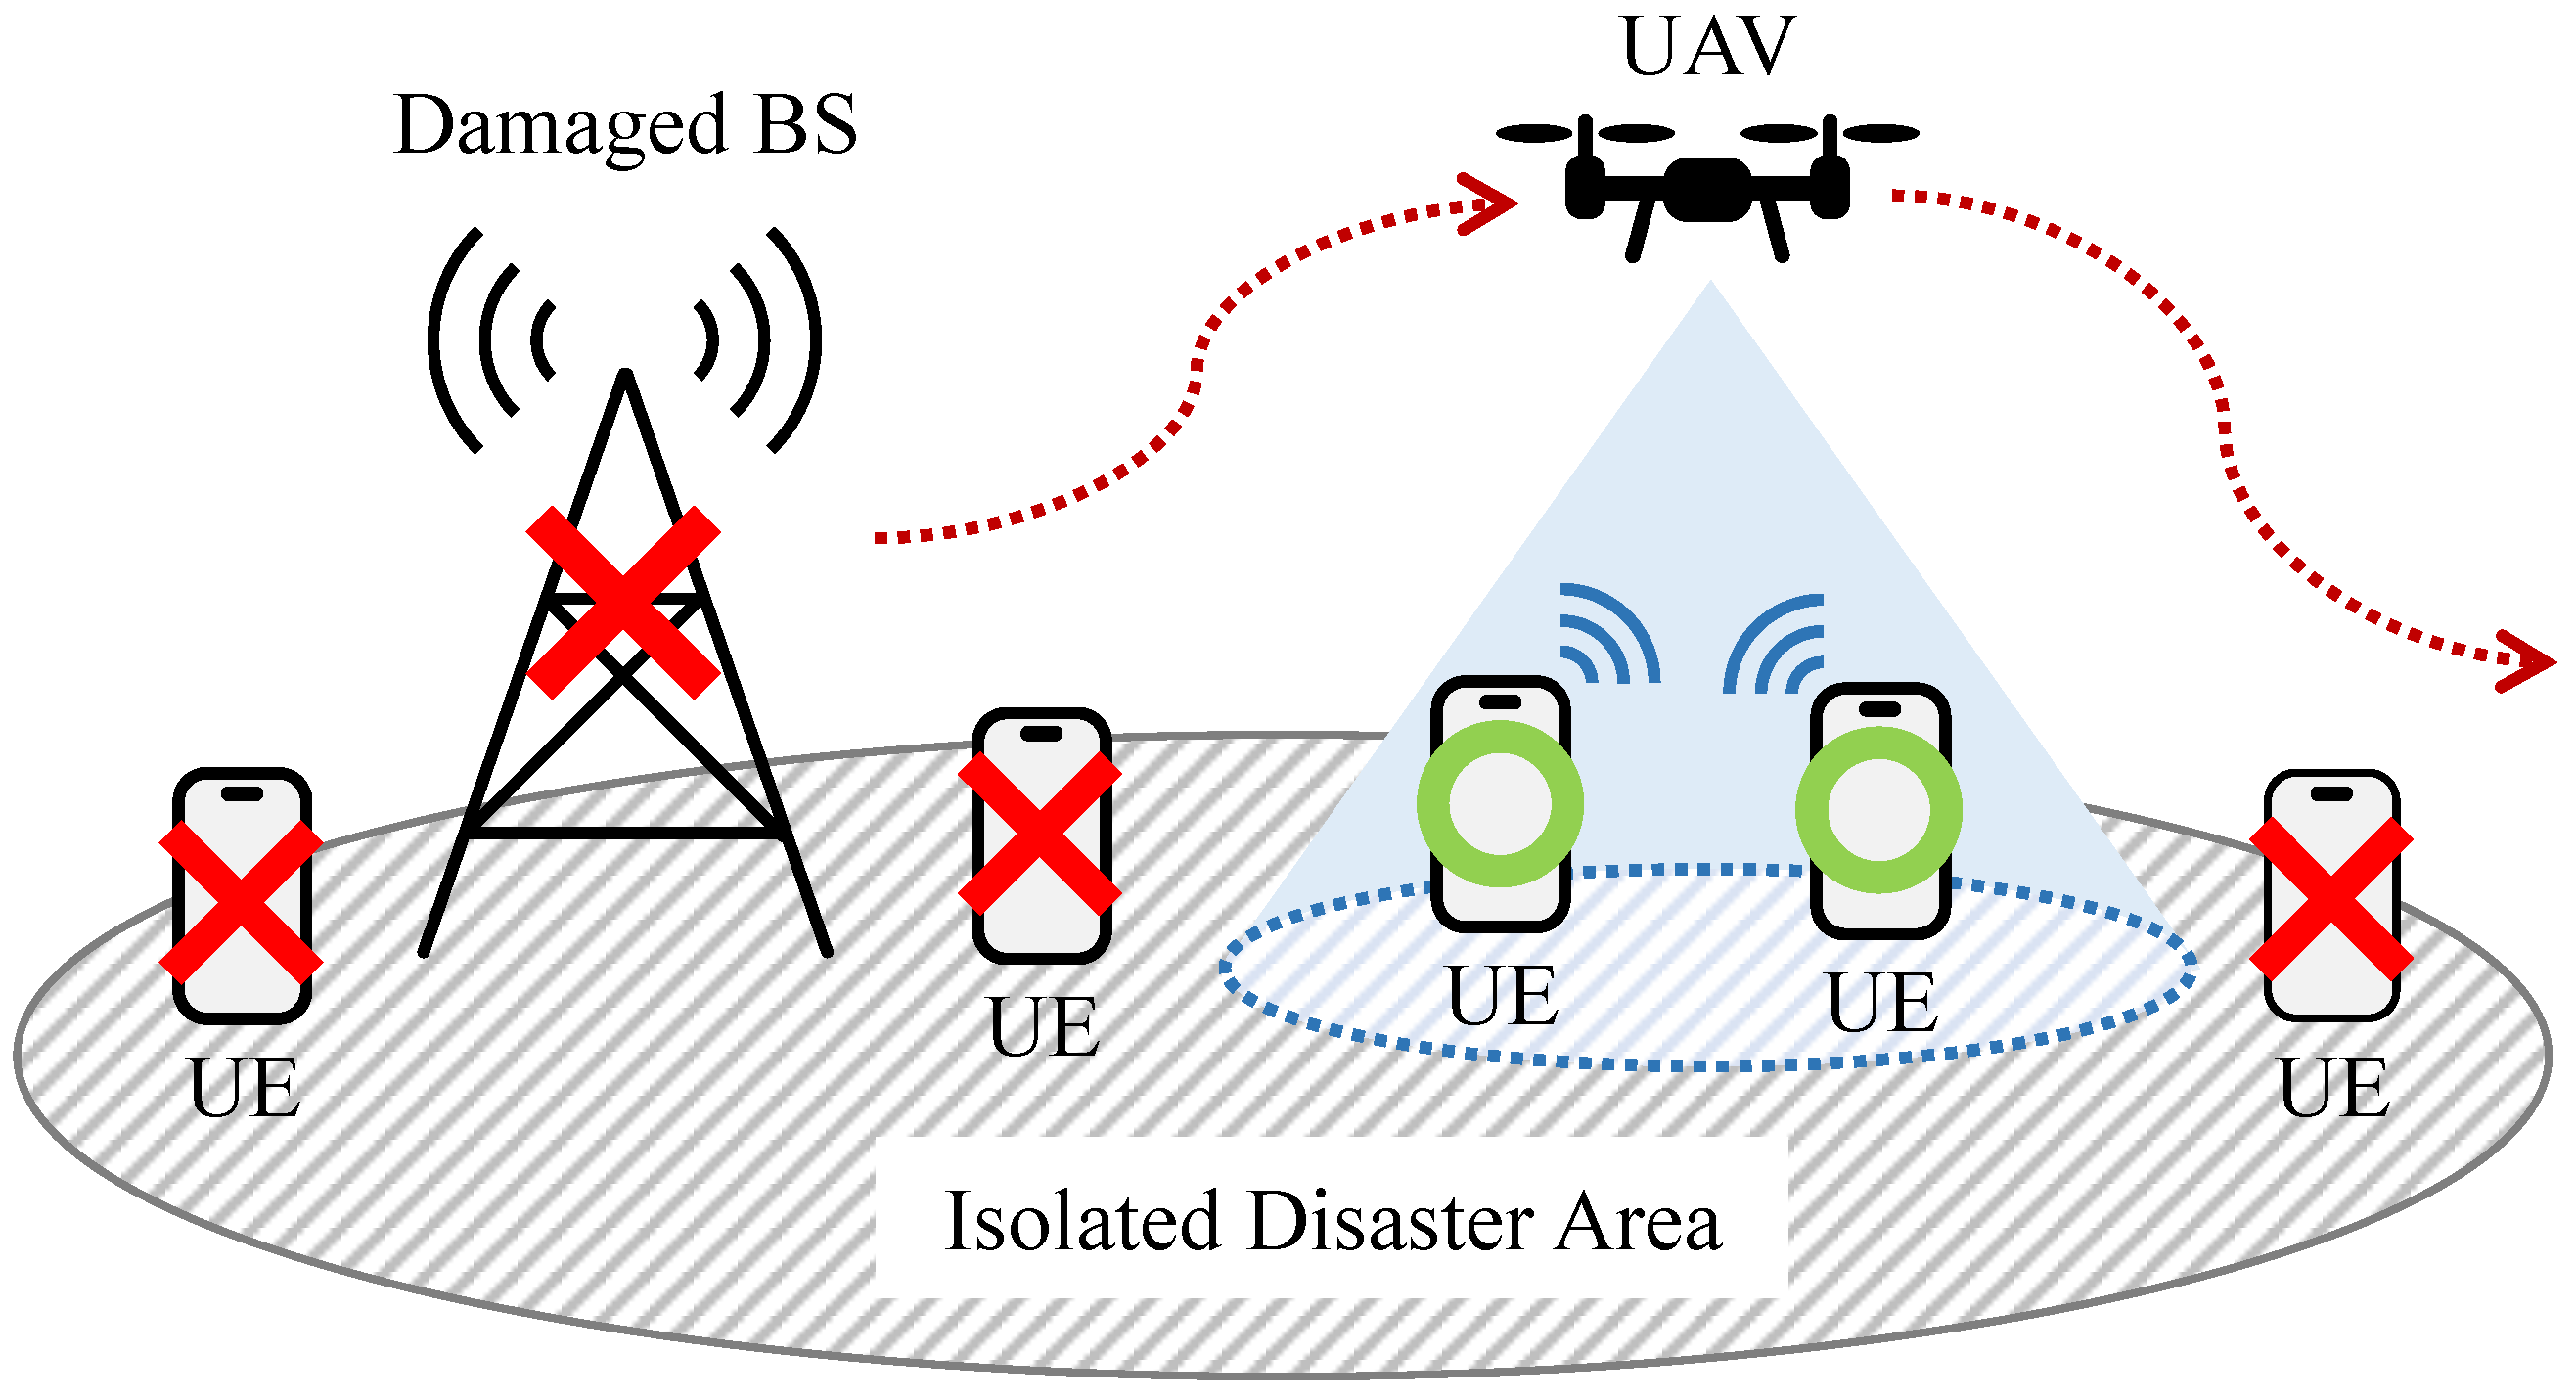
As shown in Figure 2, the simulation scenario in this article is that a single UAV collects data from user equipment (UE) such as smartphones and tablets owned by users in the isolated disaster area.
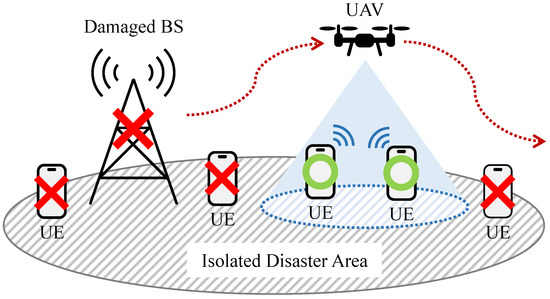
Figure 2.
Overview of the system.
The UAV is assumed to collect data from the UEs when hovering, and there is no data transmission between the UAV and the UEs during flight. This assumption was made due to the challenges in maintaining stable and efficient data collection from multiple UEs. In related research where data is collected from a single UE at one time, it is relatively simple to establish and maintain the communication link between the UAV and the UE. However, when multiple UEs are involved, the movement of the UAV causes frequent changes in coverage area, leading to intermittent and potentially inefficient data collection. Therefore, this assumption allows us to simplify the system and ensure more reliable communication between the UAV and multiple UEs.
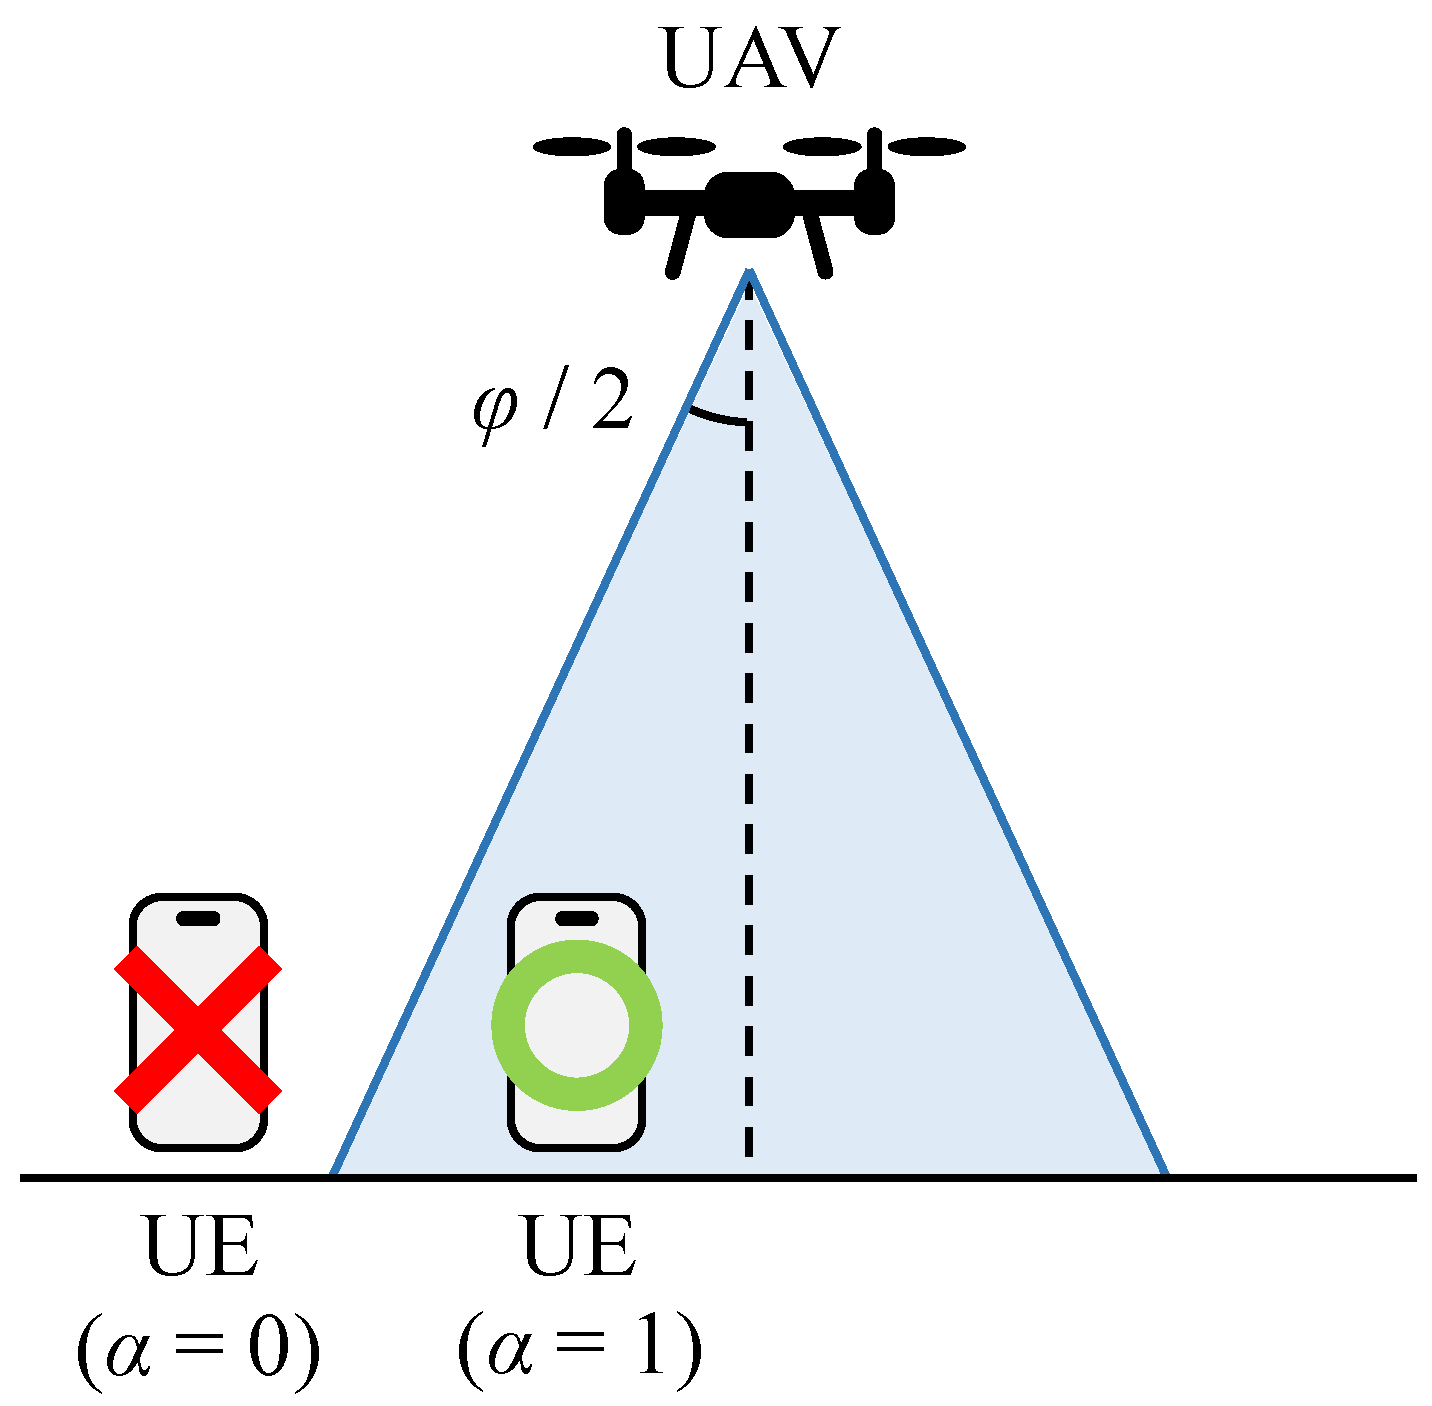
As shown in Figure 3, the three-dimensional trajectory proposed by this article optimizes the UAV’s flight altitude. In areas with dense UE distributions, the UAV’s flight altitude is increased to achieve a larger coverage area. In contrast, in areas with scattered UE distributions, the UAV’s flight altitude is reduced to achieve higher throughput.
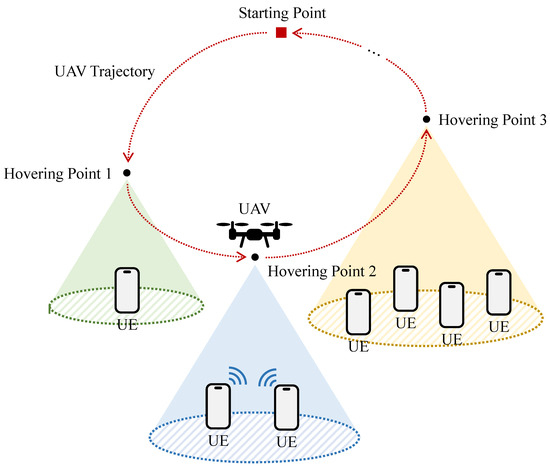
Figure 3.
Process of the UAV-based data collection mission.
The detailed process of the data collection mission is shown below:
- 1.
- Collect location information from UEs using other systems such as HAPS, LEO, etc. [29,30,31,32,33];
- 2.
- The UAV departs from the starting point;
- 3.
- The UAV flies to the next hovering point;
- 4.
- The UAV collects data from all covered UEs;
- 5.
- Repeat 3~4 until all UEs’ data is collected;
- 6.
- The UAV returns to the starting point;
- 7.
- Send the collected data to the disaster response headquarters.
Note that for simplicity, 1 and 7 are not covered in this article.
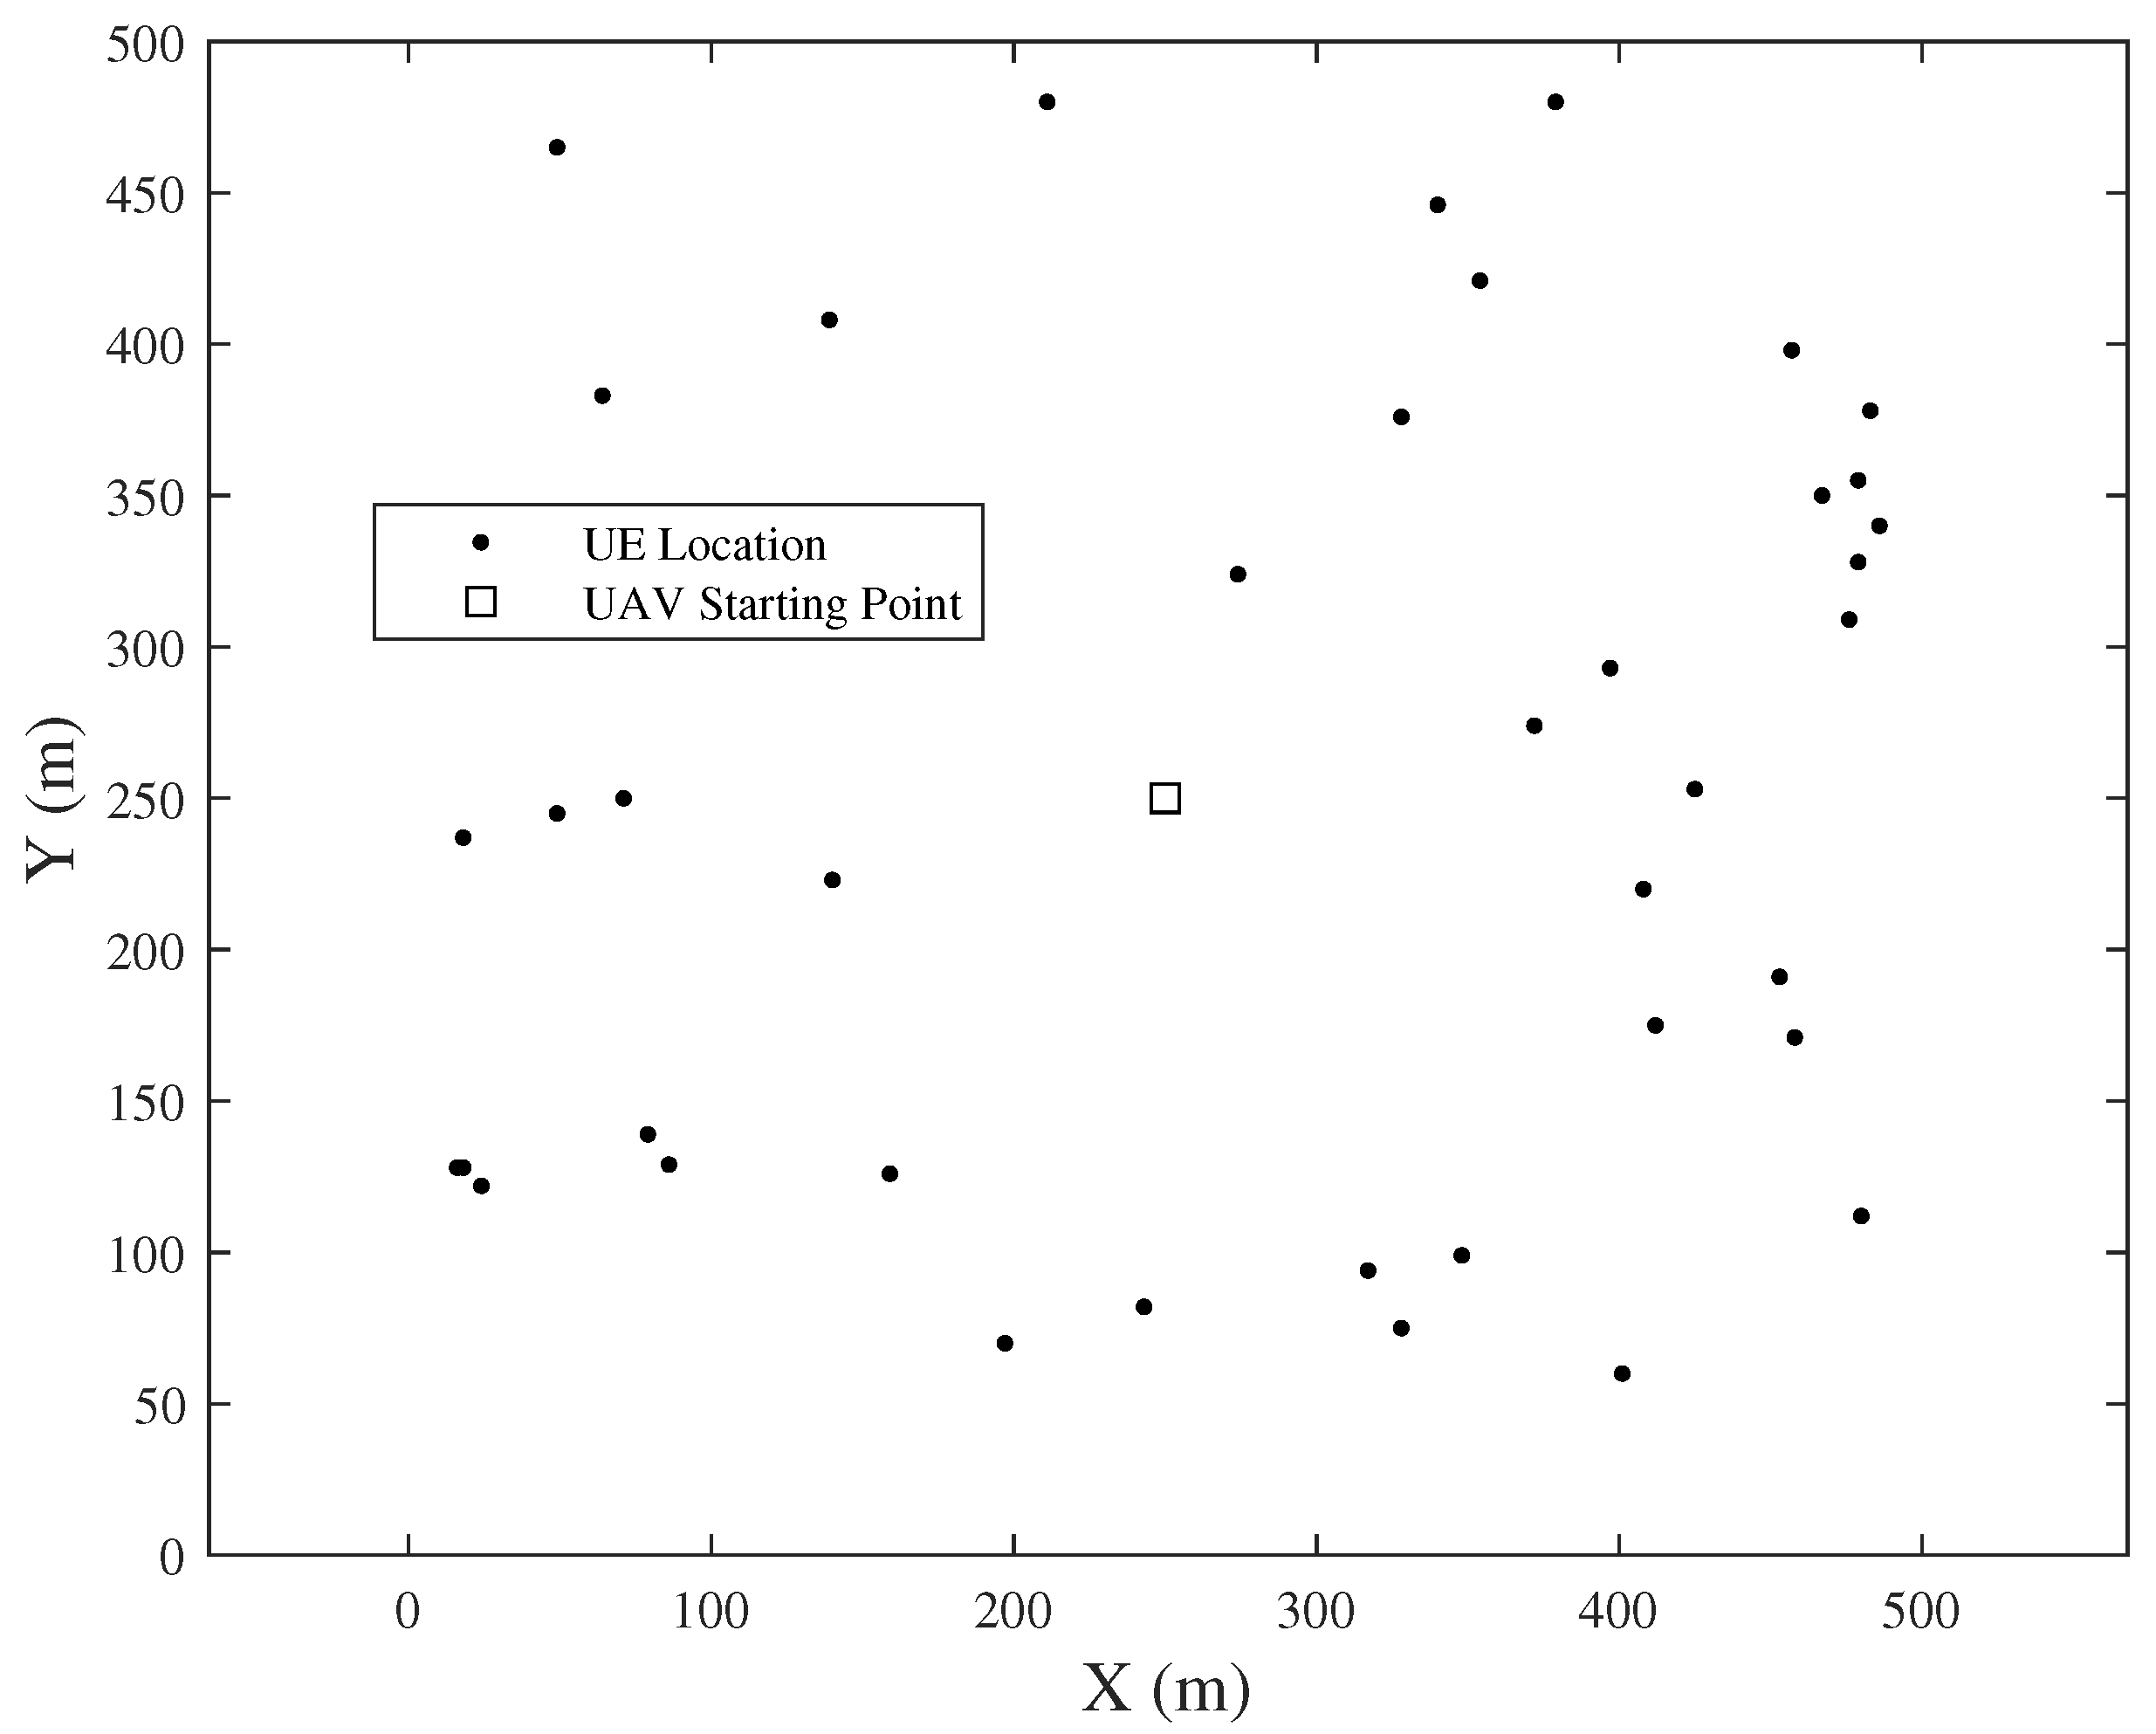
For simulation, a m flat urban area is assumed as the simulation environment. As shown in Figure 4, M UEs are randomly distributed in this area. The starting point of the UAV is set in the center of the area as , and the location of the UAV at time t is assumed as , while the location of the -UE is assumed as . Note that for simplicity, the UEs are assumed not to change their location.
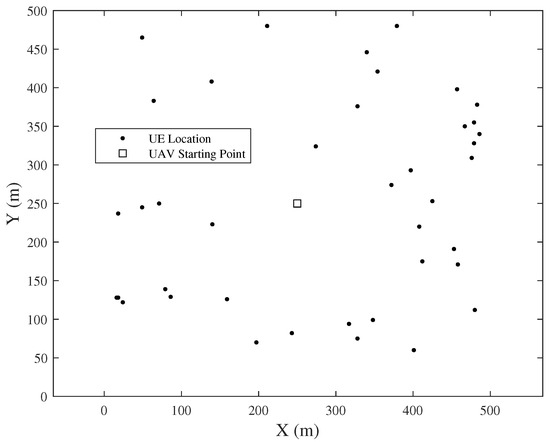
Figure 4.
Sample of UE distribution (.)
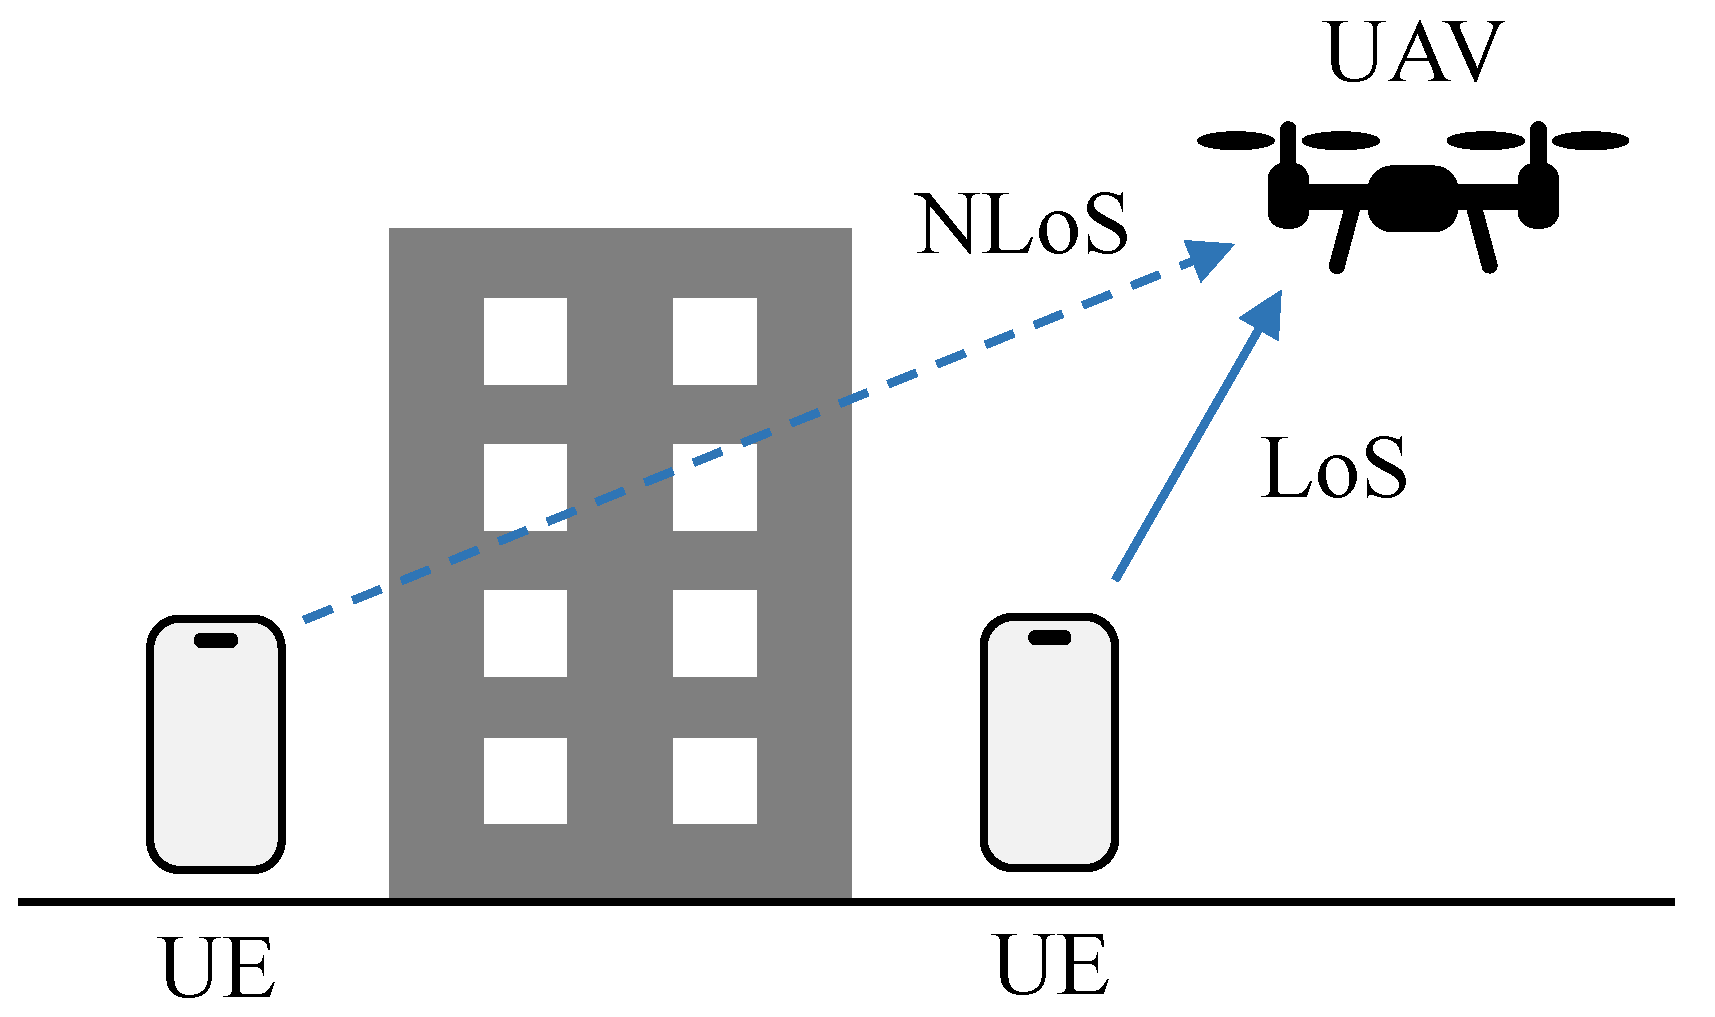
We adopt the 2.4 GHz band for data transmission, because it can be easily integrated with the hardware of UEs nowadays. For simplicity, the shape of the buildings is ignored. Thus, the data transmission model between the UAV and the UEs is defined with the possibilities of Line-of-Sight (LoS) and Non-Line-of-Sight (NLoS) propagation. As shown in Figure 5, LoS propagation occurs only when there is no obstacle between the UAV and the UE.

Figure 5.
LoS and NLoS propagation.
The LoS and NLoS propagation losses between the UAV and the m-UE at time t, are given below:
where is the free space propagation loss (FSPL) [34], , are the LoS and NLoS excessive loss, respectively, and is the Euclidean distance between the UAV and the m-UE at time t. From these equations, the longer the distance, the higher the propagation loss becomes.
According to [25], the probabilities of LoS and NLoS propagation , are given below:
where a, b are environment S-curve parameters, and is the elevation angle from the m-UE to the UAV.
Thus, the propagation loss between the UAV and the m-UE at time t can be calculated by
From the Shannon–Hartley Theorem [35], the maximum data rate between the UAV and the m-UE at time t can be calculated by
where and respectively denote the transmit power of the m-UE and the noise power at the UAV’s receiver, B is the system bandwidth, and is an indicator decided by the connection status between the UAV and m-UE as depicted in Figure 6, which is defined as below:
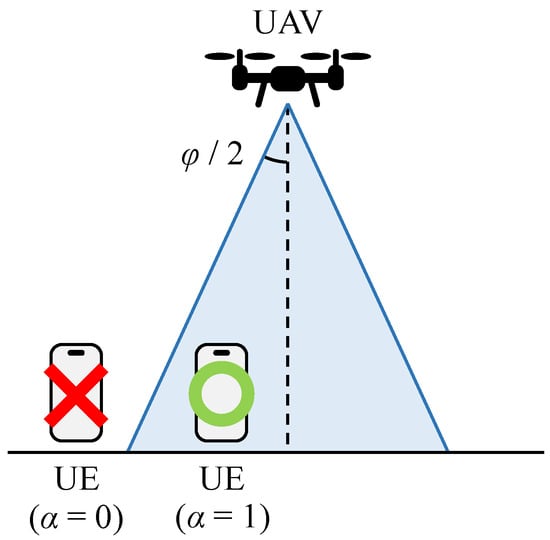
Figure 6.
Connection status between the UAV and the UE.
In other words, the data rate is zero when the m-UE is in idle mode or sleep mode.
In addition, the simulation parameters used in this article are shown in Table 2.
Table 2.
Simulation parameters.
4. Numerical Analysis Methods
The three-dimensional trajectory optimization is divided into 2 parts: hovering point placement and trajectory decision. The locations of the hovering points are decided by the distribution of the UEs. In our proposed approach, the optimization of the hovering points is conducted in two sequential phases, where the genetic algorithm and the hill climbing algorithm are applied separately but collaboratively as follows. First, to search for the 2D optimal location of the hovering points that cover the maximum number of UEs in an LSCP, a genetic algorithm (GA) is adopted and the search scope is the whole mission area. However, to keep the search scope manageable, we limited the search scope to the maximum altitude, which is 150m in this work. Once the 2D location of the hovering points are decided, the hill climbing (HC) algorithm, which is known as a local search algorithm, is used to search for better locations with lower altitude near the result of a location set covering problem (LSCP). This phase improves the spectral efficiency. While the GA focuses on the coverage efficiency that minimizes the number of hovering points, the HC attempts to improve spectral efficiency by reducing the transmission time while hovering. After the hovering points are decided, the trajectory which passes through all hovering points with the minimum time needs to be decided, which can be considered as a classic traveling salesman problem (TSP). The TSP is a well-known problem where a list of locations is given and there is a search for the shortest route that visits each location once and finally returns to the starting point. In our work, the UAV must visit all the hovering points to collect data from the UEs, and our goal is to minimize the mission completion time. Considering a constant flying speed of UAV, the scenario in our work closely resembles that of the TSP and can be solved with similar approaches used to solve the TSP.
4.1. K-Means Clustering for Placement of Hovering Points
K-means clustering is known as a non-hierarchical cluster analysis method, classifying multiple elements into k clusters. K-means has been adopted by related studies to UAV communication networks, such as [36], where it is used to solve the placement problem of multiple UAV base stations. In this article, K-means is considered feasible to solve the placement problem of the UAV hovering points.
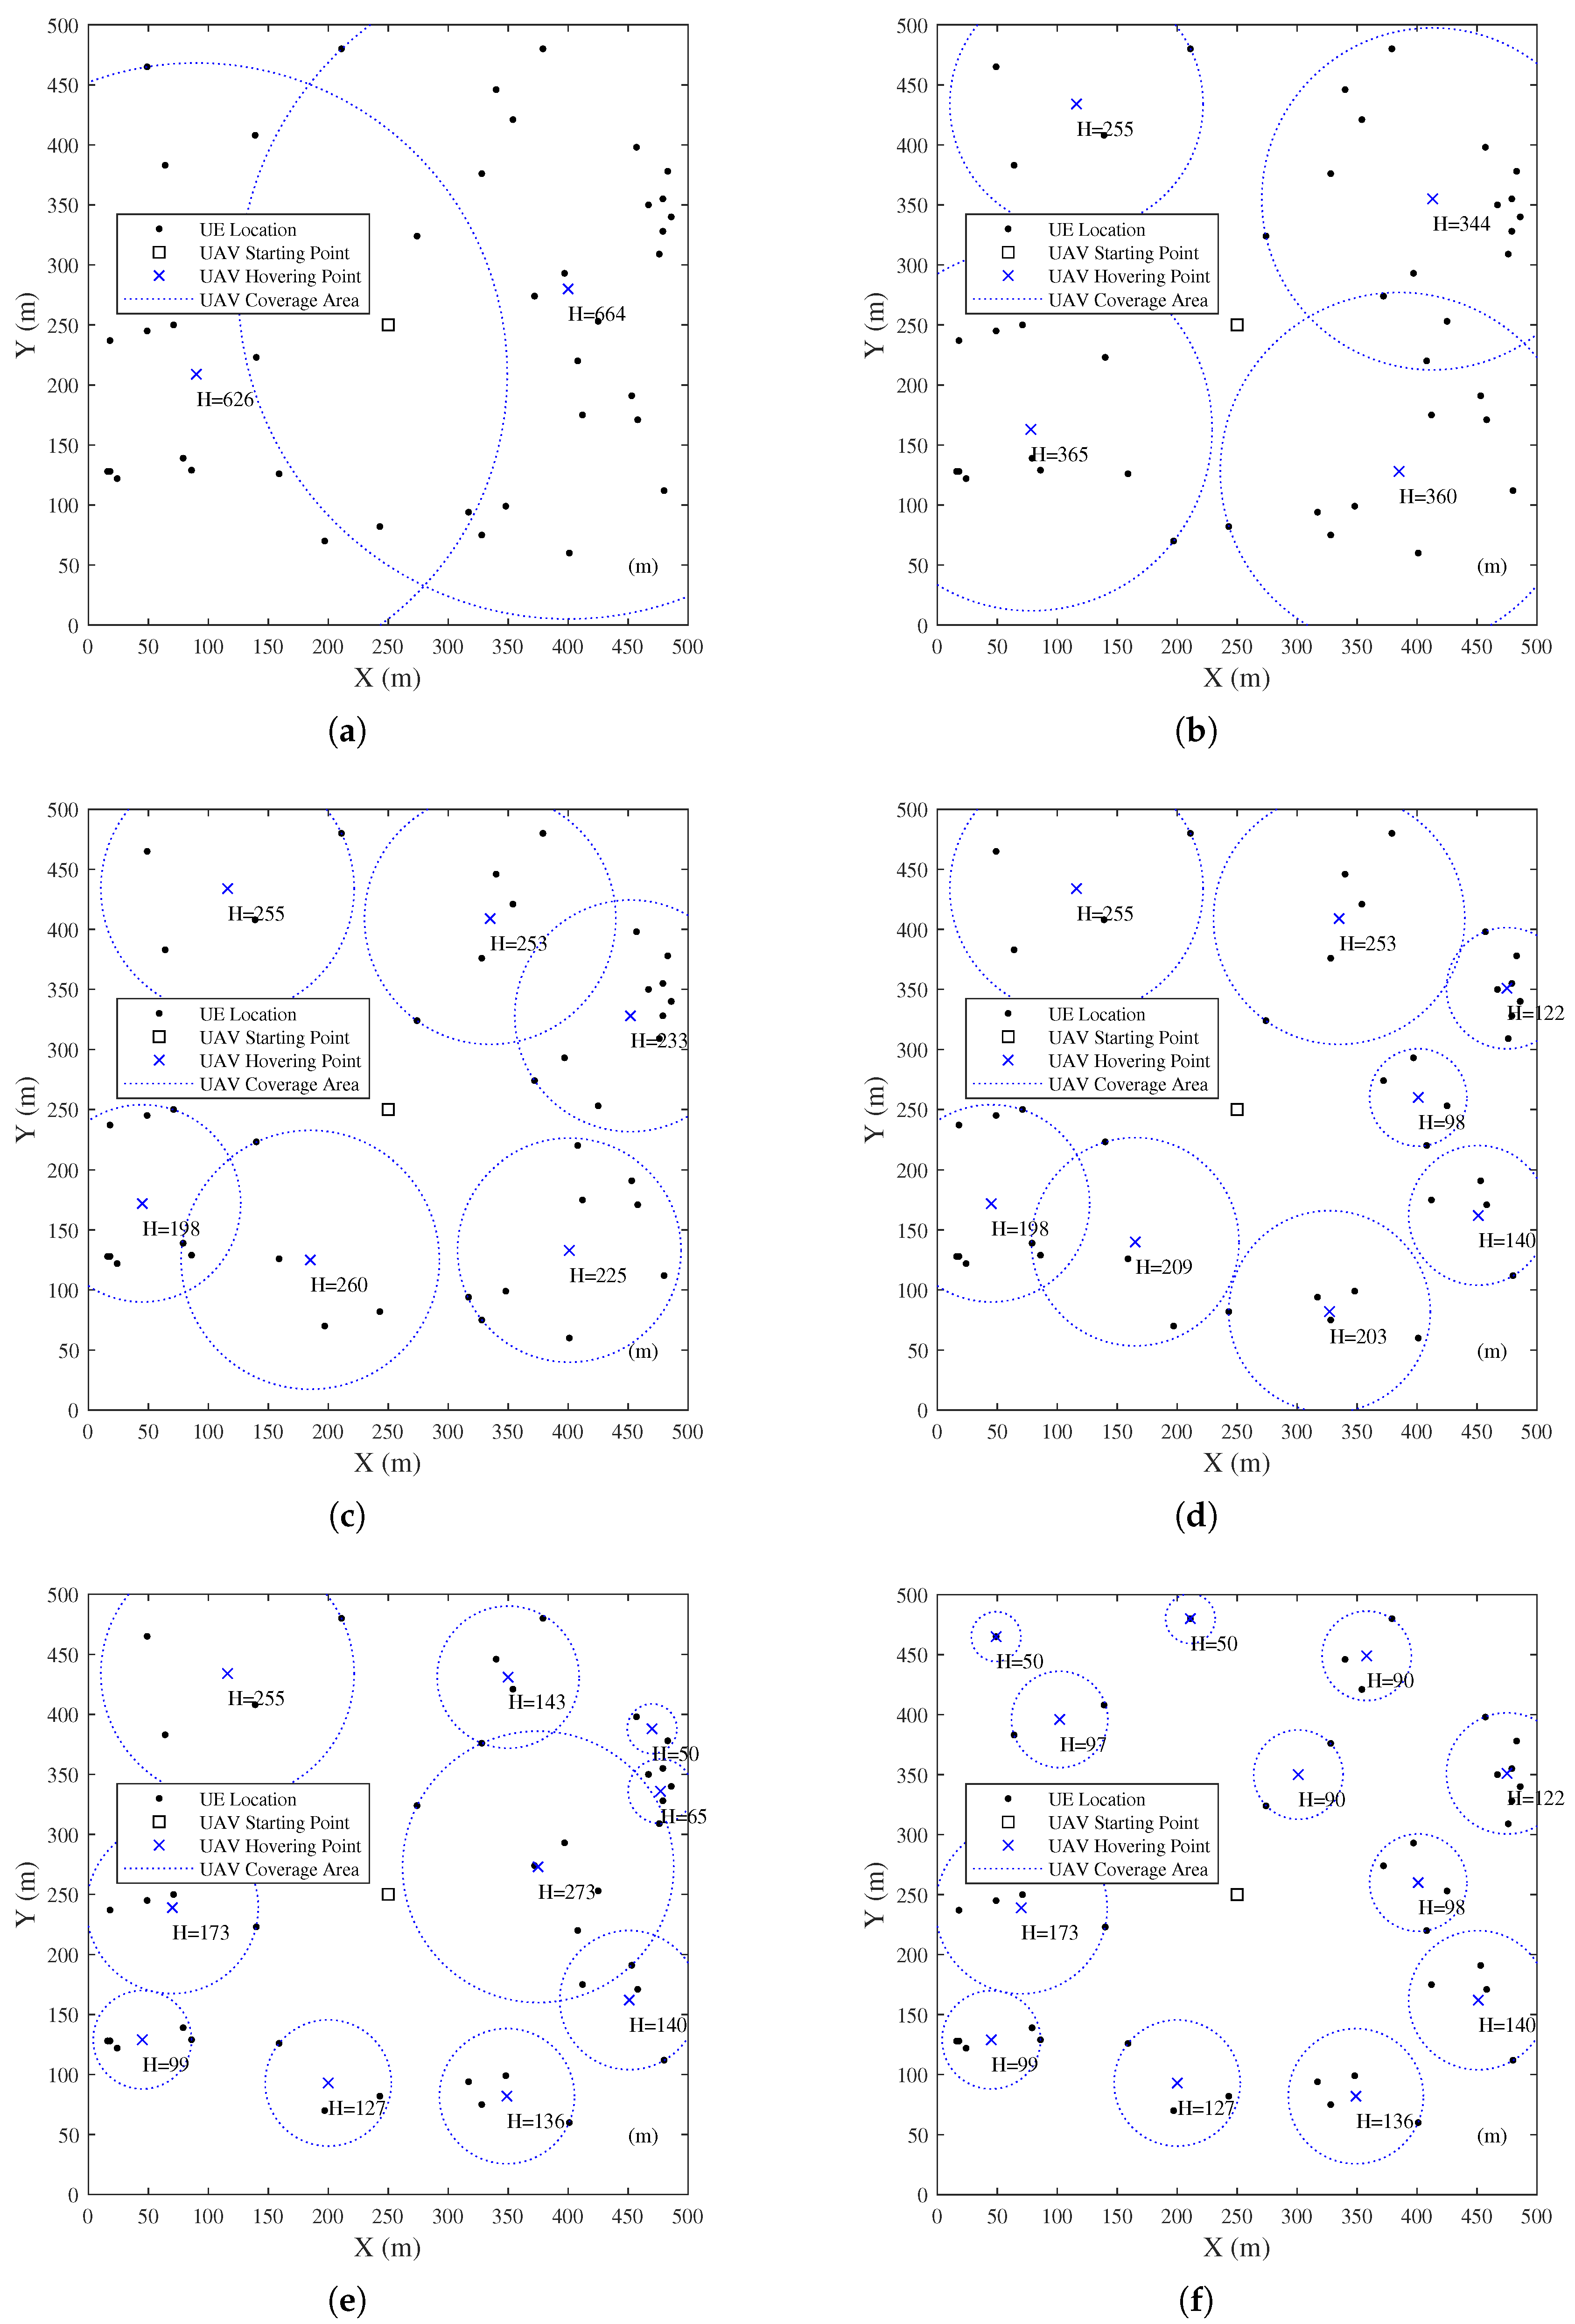
We now apply K-means to the UE distribution shown in Figure 4; the UE clustering by K-means with a varying number of clusters k is shown in Figure 7. The dotted circles represent the required coverage area to cover all UEs belonging to each cluster, while the locations of the hovering points are assumed as the center points of the clusters. However, it is suggested from [36] that the center points of the clusters are not the optimal locations for the hovering points. As shown in Figure 7, there are empty areas with no UE covered in the coverage areas. To enhance the transmission efficiency, a geometric method, the minimum inclusion circle, was introduced by [36], but it only works when the UEs are all on the same plane.
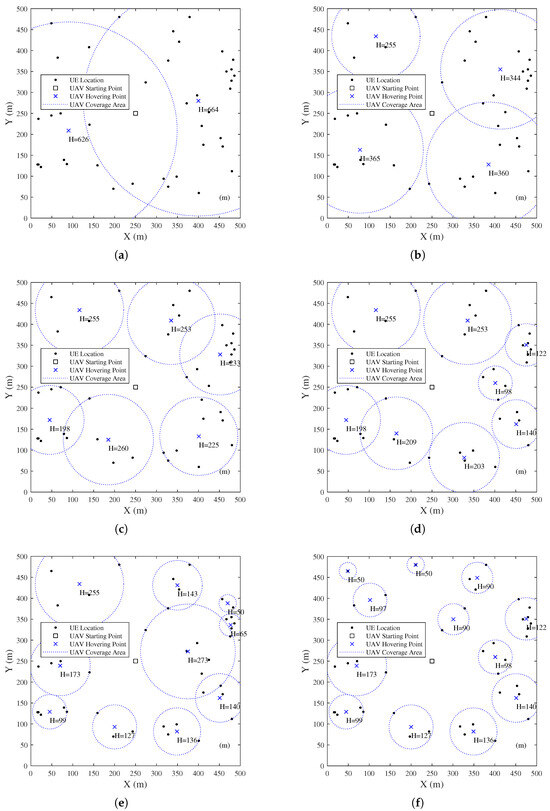
Figure 7.
UE Clustering by K-means: (a) (b) (c) (d) (e) (f) .
In this article, we proposed searching for the optimal location of hovering points through numerical computation. The hill climbing algorithm (HC), a simple local search method, is adopted. Minimum SNRs between the UAV and the UEs from each candidate point are calculated. And then the location of the hovering points is updated to the new location with the largest minimum SNR, until the minimum SNR does not change any more.
However, the K-means clustering has 2 critical problems:
- For realistic problems, the number of clusters k is often difficult to determine in advance.
- Conditions such as the limitation of the UAV’s flight altitude, which is 150 m according to the law in Japan, are hard to include. As shown in Figure 7, the flight altitude is too high when k is small.
Therefore, we proposed a sequential K-means clustering method to search for the minimum k. If the result of the UE clustering satisfies the condition of the UAV’s flight altitude, the present k will be adopted. Otherwise, the operation will continue by increasing k.
4.2. Genetic Algorithm for Placement of Hovering Points
To fundamentally solve the problems of traditional clustering methods, we transform the hovering point placement problem to a location set covering problem (LSCP) [37], which is commonly used to solve the placement problems of public facilities. The definition of the LSCP is given as follows:
According to the definition of the LSCP, the problem can be described as searching for the minimum number of hovering points that enable the coverage of all UEs in a certain area. The coverage radius of the facility is defined as the maximum coverage radius of the UAV, which is 62.132 m, based on the limitation of the UAV’s flight altitude in this article.
The basic strategy to solve the LSCP in this article is the greedy algorithm, which continues to select the location of the hovering point that can cover the largest number of UEs until all UEs have been covered. In the LSCP, the minimum set of hovering points that cover all UEs needs to be determined, and the greedy algorithm can provide an approximate solution with relatively low computational complexity, taking into account the post-disaster scenarios in this paper.
Although the method that calculates all candidate points is simple for implementation, a large number of candidates are needed to obtain an accurate solution, requiring huge amounts of calculations.
Therefore, in this section, we use the genetic algorithm (GA) to search for the optimal locations for hovering points. In this paper, the GA is used to efficiently search for optimal hovering points that cover the maximum number of UEs while maintaining manageable computational complexity. Compared to exhaustive search, which requires evaluating a large number of candidate points, especially in a three-dimensional range, where the number of candidates would significantly increase when the size of the mission area is enlarged, GA provides an approximate solution with less computational complexity and effectively avoids local optima. The genetic algorithm is a search algorithm based on the principles of biological evolution, incorporating genetic operations such as selection, crossover, and mutation.
- Selection
Roulette wheel selection is adopted for selection. The probability of the individual i being selected is given as follows:
where is the fitness function of i, which is defined as the number of UEs that can be covered from the location indicated by i. Parents of the next generation are selected according to the magnitude of the fitness function. Individuals with better fitness functions are more likely to survive in the next generation.
- Crossover
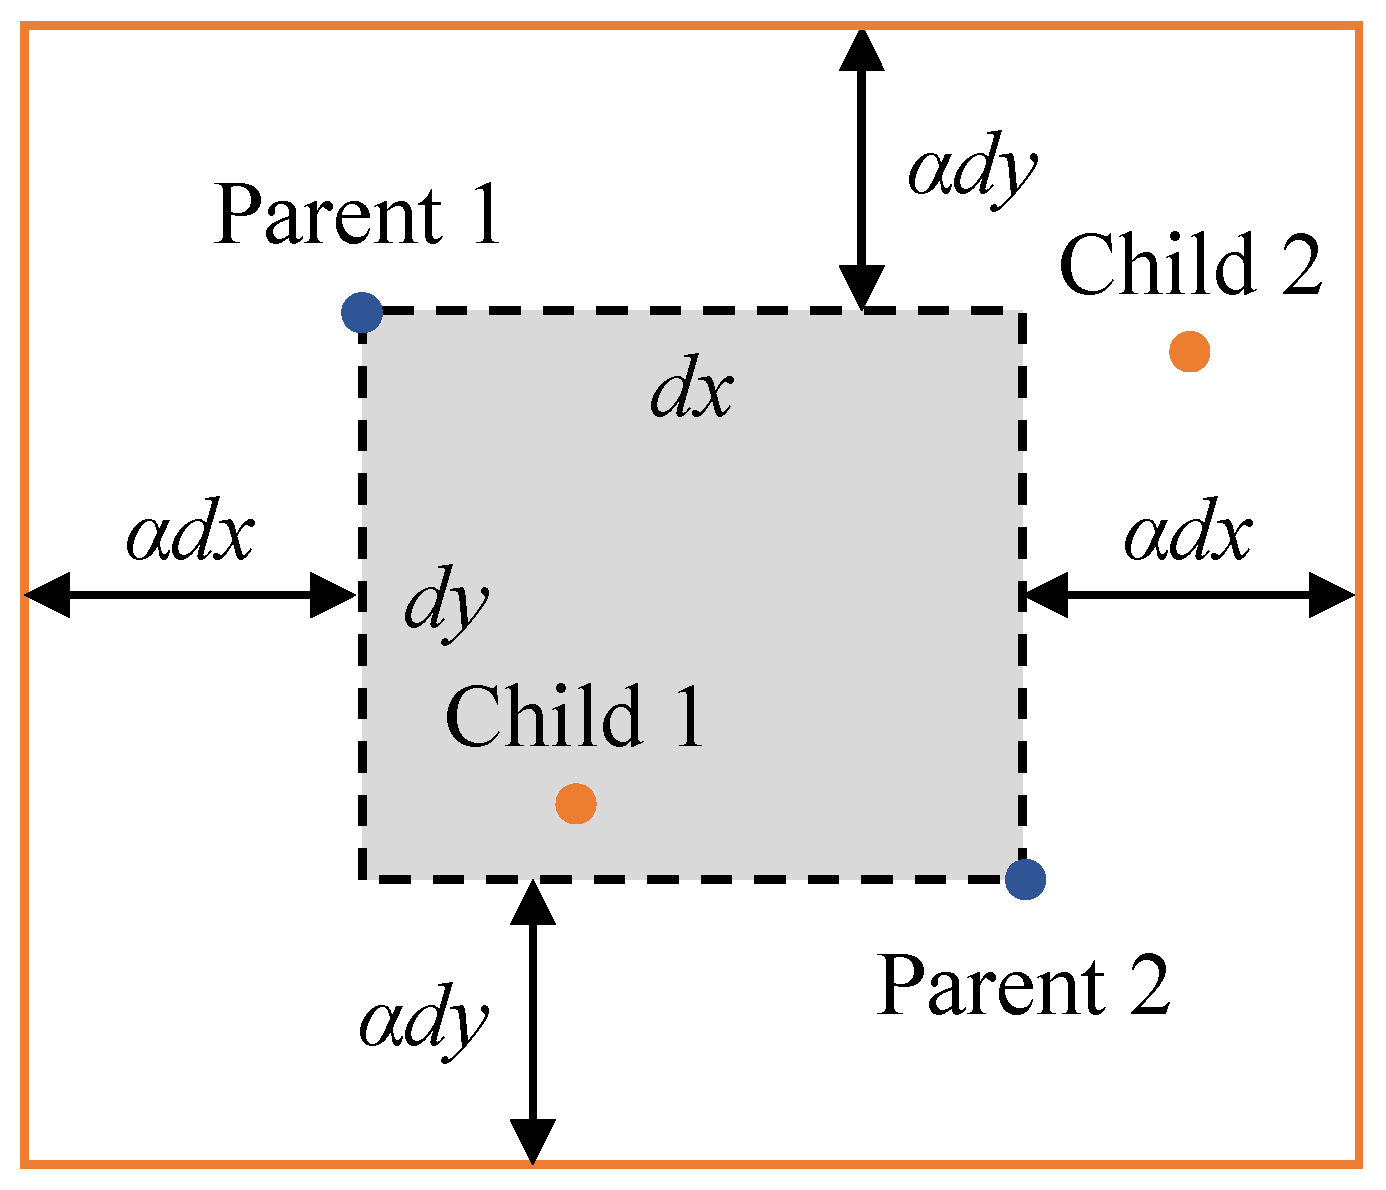
Blend crossover (BLX-) [38] is adopted for crossover, with a crossover rate of 0.9. As shown in Figure 8, the coordinates of child individuals are generated in the area decided by the coordinates of parent individuals and the parameter . If we assume the coordinates of parent individuals are (,), (,), the coordinates of child individuals (,), (,) will be generated in the rectangular area created by points A, B, C, and D as follows:
where , , , , , are given as follows:
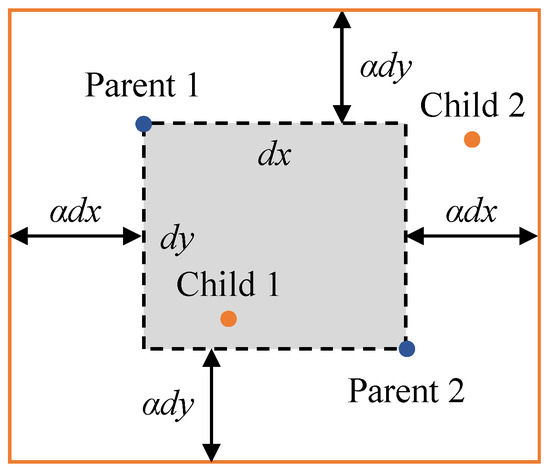
Figure 8.
Sample of blend crossover.
- Mutation
Gaussian mutation is adopted for mutation, with a mutation rate of 0.005. Random individuals are generated according to the Gaussian distribution, preserving the diversity of the individuals.
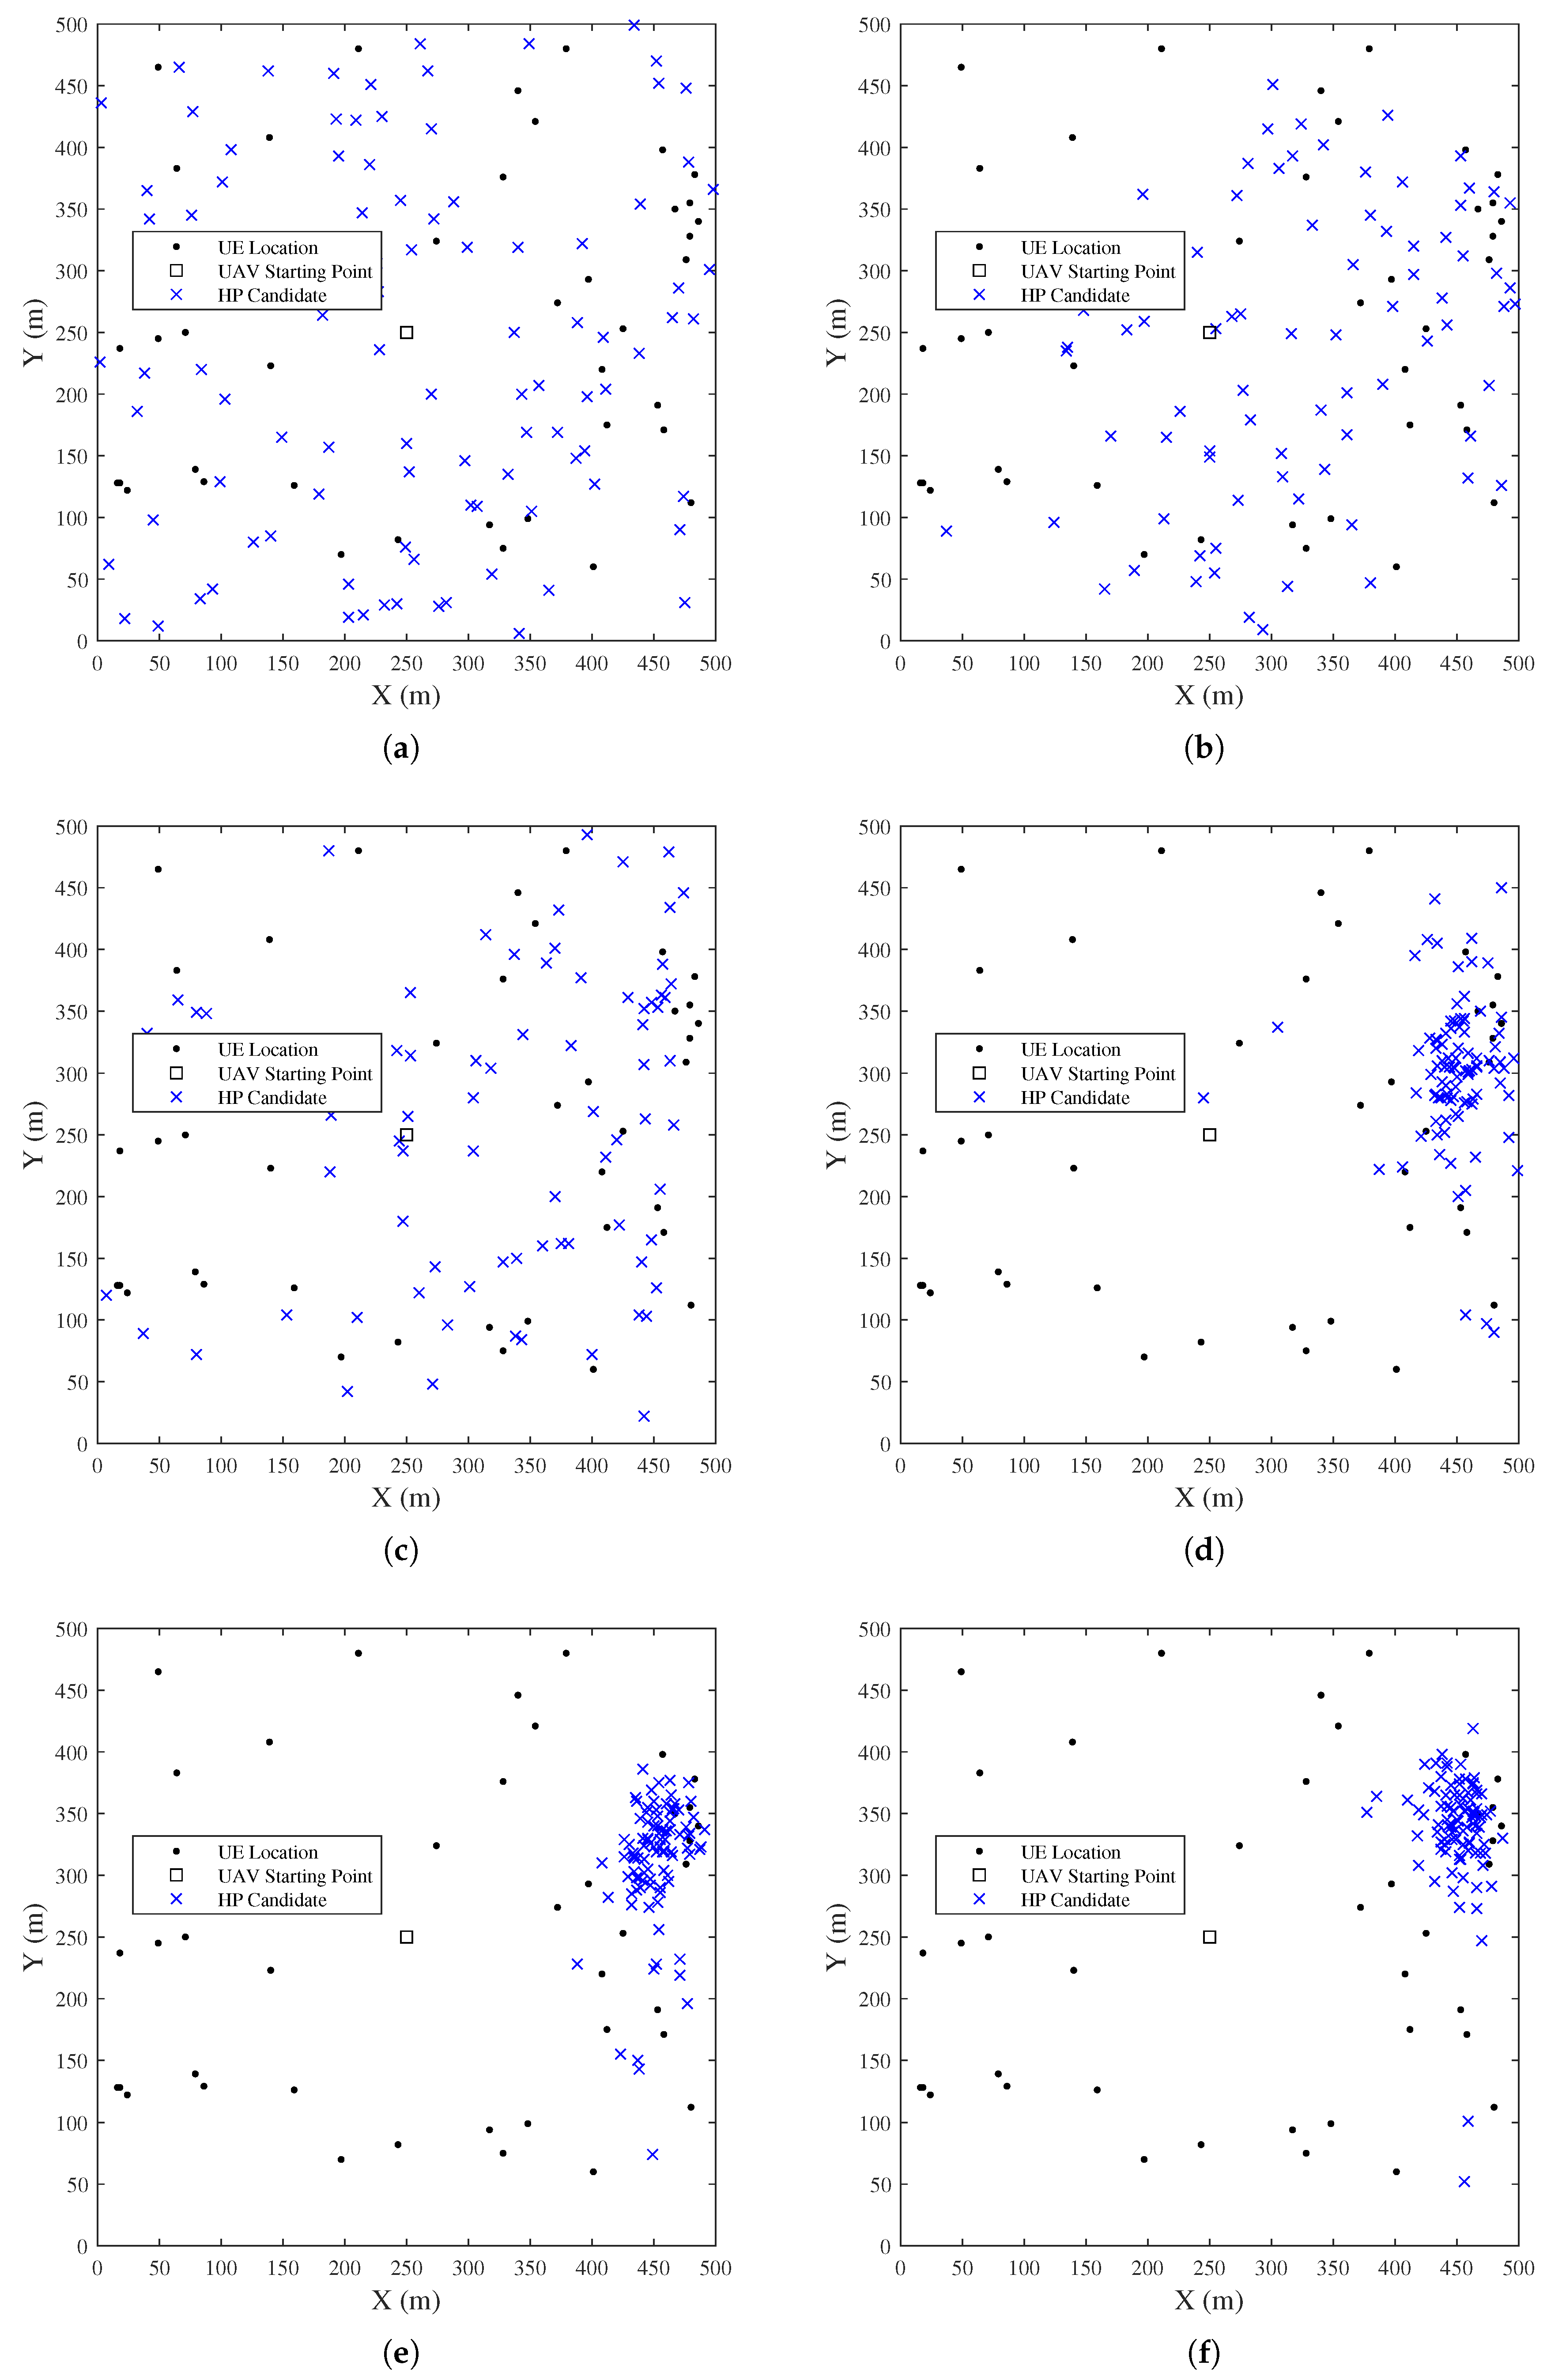
In this paper, a real-coded genetic algorithm (RCGA) is used to search for the optimal hovering points. The primary purpose is to evaluate the feasibility of using a genetic algorithm, rather than to fine-tune the genetic operations and GA parameters. Therefore, we adopt commonly used algorithms for selection, crossover, and mutation. The process of searching for the optimal hovering point using RCGA is shown in Figure 9. From Figure 9, in contrast to the first generation, when the individuals are randomly distributed throughout the area, the individuals converge to where the UEs are densest after several generations. In this article, the maximum number of generations is set as 100. When it reaches the 100th generation, the individual with the highest fitness function will be selected as the hovering point. Then, the UEs which are already covered will be removed from the search by GA, and this process will be repeated until all remaining UEs are covered. While the result obtained by GA is based on the maximum coverage radius of the UAV, i.e., the flight altitude is 150 m, it is necessary to apply the hill climbing algorithm to optimize the flight altitude.
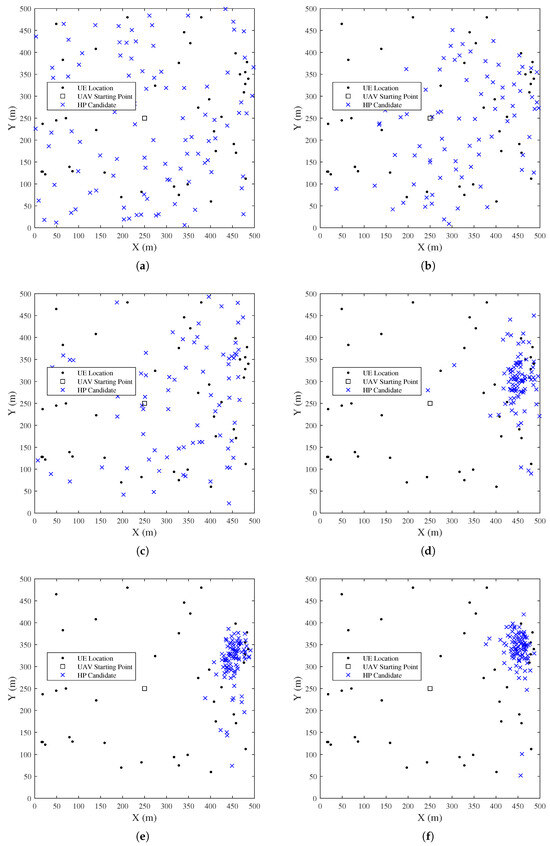
Figure 9.
UE clustering by K-means: (a) 1st generation, (b) 3rd generation, (c) 5th generation, (d) 10th generation, (e) 15th generation, (f) 20th generation.
4.3. Nearest Neighbor Search for Trajectory Decision
After the hovering points are decided, the trajectory which passes through all hovering points with the minimum flight time needs to be decided. However, the TSP is known as an NP-hard problem, which requires a huge amount of calculations to obtain a precise solution. Thus, for simplicity, we adopted the nearest neighbor search (NN), which is an approximate algorithm used in many applications. While the TSP is known as an NP-hard problem, which requires a large scale of computation, NN provides relatively good solutions with very low computational costs. We acknowledge that other algorithms, e.g., 2-opt, genetic algorithm (GA), etc., may achieve better solutions, so we have evaluated the performance of NN and GA in [39]. The simulation results revealed that GA provides only a slight improvement in terms of the total completion time for collecting the sensing data. Therefore, in this paper, we selected NN as a reasonable algorithm with low complexity for TSP in post-disaster areas where complex calculations should be avoided.
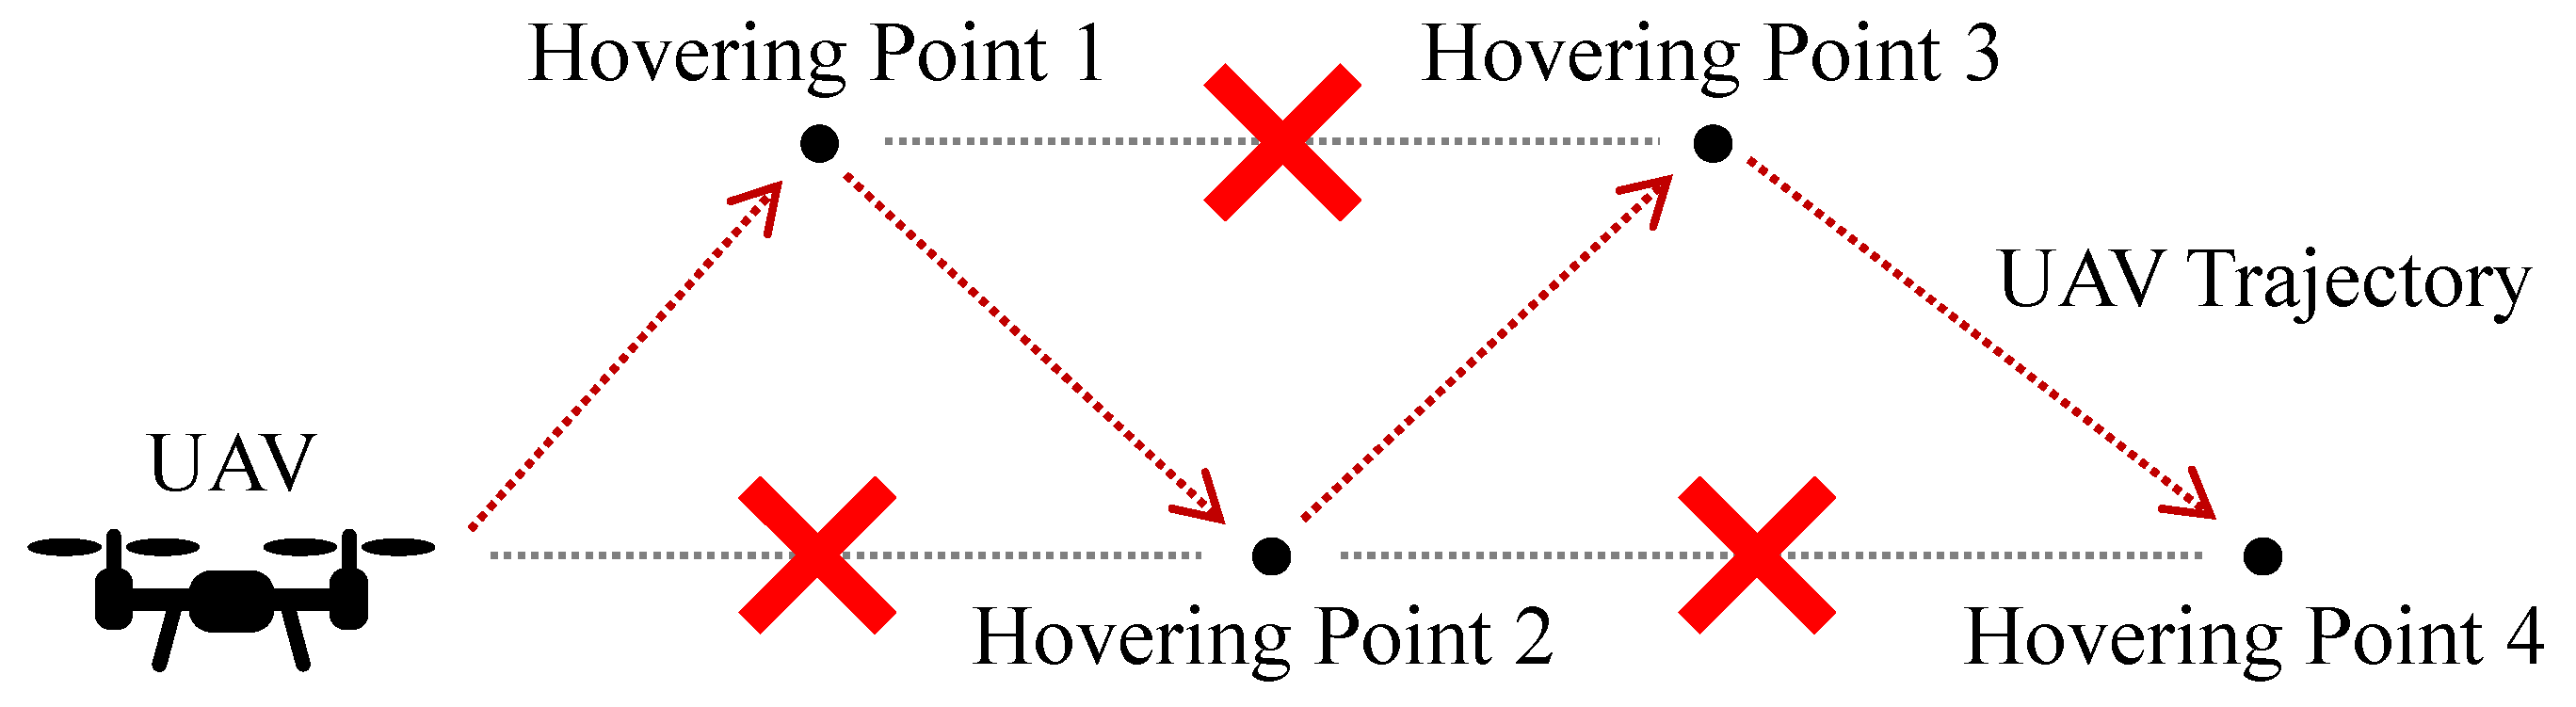
As shown in Figure 10, according to the concepts of NN, the UAV always selects the nearest hovering point as the next destination.
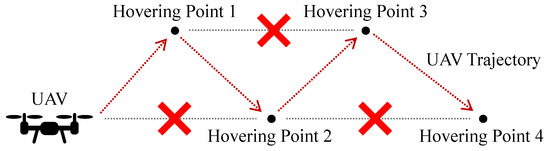
Figure 10.
Sample of nearest neighbor search.
5. Simulation Results
In this section, numerical analyses are performed to evaluate the performance of the proposed algorithms. Each of the results shown in the following part of the manuscript are derived from 100 simulation runs, each using a different randomly generated pattern of UE distribution.
5.1. Placement of Hovering Points
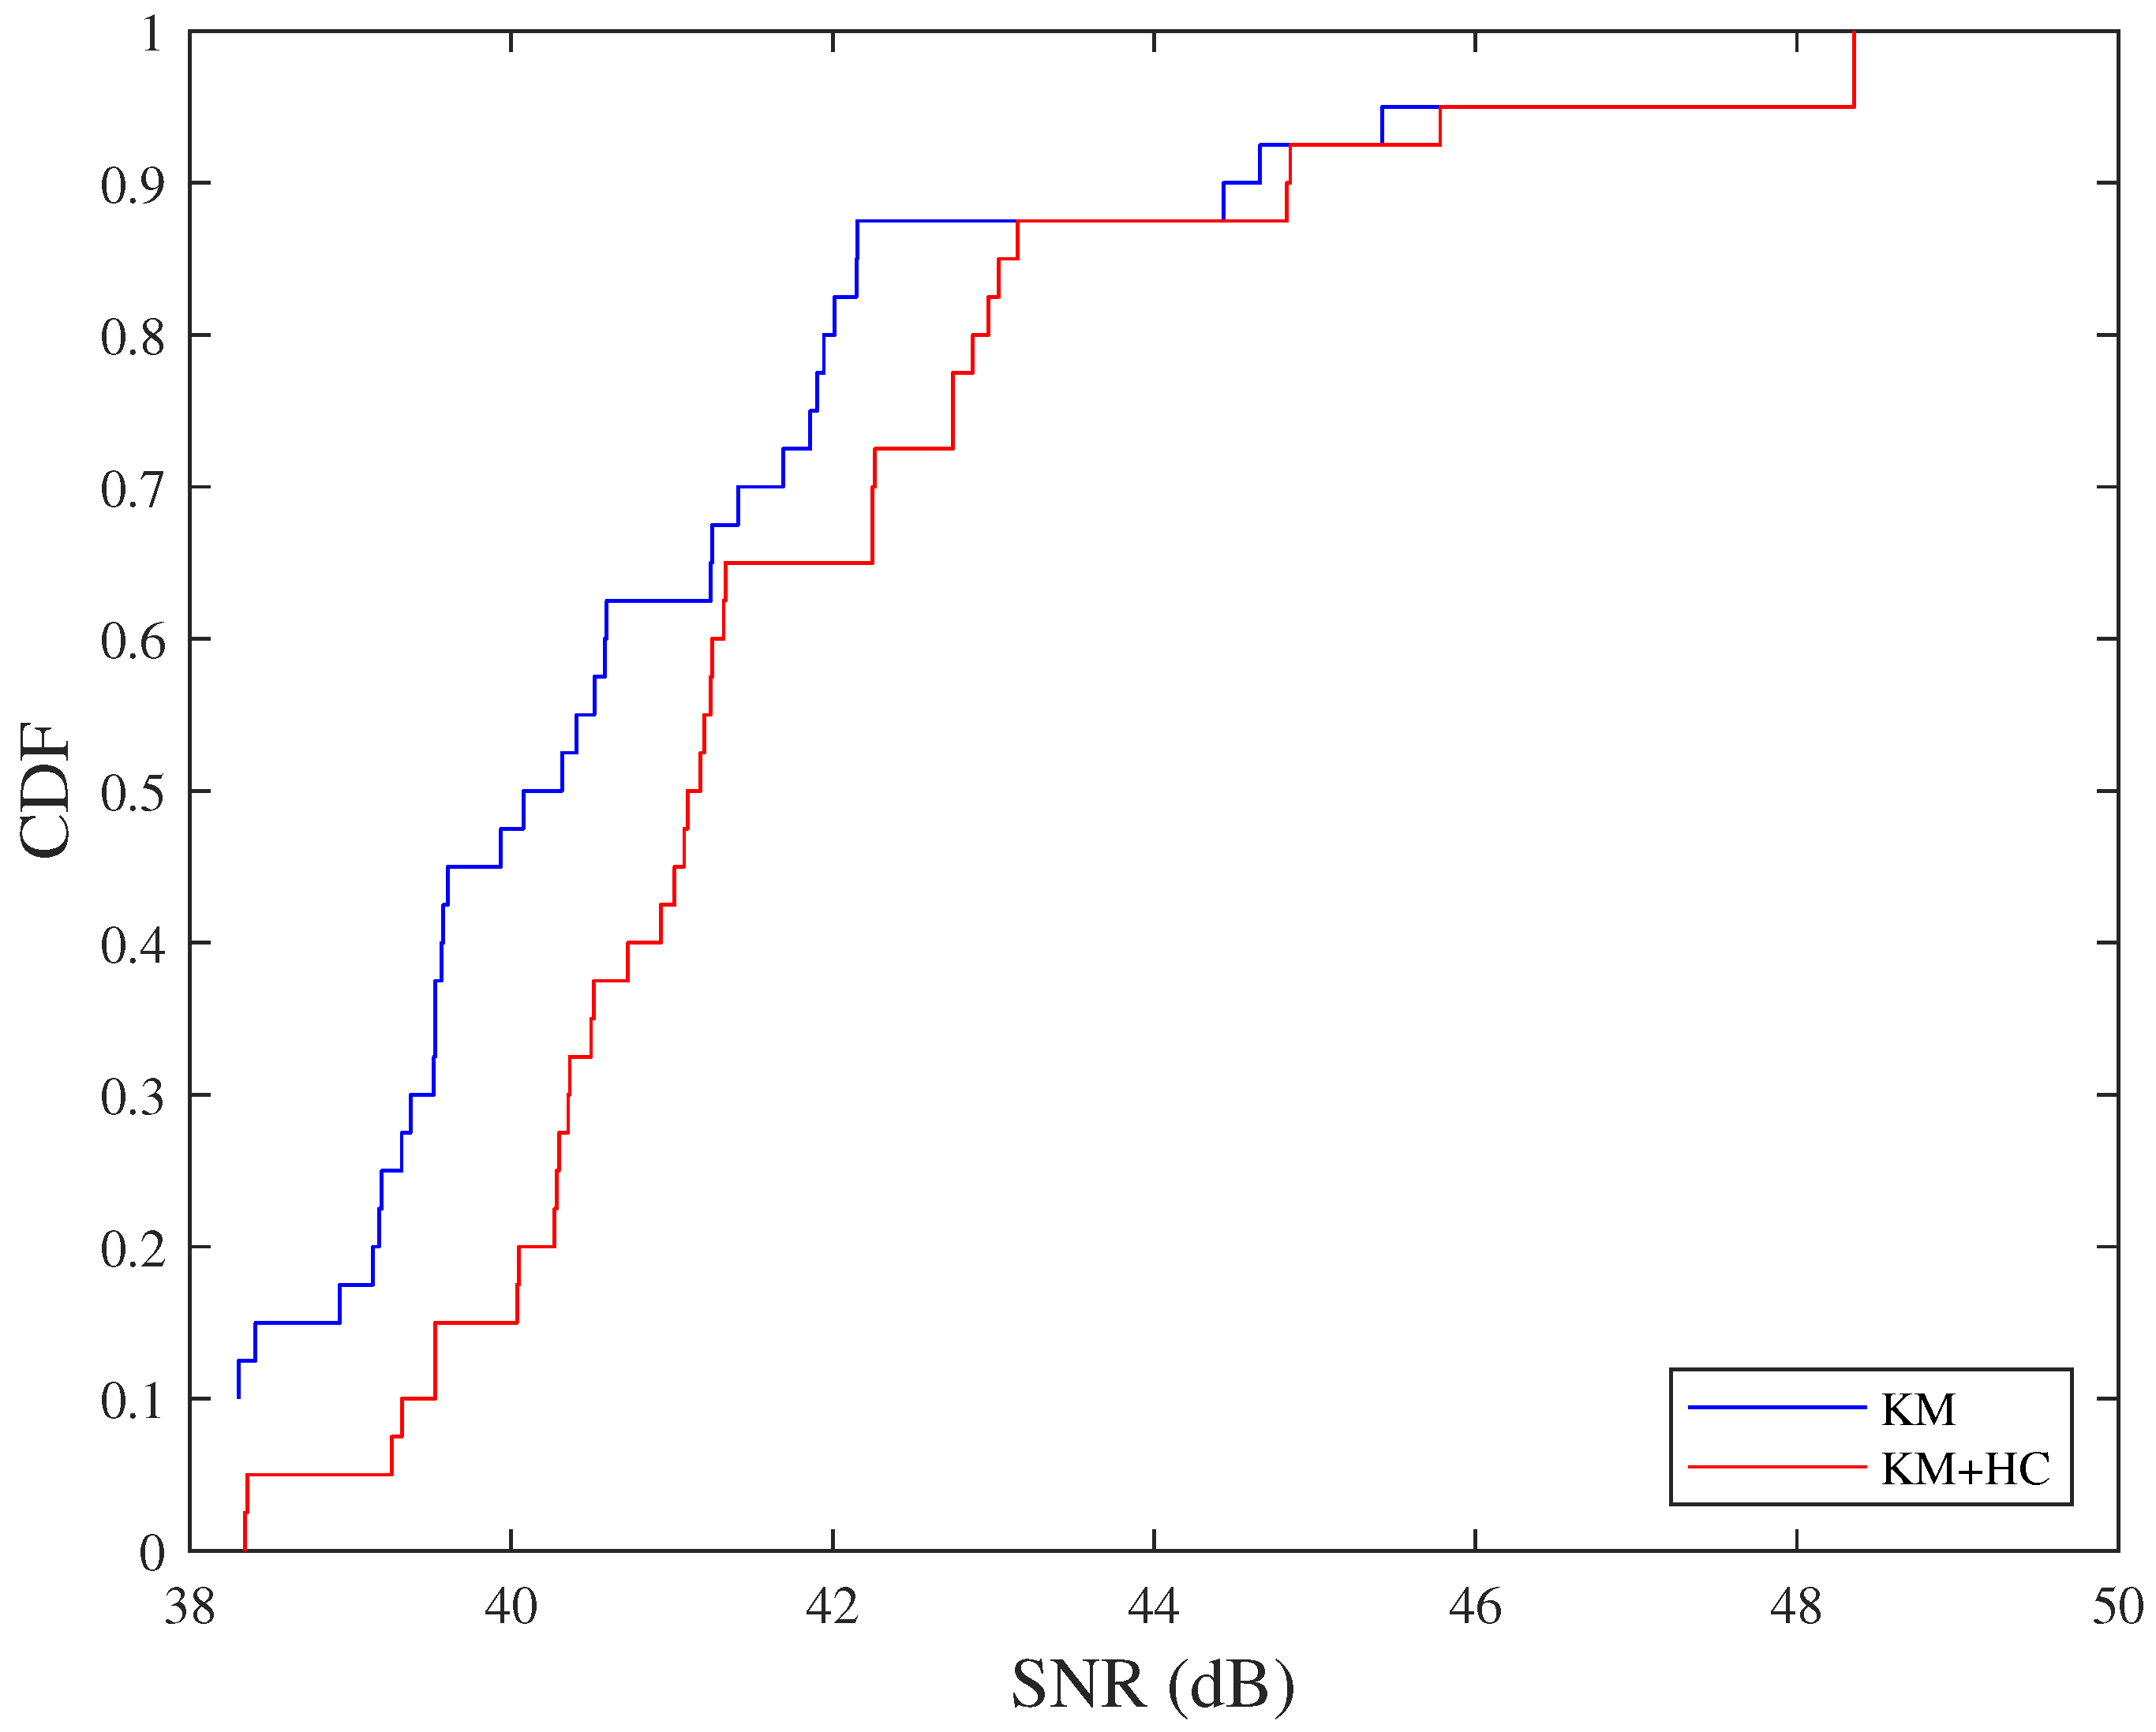
The placement of hovering points by sequenced K-means clustering is shown in Figure 11, where the blue and red dotted circles respectively indicate the coverage area before and after adopting the hill climbing algorithm. In this case, 12 is the smallest k that satisfies the flight altitude limitation. The cumulative distribution function (CDF) of the SNR before and after adopting the hill climbing algorithm is shown in Figure 12. From Figure 12, we can see that the hill climbing algorithm successfully optimized the UAV’s flight altitude, achieving larger SNRs.
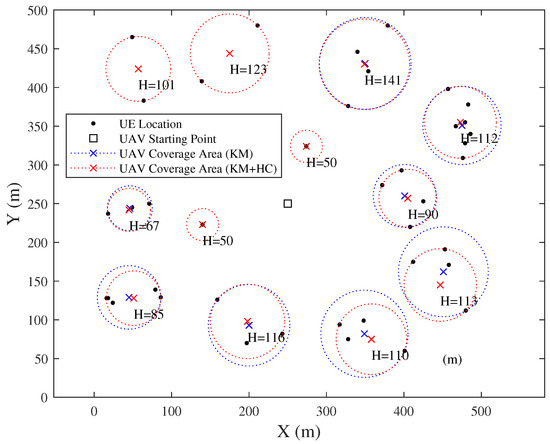
Figure 11.
Snapshot of hovering point placement by sequenced K-means clustering.
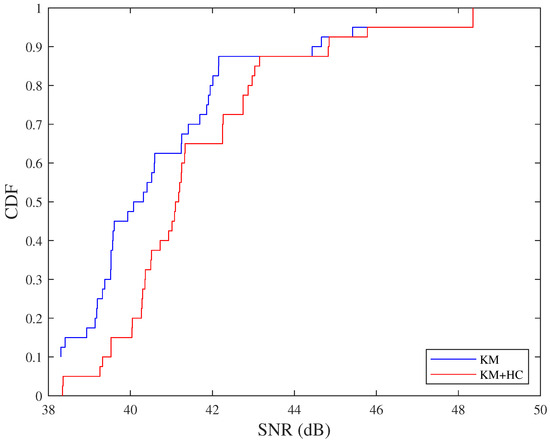
Figure 12.
Comparison of SNR before and after using hill climbing algorithm.
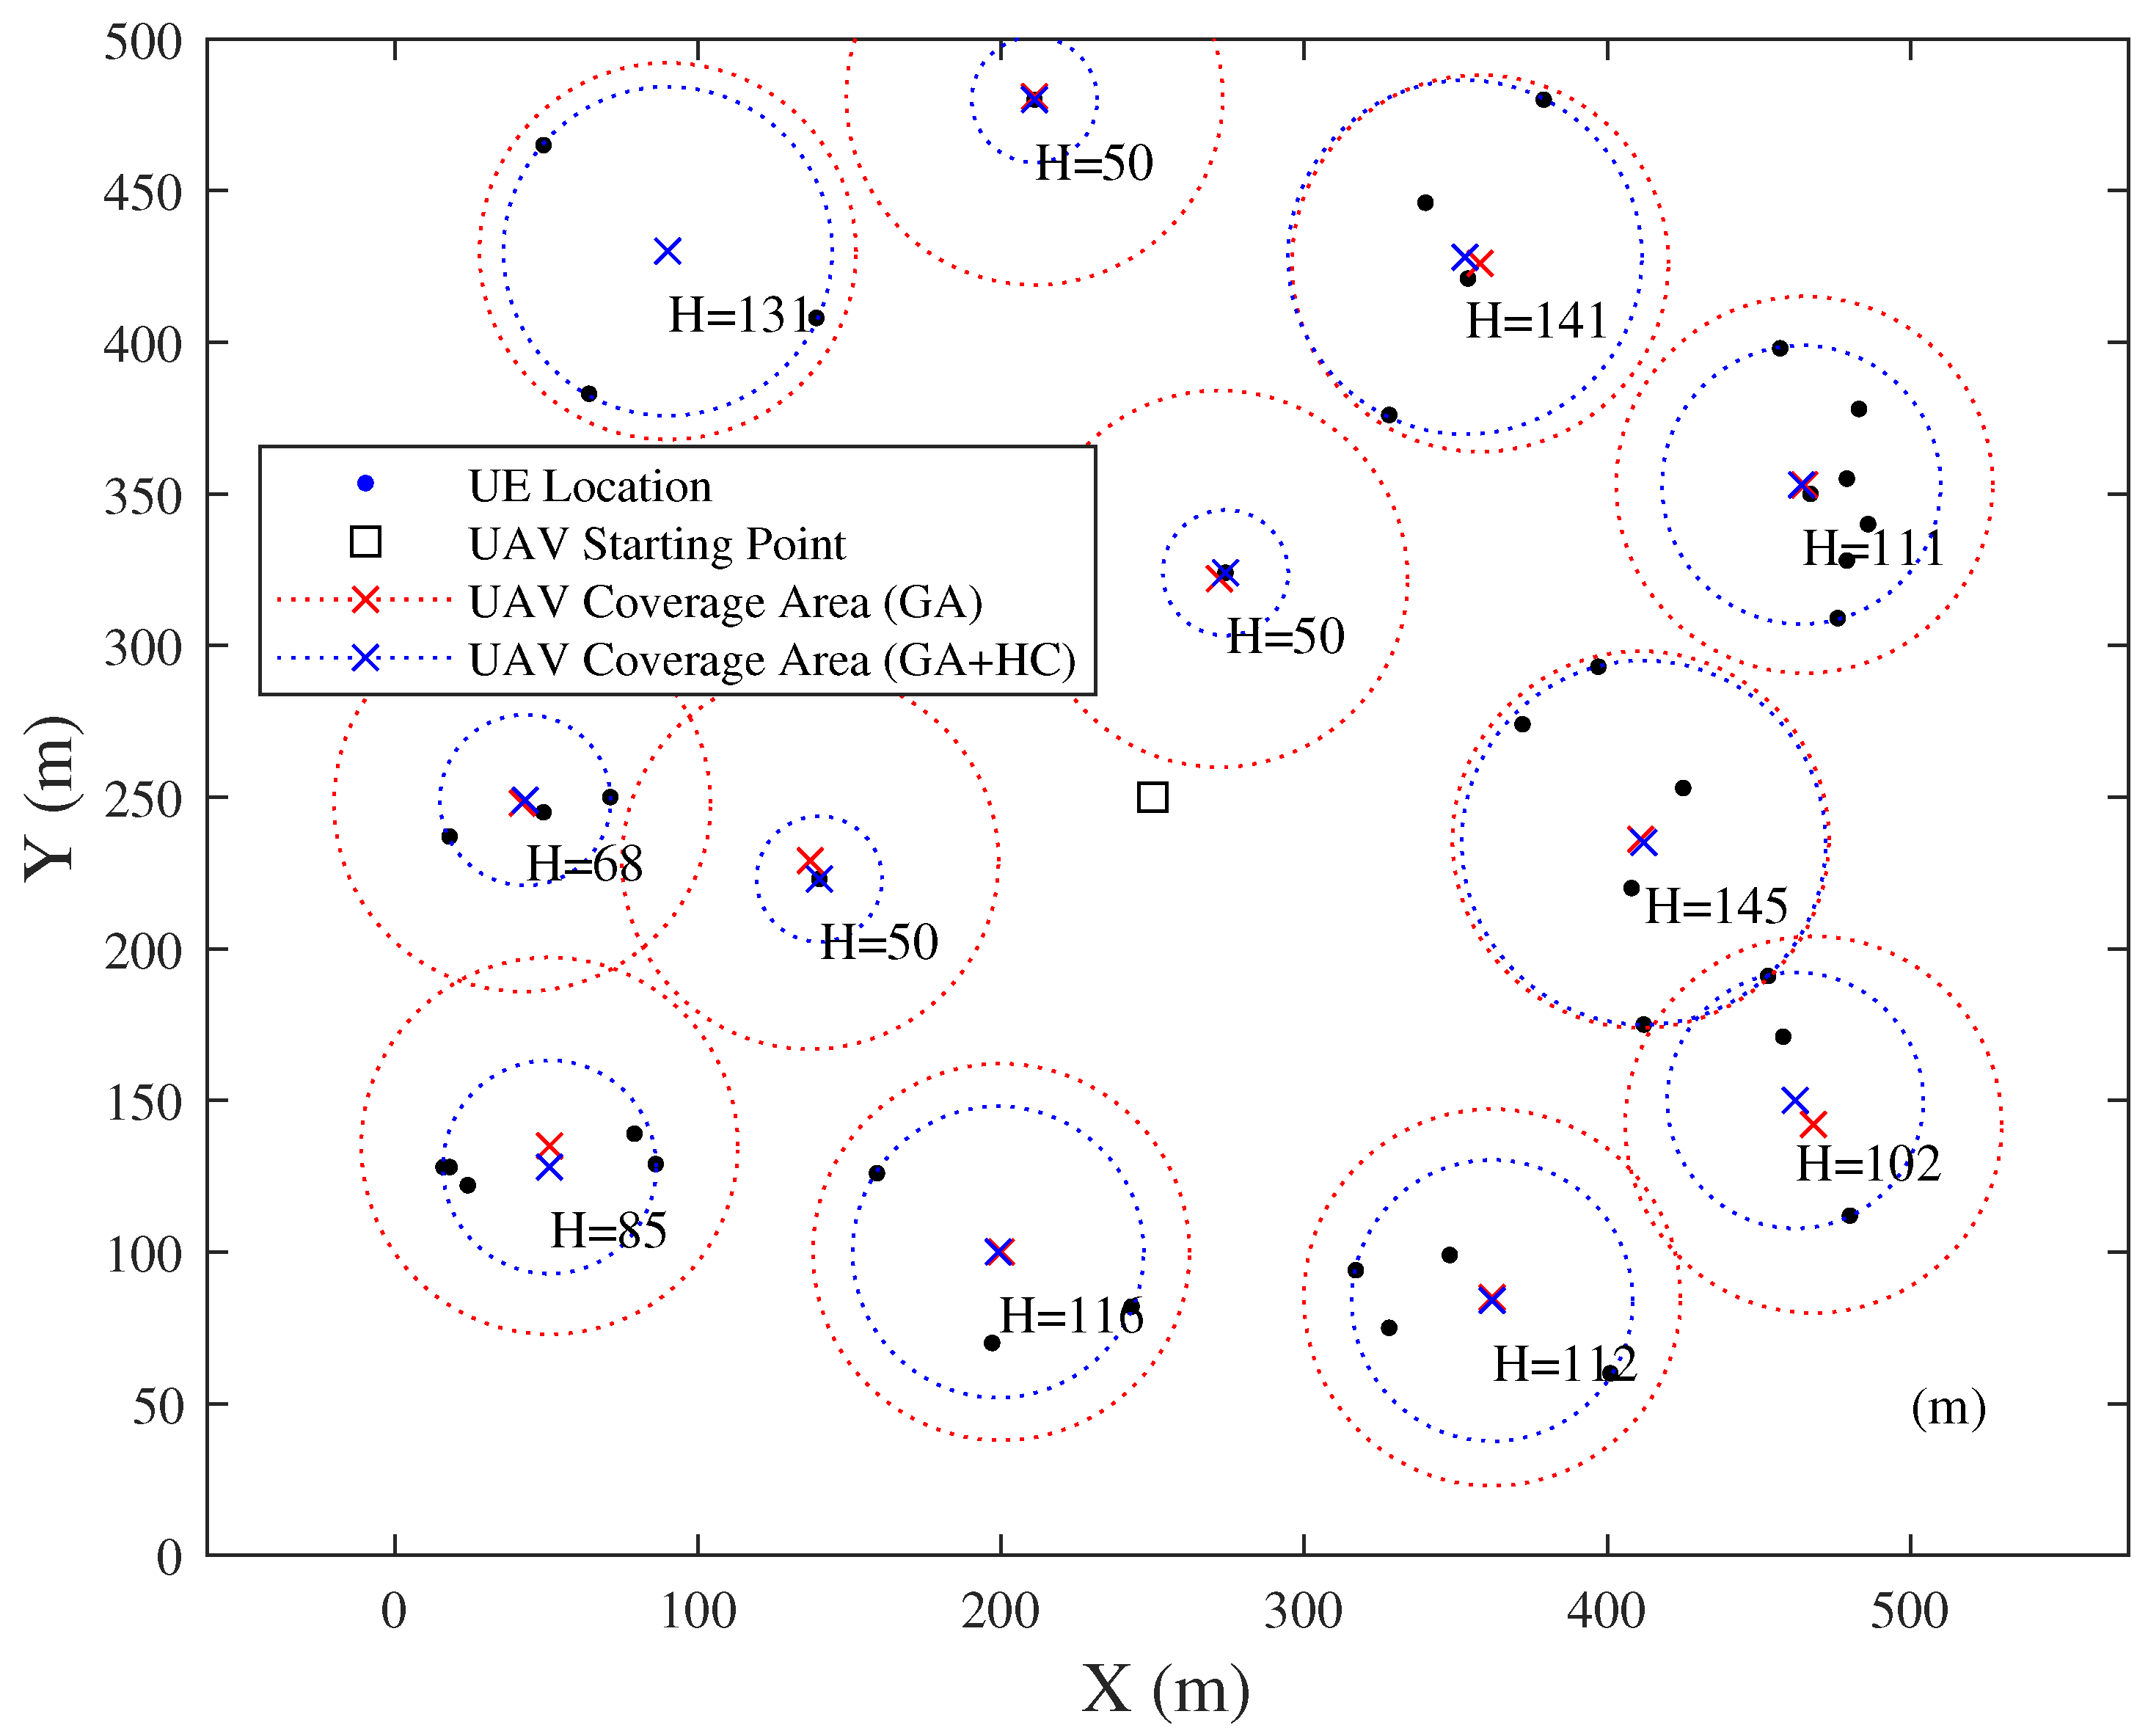
Then, the placement of hovering points by the GA is shown in Figure 13. The solution of the LSCP with the maximum flight height of 150 m, which is shown by the red dotted circles, is first obtained. And then, the hill climbing algorithm is adopted to optimize the UAV’s flight altitude below 150 m, which is shown by the blue dotted circles.
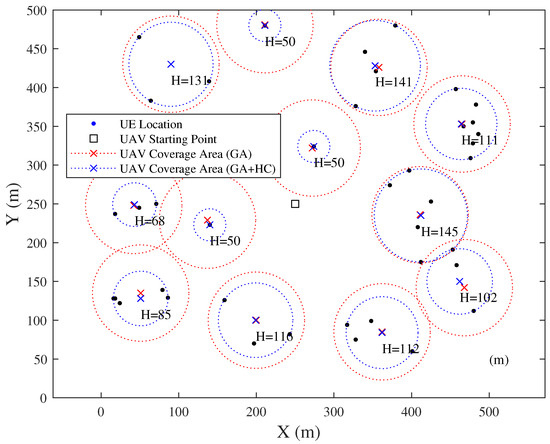
Figure 13.
Snapshot of hovering point placement by GA.
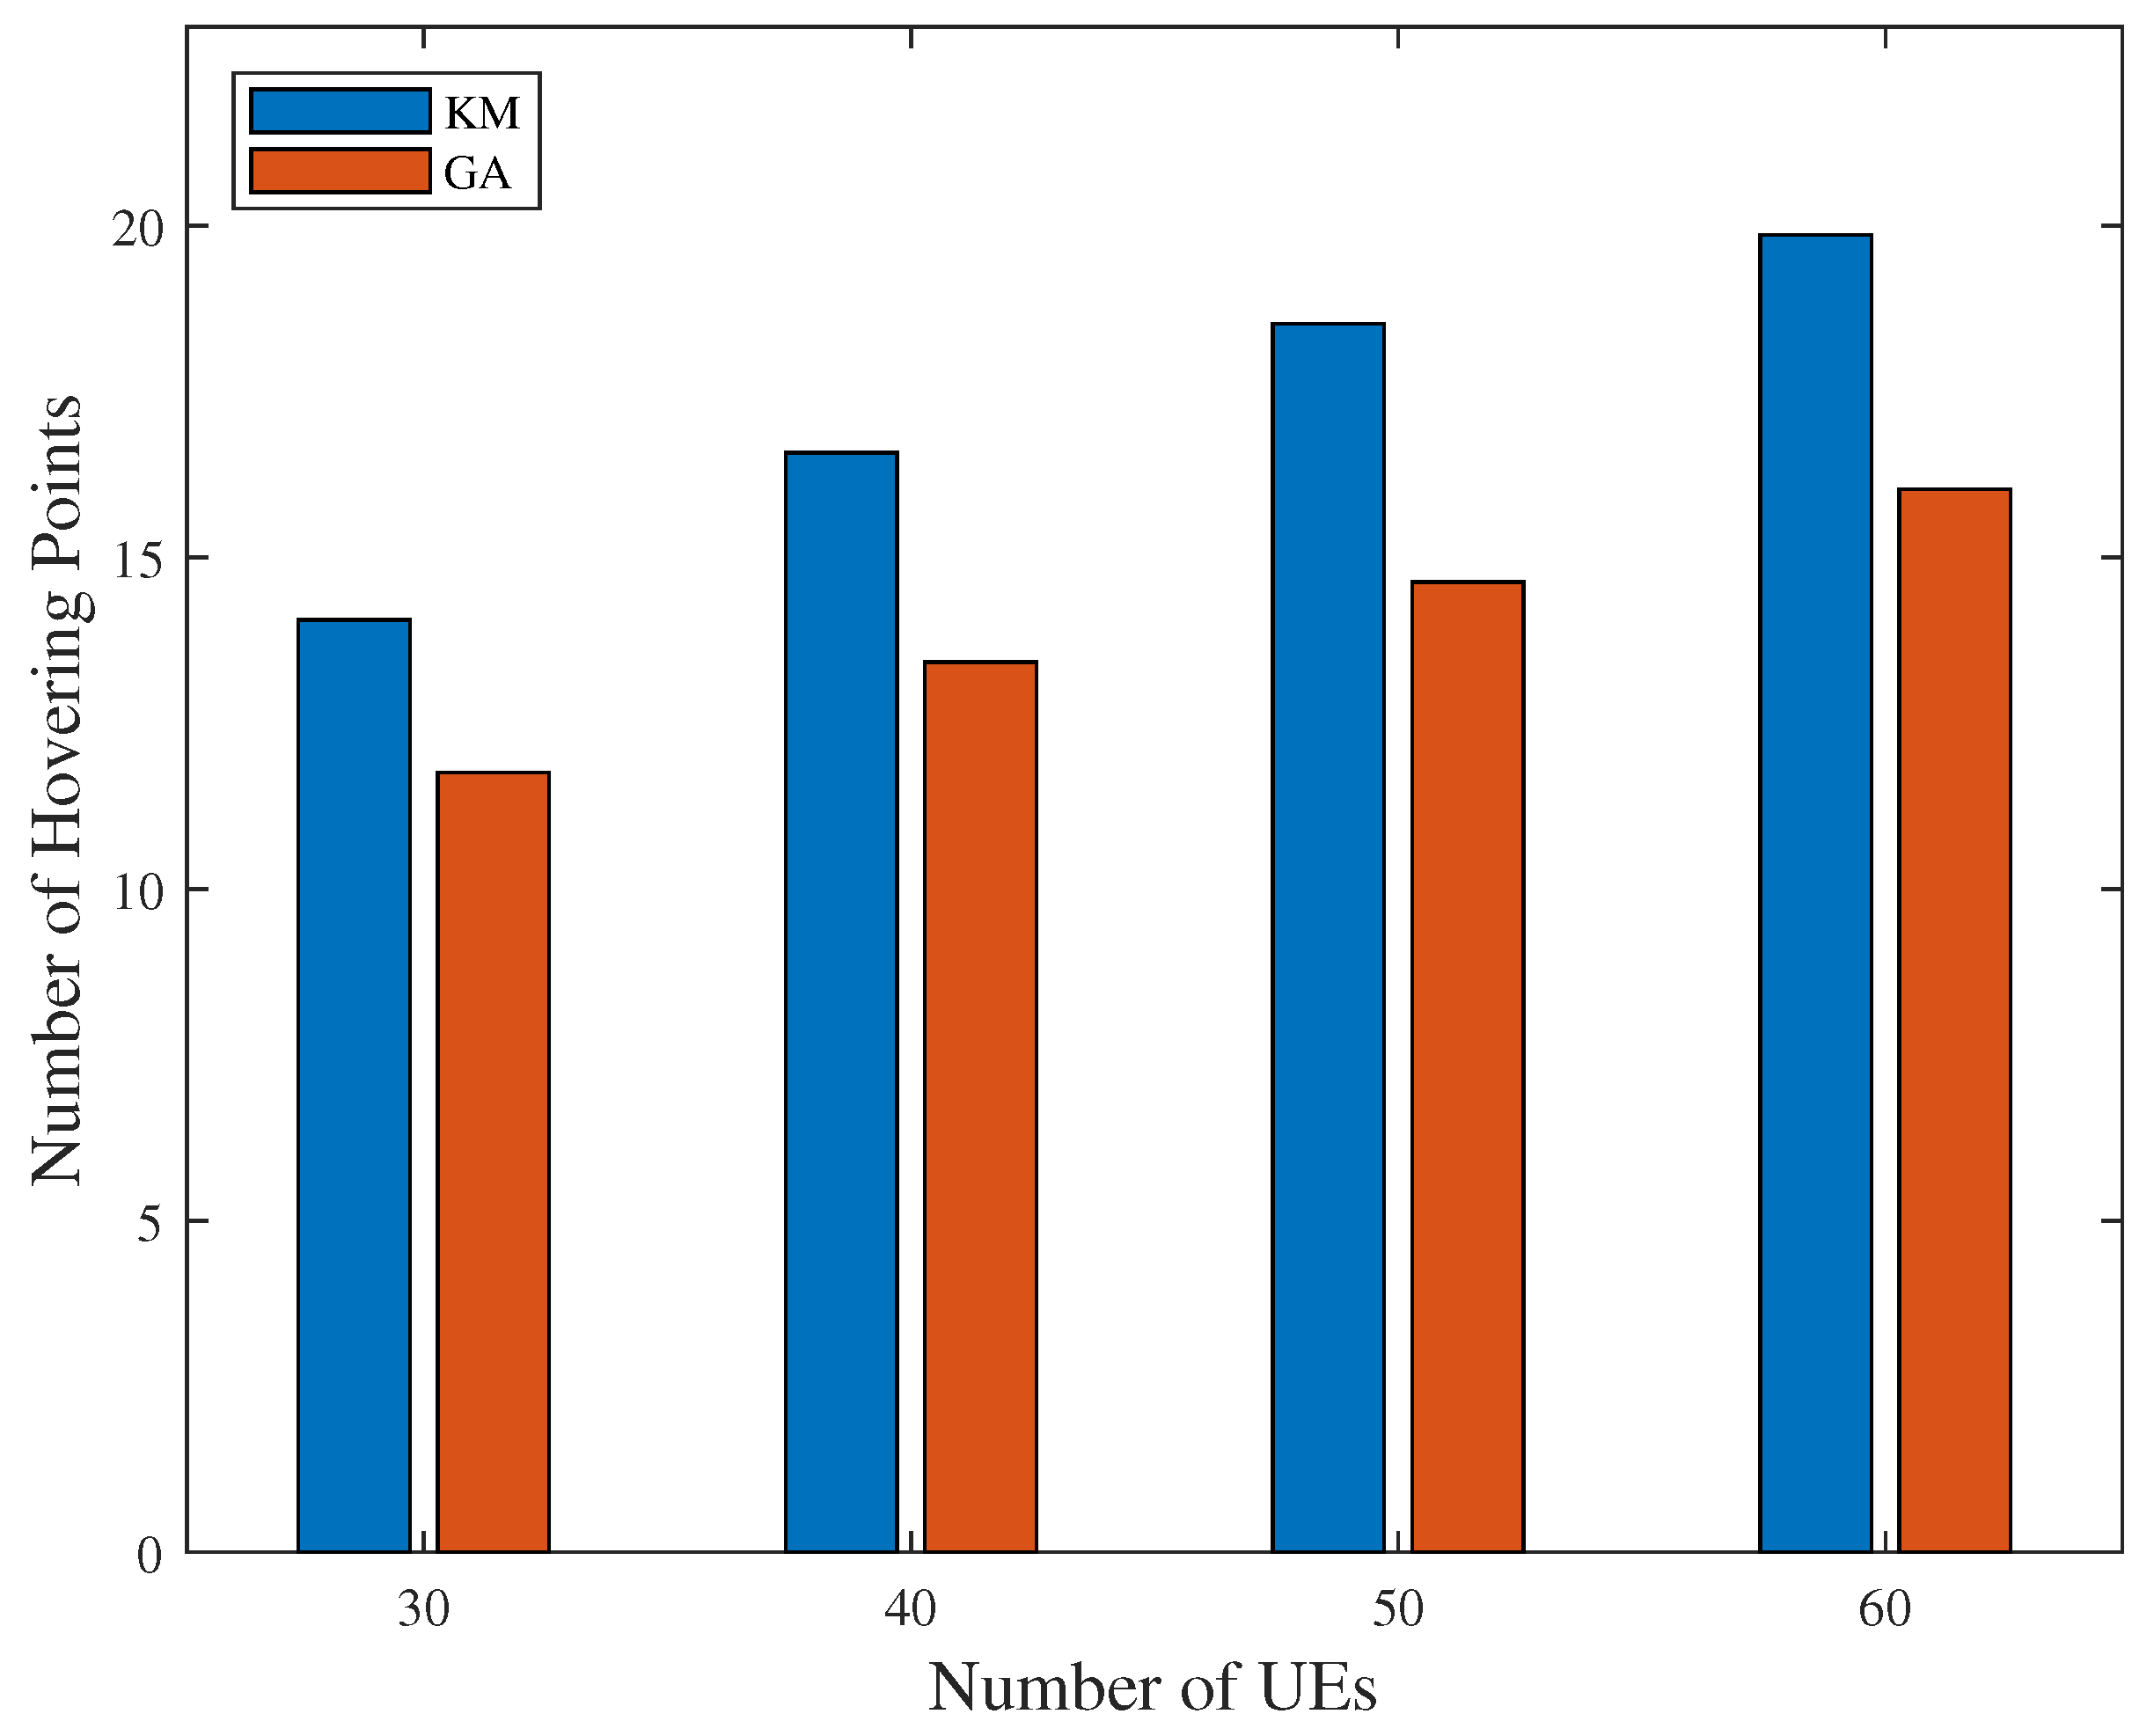
The minimum number of hovering points obtained by sequenced K-means and GA is shown in Figure 14. From Figure 14, compared to traditional K-means clustering, the result of GA covers the same number of UEs with fewer hovering points, which indicates an improvement in efficiency.
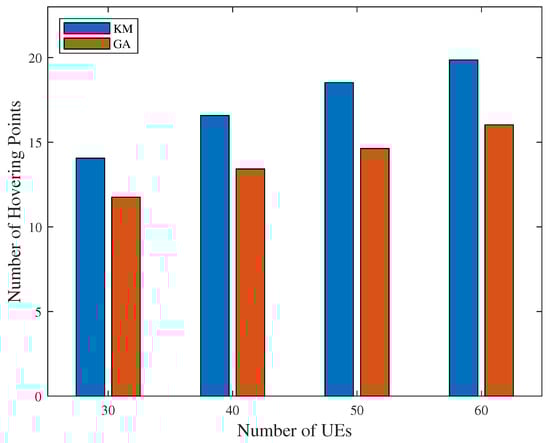
Figure 14.
Minimum number of hovering points by K-means and GA.
5.2. Trajectory Optimization
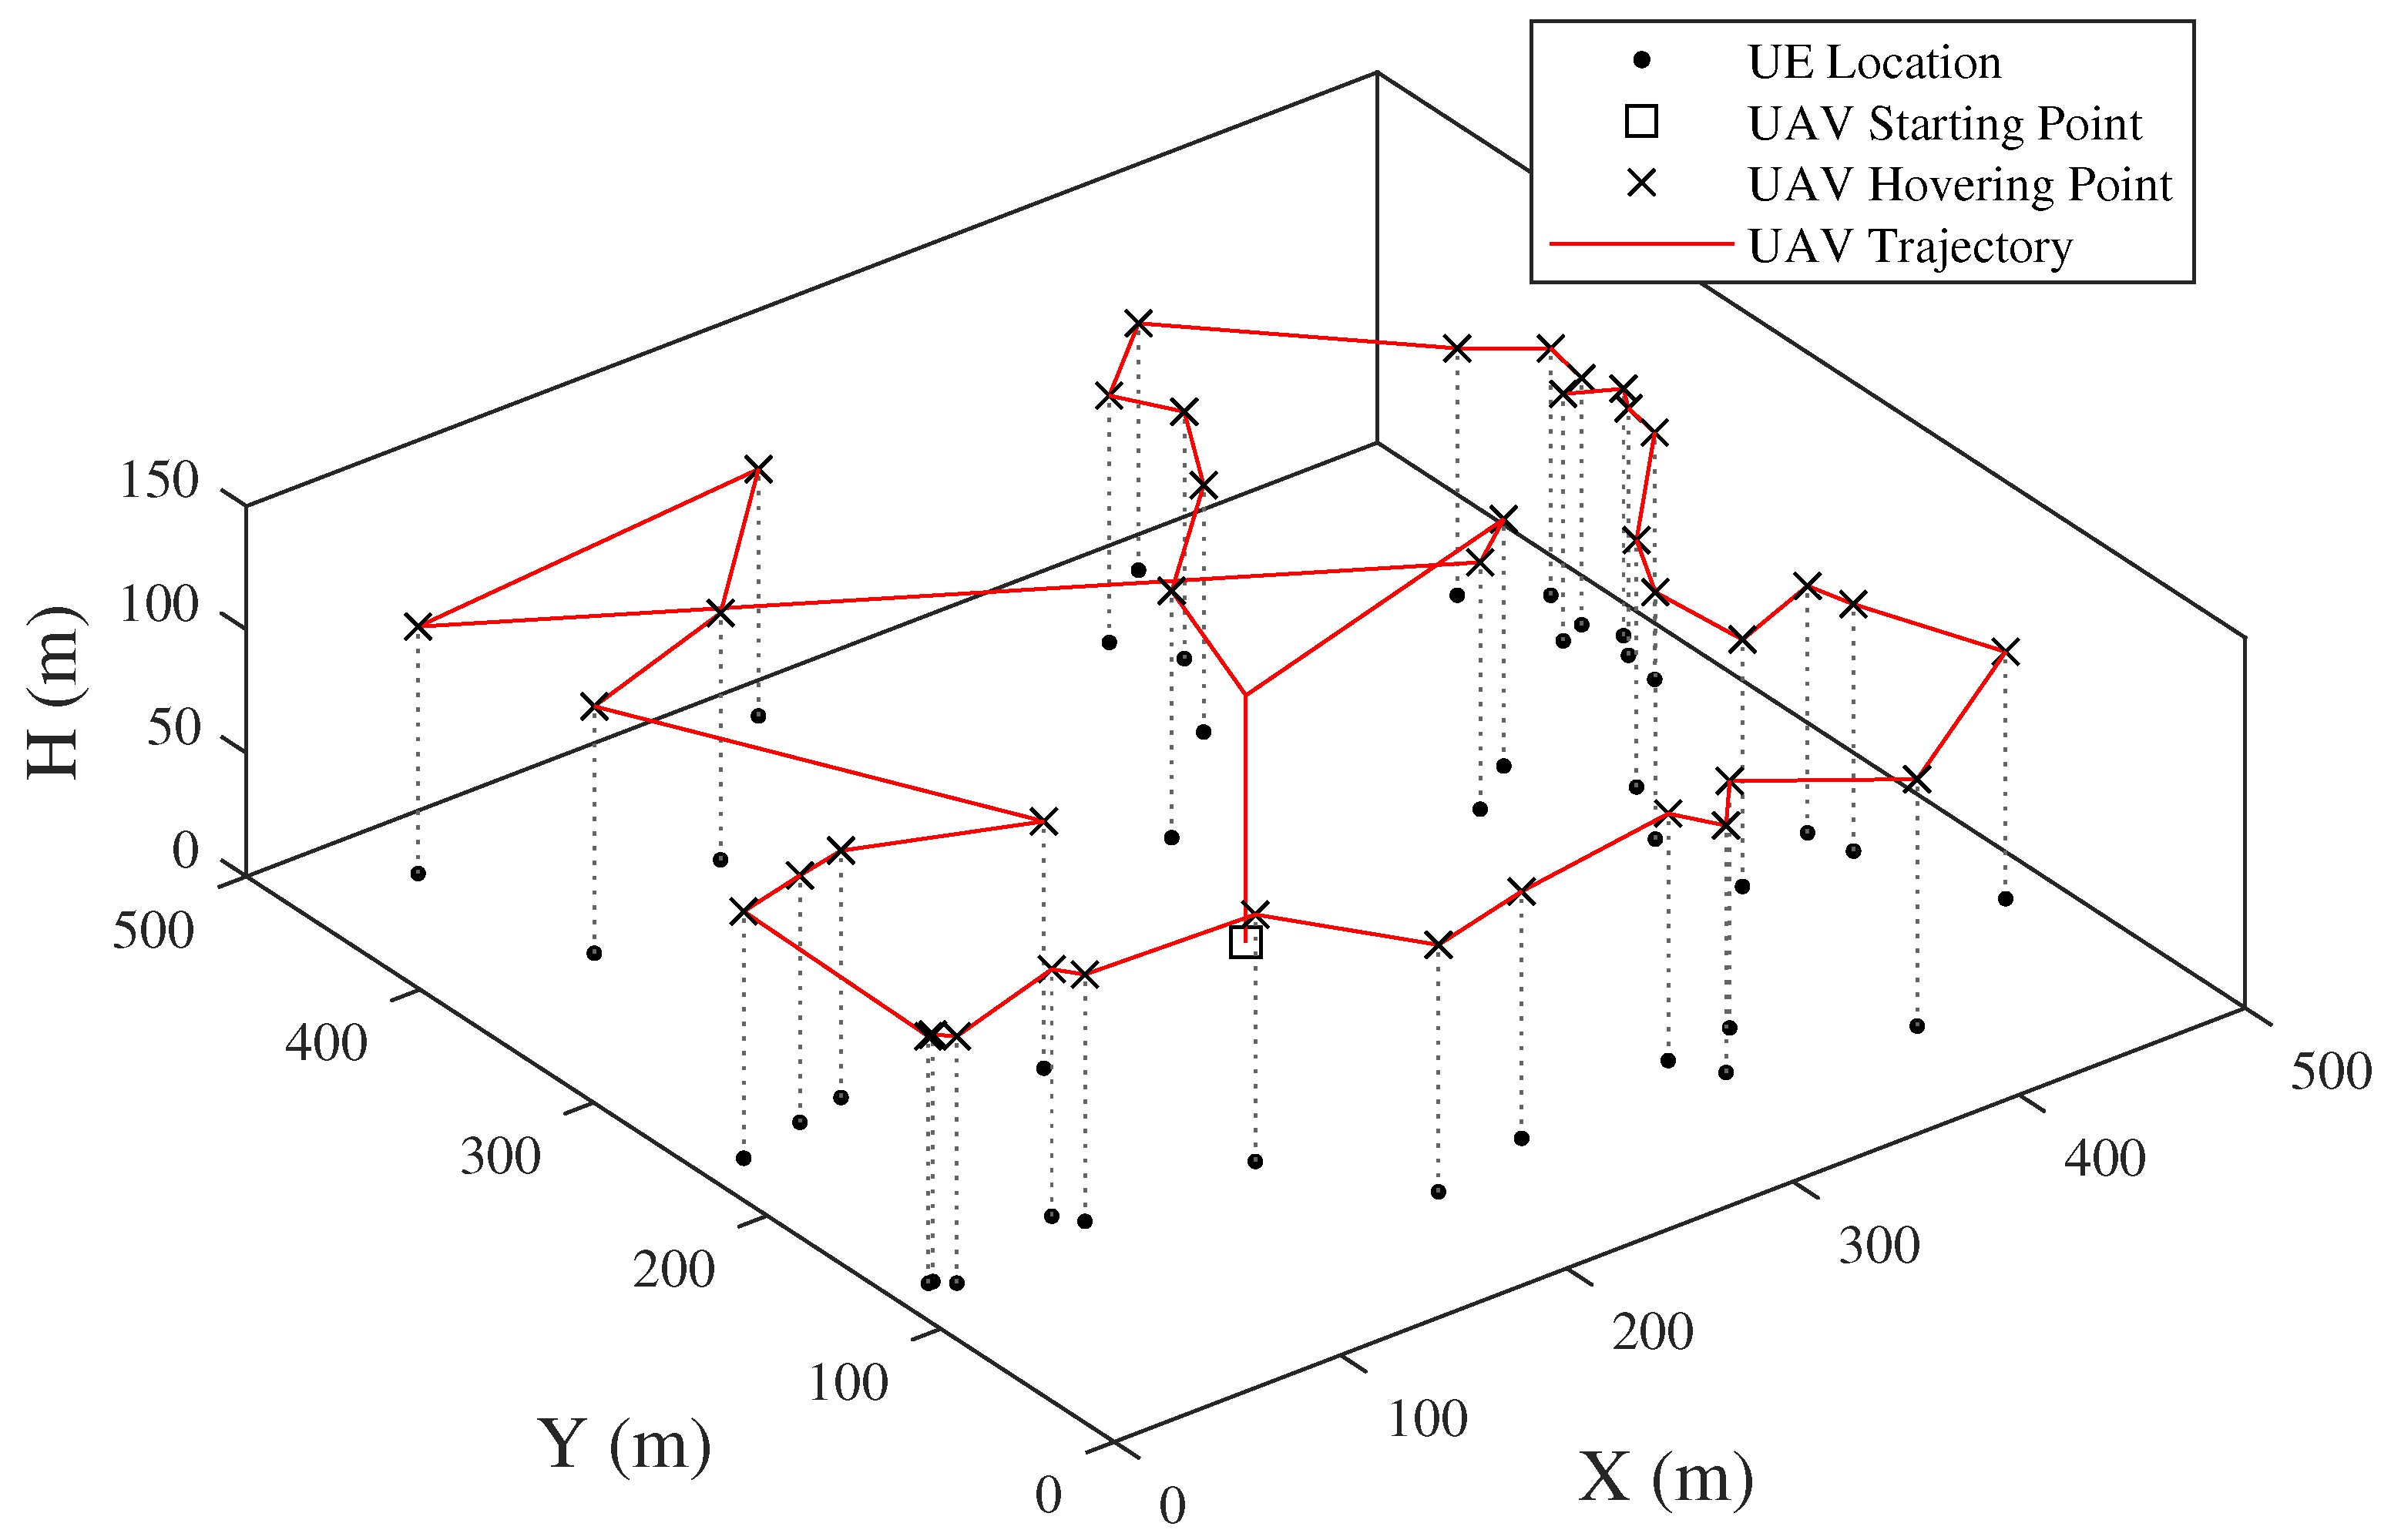
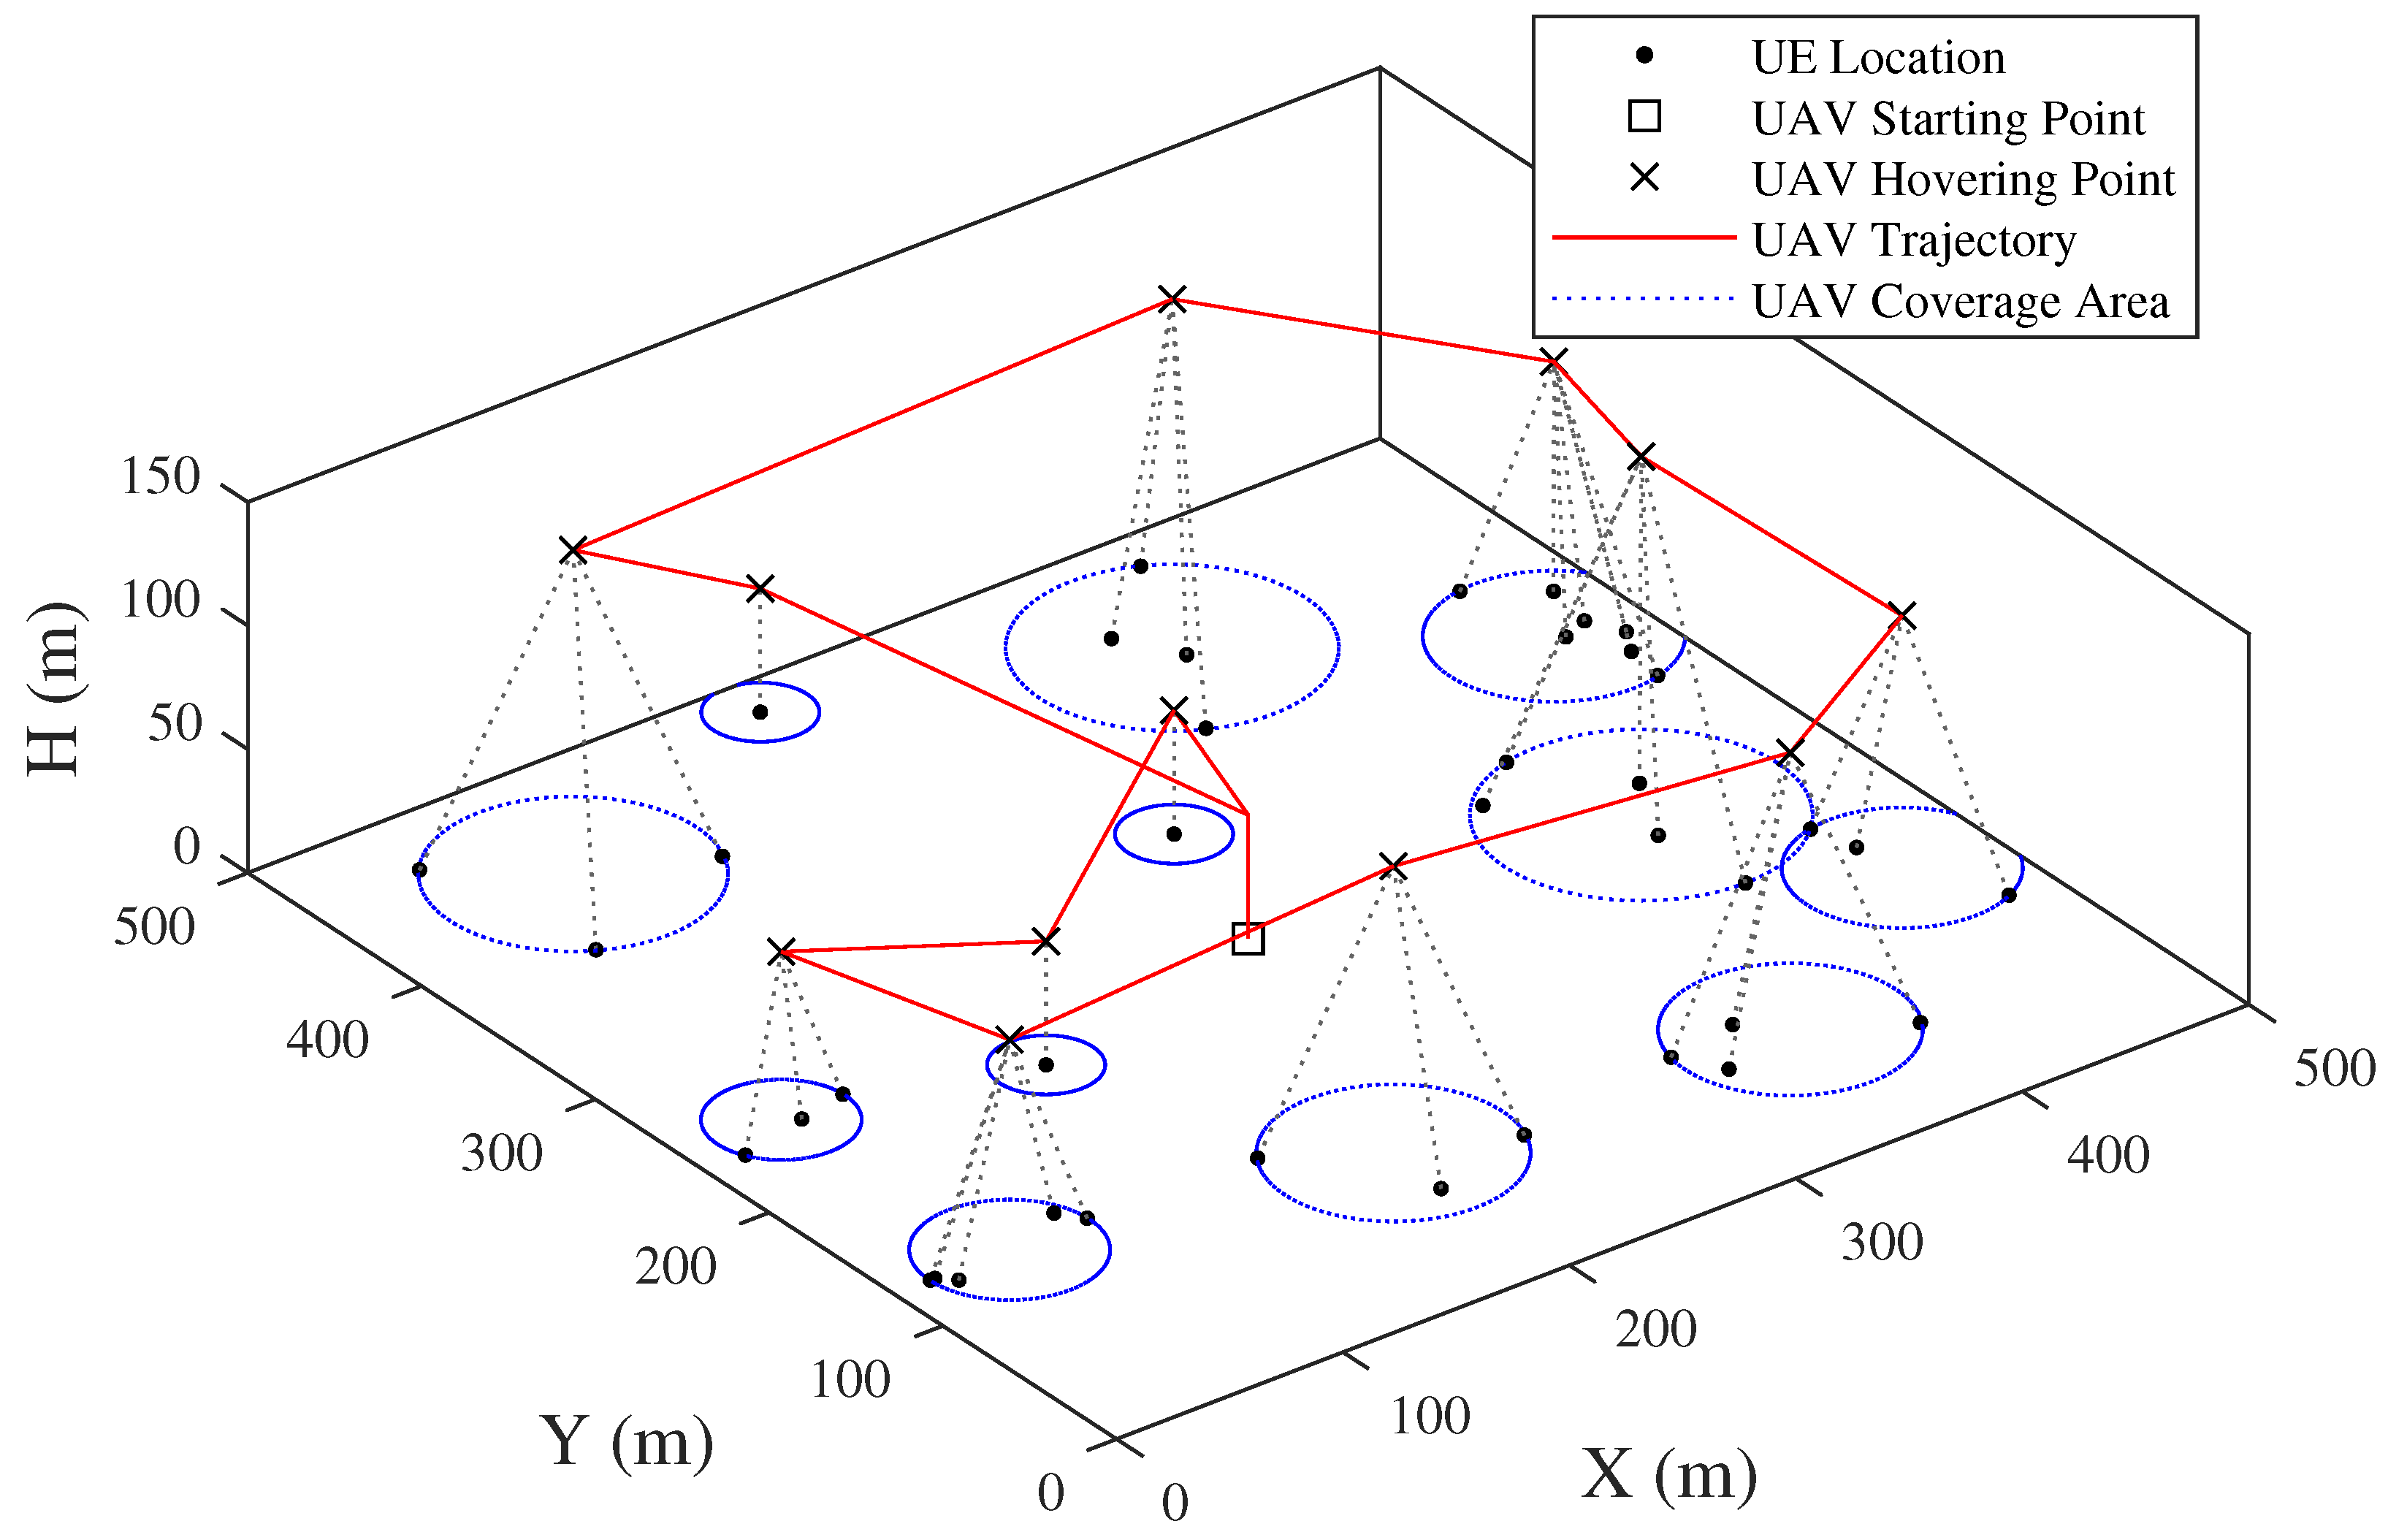
The UAV trajectories obtained by the previous method and proposed method are respectively shown in Figure 15 and Figure 16. In the previous method, the UAV’s flight altitude is assumed as a constant, which is 100 m in Figure 15. The UAV needs to hover above each UE for data collection. This may increase the complexity of the trajectory, especially when the number of UEs increases. In contrast, the proposed method in this article, i.e., the three-dimensional trajectory, finishes the data collection with fewer hovering points by optimizing the flight altitude. The UAV covers and collects data from multiple UEs at the same location each time when hovering.
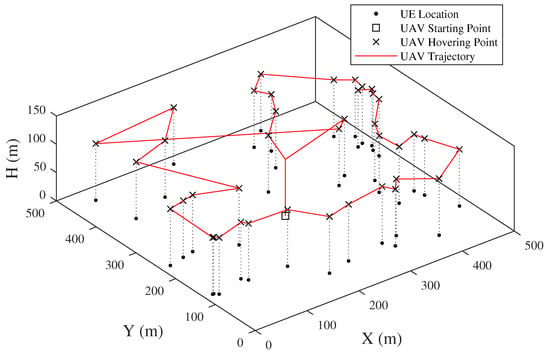
Figure 15.
Snapshot of UAV trajectory by previous method.
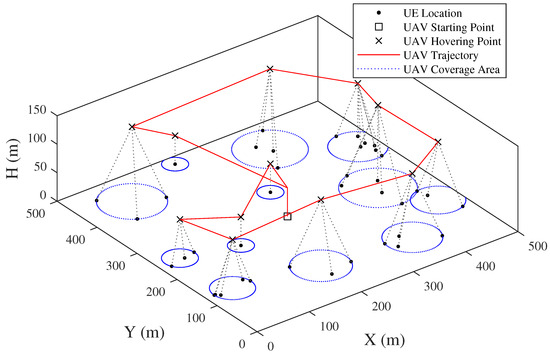
Figure 16.
Snapshot of UAV trajectory by proposed method.
The results of the completion time with varying numbers of UEs are shown in Table 3 and Figure 17, where hovering time is the time for data transmission. From Table 3, it is clear that flight time occupies a large proportion of the mission completion time. The completion time, especially the flight time, is reduced by the proposed method, with a reduction rate of nearly 0.2. The hovering time slightly increases because of the increase in the UAV’s flight altitude, which lowers the data rate.
Table 3.
Results of the completion time with varying numbers of UEs.
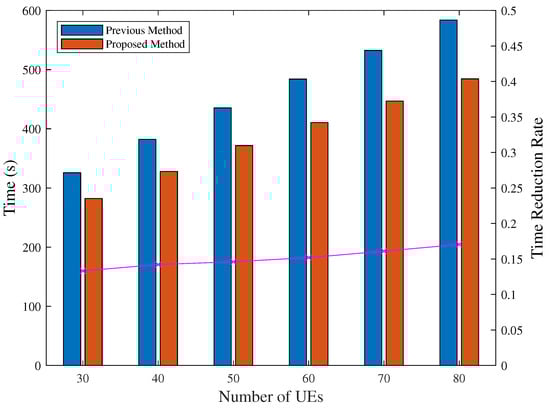
Figure 17.
Completion time with varying numbers of UEs. Purple line shows the time reduction rate.
6. Conclusions
In this article, we considered the feasibility of UAV-based post-disaster data collection by proposing a three-dimensional trajectory, which optimized the UAV’s flight altitude. We transformed the problem to an LSCP solved by a GA, and compared it with the traditional K-means clustering approach. From the simulation results, the proposed method showed better efficiency than the traditional K-means approach, covering all UEs with fewer hovering points. In addition, the effect of completion time reduction by the three-dimensional trajectory proposed in this article is also confirmed, which indicates that the optimization of the UAV’s flight altitude is effective for completion time reduction.
However, this article focused on the optimization of UAV trajectories, which mainly contributes to the reduction of flight time. Although flight time occupies a large proportion in the mission completion time, the hovering time for data collection and other advanced strategies, e.g., [40,41], also needs to be considered in future studies. Additionally, in real situations, environmental conditions such as obstacles like buildings, weather such as wind, rain, etc., also affect the flight of UAVs. For future issues of trajectory optimization, it is necessary to adapt advanced simulation models such as wind models, building models, etc. More practical numerical evaluations and demonstration experiments in real fields will be investigated in our future works.
Author Contributions
Conceptualization, R.Z. and G.K.T.; methodology, R.Z.; software, R.Z.; validation, R.Z.; formal analysis, R.Z.; investigation, R.Z.; data curation, R.Z.; writing—original draft preparation, R.Z.; writing—review and editing, G.K.T.; visualization, R.Z.; supervision, G.K.T. All authors have read and agreed to the published version of the manuscript.
Funding
This research received no external funding.
Institutional Review Board Statement
Not applicable.
Informed Consent Statement
Not applicable.
Data Availability Statement
Data is contained within the article.
Conflicts of Interest
The authors declare no conflicts of interest.
References
- Ministry of Internal Affairs and Communications. Communication Situation in the Great East Japan Earthquake (in Japanese). Available online: https://www.soumu.go.jp/johotsusintokei/whitepaper/ja/h23/pdf/n0010000.pdf (accessed on 25 February 2025).
- National Institute of Information and Communications Technology. Disaster-Resilient Communication Networks: Introduction Guidelines (in Japanese). Available online: https://www.nict.go.jp/resil/pdf/guideline202006.pdf (accessed on 25 February 2025).
- Yamamoto Town. Damage from the Great East Japan Earthquake and Tsunami (in Japanese). Available online: https://www.town.yamamoto.miyagi.jp/site/fukkou/324.html (accessed on 25 February 2025).
- Ministry of Internal Affairs and Communications, Information and Communications in Japan White Paper 2022. Available online: https://www.soumu.go.jp/johotsusintokei/whitepaper/eng/WP2022/chapter-2_1.pdf (accessed on 23 May 2025).
- Sharma, A.; Vanjani, P.; Paliwal, N.; Basnayaka, C.M.W.; Jayakody, D.N.K.; Wang, H.C.; Muthuchidambaranathan, P. Communication and networking technologies for UAVs: A survey. J. Netw. Comput. Appl. 2020, 168, 102739. [Google Scholar] [CrossRef]
- Han, S.I. Survey on UAV Deployment and Trajectory in Wireless Communication Networks: Applications and Challenges. Information 2022, 13, 389. [Google Scholar] [CrossRef]
- Hussain, A.; Li, S.; Hussain, T.; Lin, X.; Ali, F.; AlZubi, A.A. Computing Challenges of UAV Networks: A Comprehensive Survey. Comput. Mater. Contin. 2024, 81, 1999–2051. [Google Scholar] [CrossRef]
- Gu, X.; Zhang, G. A survey on UAV-assisted wireless communications: Recent advances and future trends. Comput. Commun. 2023, 208, 44–78. [Google Scholar] [CrossRef]
- Choi, S.-C.; Kim, S.-Y. An Independent UAV-Based Mobile Base Station. Sensors 2025, 25, 1349. [Google Scholar] [CrossRef]
- Tran, G.K. Temporary Communication Network Using Millimeter-Wave Drone Base Stations. In Proceedings of the 2024 IEEE VTS Asia Pacific Wireless Communications Symposium (APWCS), Singapore, 21–23 August 2024; pp. 1–5. [Google Scholar] [CrossRef]
- Ozpolat, M.; Al-Rubaye, S.; Williamson, A.; Tsourdos, A. Integration of Unmanned Aerial Vehicles and LTE: A Scenario-Dependent Analysis. In Proceedings of the 2022 International Conference on Connected Vehicle and Expo (ICCVE), Lakeland, FL, USA, 7–9 March 2022; pp. 1–6. [Google Scholar] [CrossRef]
- Sumitani, T.; Tran, G.K. Study on the Construction of mmWave Based IAB-UAV Networks. In Proceeding of AINTEC 2022, December 2022. (Presented on Dec. 20). Available online: https://interlab.ait.ac.th/aintec2022/ (accessed on 10 June 2025).
- Zhao, R.; Tran, G.K. Completion Time Minimization for UAV-Based Post-Disaster Data Collection. In Proceeding of SmartCom2024, November 2024. Available online: https://ken.ieice.org/ken/program/index.php?mode=program&tgs_regid=22056851da7480742c6cdc2a4d2ee8ba037f1bacaa08ad023793482ee0bd2f85&layout=&lang=eng (accessed on 10 June 2025).
- Amrallah, A.; Mohamed, E.M.; Tran, G.K.; Sakaguchi, K. UAV Trajectory Optimization in a Post-Disaster Area Using Dual Energy-Aware Bandits. Sensors 2023, 23, 1402. [Google Scholar] [CrossRef]
- Tran, G.K.; Kamei, T.; Tanaka, S. Route Optimization of Unmanned Aerial Vehicle Sensors for Localization of Wireless Emitters in Outdoor Environments. Network 2023, 3, 326–342. [Google Scholar] [CrossRef]
- Deruyck, M.; Wyckmans, J.; Joseph, W.; Martens, L. Designing UAV-aided emergency networks for large-scale disaster scenarios. J. Wirel. Commun. Netw. 2018, 1, 79. [Google Scholar] [CrossRef]
- Masaoka, R.; Tran, G.K.; Nakazato, J.; Sakaguchi, K. The Future of Flying Base Stations: Empirical and Numerical Investigations of mmWave-Enabled UAVs. Future Internet 2024, 16, 5. [Google Scholar] [CrossRef]
- El Debeiki, M.; Al-Rubaye, S.; Perrusquía, A.; Conrad, C.; Flores-Campos, J.A. An Advanced Path Planning and UAV Relay System: Enhancing Connectivity in Rural Environments. Future Internet 2024, 16, 89. [Google Scholar] [CrossRef]
- Wang, W.; Wei, X.; Jia, Y.; Chen, M. UAV relay network deployment through the area with barriers. Ad Hoc Netw. 2023, 149, 103222. [Google Scholar] [CrossRef]
- Chandran, I.; Vipin, K. Multi-UAV networks for disaster monitoring: Challenges and opportunities from a network perspective. Drone Syst. Appl. 2024, 12, 1–28. [Google Scholar]
- Zhang, Y.; Kuang, Z.; Feng, Y.; Hou, F. Task Offloading and Trajectory Optimization for Secure Communications in Dynamic User Multi-UAV MEC Systems. IEEE Trans. Mob. Comput. 2024, 23, 14427–14440. [Google Scholar] [CrossRef]
- Zhang, T.; Lei, J.; Liu, Y.; Feng, C.; Nallanathan, A. Trajectory Optimization for UAV Emergency Communication With Limited User Equipment Energy: A Safe-DQN Approach. IEEE Trans. Green Commun. Netw. 2021, 5, 1236–1247. [Google Scholar] [CrossRef]
- Li, M.; Liu, X.; Wang, H. Completion Time Minimization Considering GNs’ Energy for UAV-Assisted Data Collection. IEEE Wirel. Commun. Lett. 2023, 12, 2128–2132. [Google Scholar] [CrossRef]
- Li, J.; Zhao, H.; Wang, H.; Gu, F.; Wei, J.; Yin, H.; Ren, B. Joint Optimization on Trajectory, Altitude, Velocity, and Link Scheduling for Minimum Mission Time in UAV-Aided Data Collection. IEEE Internet Things J. 2020, 7, 1464–1475. [Google Scholar] [CrossRef]
- Al-Hourani, A.; Kandeepan, S.; Lardner, S. Optimal LAP Altitude for Maximum Coverage. IEEE Wirel. Commun. Lett. 2014, 3, 569–572. [Google Scholar] [CrossRef]
- Singh, A.; Redhu, S.; Hegde, R.M. UAV Altitude Optimization for Efficient Energy Harvesting in IoT Networks. In Proceedings of the 2022 National Conference on Communications (NCC), Mumbai, India, 24–27 May 2022; pp. 350–355. [Google Scholar]
- Dai, X.; Duo, B.; Yuan, X.; Renzo, M.D. Energy-Efficient UAV Communications in the Presence of Wind: 3D Modeling and Trajectory Design. IEEE Trans. Wirel. Commun. 2024, 23, 1840–1854. [Google Scholar] [CrossRef]
- Alzenad, M.; El-Keyi, A.; Yanikomeroglu, H. 3-D Placement of an Unmanned Aerial Vehicle Base Station for Maximum Coverage of Users With Different QoS Requirements. IEEE Wirel. Commun. Lett. 2018, 7, 38–41. [Google Scholar] [CrossRef]
- Basnayake, V.; Mabed, H.; Canalda, P.; Jayakody, D.N.K. Continuous and Responsive D2D Victim Localization for Post-Disaster Emergencies. IEEE Trans. Mob. Comput. 2024, 23, 7422–7437. [Google Scholar] [CrossRef]
- Yu, J.; Ye, F. User Equipment Localization and Victim Estimation with Next-Generation PSC in Emergency Response. In Proceedings of the 2019 IEEE Global Communications Conference (GLOBECOM), Waikoloa, HI, USA, 9–13 December 2019; pp. 1–6. [Google Scholar]
- Yabe, T.; Jones, N.K.W.; Rao, P.S.C.; González, M.C.; Ukkusuri, S.V. Mobile phone location data for disasters: A review from natural hazards and epidemics. Comput. Environ. Urban Syst. 2022, 94, 101777. [Google Scholar] [CrossRef]
- Adeel, A.; Gogate, M.; Farooq, S.; Ieracitano, C. A Survey on the Role of Wireless Sensor Networks and IoT in Disaster Management. In Geological Disaster Monitoring Based on Sensor Networks; Springer: New York, NY, USA, 2019. [Google Scholar]
- Matracia, M.; Saeed, N.; Kishk, M.A.; Alouini, M.-S. Post-Disaster Communications: Enabling Technologies, Architectures, and Open Challenges. IEEE Open J. Commun. Soc. 2022, 3, 1177–2022. [Google Scholar] [CrossRef]
- Friis, H.T. A Note on a Simple Transmission Formula. IRE Proc. 1946, 34, 254–256. [Google Scholar] [CrossRef]
- Shannon, C.E. A Mathematical Theory of Communication. Bell Syst. Tech. J. 1948, 27, 379–423. [Google Scholar] [CrossRef]
- Ozasa, M.; Tran, G.K.; Sakaguchi, K. Research on the Placement Method of UAV Base Stations for Dynamic Users. In Proceedings of the 2021 IEEE VTS 17th Asia Pacific Wireless Communications Symposium (APWCS), Osaka, Japan, 30–31 August 2021; pp. 1–5. [Google Scholar]
- Toregas, C.; Swain, R.; ReVelle, C.; Bergman, L. The Location of Emergency Service Facilities. Oper. Res. 1971, 19, 1363–1373. [Google Scholar] [CrossRef]
- Eshelman, L.J.; David Schaffer, J. Real-Coded Genetic Algorithms and Interval-Schemata. Found. Genet. Algorithms 1993, 2, 187–202. [Google Scholar]
- Zhao, R.K. Time Minimization for UAV-Based Post-Disaster Data Collection. Master Thesis, Institute of Science Tokyo, Tokyo, Japan, March 2025. [Google Scholar]
- Gao, R.; Wang, X. Rapid Deployment Method for Multi-Scene UAV Base Stations for Disaster Emergency Communications. Appl. Sci. 2023, 13, 10723. [Google Scholar] [CrossRef]
- Shamsoshoara, A.; Afghah, F.; Blasch, E.; Ashdown, J. UAV-Assisted Communication in Remote Disaster Areas Using Imitation Learning. IEEE Open J. Commun. Soc. 2021, 2, 738–753. [Google Scholar] [CrossRef]


Disclaimer/Publisher’s Note: The statements, opinions and data contained in all publications are solely those of the individual author(s) and contributor(s) and not of MDPI and/or the editor(s). MDPI and/or the editor(s) disclaim responsibility for any injury to people or property resulting from any ideas, methods, instructions or products referred to in the content. |
© 2025 by the authors. Licensee MDPI, Basel, Switzerland. This article is an open access article distributed under the terms and conditions of the Creative Commons Attribution (CC BY) license (https://creativecommons.org/licenses/by/4.0/).