Article

A Cross-Layer Approach to Analyzing Energy Consumption and Lifetime of a Wireless Sensor Node

by
Fernando Ojeda
1,†,
Diego Mendez
1,*,†,
Arturo Fajardo
1,†,
Maximilian Gottfried Becker
2,† and
Frank Ellinger
2,†
1
Electronics Engineering Department, Pontificia Universidad Javeriana, Bogotá 110231, Colombia
2
Chair for Circuit Design and Network Theory, Technische Universität Dresden, 01069 Dresden, Germany
*
Author to whom correspondence should be addressed.
These authors contributed equally to this work.
J. Sens. Actuator Netw. 2024, 13(5), 56; https://doi.org/10.3390/jsan13050056
Submission received: 29 July 2024 / Revised: 13 September 2024 / Accepted: 15 September 2024 / Published: 19 September 2024
(This article belongs to the Section Communications and Networking)

Abstract

:
Several wireless communication technologies, including Wireless Sensor Networks (WSNs), are essential for Internet of Things (IoT) applications. WSNs employ a layered framework to govern data exchanges between sender and recipient, which facilitates the establishment of rules and standards. However, in this conventional framework, network data sharing is limited to directly stacked layers, allowing manufacturers to develop proprietary protocols while impeding WSN optimization, such as energy consumption minimization, due to non-directly stacked layer effects on network performance. A Cross-Layer (CL) framework addresses implementation, modeling, and design challenges in IoT systems by allowing unrestricted data and parameter sharing between non-stacked layers. This holistic approach captures system dynamics, enabling network design optimization to address IoT network challenges. This paper introduces a novel CL modeling methodology for wireless communication systems, which is applied in two case studies to develop models for estimating energy consumption metrics, including node and network lifetime. Each case study validates the resulting model through experimental tests, demonstrating high accuracy with less than 3% error.

1. Introduction

A typical Internet of Things (IoT) system involves data sensing, exchange, and analysis for a wide range of applications [1]. In many cases, the IoT adopts an IP-based architecture, with wireless sensor networks (WSNs) as the network backbone [2,3]. The WSN integrates nodes with network robustness (e.g., self-healing and self-organization capabilities) and hardware constraints (e.g., limited energy capacity) [4,5]. These nodes collect and transmit data to a central point accessible to users via the Internet, as shown in Figure 1.
Deploying WSNs in outdoor environments is susceptible to factors such as temperature, weather, and electromagnetic noise that can disrupt operation [6,7]. These disturbances cause interference and retransmissions, which reduce the network’s lifetime and imply robustness at the nodes. Therefore, accurate network models are required to capture system dynamics and behavior and evaluate the impact of these factors to improve performance and extend network lifetime.
IoT network design, modeling, and deployment often follow a layered framework like the Open System Interconnection (OSI) model, facilitating communication processes through predefined layer functionalities. However, this traditional approach limits data sharing to directly stacked layers, hindering the understanding of dynamics between configurations of non-directly stacked layers [8]. For instance, it is a very difficult task to measure the impact on the lifetime of the network that a particular radio-frequency power amplifier would have since such circuit parameters are normally analyzed at the physical layer, very “far” from the network layer [9,10]. A holistic approach to analyzing IoT systems, employing a Cross-Layer (CL) framework, allows unrestricted information exchange between layers. This fosters flexible architecture and cohesive system function, promoting a better understanding of interdependencies between layers [11,12,13].
A traditional stacked layer model abstracts specific tasks and facilitates data transmission by allowing communication between adjacent layers [11]. However, it cannot be extended to cover additional interactions, such as routing protocols, topology control, and sensing measurements. The CL framework, by contrast, introduces the concept of levels, grouping system characteristics and functionalities based on the application architecture. This allows direct and indirect information exchange across levels, offering a more holistic view of system dynamics. Our proposal adopts the level concept to avoid confusion with the traditional layer definition.
The contributions of this paper are summarized as follows:
  • We propose a CL methodology to develop a comprehensive energy model that captures system dynamics based on the application architecture.
  • The energy model is applied to specific case studies, defining multiple layers and focusing on the functional interactions between node components and transmission.
  • We evaluated the model, which provides a low error margin lifetime estimate.
This paper presents a novel CL network modeling methodology for IoT systems, focusing on system characterization rather than minimizing specific metrics. It uses a three-level approach and functional block descriptions of modeling entities to develop energy models for accurately predicting node lifetimes. Evaluation through case studies using a two-level approach demonstrates high accuracy with an error of less than 3%. The rest of the paper is organized as follows: Section 2 presents the related work; Section 3 presents the proposed CL modeling methodology; in Section 4 and  Section 5, we present two different case studies to show how our methodology can be applied; the results are analyzed in Section 6; and the conclusions are presented in Section 7.

2. Related Work

The emergence of CL frameworks has significantly impacted the design and optimization of IoT networks, aiming to tackle specific challenges inherent in these systems [14]. Various studies have introduced tailored approaches to different IoT problems, each with its strengths and limitations [14]. Table 1 compares different CL models, emphasizing their focus on network modeling and energy metrics. While most models cover both network and physical layers, they lack sufficient exploration of how hardware variables impact energy models at the network level, particularly within the physical layer. These approaches suggest that a CL framework that excludes layers involved in an application may not comprehensively evaluate all WSN metrics. Furthermore, such models fail to capture the interdependence of parameters across non-adjacent layers, a critical aspect of the CL methodology.
In detail, Hasan et al. [15] focus on analyzing radio irregularities’ effects on IoT transmission systems, particularly emphasizing channel access mechanisms and wireless link channel access to meet Quality of Service (QoS) requirements. However, their model overlooks energy consumption beyond RF transceiver modules, which is crucial for a comprehensive energy-aware design. Chandravathi et al. [16] introduce a cross-layer optimization technique to improve energy efficiency in WSNs. The technique focuses on selecting cluster heads by considering parameters from multiple layers, which helps to improve overall energy efficiency. The method combines residual energy-based sleep scheduling and congestion control mechanisms to reduce packet loss and end-to-end delay. However, it overlooks important energy consumption aspects necessary for sustainable IoT operations.
Moreover, Bakni et al. propose in [17] a CL energy-aware model for WSNs, covering network heterogeneity but lacking detailed consideration of RF module energy consumption and integration of non-repetitive tasks, limiting its applicability in real-world scenarios where energy efficiency is crucial. In contrast, Singh et al. propose [18] an adaptive CL routing protocol for cluster heads, yet their energy model overlooks certain sensor nodes’s energy aspects, potentially impacting the accuracy of energy-aware routing decisions and overall network performance.
Raj et al. [19] propose a solution to enhance energy efficiency and data transfer in WSN. They suggest using a Partially Informed Sparse Autoencoder (PISAE) for data reconstruction and the Cross-Layer-Based Opportunistic Routing Protocol (CORP) for optimizing routing. Their energy model only considers the RF radio model for transmitting and receiving data across the network. Similarly, Cherappa et al. [20] implement an Adaptative Sailfish Optimization (ASFO) algorithm and a Cross-Layer-Based Expedient Routing Protocol to enhance energy efficiency and improve packet delivery ratio, throughput, and network lifetime, all while considering the RF radio consumption model. However, neither model addresses other aspects of energy consumption in the sensor nodes, such as the microcontroller and battery.
Finally, recent work like by Naeemet et al. in [21] and Lipare et al. in [3] introduce dynamic clustering schemes and multi-layer network models, respectively, aiming to enhance operational efficiency and provide a comprehensive understanding of energy dynamics. However, both models lack consideration of the sensor node’s operating states and other sources of energy consumption, hindering their predictive accuracy.
In summary, the current state of CL modeling for IoT networks is evolving towards more comprehensive energy-aware design strategies. However, there is a pressing need for further research to incorporate detailed energy models that consider various consumption sources and operational states of the sensor nodes, thus improving the accuracy of energy consumption predictions. For a deeper understanding of sensor network modeling within the CL approach, interested readers are encouraged to explore [14].
Table 1. Summary and comparison of cross-layer models.
SchemeApproachLayers Contributed in Cross-Layer ApproachResultEnergy ModelModel ParametersEvaluation Approach
Raj et al. 2023 [19]The CLD approach for routing optimization in WSNPhysical, link, and network layersOptimization algorithms to select cluster heads with lower energy consumptionRF radioDistance, payload, power amplifier energy, and transceiver circuit energyAlgorithm (simulation tool not reported)
Cherappa et al. 2023 [20]The CLD approach for routing optimizationPhysical, link, and network layersOptimization algorithms to select the shortest path with lower energy consumptionRF radioPayload, power amplifier energy, and transceiver circuit energyAlgorithm (simulation tool not reported)
Bakni et al. 2021 [17]Energy efficient CLD approach for WSNPhysical, Link, and network layerCross-layer interaction. The ability to provide energy consumption at different levels of abstractionMicro-controller, RF radio, sensing unitAverage power consumptionSimulation (OMNET++, NS-2)
Chandravathi et al. 2021 [16]The CLD approach for cluster head selectionTransport, network, MAC and physical layersCluster Head selection scheme with dynamically adjusted sleep scheduling mechanism considering connectivity and residual energyRF RadioDistance, payload, power amplifier energy, transceiver circuit energy and data aggregation energySimulation (software tool not reported)
Lipare et al. 2020 [3]Multi-layer network model to balance the overall load on the networkPhysical and network layersRouting and clustering multi-layer structureRF radioDistance, payload, power amplifier energy, and transceiver circuit energyAlgorithm implementation in MATLAB
Hasan et al. 2018 [15]The CLD approach for QoSApplication, network, link, and physical layersThe Markov chain evaluates the energy consumption for multi-hop network communication by defining a critical path-loss while taking into account the randomness of the hop distance between connected nodesRF radioPower transition states (transmit, receive, idle, and sleep), power amplifier, transmission rate, and distanceSimulation (MATLAB)
Naeemet et al. 2017 [21]Dynamic clustering scheme for heterogeneous WSN with a multi-layer realization to enhance lifetime maximizationPhysical and network layerCluster Head selection scheme, intra- and inter-layersRF radioDistance, payload, power amplifier energy, transceiver circuit energy and data aggregation energyAlgorithm (simulation tool not reported)
Singh et al. 2017 [22]Energy efficient CLD approach based on adaptive threshold sensitive distributed routing protocolTransport layer, MAC layer, physical layerATEER is tested and simulated by previously established routing protocols. It has increased the lifetime of the network in contrast with the old techniquesRF radioDistance, payload, power amplifier energy, transceiver circuit energy, and data aggregation energySimulation (software tool not reported)
Ojeda et al. 2023 [14]SurveyNode, network and systemTaxonomyMCU, RF radio, sensor unit, battery, communication medium, and MAC protocolAverage power consumption, distance, payload, power amplifier energy, transceiver circuit energy, modulation, medium channel, MAC times, and data aggregation energy

3. Cross-Layer Framework

This section initially presents the differences between a layered and a cross-layer modeling approach and proposes a cross-layer methodology for modeling wireless communication systems. After applying the proposed methodology, a three-level block diagram is achieved for a general wireless communication system.

3.1. Layered vs. Cross-Layer Frameworks

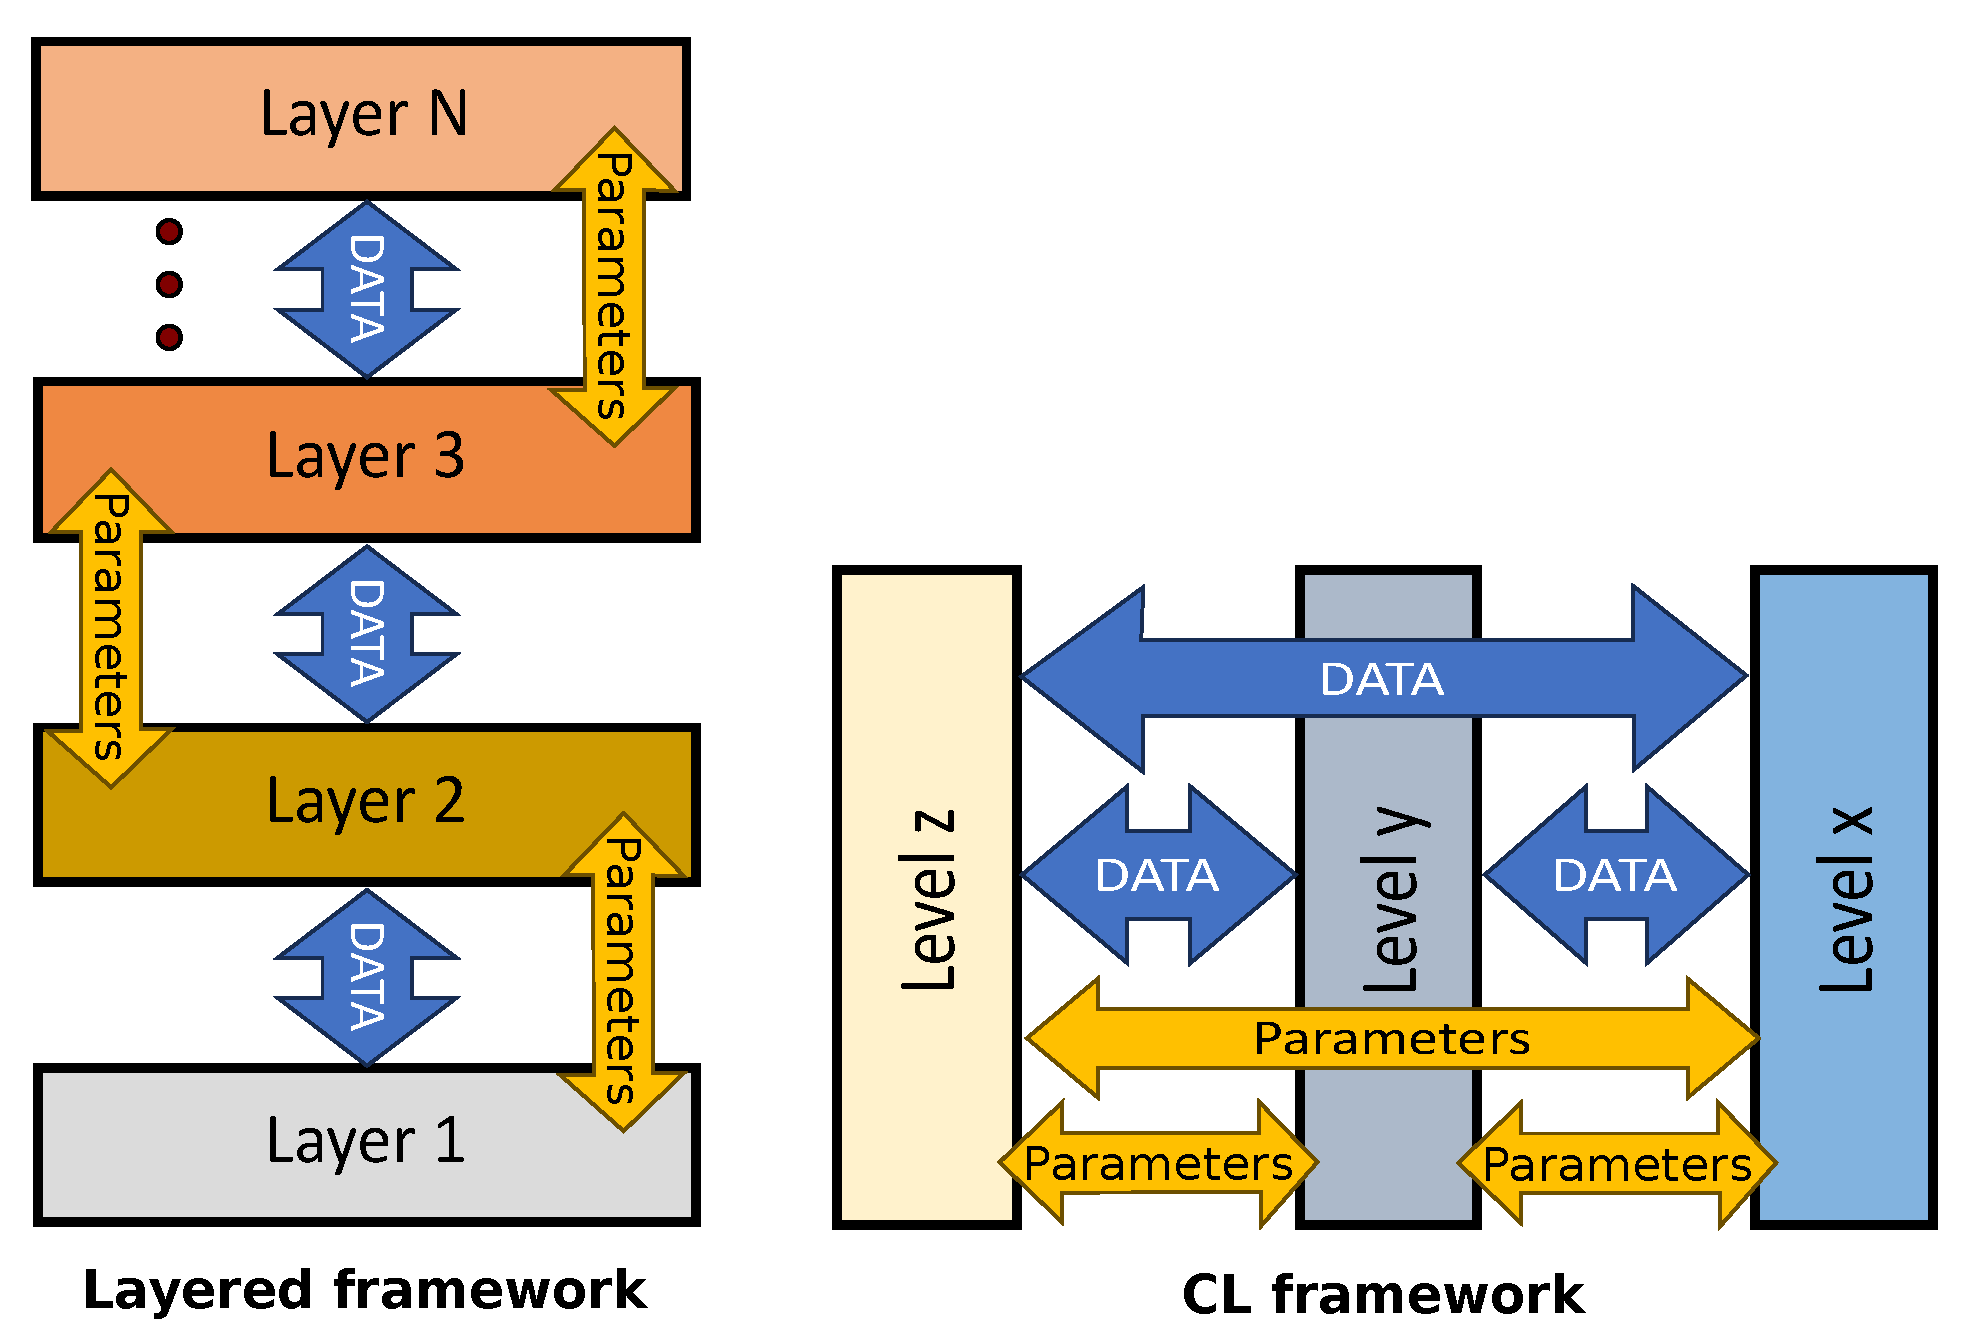
IoT applications based on WSN are challenging due to the large number of parameters and variables that affect system performance. A common approach to the model, design, and deployment of this type of network is the layered framework. This framework uses layers to ensure interoperability by abstracting the communication process [11,23]. Each layer has predefined communication functionality that facilitates interoperability between adjacent layers. The layered framework maintains layer independence, preventing interaction between non-stacked layers without modification (i.e., OSI reference model). In the layered framework, each layer is associated with a set of parameters and data sent to adjacent layers for calls and responses, as seen in Figure 2. However, it does not consider how abstract definitions, such as topology control or routing protocols, or components, such as battery capacity and micro-controller units (MCUs), handle effects across layers simultaneously.
The cross-layer (CL) framework concept has emerged as a new paradigm, evolving from directly restricting communication between stacked layers to allowing free communication between layers [23,24]. In traditional stacked layers, layer functionality is restricted to individual layers, whereas the CL framework-level concept combines layers, creates new layers, and establishes interdependencies between them [16]. This methodology provides greater flexibility in understanding the interaction between the hardware and software in the sensor node, the network protocols, and the system, facilitating their simultaneous integration into the IoT network [17,18,23,24]. In their work, Bakni et al. highlighted the key concepts underlying the CL framework [17]:
1.
Parameter: a configurable value representing a specific property of the level to which it belongs.
2.
Data: refers to the information transmitted within each architecture level.
3.
Level: an abstract design concept grouping a set of parameters that describe the same part of a modeled system.
4.
Interaction: a relationship between two parameters that influence each other. Two definitions are given: intra-level interactions occur when the parameters belong to the same level, while cross-level interactions occur when the parameters belong to different levels.
The Cross-Layer (CL) framework facilitates the exchange of information between layers that are not directly stacked. This approach provides flexibility and adaptability for both hardware and applications. In general, this framework allows bi-directional communication between non-directly stacked layers using parameters and data exchange. Furthermore, from a simple point of view, the layer can be understood as the merge of directly (or not) stacked layers used in the layer framework. However, the level is defined by performance, metric boundaries, or roles, resulting in a well-defined architecture that includes a certain number of levels. Unlike traditional stacked layers, the CL framework is characterized by a few number of layers, as shown in Figure 2.

3.2. Proposed Cross-Layer Modeling Methodology

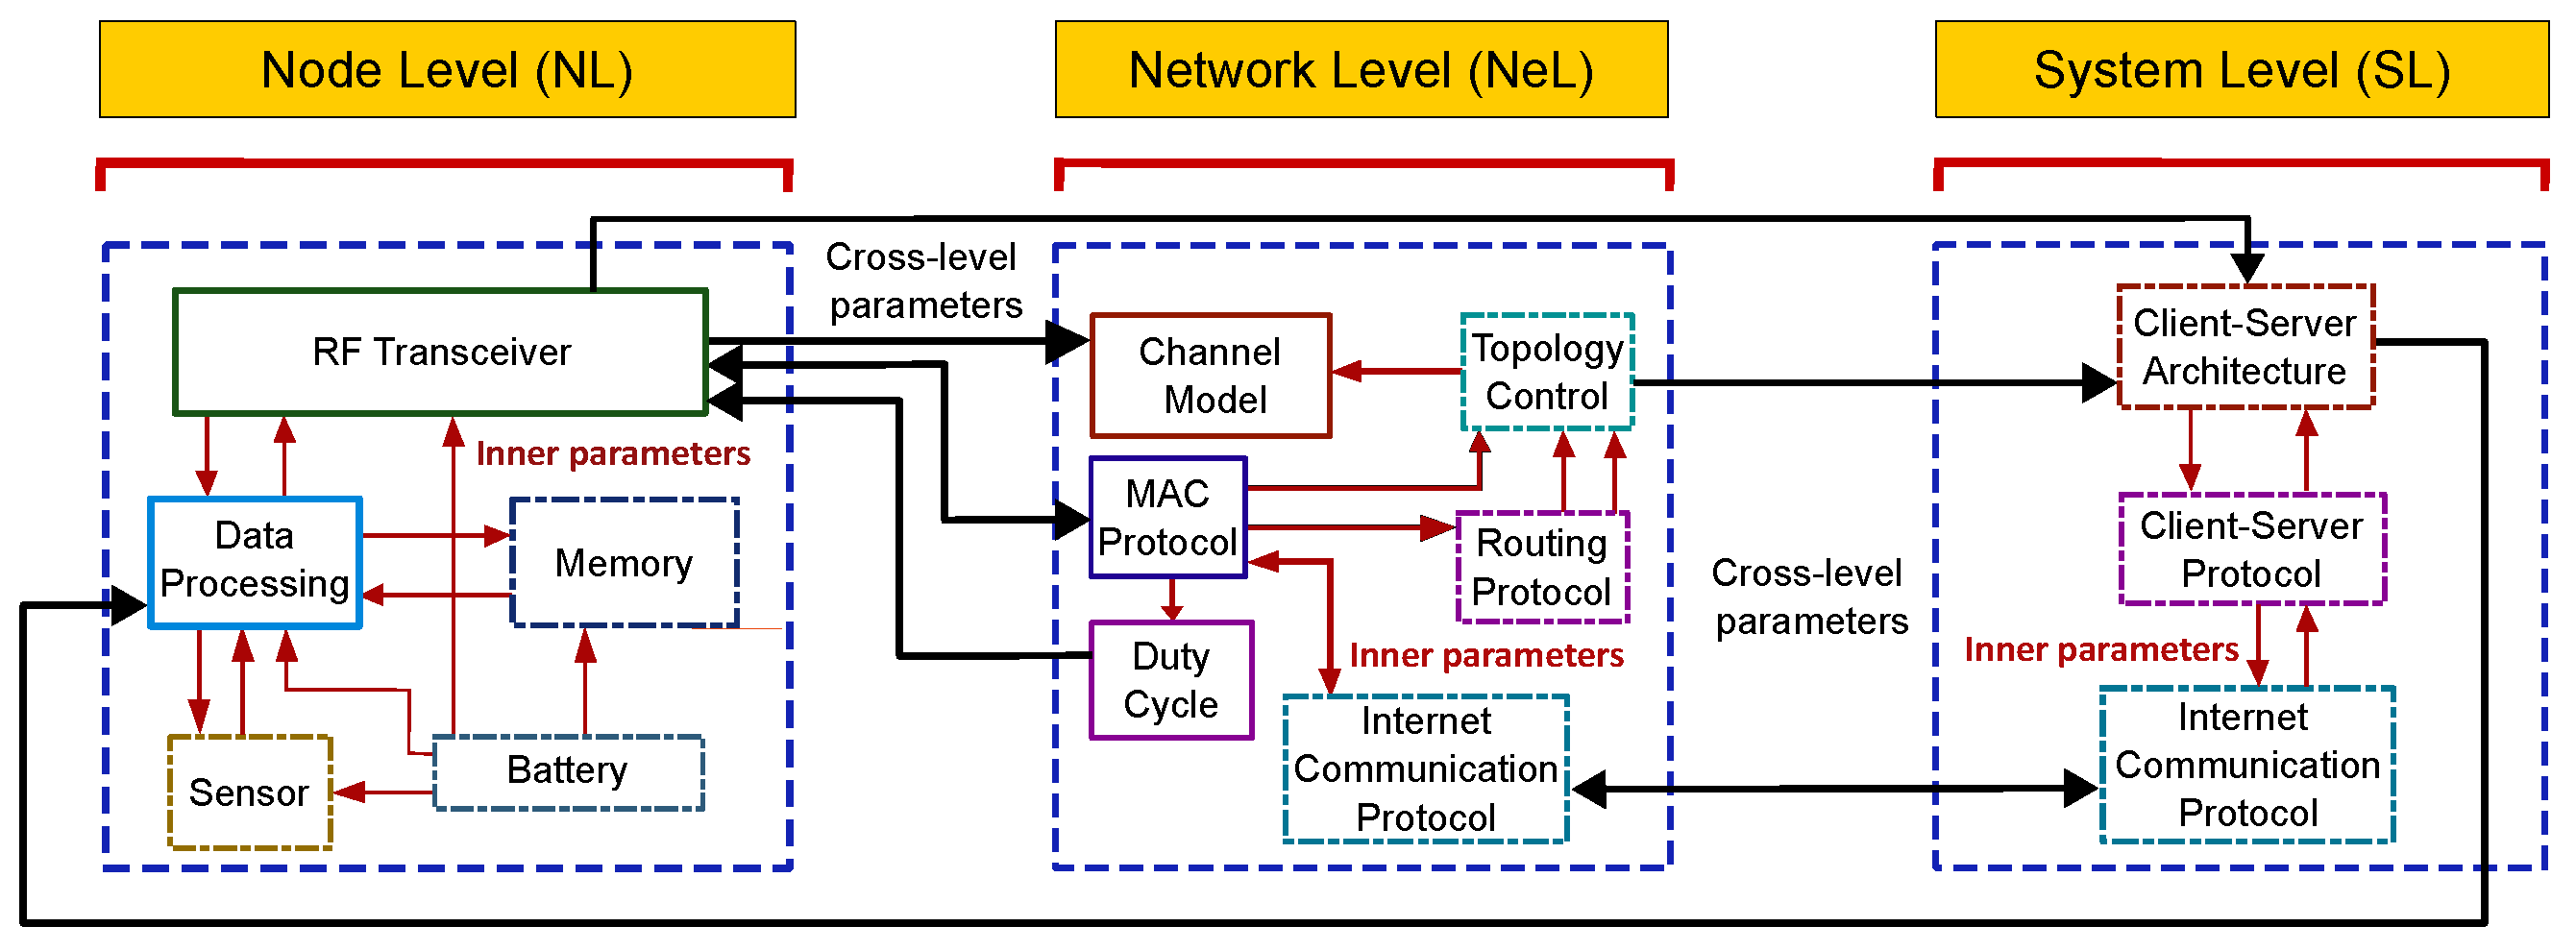
The IoT network modeling methodology uses the CL framework to generate models that provide enhanced flexibility and adaptability in capturing the dynamics of a wireless network. These dynamics arise from interactions between hardware, software, and applications present in both stacked and non-stacked levels [18]. The proposed methodology considers only three levels of abstraction [14]:
1.
The node level focuses on the functional aspects related to the interaction between node components.
2.
The network level focuses on the functional aspects related to transmission, routing protocols, topology control, and data collected from various IoT devices and senders over the Internet.
3.
The system level focuses on the highly abstracted functional aspects of the application, for instance, a client–server scheme.
The proposed methodology introduces the block concept in the modeling process to streamline inter-level communication and parameter/data exchange. The block concept implements the black-box methodology, embodying specific behaviors of entities such as devices, algorithms, or protocols determined by input–output relationships. Interconnections between blocks allow parameter and information exchange between blocks.
The proposed methodology is outlined in Algorithm 1, consisting of three processes, as seen from the designer/modeler’s point of view. First, the modeler selects one to three levels based on the target metric and contextual understanding. Next, the modeler determines the necessary blocks and parameters to capture the relevant dynamics accurately. Finally, the initial model is validated (via real deployment measurements or simulation) to obtain a model with the required accuracy. Furthermore, the model complexity is increased by adding more blocks or levels if necessary. The following subsections provide a detailed step-by-step description of the proposed methodology.
Algorithm 1 CL framework methodology
Select Levels
1:
Select metric to evaluate and threshold ( T H )
2:
Select predefined levels to work with: (i.e., node level only, node–network level, node–network–system level
Select Blocks
3:
Select predefined blocks per level
4:
Select parameters
Model Output Evaluation
Require: 
E M , R T M , N I , N I B
Ensure: 
T H > 0
5:
if ( | E M R T M | > T H   &   N I P T H I ) then
6:
     go back to step 4
▹ adjust or add parameters
7:
else if ( N I P = T H I & N I B T H I & | E M R T M | > T H ) then
8:
     go back to step 3
▹ add new block
9:
else if ( N I B > T H I & | E M R T M | > T H ) then
10:
    go back to step 1
▹ add new level
11:
else
12:
     Model accepted
13:
end if
  • where E M = estimate model output, R T M = real test measurement, N I P = Number of iterations parameters, N I B = Number of iterations block

3.2.1. Select Levels

The first step in our proposed methodology, as presented in Algorithm 1, is determining the metrics to be evaluated. In the proposed methodology, we use the metric definition proposed by Yuan et al. in [25], wherein a metric is a system or standard of measurement demonstrating a proposed solution’s advantages. Metrics include communication paradigms (such as data acquisition, data dissemination, peer-to-peer communication, and time synchronization), localization, system evaluation and/or optimization, and energy consumption. Additionally, this step requires the selection of a predetermined error threshold (TH), which is selected according to the requirements of the design to assess the model’s accuracy by the comparison of model outputs and empirical measurements. It is important to note that metrics related to system performance must be measured to enable modeling error reduction.
In Algorithm 1, the second step consists of selecting the number of levels to represent the model complexity according to the chosen metric. The predefined levels must range from one to three levels. The appropriate number of levels depends on the evaluation scenario (e.g., node level only or node-network levels) and the expertise of the modeler. If the predefined levels are insufficient to increase the required model accuracy, additional levels can be added during the model output evaluation process.
For instance, when we choose energy consumption as the metric and aim to assess how the power amplifier (PA) of an RF transceiver influences the power usage of a sensor node, our focus is on the node level. Likewise, when we seek to analyze how a specific MAC protocol impacts the energy consumption of a sensor network, we concentrate on the network level. Finally, when we want to examine the effect of an IoT protocol (such as CoAP or MQTT) on the network lifetime, we take into account both the network and system levels.

3.2.2. Select Blocks

In Algorithm 1, the third step involves the selection of predefined blocks for each level or the creation of new ones. Each block’s specification is based on its functionality, which is relevant to the analyzed metric. The minimum number of blocks selected determines the necessary dynamics to achieve a result.
In the fourth step of Algorithm 1, we must select the level block parameters. Depending on the analysis, we can choose one or a set of parameters based on the difference between the model output and TH.
For example, at the node level, if we want to evaluate the impact of a PA on sensor node energy consumption, we select the RF transceiver block and PA-related parameters such as drain efficiency, output power, and transmit power consumption. At the network level, if the focus is on evaluating the impact of a MAC protocol on energy consumption during data transmission, we select the MAC block and its relevant parameters, including Received Signal Strength Indicator (RSSI), Link Quality Indicator (LQI), channel listening time, and active mode duration.

3.2.3. Model Output Evaluation

The fifth and subsequent steps (until step 13th) of Algorithm 1 involve model evaluation. After selecting the necessary blocks to evaluate the metric, we compare the estimated model output (EM) with the real test measurements (RTM). This step requires a predetermined threshold iteration (THI) to determine if the model threshold (TH) is reached within a specified number of iterations. The methodology includes two types of iteration: one for block parameters (NIP) and one for block selection functionality (NIB).
If the significant difference between EM and the RTM is above TH and NIP is below THI, more parameters must be added for the block, and the EM must be recalculated for re-evaluation. If the difference between EM and RTM remains above TH, NIP equals THI (suggested as five iterations), and NIB is below THI, the blocks should be reevaluated at each level. There are two options: (i) reevaluate the mathematical representation of the model and identify missing parameters, or (ii) add an undefined block, formulate its mathematical representation, and recalculate the model output.
If the errors that remain after NIP and NIB exceed THI, the metric’s definition and achievement within TH should be reassessed. If the metric is well-defined, a new level with defined functionality, appropriate blocks, and parameters should be added. Evaluation should continue until model accuracy is achieved.
Establishing the conditions to evaluate the model in RTM is essential, although controlling all environmental factors that may disrupt WSN operations is challenging. Focusing on the most relevant interfering factors for model validation is recommended. To ensure accuracy, reliability, and relevance in RTM, measurement objectives, parameters, environmental factors, calibrated instruments, sampling rates, data collection methods, testing, data processing, and comparison to expected values or theoretical models must be clearly defined. These considerations ensure model accuracy.

3.2.4. Resulting Model Overview

The block diagram of a generic wireless communication system model, resulting from applying the proposed methodology, is shown in Figure 3. It consists of blocks at each level that interact by exchanging parameters and data internally or across levels, taking into account the node, the network, and the system levels. The interaction between the sensor node, the network, and the system is illustrated in Figure 3, showing the contribution of each identified block at their respective levels. Our proposal could enable the design, deployment, or modeling of IoT networks that consider different communication systems, such as Zigbee, WiFi, BLE, or LoRA, by easily integrating the corresponding model for each of the proposed blocks and levels.
The identification of each block is based on surveys and articles covering various aspects of IoT networks, including energy dissipation [9], RF transceiver power consumption [1,10,26], power amplifier (PA) power consumption [27], deployment, sensing and coverage [28], routing protocols [29], transmission, propagation and channel modeling [30], communication protocols [31], topology control [32], medium access control (MAC) protocol [33,34], duty cycle [28], WSN design methodologies [35], reliability [36], service-oriented and communication architectures [18], lightweight protocols [37], quality of service (QoS) [38], and communication engineering [39,40,41].
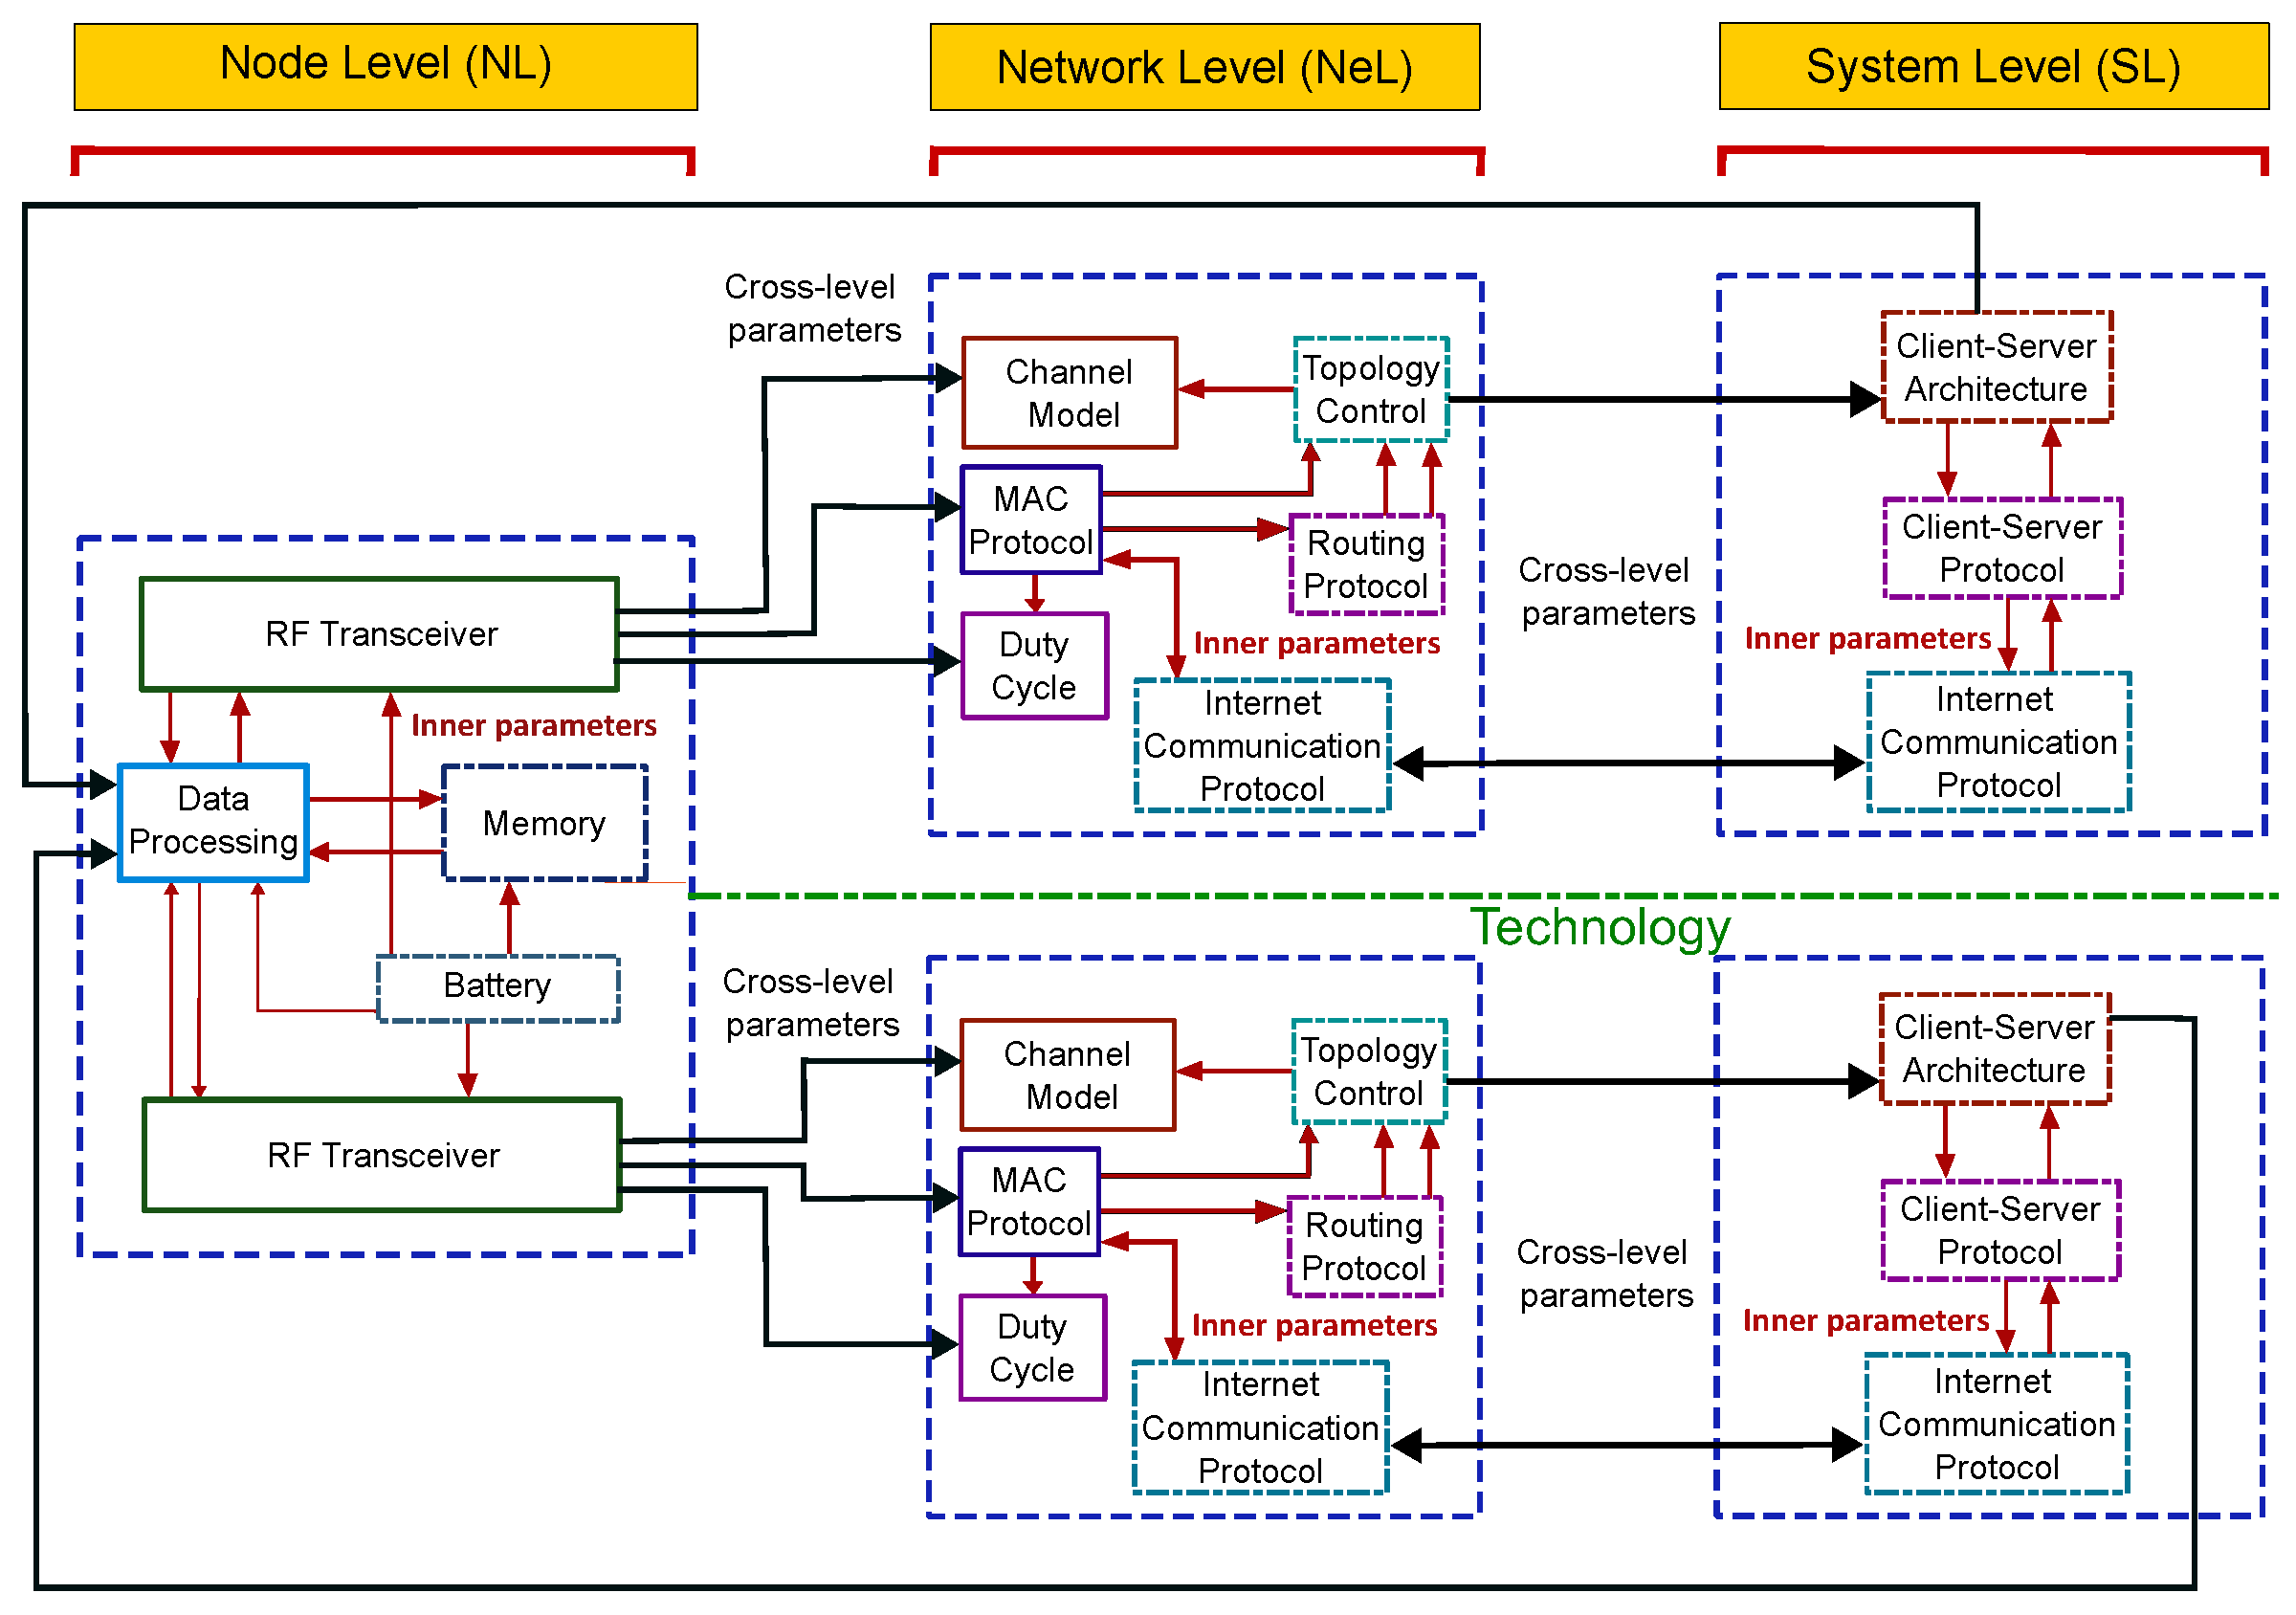
Figure 4 shows the block diagram of a generic sink model using the proposed methodology. The sink node, which has more processing power, memory, and energy resources than regular sensor nodes, manages the communication between the sensor network and external systems. It supports two wireless transceivers using different protocols. The diagram highlights the interactions at the node, network, and system levels and shows how the transceivers exchange data and reduce redundancy to ensure efficient data collection and routing.
Section 4 and Section 5 illustrate how our proposed methodology is applied in two case studies focusing on energy consumption in a WSN. We choose two levels (node and node–network levels) to characterize the sensor node’s contribution to the network and estimate its lifetime. This selection helps to identify the main components contributing to power consumption.

4. Case Study 1: CL Modeling of Node’s Lifetime under Flooding Process Conditions

This section provides a detailed step-by-step guide for applying the proposed methodology to model the node under flooding process conditions. Section 4.1 explains how to apply the modeling methodology in the case study; Section 4.2 outlines the simulation setup; and Section 4.3 describes the experimental setup used to validate the model.
We aim to develop a model for estimating the lifetime of a sensor node during the flooding process [42], which is crucial in WSNs for tasks such as route discovery in on-demand routing protocols. No data storage or retrieval and non-variable sensing tasks are performed. As a reference point to evaluate the performance of the model, we selected the Zolertia Re-Mote device, which incorporates a CC2538 transceiver and an ARM Cortex-M3 processor from Texas Instruments [43]. Using this node’s operational specifications, we implement the proposed model in MATLAB.

4.1. CL Methodology for Modeling Node Lifetime under Flooding Process Conditions

This subsection describes how the proposed CL methodology works to obtain an energy consumption model of the node, as described in Section 3.2.

4.1.1. Select Levels

The first step in Algorithm 1 is to choose the evaluation metric and the TH. In this case, the chosen metric is lifetime, with a TH of 3%. The 3% THD for lifetime estimation is chosen based on practical considerations. Estimation network models typically allow a 3% to 5% margin of error [26,34,44]. A 3% THD balances precision and efficiency, providing sufficient accuracy for power management decisions while maintaining system robustness. This level of accuracy supports critical tasks such as maintenance scheduling and power management without the excessive computational overhead that higher accuracy might require. As indicated in Algorithm 1, the second step is to determine the number of levels needed to implement the model. For the flooding process, we start by selecting the node level. At the node level, the energy model includes components that affect energy consumption under operational conditions. For case study 1, the scenario considers a fixed data rate, a fixed packet size, collision-free transmission, and no handshaking. Handshaking typically involves exchanging signals or messages to confirm that devices are ready to send and receive data.

4.1.2. Select Blocks

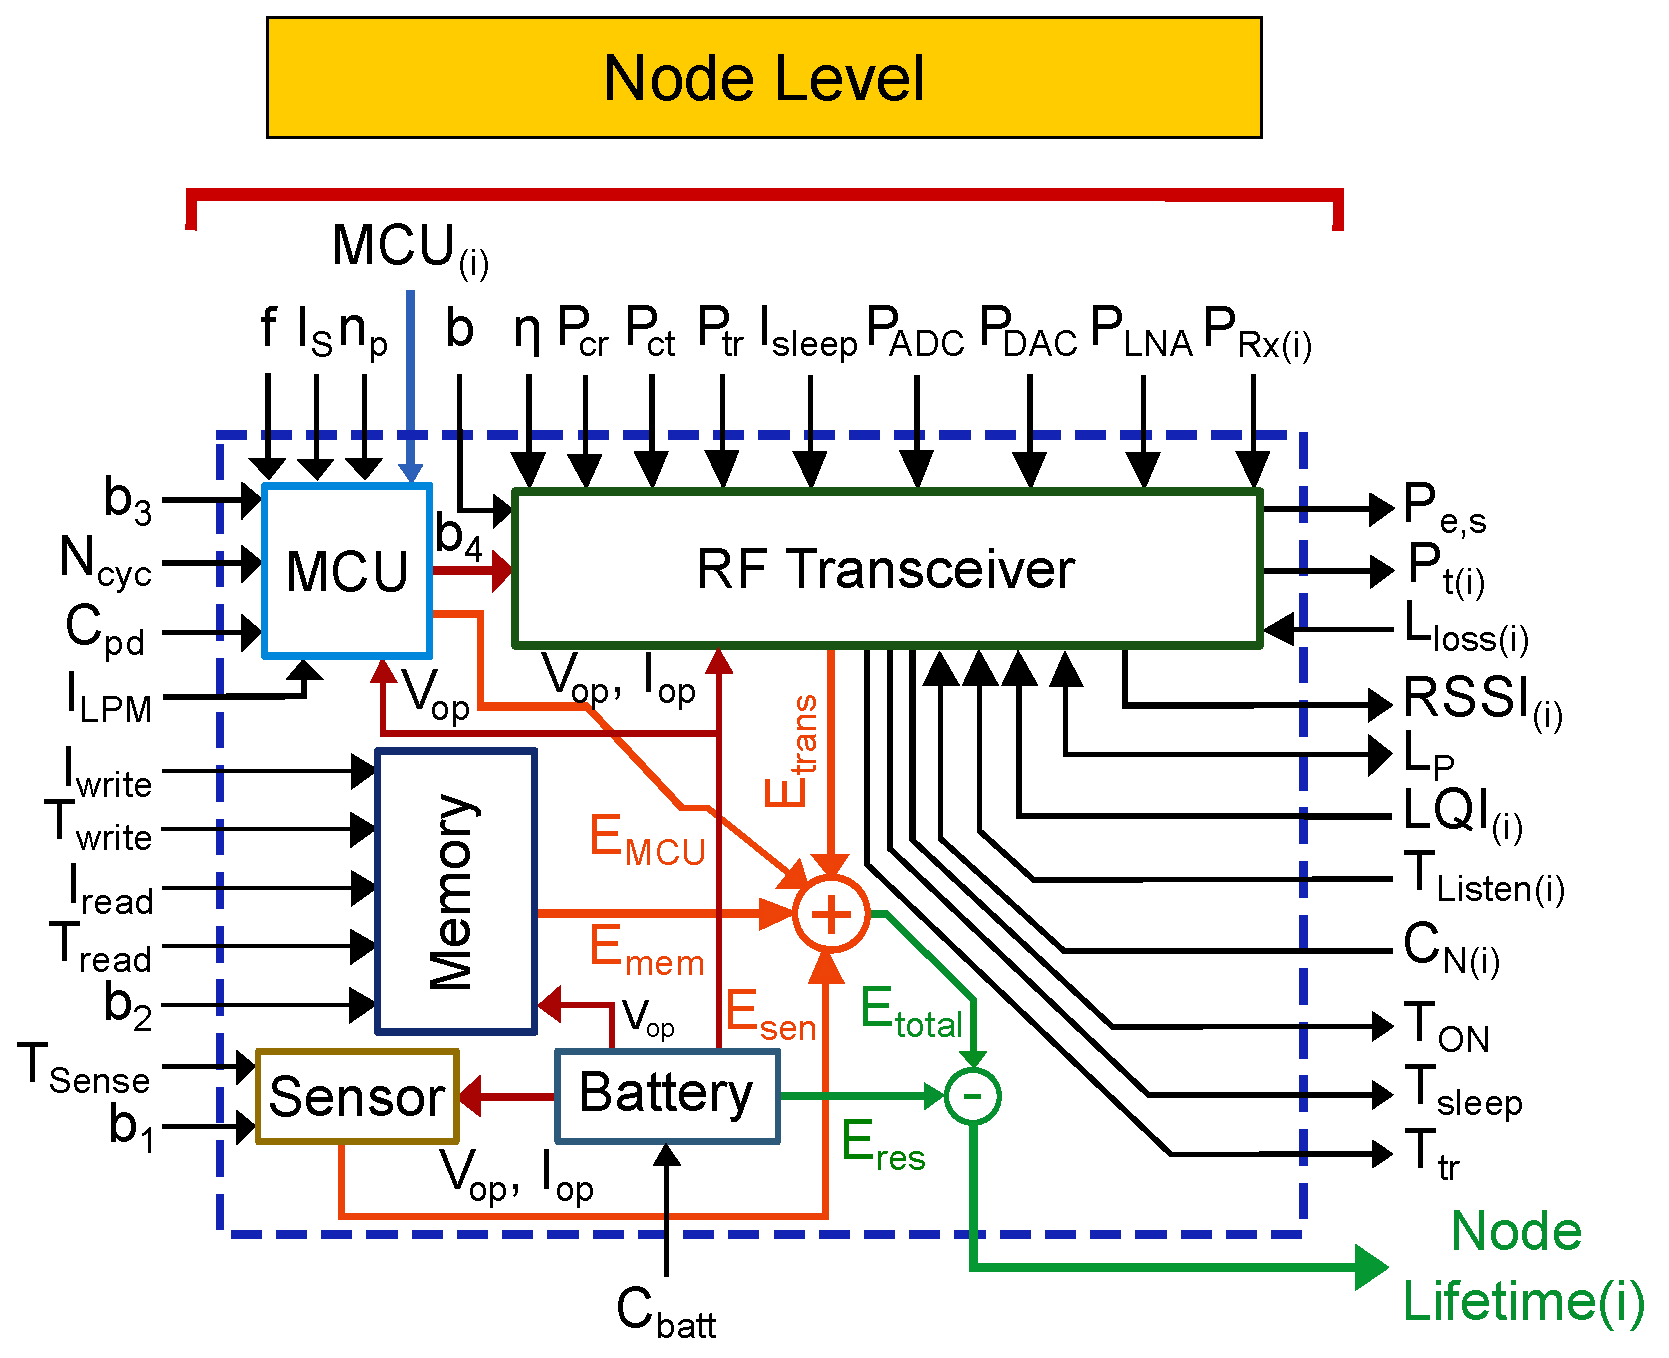
The third step described in Algorithm 1 is to determine the number of blocks for each level. In a wireless sensor node, we consider only five main components that influence the power consumption: (i) the MCU block for control and data processing; (ii) the RF transceiver block for transmission power and associated circuitry; (iii) the memory block for data storage; (iv) the battery block for powering all components; and (v) the sensor block for activity sensing. After identifying the major contributors to power consumption and prioritizing simplicity and completeness in the initial model, we select the MCU and RF transceiver based on our experience in WSN implementation [45]. In the following sections we detail the mathematical representation of the blocks.
  • MCU Block
The MCU block considers dynamic and static power, including low-power mode (LPM). The total power dissipation of MCU ( P M C U ), proposed by Dibal et al. in [46], is as follows:
P M C U ( b 3 , N c y c ) = b 3 · f · N c y c · C p d · V o p 2 + V o p · ( I s e V o p n p · V t )
where b 3 is the number of bits used by the MCU, N c y c is the number of clock cycles per task, C p d is the dynamic power-dissipation capacitance, V o p is the supply voltage, I s is the reverse saturation current, n p is a constant that depends on the processor, f is the frequency operation, and V t is the thermal voltage. Equation (1) depicts the power consumption in the run stage, assuming that the MCU operates continuously in this mode [47] and never goes into LPM.
  • RF Transceiver Block
The RF transceiver block describes RF operations in WSN, covering activities such as active, idle, transition, and sleep. Each operating state has a specific power consumption and involves several components, such as the digital-to-analog converter (DAC) unit, reconstruction filter, mixer, radio frequency (RF) filter, power amplifier (PA), low-noise amplifier (LNA), RF band selection filter, baseband, anti-aliasing filter, and analog-to-digital converter (ADC) [1]. It is worth noting that each component has its own unique set of parameters associated with it [10].
Based on the power model proposed by Cui et al. in [10], the average power consumption of each element is estimated and used to determine the lifetime of the sensor node in its active state. The transmitter ( P t x ) and receiver ( P r x ) power consumption is given by:
P t x = P c t + P P A + P t P r x = P c r + P L N A
where P c t is the sum of the power consumption of the DAC, mixer, and RF filters, P P A and P t are the amplifier and transmission power consumption, P c r indicates the summed power consumptions of ADC, the mixer, and baseband filters, and P L N A is the power consumption of the LNA.
The PA power consumption presented by Cui et al. in [10] is proportional to P t and is expressed as follows:
P P A = α · P T
where α = ε / η 1 is the ratio between ε , the peak-to-average power ratio (PAR), and η , the drain efficiency. The drain efficiency presented by Lacroix et al. in [48] is defined as the ratio between output power and supply power and is expressed as follows:
η = η m a x · P t P t , m a x β
where P t , m a x is the maximum output power, η m a x is the maximum drain efficiency, and β is a real coefficient between 0 and 1 [49].
The power consumption of the DAC ( P D A C ) has two components, one dynamic and one static [10,27], and is presented by Mahmood et al. in [27] as follows:
P D A C = 1 2 V D D · I 0 · ( 2 N D A C 1 ) + N D A C · C p · B · V D D 2 · O S R
where V D D is the power supply voltage, I 0 is the unit current source corresponding to the least significant bit (LSB), OSR is the oversampling ratio, C p is the parasitic capacitance of each switch, and N D A C is the resolution of the DAC in bits. Similar to the DAC, the power consumption of the ADC ( P A D C ) [10,27] can be expressed as
P A D C = 3 V D D 2 · L m i n · B 10 0.152 · N A D C + 4.838
where L m i n is the minimum channel length of the complementary metal oxide semiconductor (CMOS) technology, N A D C is the resolution of the ADC in bits, and B is the system bandwidth.
  • Memory Block
Focused on reading and writing data packets to memory, this block only interacts with the MCU block. The time spent on each activity depends on the internal level. According to Halgamuge et al. in [50], the energy consumption model ( E m e m N ) can be calculated using the following equation:
E m e m N ( b 2 ) = E w r i t e + E r e a d = b 2 · V s u p 8 · ( I w r i t e · T w r i t e + I r e a d · T r e a d )
where I r e a d and I w r i t e are the operational currents for reading and writing one-byte data b 2 , and V s u p is the operating voltage.
If the sensor node transmits collected data immediately without storing it in memory, no memory operations, such as data storage or retrieval, are performed. As a result, the impact of memory on energy consumption becomes negligible. Therefore, the memory energy model is excluded from the power consumption analysis without significantly affecting the accuracy. Future work will include data storage to evaluate a more complete application.
  • Sensor Block
This block connects the sensor node with the physical world and other sensor components. Activities include signal sampling, conversion, signal conditioning, and ADC circuitry. Iterations at these stages occur at the internal level. Halgamuge et al. in [50] consider that the total energy dissipation model for sensing activity ( E s e n N ) for the b 1 bit packet can be estimated as
E s e n s N ( b 1 ) = b 1 · V s u p · I s e n s e · T s e n s
where I s e n s e represents the current supply required during sensing operation, V s u p represents the voltage supply, and T s e n s e represents the time taken to sense a b 1 bit packet. However, it is important to note that different sensors have different operating characteristics depending on the measurement type, the signal’s complexity, and the type of transducer used.
A sensing block energy model can be excluded from sensor node analysis when the nodes operate in a fixed or static environment with minimal or non-variable sensing tasks. In such cases, detailed modeling of the sensing unit’s energy consumption may be unnecessary because its impact on the overall energy consumption of the sensor node is minimal and consistent.
  • Battery Block
This represents the physical characteristics of the battery block, including current profiles, voltage drop levels, state of charge under various loads, and nominal energy values. Iterations at this level occur at the internal level. For case studies 1 and 2, we assume that the battery block model is ideal with a predefined state of charge.
After following the proposed methodology, Figure 5 summarizes the resulting blocks related to a node-level analysis, with the corresponding parameters listed in Tables 2 and 3.

4.2. Simulation Setup for Model Evaluation

The simulations were performed on MATLAB R2023b on Windows 11 version 23H2 to evaluate the energy models. The computer had the following specifications: Intel(R) Core(TM) i5-10300H [email protected] GHz × 8 with 16 GB of RAM and 1.3 TB of disk space allocated for Windows. The parameters for both block models (MCU and RF transceiver) were calculated using the specifications described in Table 2. For each block model, a custom script was written in MATLAB to implement the equation calculation.
Table 2. CC2538 transceiver parameters.
ParameterDetailValueParameterDetailValue
ffrequency operation32 MHz V o p Supply voltage3.7 V
I l e a k a g e leakage current50 nA C L Load capacitance13 nF
I o p Active current operation13 mA V t Thermal voltage0.2 V
b 3 Number of bits MCU32 bits I s l e e p Sleep current operation0.6 mA
I T X Transmission current operation24 mA I R X Receiver current operation20 mA
The script presented in Algorithm 2 illustrates the calculation of P M C U and the relationship between the parameters and the equation. This script is an example of the implementation of the mathematical representation described in Equation (1). The mathematical implementation of each block level follows the same structure explained in this pseudocode.
Algorithm 2 Pseudo-code MCU block
1:
Inputs: ( f , V o p , I s , C L , I o p , V t , b 3 )
2:
Output: ( P M C U )
▹ solve the equation
3:
        P d y n a m i c = b 3 · f · N c y c · C p d · V o p 2
4:
        P s t a t i c = V o p · ( I s · e V o p n p · V t )
5:
        P M C U = P d y n a m i c + P s t a t i c
To estimate the node’s lifetime, we need to determine the time it takes for the battery supply voltage to drop to a level that can no longer support operation, commonly called the “cut-off” voltage. We assume the sensor node uses an ideal linear charging battery with a capacity of 1300 mA/h and an operating voltage of 3.7 V. We can calculate the node’s lifetime using the power consumption results from the block models as follows:
Lifetime [ hours ] = V B a t t · C b a t t P T o t a l
where V B a t t is the battery voltage, C b a t t is the battery capacity (in mAh), and P T o t a l is the total power consumption of the sensor node.
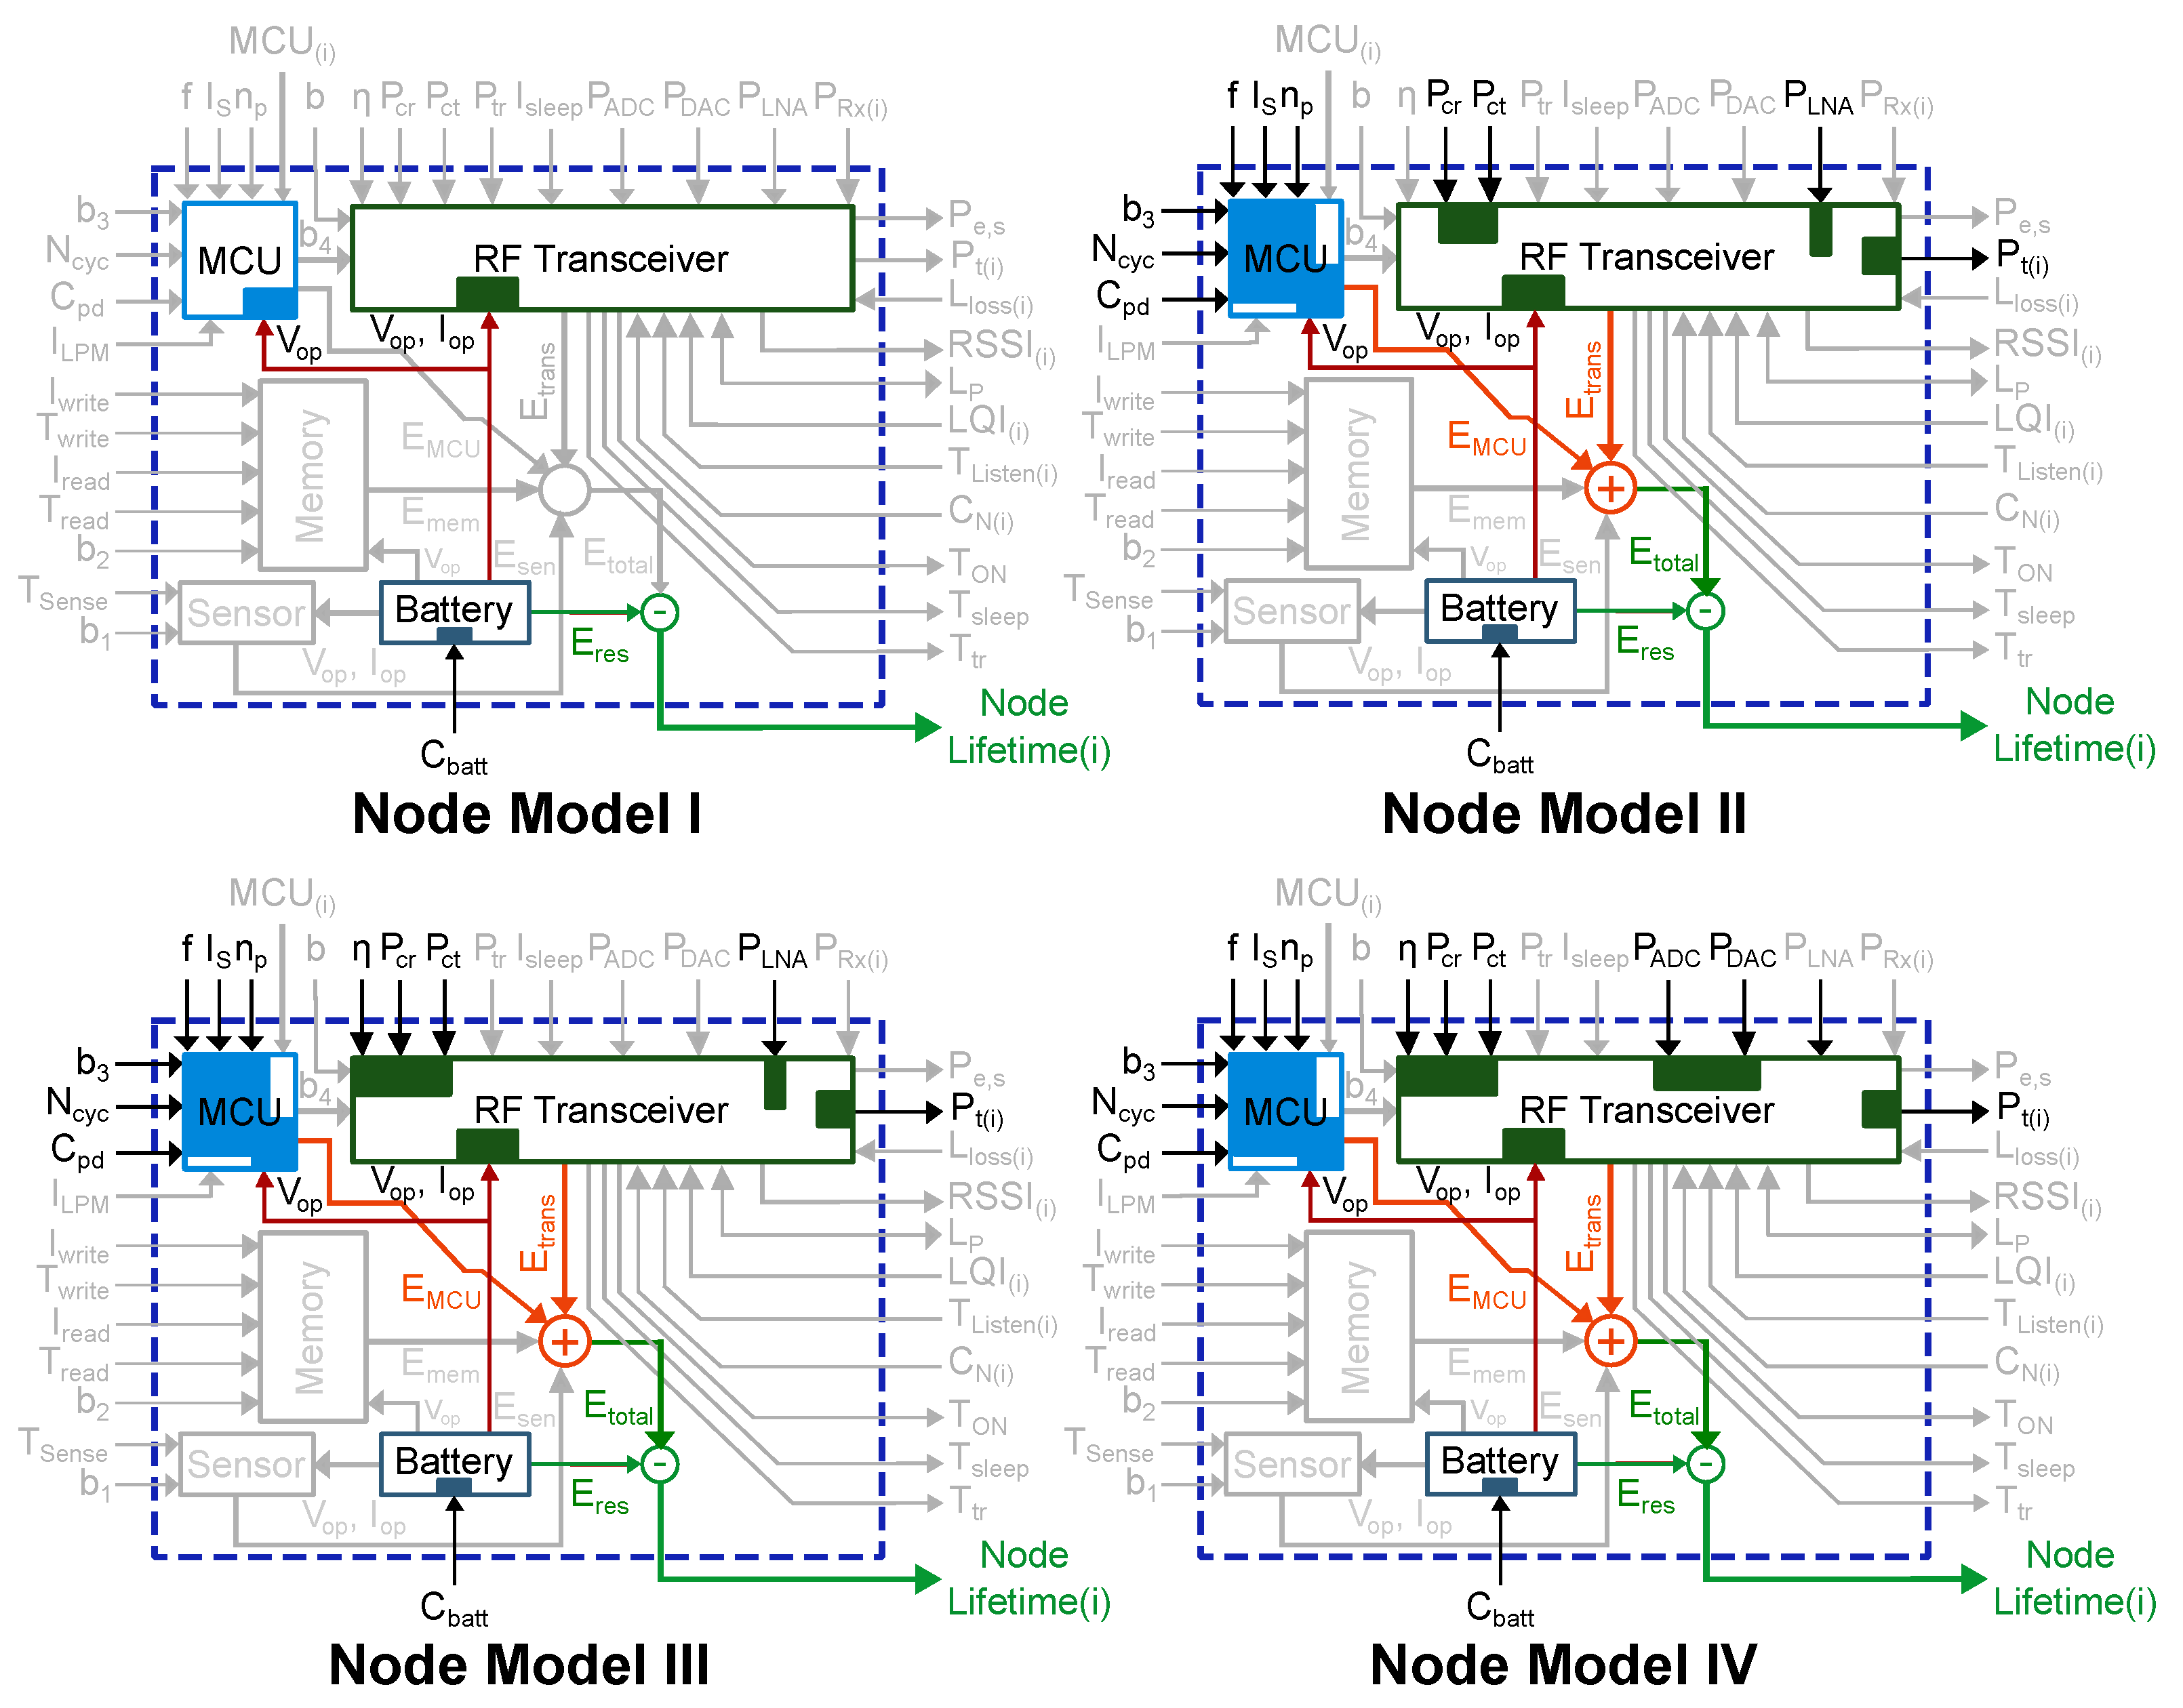
As we have arrived at a node-level model that integrates all operational and structural aspects of a node, as presented in Figure 5, we would like to compare such a general model to other similar implementations. With that in mind, Figure 6 shows the CL node-level models we implemented, with specific parameters, blocks, and modules highlighted in different colors. This visual representation illustrates how complex models grow as more parameters are added, expanding the highlighted area. Node Model I is the simplest, while Node Model IV is the most complex. One advantage of Figure 6 is that it removes the need to repeat the modeling equation every time parameters are added to a model.
In order to simplify the analysis of the results, the power consumption of the sensor node is not affected by the memory and sensing blocks in the proposed case studies. The implemented code does not use any memory data storage and only transmits data (dummy packets) without sensing variables interacting with the medium. In addition, as the RF transceiver remains continuously active, sleep and wake-up modes and transition times do not need to be considered.

4.3. Experimental Results

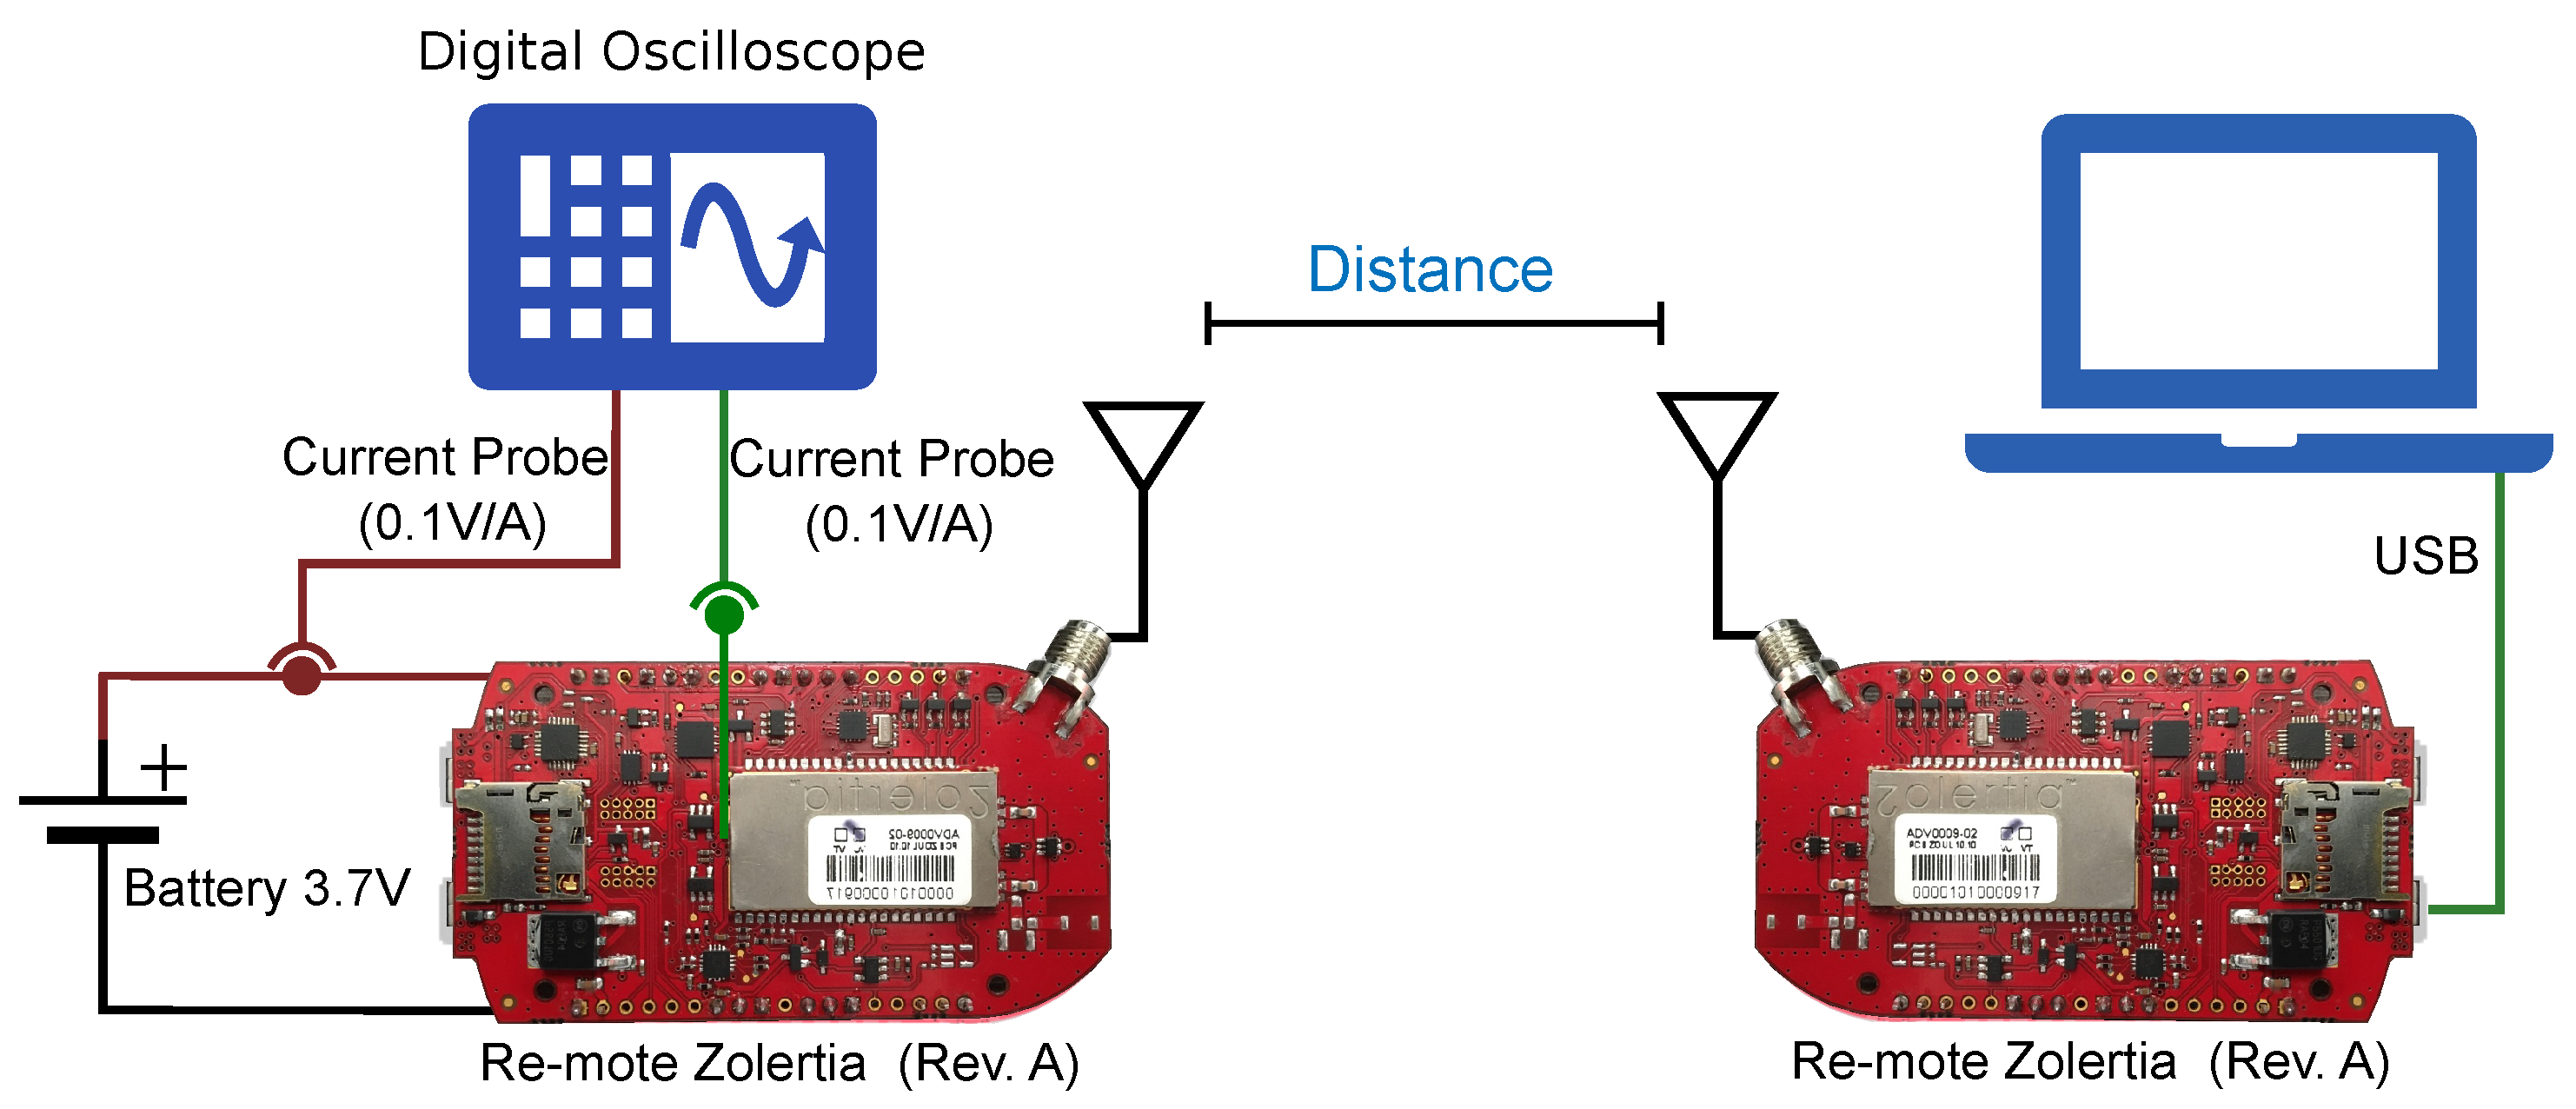
To validate the models, we conducted an experimental test using two Zolertia Re-Mote devices separated by a distance of 3 m, configured to send a message with the RF transceiver, which is continuously active, as shown in Figure 7. The Zolertia Re-Mote is a Texas Instruments CC2835 with an ARM Cortex M3, equipped with a robust IEEE 802.15.4 radio.
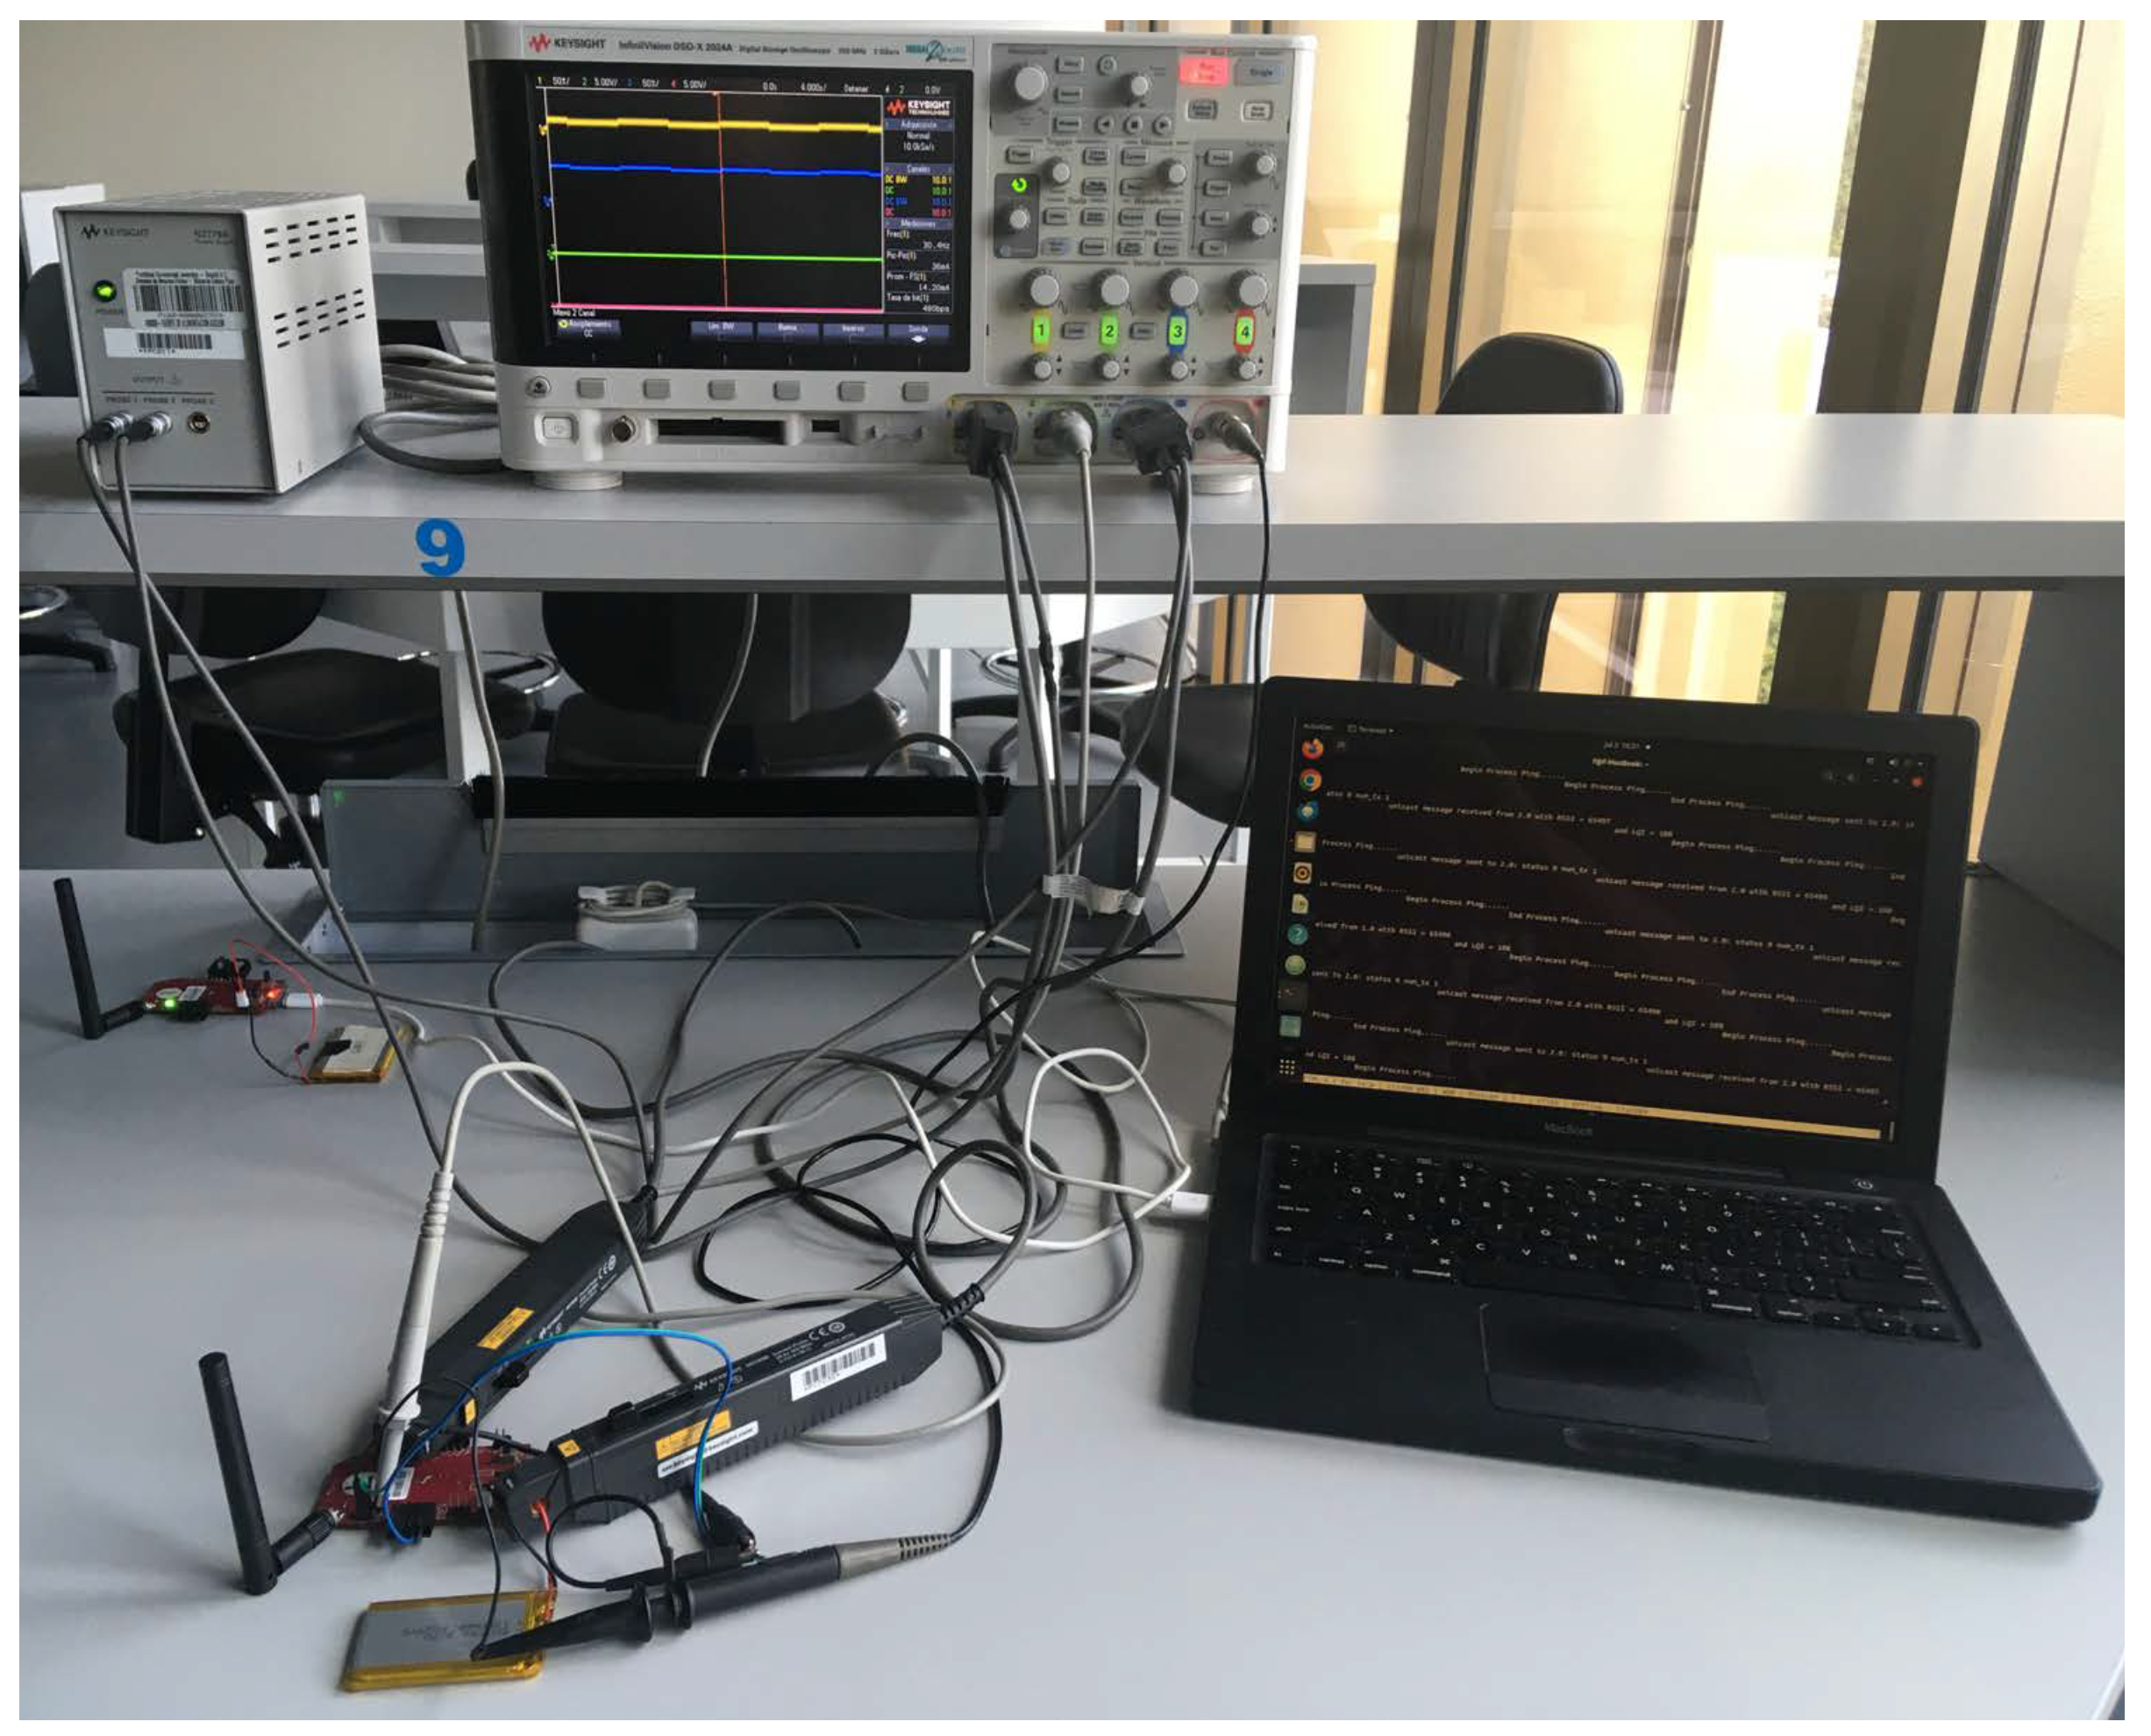
We connected one of the nodes to a 3.7 V battery with a capacity of 1300 mAh and the other node to a laptop via a USB port. We performed two types of measurements to monitor the power consumption of the sensor nodes. The first was a direct measurement on board, where we measured the power consumption of the MCU and the battery separately. The second type of measurement was indirect, where we estimated the power consumption using a power estimation mechanism.
In Figure 8, we used an Agilent N2783B current probe connected to a Keysight DSO-X-2024A oscilloscope to measure the battery and MCU current consumption directly (in mA). The oscilloscope also facilitated data storage. Calibration was performed offline by measuring the current drawn by the sensor board. The power consumption of the RF transceiver was estimated from these measurements by taking 30 values and reporting the corresponding average. Although we had access to an anechoic chamber, we preferred to run our experiments in a regular lab, under close-to-real conditions (including disturbances).
We used the Powertrace API in ContikiOS v3.0 to monitor the MCU and RF transceiver usage times as an indirect measurement. The plugin allowed us to monitor the power consumption of the MCU during data processing and low-power mode, as well as the power consumption of the RF transceiver during transmission and listening [51,52]. The power estimation is completed in an offline fashion when all the data have been consolidated. The sensor node, connected via a USB port, validates frames sent by another sensor node via a serial connection at 115,200 baud. It also monitors frames generated by the Powertrace API via a console terminal.
In Figure 9, it is possible to observe that the power consumption of the Zolertia Re-Mote was measured to be 34.7 mA, while the power consumption of only the MCU module was 10mA, implying that the consumption of all other components, mainly the RF transceiver, was 24.7 mA. The Zolertia Re-Mote has a “cut-off” voltage of 2.9 V [53,54], which occurs after around 40.7 h according to the frames sent by the sensor node connected to the battery and recorded in the terminal console.
When comparing different node-level models with direct measurement, Node Model I presents the highest errors in estimating node lifetime, as shown in Figure 10. For Node Model I, we only consider the average power consumption parameters of the MCU and RF transceiver ( V o p and I o p ). Compared to direct measurement, the lifetime estimation error for Node Model I is approximately 40.34%, exceeding the TH. In this scenario, we follow the steps outlined in Algorithm 1 and introduce additional parameters in each block.
For Node Model II, we include additional parameters related to both dynamic and static power consumption in the MCU block model ( b 3 , N c y c , C p d , f, I s , and n p ), as shown in Equation (1). We also consider the power consumption of the LNA, receiver ( P c r ), and transmitter ( P c t ) circuits, as well as the PA average power consumption and the transmitter power ( P T ) in the RF transceiver as shown in Equation (2). After estimating the lifetime again, we obtain an estimated error of 22.18% between the direct measurement and the model simulation, which is lower than Node Model I but still higher than TH, as shown in Figure 10. We return to step 4, as shown in Algorithm 1 and add more parameters in the RF transceiver block.
In Node Model III, we kept the parameters from Node Model II (MCU and RF transceiver blocks) and added a new parameter ( η ) in the RF transceiver model block, as shown in Equation (3). After recalculating the lifetime, we found an estimated error of 24.64% between direct measurement and simulation, which is still higher than TH, as shown in Figure 10. Therefore, we revisited step 4 and introduced more parameters in the RF transceiver block.
In Node Model IV, we retained the parameters from Node Model III and incorporated additional parameters related to P c t , such as DAC power consumption, and P c r , such as ADC power consumption, in the RF transceiver model block, as shown in Equations (5) and (6). Futhermore, we assumed that P c r = P c t [27] and recalculated η using Equation (4). Upon recalculating the lifetime, we found a 1.47% error between the direct measurement and the model simulation, which is below TH, indicating the most accurate model.
Data from indirect measurements can be used to further evaluate the proposed model. Figure 10 illustrates the discrepancy between the lifetime of the indirect measurement obtained with Powertrace and the simulation models. The error for Node Model I was 38.3%, for Node Model II, it was 19.55%, for Node Model III, it was 22.1%, and for Node Model IV, it was 1.85%. These findings indicate that both direct and indirect measurements align with the simulation results.

5. Case Study 2: CL Modeling of Node’s Lifetime in a Peer-to-Peer Communication Process

This section provides a detailed step-by-step guide for applying the proposed methodology to model peer-to-peer communication. Section 5.1 explains how to apply the modeling methodology in this particular case study, and Section 5.2 outlines the experimental results achieved for this multi-level case.
We aim to develop a model to estimate the lifetime of a sensor node in peer-to-peer communication for a fixed distance between nodes, when information is sent and received from the sensor node to a sink or to the selected sensor node in a star topology. This functionality implies integrating the network level into the node level.

5.1. CL Methodology for Modeling Node Lifetime in a Peer-to-Peer Communication Process

This subsection describes how our methodology works to obtain an accurate model according to the proposed CL modeling methodology described in Section 3.2. As explained in Section 4 for the first case study, we implement the proposed model in MATLAB and use the Zolertia Re-Mote to validate the model.

5.1.1. Select Levels

The first step described in Algorithm 1 is detailed in Section 4.1.1. The second step is determining the number of levels required to implement the model. We considered the send-and-receive communication process to have a fixed data rate, a fixed data size, a fixed distance between nodes, and collision-free transmission. For this scenario, we chose node and network levels.
Analyzing power consumption at the network level is complex due to the various factors influencing energy consumption. These factors include network topology, hop length, number and spatial distribution of nodes, wireless channel characteristics, and Carrier Sense Multiple Access with Collision Avoidance (CSMA/CA) protocols. In this level, we identify critical parameters such as radio duty cycle, hop count, neighbor count, inbound and outbound throughput, fan-out, received signal strength indicator (RSSI), link quality indicator (LQI), signal-to-noise ratio (SNR), end-to-end delay, and noise figure (NF).

5.1.2. Select Blocks

The third step described in Algorithm 1 was determining the number of blocks for each level. Based on the factors that affect the power consumption in a WSN, we identify six main blocks: (i) the channel model block is related to the propagation medium during communication establishment; (ii) the topology control block is related to the construction and maintenance of the network topology; (iii) the routing protocol block manages the routing mechanism for sending and receiving data; (iv) the Medium Access Control (MAC) Protocol block handles the access channel mechanism, handshaking, and multi-hop transmission; (v) the duty cycle block handles operating modes; and (vi) the Internet communication protocol block is associated with the Internet Protocol (IP) network. In the following sections, we detail the mathematical representation of the selected blocks.
In Case Study 2, we analyze a network setup with an always-on radio frequency (RF) transceiver, eliminating the need for sleep and wake-up modes. The topology is a star topology, enabling single-hop communication. Since data access via Internet Protocol (IP) is unnecessary, power consumption from routing protocols and Internet communication blocks is not considered. Furthermore, the sender and receiver nodes are perfectly synchronized, negating the need for wake-up scheduling, channel check schemes, or T l i s t e n . As a result, we do not implement the MAC protocol and duty cycle blocks. The channel model, topology control blocks, MCU, and RF transceiver blocks selected for this case study are described in Case Study 1 at the node level.
  • Channel Block
The channel model block describes phenomena in the propagation medium during node communication. It correlates variations in signal strength with changes in the propagation path. The choice of a specific model depends on the scenario, indoor or outdoor, and affects the accuracy of the coverage area, the choice of transmission power, and the network’s lifetime. The simplest model is free-space propagation, which is applicable when only the transmitter and receiver are present. In this model, the transmitter power signal ( P t ) can be estimated using the receiver power signal ( P r ) and the antenna gain [55,56]. The relationship is expressed as:
P r = G t · G r · λ 2 · P t ( 4 π ) 2 · d 2 · L
where G t and G r are the transmitter and receiver antenna gains, respectively, λ is the carrier wavelength, d is the transmitter–receiver distance, and L is the system loss factor independent of propagation. Alternatively, the log distance path loss model is used to forecast the propagation loss across a wide range of environments [56] and is expressed as follows:
P L ( a v g ) = P L ( d 0 ) + 10 · n · l o g ( d d 0 )
where n is the path-loss rate, and P L ( d 0 ) is the path loss at a reference distance ( d 0 ).
  • Topology Control Block
The proposed block contains the parameters needed to construct and maintain the topology, such as the number of nodes, the distance between them, their position, and connectivity (links) [32]. According to Luqiao et al. in [57], the interaction between the parameters occurs when:
(i)
A set of nodes is randomly distributed in the Euclidean plane, represented as ( X i , Y i ). The Euclidean distance between two nodes is denoted by d i , j .
(ii)
All sensors have the same transmission range (R), so a link occurs only if d i , j < R .
(iii)
The power cost of the link is proportional to ( d i , j ) α , where the value of α is the path loss exponent with a range between 2 for indoor and 4 for outdoor.
(iv)
The radio coverage model quantifies whether the link between nodes can cover a node if and only if d k , i d i , j or d k , j d i , j .
The energy dissipation model sends ( E T x N ) and receives ( E R x N ) b bit packets at a distance d i , j between two sensor nodes, as proposed by Heinzelman et al. in [58] and Wang et al. in [59], and is given by
E T x N ( b , d i , j ) = b · E e l e c + b · d i . j 2 · E a m p d i , j < d 0 b E e l e c + b · d i . j 4 · E a m p d i , j d 0
E R x N ( b ) = b · E e l e c
where E e l e c is the energy dissipated by the transmit and receive electronics of the RF unit, E a m p is the energy dissipated by the power amplifier, and d 0 is a threshold distance.
  • Routing Protocol Block
The routing mechanism block aims to enhance the network lifetime by considering parameters like one-way delay, remaining energy of nodes, total node count, idle listening time, packet size, periodic message type, and sender–receiver distance [60]. Depending on the routing protocol, block complexity varies. Parameters like hop count or compound routing dictate path cost, increasing block complexity. The routing engine is typically part of an overall wireless communication model. However, in some scenarios, routing protocols may need to be revised due to the simplicity of the network architecture or specific application requirements. For example, in a star topology, all sensor nodes communicate directly with a central node, streamlining communication without needing neighboring nodes to forward data. This scenario eliminates the need for a routing protocol. In future work, it will be developed to extend the IoT network model further.
  • MAC Protocol Block
The block represents the access channel mechanism, which significantly impacts power consumption. It performs listening attempts to determine channel status. Data transmission only occurs if the channel is free [34]. Busy channels trigger a random timer to find free channel time or induce radio sleep mode after a listening time [33,34,45,61]. MAC protocols use ACK for successful transmission. Energy costs include channel check interval (CCI), listen time ( T l i s t e n ), and sample time ( T s a m p l e ). In addition, radio-state change energy must be considered.
Based on the model proposed by Del-Valle-Soto et al. in [34], the energy consumed by the RF unit to transmit ( E T X ) and receive one packet ( E R X ), check if the channel is free from other transmissions, and switch from one state to another is given by:
E T X = P l e n g h t · T T x · I T x · V D C
E R X = P l e n g h t · T R x · I R x · V D C
E l i s t e n = T l i s t e n · I l i s t e n · V D C
E s w = T s w · I s w + V D C
where P l e n g t h is the length of the packet (in bytes), T T X is the time it takes a node to send a byte, I T X is the transmit current drawn, T R X is the time it takes a node to receive a byte, I R X is the receive current drawn, T S W is the time it takes a node to go from sleep to active or vice versa, and I S W is the current drawn in the sleep state. T l i s t e n is the time in each sample period that the radio stays in listen mode, I l i s t e n is the current drawn by the radio in listen mode, and V D C is the supply voltage.
  • Duty Cycle Block
The block represents the radio-duty cycle, which is an essential part of the MAC protocol. It describes the percentage of time that the RF unit is in a particular mode of operation. The parameters interact between the different operating modes with different power requirements.
According to Halgamuge et al. in [50], the expression for estimating the duty cycle ( C N ) of a node can be defined as
C N = T t r a n s O N + T A + T t r a n s O F F T t r a n s O N + T A + T t r a n s O F F + T S
where T t r a n s O N represents the transition time from sleep to idle state, T t r a n s O F F represents the transition from idle to sleep state, T A represents the wake-up time, and T S represents the sleep time. The total energy dissipation ( E t r a n N ) for a sensor node is given by:
E t r a n N = T A · V s u p · ( C N · I A + ( 1 C N ) · I S )
where I A and I S are the currents for active and sleeping modes, and V s u p is the voltage supply of the RF unit.
  • Internet Communication Protocol Block
This block describes the direct connection established between the sensor nodes and the IP network, leading to the system level. The block can also include client–server protocols; however, its development depends on the system level, which is not part of this paper. Therefore, future work will implement it to further extend the IoT network model.
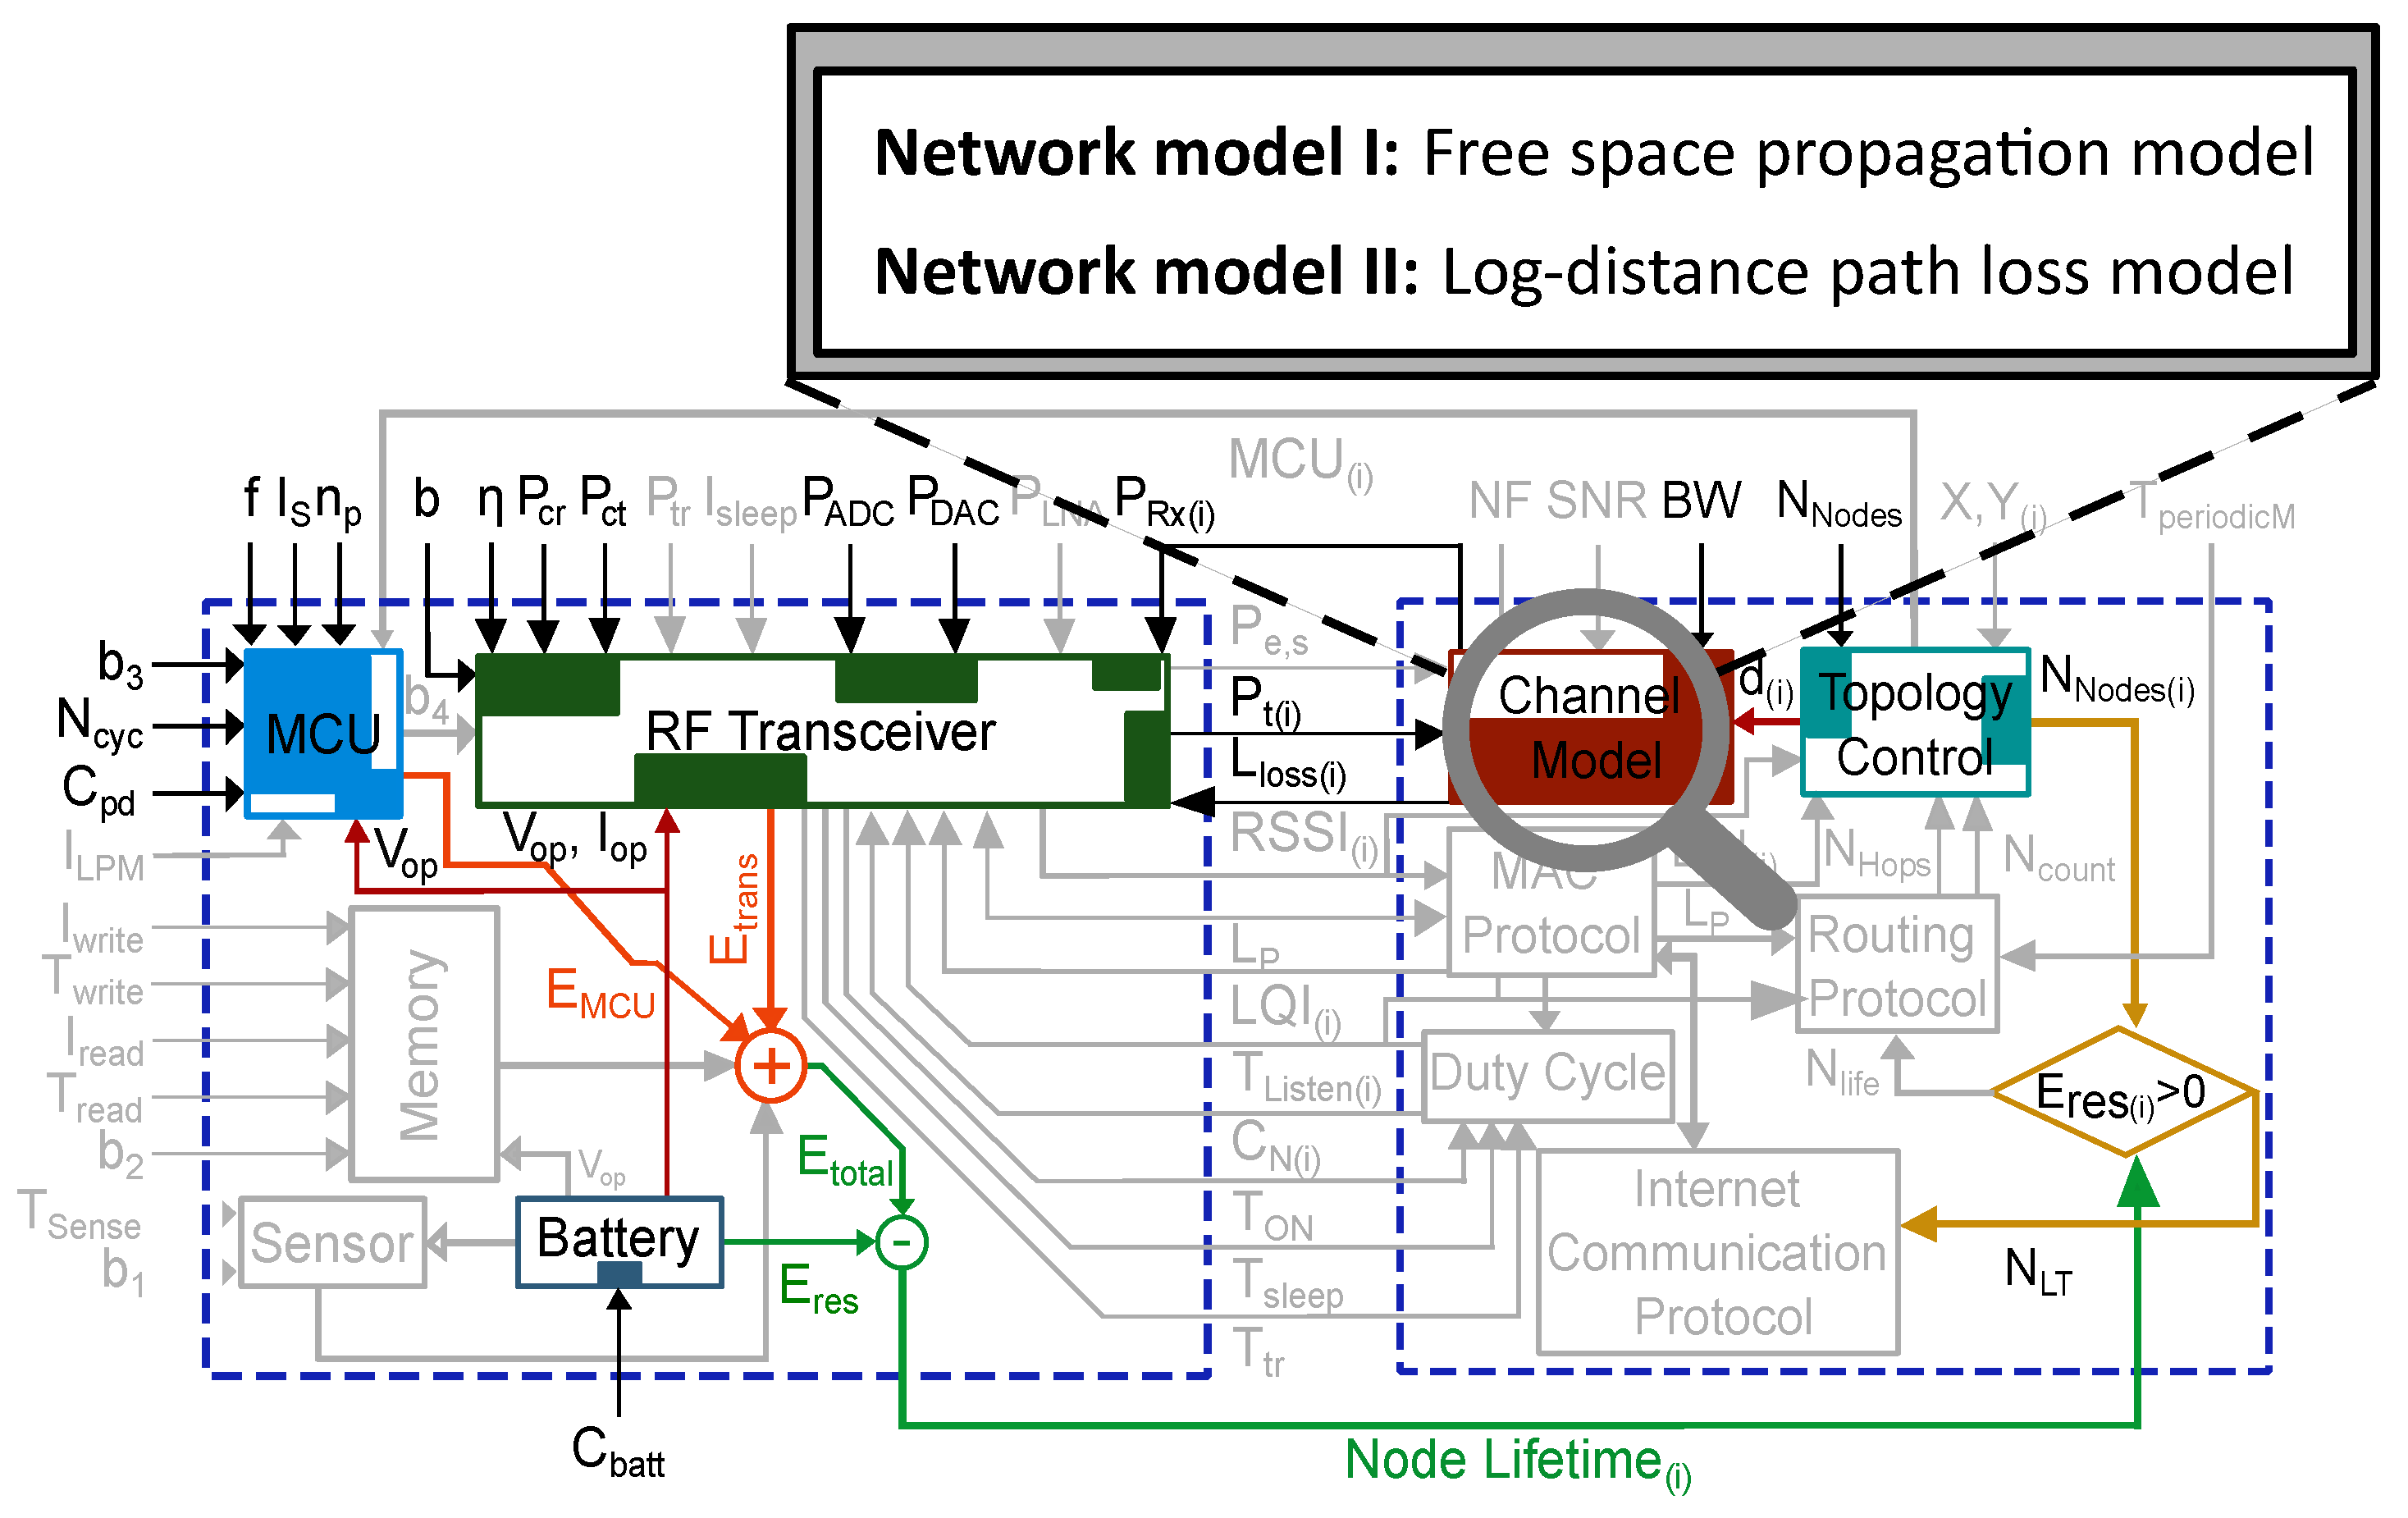
After following the proposed methodology, we arrive at the model shown in Figure 11, with the main blocks of node and network levels and the corresponding parameters listed in Table 3.
The diagram in Figure 11 shows a general network-level model that illustrates node communication and the blocks that affect power consumption. However, specific blocks must be considered in certain scenarios. For example, peer-to-peer communication includes the topology block, which assumes a constant distance between nodes. The routing block is excluded because the sensors communicate directly, but the channel model is included because we want to evaluate the medium under different conditions.
Table 3. Parameters of the CL model.
ParameterDetailParameterDetailParameterDetail
fMCU frequency operation I s Reverse saturation current n p MCU constant
bModulation order η PA drain efficiency P c r Power dissipation receiver electronics
P t r Power transition time P A D C ADC power consumption P D A C DAC power consumption
P L N A LNA power consumption P e , s Probability of a symbol error L p Size of the data packet
I s l e e p Sleep current operation T t r Transition time (sleep to idle or idle to sleep) P R x Receiver power
P t Transmission power T O N Active mode time P c t Power dissipation transmitter electronics
T s l e e p Sleep time b 4 number of bits to be transmitted N F Noise Figure
S N R Signal-to-noise ratio B W Bandwidth N H o p s Number of hops of the path
d ( i ) Distance between nodes L Q I ( i ) Link Quality Indicator N n o d e s Number of nodes in the network
( X , Y ) ( i ) Position of each node in the network L l o s s ( i ) Path loss exponent T p e r i o d i c M Periodic messages type
N l i f e Number of nodes alife N c o u n t Neighbor counts R S S I ( i ) Received Signal Strength Indicator
N N o d e s ( i ) Number of nodes in active state E r e s ( i ) Residual energy in the network C N ( i ) Duty cycle
T L i s t e n ( i ) Time required to listen to the channel N L T Network lifetime M C U ( i ) MCU varible
b 3 Number of bits MCU N c y c Number of clock cycles per task C p d Dynamic power-dissipation capacitance
I w r i t e Current flash writing one-byte data I r e a d Current flash reading one-byte data T w r i t e Time duration flash writing
T r e a d Time duration flash reading T s e n s e Sensor block conversion time b 1 Resolution bit
C b a t t Battery capacity V o p Operating voltage I o p Operating current
E r e s Residual battery power E M C U MCU energy consumption E m e m Memory energy consumption
E t r a n RF transceiver energy consumption E s e n Sensing block energy consumption E t o t a l Total energy consumption of the node block
I L P M Current Low Power Mode----

5.2. Experimental Results

The simulations followed the procedure outlined in Section 4.2, with the block models implemented using different MATLAB scripts. Two Zolertia Re-Mote devices were placed 3 m apart and set up to send and receive messages for continuous RF transceiver activity, as shown in Figure 7. Direct and indirect (Powertrace) measurements were taken to monitor the sensor node’s power consumption, as described in Section 4.3. The sensor node, connected via USB port to validated frames, was sent and received by the other sensor node, as well as frames generated by the Powertrace API on a console terminal.
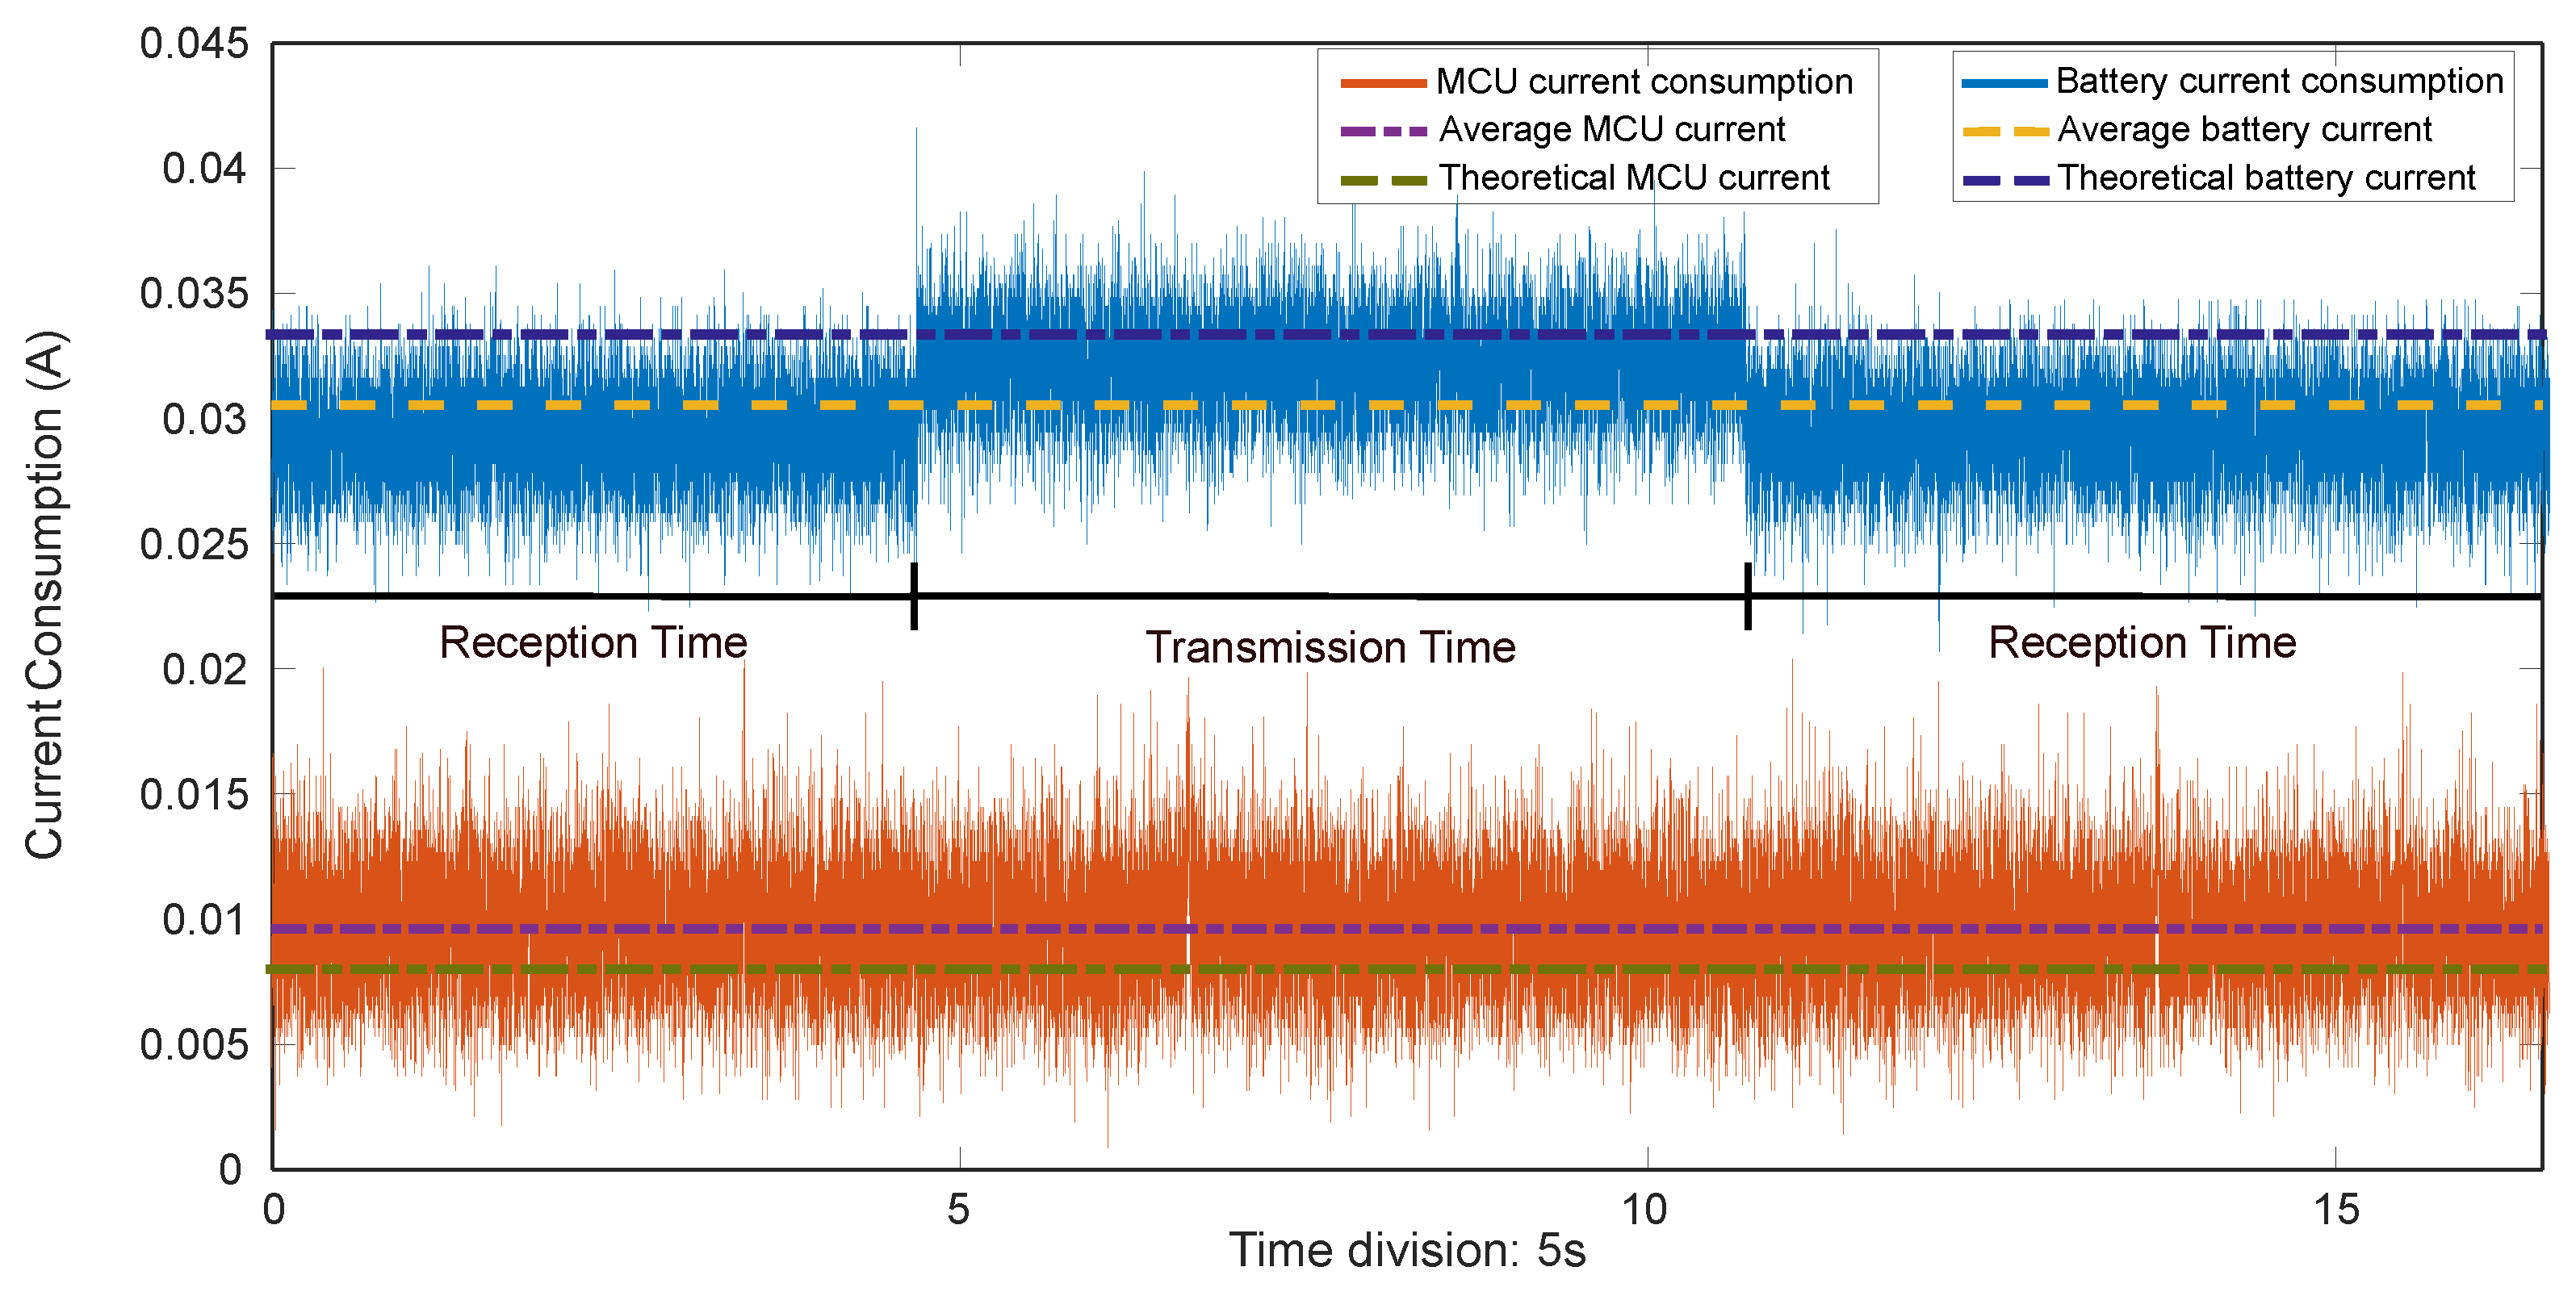
Figure 12 illustrates the CL network-level models we have implemented, as well as the specific parameters used in each model to ensure an acceptable error level. The main difference between the two models is the type of channel used for each case (log-distance path loss or free-space propagation). Based on the data shown in Figure 13, the total battery current of the node was recorded as 30.2 mA (drawn from the battery), with the MCU consuming as much as 10 mA, implying that the RF transceiver module was drawing around 20.2 mA on average. The transceiver’s transmission and reception processes cause the battery to vary, which is an interesting characteristic. The “cut-off” voltage of the battery occurs after around 41.2 h, according to the frames sent by the sensor node connected to the battery and recorded in the terminal console.
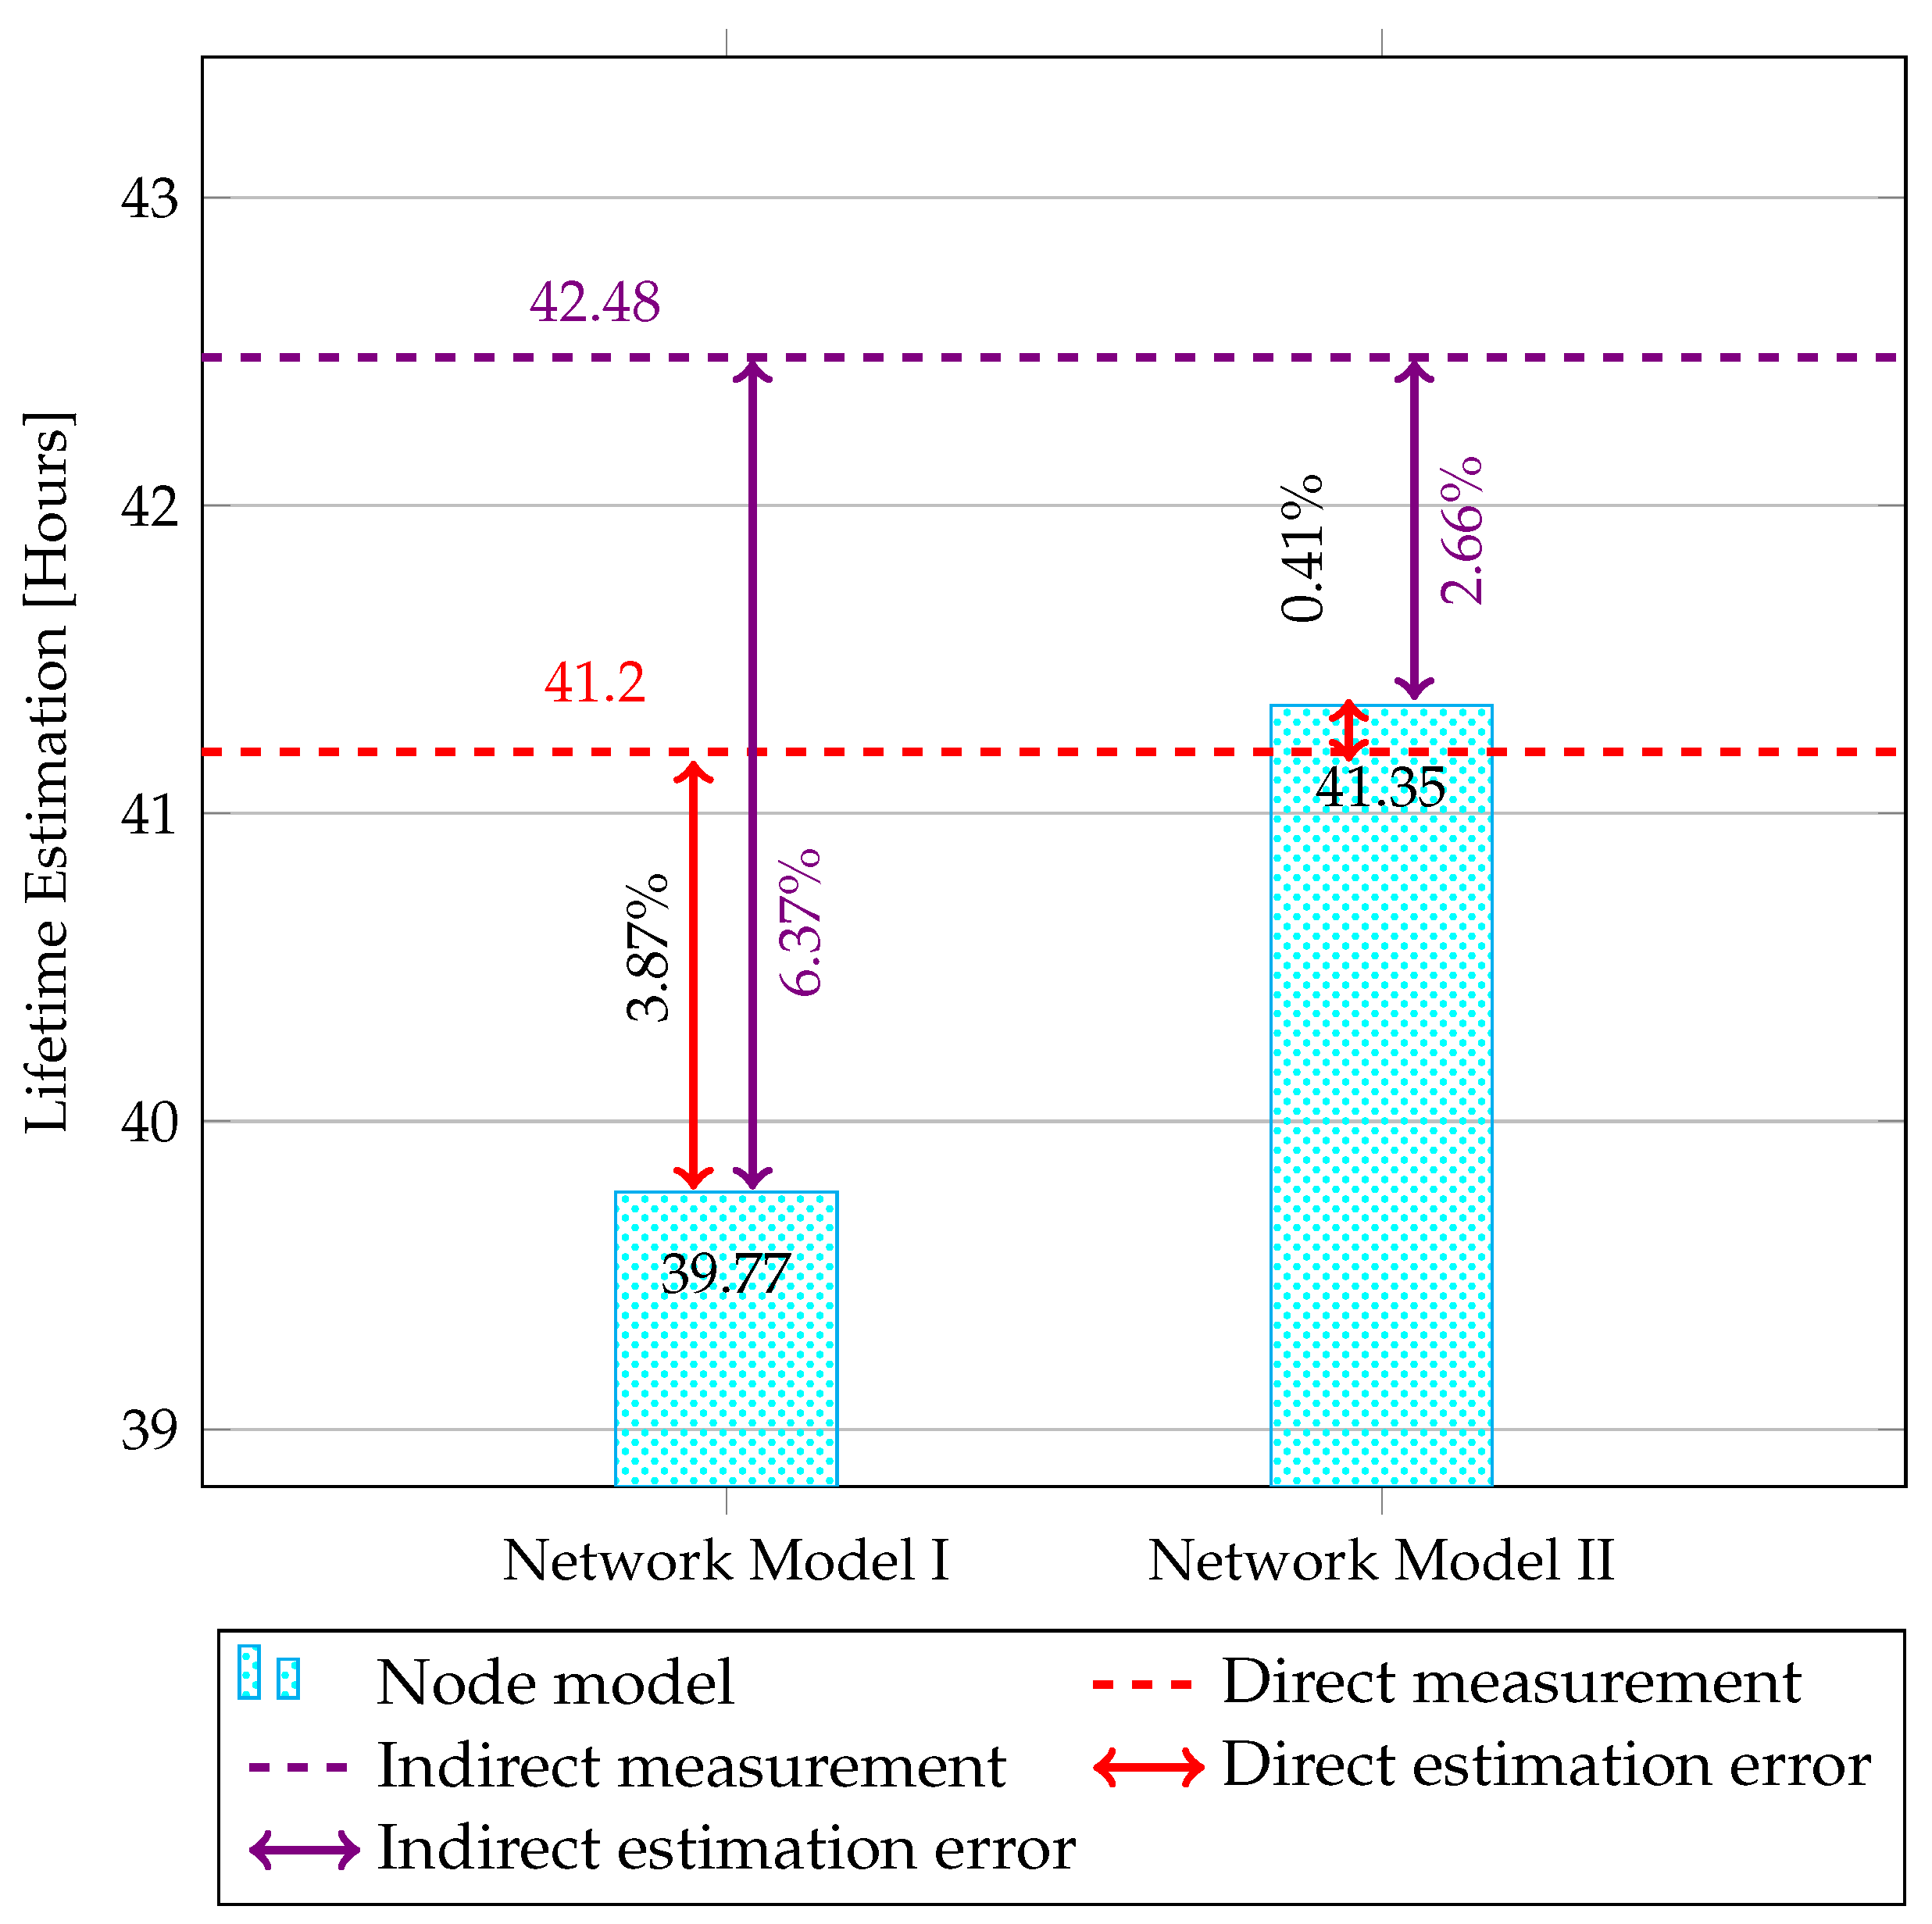
In Figure 14, we can see the different lifetime estimates based on the two implemented node-network level models. For Network Model I, we focus on a free-space propagation model for the channel block and its impact on power consumption in peer-to-peer communication. In this model, the lifetime estimate error from direct measurement and simulation is 3.87%, which is higher than TH; hence, we proceed to step 3 (see Algorithm 1) and evaluate another channel block model.
Given this, we have modified the channel model and implemented the logarithmic distance path loss model for Network Model II. After recalculating the lifetime, we found an error of 0.41% between direct measurement and simulation, which is below TH, indicating that we have achieved an accurate model.
Finally, Figure 14 shows a comparison of the simulation results with indirect measurements. It shows that the error between the indirect measurements and the simulation models is 6.37% for Network Model I and 2.66% for Network Model II.

6. Discussion, Analysis and Future Work

This section discusses the results obtained in both node-level and node-network level case studies.

6.1. Case Study 1: Nodel Level

The large difference in the estimated power consumption of Node Model I (40.34%), shown in Figure 10, indicates that relying solely on the average power consumption values of the MCU and the RF transceiver is insufficient to predict the node’s power consumption precisely.
Figure 10 illustrates that Node Model II predicts a slightly higher lifetime value compared to Node Model III. This discrepancy can be attributed to the PA model proposed in Node Model III, which assumes constant power consumption and thus fails to reflect real power consumption dynamics. In contrast, the PA model included in Node Model IV (see Equation (3)) considers drain efficiency (see Equation (4)), thereby improving its accuracy.
The difference in the estimated lifetime between Node Model III and Node Model IV (as seen in Figure 10) arises from the inclusion of power consumption parameters for the ADC and DAC in Node Model IV. This difference between the estimated lifetime from direct measurement and the Node Model IV simulation decreases to 1.47% upon incorporating these parameters. This result demonstrates that we can achieve an accurate estimation of the total power consumption of the sensor node by considering the power consumption of the MCU and RF radio transceiver blocks.
The difference between the estimated lifetime derived from indirect measurements and direct measurements (see Figure 10) can be attributed to the exclusion of the LPM current in the MCU block during the estimation process.
Figure 9 and Figure 13 illustrate the current consumption of the MCU and battery through direct measurement. When the RF transceiver is fully powered on, it is challenging to discern the effects of other parameters on overall power consumption. These parameters include the MCU’s wake-up and sleep modes, the transition time between receiver and transmitter, receiving toggle commands, and the shutdown process.

6.2. Case Study 2: Node-Network Levels

Figure 13 illustrates that adding a log-distance path loss model in Node Model IV reduces the estimation error from 6.37% to less than 3% compared to direct measurements. The free space model assumes an ideal scenario without obstacles, whereas the log-distance path loss model considers obstacles, simulating a typical indoor setting. Adding additional channel models would improve the network-level model accuracy, allowing for more realistic scenarios to be created.
It can be seen in Figure 14 that the results of direct measurement and both network models are very close (3.87% and 0.41%) compared to the results of indirect measurement (6.37% and 2.66%). The indirect measurement method is inadequate for capturing all system dynamics. However, further analysis is required to draw definitive conclusions, particularly about the MAC and duty cycle blocks.
The proposed methodology for network-level modeling effectively identifies the most accurate model within an acceptable error threshold. The careful selection of blocks and parameters ensures accuracy. However, the proposed model is limited to peer-to-peer communication scenarios between two single nodes. Different blocks at the network level, such as routing paths, MAC protocols, topology control, and duty cycle blocks, should be enabled to evaluate more complex networks.

6.3. Methodology Summary Results

The CL modeling approach provides a highly accurate model with minimal error without adhering to the traditional layered model. The first case study (node level) shows that the difference between the actual measurement and the simulated result is less than 3%. Similar results were observed for the second case study, where the error was less than 3%.
It is possible to effectively estimate the power consumption of the sensor node devices by combining the MCU block model with dynamic and static power parameters and the RF transceiver block model with ADC, DAC, and PA power parameters. However, this estimation only applies when average power operation is not the only consideration.
The CL modeling method can be applied to evaluate peer-to-peer communication between two sensor devices by analyzing the block model’s medium channel and relevant parameters of each level. This approach achieves an error of less than 3%. For this scenario, the error between the indirect measurement (Powertrace) and the simulation model is also less than 3%.
The results of case studies 1 and 2 show that our modeling methodology can produce accurate lifetime estimates with a low error percentage. However, it is important to note that simulation tools and direct measurements are required to evaluate and calibrate the block model.

7. Conclusions

The proposed CL model acts as a pre-defined model. The modeling methodology adopted captures the system dynamics with respect to the energy consumption metric. However, evaluating different IoT network metrics may require modifications to the existing blocks or the addition of new blocks at each level.
In future work, we plan to apply the three-level approach to more complex IoT applications and extend the methodology to evaluate and optimize energy metrics when implementing IoT protocols. We could also evaluate the computational complexity of the models, memory and sensing requirements, and node distance in our CL modeling approach.

Author Contributions

Conceptualization, F.O., D.M., A.F. and F.E.; methodology, D.M. and A.F.; software, F.O.; validation, F.O., D.M., A.F., M.G.B. and F.E.; formal analysis, F.O. and D.M.; investigation, F.O. and D.M.; resources, D.M. and F.E.; data curation, F.O., D.M. and A.F.; writing—original draft preparation, F.O. and D.M.; writing—review and editing, F.O., D.M., A.F., M.G.B. and F.E.; visualization, F.O. and D.M.; supervision, D.M. and F.E.; project administration, D.M. and F.E.; funding acquisition, D.M. and F.E. All authors have read and agreed to the published version of the manuscript.

Funding

The authors would like to acknowledge the cooperation of all partners within the Efficient Power Amplifiers for Aggressive Duty-Cycling (EPAAD) project. The authors would also like to thank the institutions that supported and funded this work: Pontificia Universidad Javeriana (Project ID: 9426) and the German Research Foundation (Deutsche Forschungsgemeinschaft—DFG) (Project ID: EL 506/40-1).

Data Availability Statement

Data sharing not applicable.

Conflicts of Interest

The authors declare no conflict of interest.

References

  1. Li, Y.; Bakkaloglu, B.; Chakrabarti, C. A System Level Energy Model and Energy-QualityEvaluation for Integrated Transceiver Front-Ends. IEEE Trans. Large Scale Integr. (VLSI) Syst. 2007, 15, 90–103. [Google Scholar] [CrossRef]
  2. Carvajal Acosta, J.P.; Urbina Mojica, R.A.; Baron Mosquera, L.C.D.; Paez-Rueda, C.; Fajardo, A. Design and Implementation of a Cost-Effective Object Tracking System Based on LoRa, Firebase, and Mapbox. IEEE Lat. Am. Trans. 2022, 20, 1075–1084. [Google Scholar] [CrossRef]
  3. Lipare, A.; Edla, D.R.; Dharavath, R. Energy efficient routing structure to avoid energy hole problem in multi-layer network model. Wirel. Pers. Commun. 2020, 112, 2575–2596. [Google Scholar] [CrossRef]
  4. Anastasi, G.; Conti, M.; Di Francesco, M.; Passarella, A. Energy conservation in wireless sensor networks: A survey. Ad Hoc Netw. 2009, 7, 537–568. [Google Scholar] [CrossRef]
  5. Li, M.; Yang, B. A Survey on Topology issues in Wireless Sensor Network. In Proceedings of the ICWN, Las Vegas, NV, USA, 26–29 June 2006; p. 503. [Google Scholar]
  6. Zervopoulos, A.; Tsipis, A.; Alvanou, A.G.; Bezas, K.; Papamichail, A.; Vergis, S.; Stylidou, A.; Tsoumanis, G.; Komianos, V.; Koufoudakis, G.; et al. Wireless Sensor Network Synchronization for Precision Agriculture Applications. Agriculture 2020, 10, 89. [Google Scholar] [CrossRef]
  7. Kenyeres, M.; Kenyeres, J. Distributed Mechanism for Detecting Average Consensus with Maximum-Degree Weights in Bipartite Regular Graphs. Mathematics 2021, 9, 3020. [Google Scholar] [CrossRef]
  8. Alkhatib, A.A.A.; Baicher, G.S. Wireless sensor network architecture. In Proceedings of the 2012 International Conference on Computer Networks and Communication Systems (CNCS 2012), Kuala Lumpur, Malaysia, 7– 8 April 2012. [Google Scholar]
  9. Roy, N.R.; Chandra, P. Energy dissipation model for wireless sensor networks: A survey. Int. J. Inf. Technol. 2020, 12, 1343–1353. [Google Scholar] [CrossRef]
  10. Cui, S.; Goldsmith, A.J.; Bahai, A. Moduvolumen Optimization under Energy Constraints. In Proceedings of the IEEE International Conference on Communications, ICC ’03, Anchorage, AK, USA, 11–15 May 2003. [Google Scholar] [CrossRef]
  11. Foukalas, F.; Gazis, V.; Alonistioti, N. Cross-layer design proposals for wireless mobile networks: A survey and taxonomy. IEEE Commun. Surv. Tutor. 2008, 10, 70–85. [Google Scholar] [CrossRef]
  12. Parween, S.; Hussain, S.Z.; Hussain, M.A.; Pradesh, A. A survey on issues and possible solutions of cross-layer design in Internet of Things. Int. J. Comput. Netw. Appl. 2021, 8, 311. [Google Scholar] [CrossRef]
  13. Ranjan, R.; Varma, S. Challenges and implementation on cross-layer design for wireless sensor networks. Wirel. Pers. Commun. 2016, 86, 1037–1060. [Google Scholar] [CrossRef]
  14. Ojeda, F.; Mendez, D.; Fajardo, A.; Ellinger, F. On Wireless Sensor Network Models: A Cross-Layer Systematic Review. J. Sens. Actuator Netw. 2023, 12, 50. [Google Scholar] [CrossRef]
  15. Hasan, M.Z.; Al-Turjman, F.; Al-Rizzo, H. Analysis of Cross-Layer Design of Quality-of-Service Forward Geographic Wireless Sensor Network Routing Strategies in Green Internet of Things. IEEE Access 2018, 6, 20371–20389. [Google Scholar] [CrossRef]
  16. Chandravathi, C.; Mahadevan, K. Web Based Cross Layer Optimization Technique for Energy Efficient WSN. Wirel. Pers. Commun. 2021, 117, 2781–2792. [Google Scholar] [CrossRef]
  17. Bakni, M.; Terrasson, G.; Curea, O.; Llaria, A.; Dos Santos, J. An Approach for Modelling Wireless Sensor Networks: Focusing on the Design Concept and Energy Awareness. Int. J. Adv. Netw. Serv. 2020, 13, 33–44. [Google Scholar]
  18. Singh, A.P.; Luhach, A.K.; Gao, X.Z.; Kumar, S.; Roy, D.S. Evolution of wireless sensor network design from technology centric to user centric: An architectural perspective. Int. J. Distrib. Sens. Netw. 2020, 16, 1550147720949138. [Google Scholar] [CrossRef]
  19. Raj, V.P.; Duraipandian, M. An energy-efficient cross-layer-based opportunistic routing protocol and partially informed sparse autoencoder for data transfer in wireless sensor network. J. Eng. Res. 2024, 12, 122–132. [Google Scholar] [CrossRef]
  20. Cherappa, V.; Thangarajan, T.; Meenakshi Sundaram, S.S.; Hajjej, F.; Munusamy, A.K.; Shanmugam, R. Energy-efficient clustering and routing using ASFO and a cross-layer-based expedient routing protocol for wireless sensor networks. Sensors 2023, 23, 2788. [Google Scholar] [CrossRef] [PubMed]
  21. Naeem, M.K.; Patwary, M.; Abdel-Maguid, M. On Lifetime Maximisation of Heterogeneous Wireless Sensor Networks with Multi-Layer Realisation. In Proceedings of the 2017 IEEE Wireless Communications and Networking Conference (WCNC), San Francisco, CA, USA, 19-22 March 2017; pp. 1–6. [Google Scholar]
  22. Singh, R.; Verma, A.K. Energy efficient cross layer based adaptive threshold routing protocol for WSN. AEU-Int. J. Electron. Commun. 2017, 72, 166–173. [Google Scholar] [CrossRef]
  23. Parween, S.; Hussain, S.Z. A Review on Cross-Layer Design Approach in WSN by Different Techniques. Adv. Sci. Technol. Eng. Syst. J. 2020, 5, 741–754. [Google Scholar] [CrossRef]
  24. Sah, D.K.; Amgoth, T. Parametric survey on cross-layer designs for wireless sensor networks. Comput. Sci. Rev. 2018, 27, 112–134. [Google Scholar] [CrossRef]
  25. Yuan, D.; Kanhere, S.S.; Hollick, M. Instrumenting Wireless Sensor Networks—A survey on the metrics that matter. Pervasive Mob. Comput. 2017, 37, 45–62. [Google Scholar] [CrossRef]
  26. Mohammed Abo-Zahhad, M.F.; Ali, A. Modeling and Minimization of Energy Consumption in Wireless Sensor Networks. In Proceedings of the 2015 IEEE International Conference on Electronics, Circuits, and Systems (ICECS), Cairo, Egypt, 6–9 December 2015. [Google Scholar] [CrossRef]
  27. Mahmood, F.; Liu, L. Energy-Efficient Wireless Communications: From Energy Modeling to Performance Evaluation. IEEE Trans. Veh. Technol. 2019, 68, 7643–7654. [Google Scholar] [CrossRef]
  28. Amutha, J.; Sharma, S.; Nagar, J. WSN strategies based on sensors, deployment, sensing models, coverage and energy efficiency: Review, approaches and open issues. Wirel. Pers. Commun. 2020, 111, 1089–1115. [Google Scholar] [CrossRef]
  29. Mohamed, R.E.; Saleh, A.I.; Abdelrazzak, M.; Samra, A.S. Survey on wireless sensor network applications and energy efficient routing protocols. Wirel. Pers. Commun. 2018, 101, 1019–1055. [Google Scholar] [CrossRef]
  30. Alobaidy, H.A.H.; Jit Singh, M.; Behjati, M.; Nordin, R.; Abdullah, N.F. Wireless Transmissions, Propagation and Channel Modelling for IoT Technologies: Applications and Challenges. IEEE Access 2012, 10, 24095–24131. [Google Scholar] [CrossRef]
  31. Ketshabetswe, L.K.; Zungeru, A.M.; Mangwala, M.; Chuma, J.M.; Sigweni, B. Communication protocols for wireless sensor networks: A survey and comparison. Heliyon 2019, 5, e01591. [Google Scholar] [CrossRef] [PubMed]
  32. Kelagadi, H.M.; Kumar, P. Distributed topology control techniques for wireless sensor networks: An overview. Int. J. Adv. Res. Comput. Sci. Softw. Eng. 2017, 7, 425–436. [Google Scholar] [CrossRef]
  33. Lobiyal, D.K. Energy Consumption Reduction in S-MAC Protocol for Wireless Sensor Network. Procedia Comput. Sci. 2018, 143, 757–764. [Google Scholar] [CrossRef]
  34. Del-Valle-Soto, C.; Mex-Perera, C.; Nolazco-Flores, J.A.; Velázquez, R.; Rossa-Sierra, A. Wireless sensor network energy model and its use in the optimization of routing protocols. Energies 2020, 13, 728. [Google Scholar] [CrossRef]
  35. BenSaleh, M.S.; Saida, R.; Kacem, Y.H.; Abid, M. Wireless sensor network design methodologies: A survey. J. Sens. 2020, 2020, 9592836. [Google Scholar] [CrossRef]
  36. Yue, Y.G.; He, P. A comprehensive survey on the reliability of mobile wireless sensor networks: Taxonomy, challenges, and future directions. Inf. Fusion 2018, 44, 188–204. [Google Scholar] [CrossRef]
  37. Naidu, G.A.; Kumar, J.; Garudachedu, V.; Ramesh, P.R. 6LoWPAN border router implementation for IoT devices on RaspberryPi. In Proceedings of the 3rd International Conference on Internet of Things and Connected Technologies (ICIoTCT), Jaipur, India, 26–27 March 2018; pp. 26–27. [Google Scholar]
  38. Mazloomi, N.; Gholipour, M.; Zaretalab, A. Efficient configuration for multi-objective QoS optimization in wireless sensor network. Ad Hoc Netw. 2022, 125, 102730. [Google Scholar] [CrossRef]
  39. Da Xu, L.; He, W.; Li, S. Internet of things in industries: A survey. IEEE Trans. Ind. Inform. 2014, 10, 2233–2243. [Google Scholar] [CrossRef]
  40. Toldinas, J.; Lozinskis, B.; Baranauskas, E.; Dobrovolskis, A. MQTT quality of service versus energy consumption. In Proceedings of the 2019 23rd International Conference Electronics, Palanga, Lithuania, 17–19 June 2019; pp. 1–4. [Google Scholar]
  41. Velinov, A.; Mileva, A.; Stojanov, D. Power consumption analysis of the new covert channels in coap. Int. J. Adv. Secur. 2019, 12, 42–52. [Google Scholar]
  42. Cheng, L.; Niu, J.; Gu, Y.; Luo, C.; He, T. Achieving Efficient Reliable Flooding in Low-Duty-Cycle Wireless Sensor Networks. IEEE/ACM Trans. Netw. 2016, 24, 3676–3689. [Google Scholar] [CrossRef]
  43. Texas Instruments. CC2538 Powerful Wireless Microcontroller System-on-Chip for 2.4-GHz IEEE 802.15.4, 6LoWPAN, and ZigBee® Applications. 2015. Available online: https://www.ti.com/lit/ds/symlink/cc1200.pdf (accessed on 1 March 2024).
  44. Daneels, G.; Municio, E.; Van de Velde, B.; Ergeerts, G.; Weyn, M.; Latré, S.; Famaey, J. Accurate energy consumption modeling of ieee 802.15. 4e tsch using dual-bandopenmote hardware. Sensors 2018, 18, 437. [Google Scholar] [CrossRef]
  45. Razzaque, M.A.; Dobson, S. Energy-efficient sensing in wireless sensor networks using compressed sensing. Sensors 2014, 14, 2822–2859. [Google Scholar] [CrossRef]
  46. Dibal, P.Y.; Onwuka, E.N.; Zubair, S.; Nwankwo, E.I.; Okoh, S.; Salihu, B.A.; Mustaphab, H. Processor power and energy consumption estimation techniques in IoT applications: A review. Internet Things 2023, 21, 100655. [Google Scholar] [CrossRef]
  47. Chéour, R.; Khriji, S.; Götz, M.; Abid, M.; Kanoun, O. Accurate dynamic voltage and frequency scaling measurement for low-power microcontrollers in wireless sensor networks. Microelectron. J. 2020, 105, 104874. [Google Scholar] [CrossRef]
  48. Lacroix, M.A.; Rocher, R.; Scalart, P. Realistic power amplifier model for energy optimization in wireless networks. In Proceedings of the 2021 17th International Symposium on Wireless Communication Systems (ISWCS), Berlin, Germany, 6–9 September 2021. [Google Scholar] [CrossRef]
  49. Mahmood, A.; Hossain, M.A.; Cavdar, C.; Gidlund, M. Energy-Reliability Aware Link Optimization for Battery-Powered IoT Devices With Nonideal Power Amplifiers. IEEE Internet Things J. 2019, 6, 5058–5067. [Google Scholar] [CrossRef]
  50. Halgamuge, M.N.; Zukerman, M.; Ramamohanarao, K.; Vu, H.L. An estimation of sensor energy consumption. Prog. Electromagn. Res. B 2009, 12, 259–295. [Google Scholar] [CrossRef]
  51. Dunkels, A.; Osterlind, F.; Tsiftes, N.; He, Z. Software-based on-line energy estimation for sensor nodes. In Proceedings of the 4th Workshop on Embedded Networked Sensors, Cork, Ireland, 25–26 June 2007; pp. 28–32. [Google Scholar]
  52. Hendrawan, I.N.R.; Arsa, I.G.N.W. Zolertia Z1 energy usage simulation with Cooja simulator. In Proceedings of the 2017 1st International Conference on Informatics and Computational Sciences (ICICoS), Semarang, Indonesia, 15–16 November 2017; pp. 147–152. [Google Scholar]
  53. Jain, S. Power Consumption Measurements and Optimization forCC2538 End Device with Z-Stack; SWRA456; Texas Instrument, 2014; Available online: https://www.ti.com/lit/an/swra456/swra456.pdf (accessed on 1 June 2024).
  54. Zolertia 2009–2016. Zolertia RE-Mote Revision B Internet of Things Hardware Development Platform, for 2.4-GHz and 863–950 MHz IEEE 802.15.4, 6LoWPAN and ZigBee® Applications, 2nd ed.; Zolertia: Barcelona, Spain, 2016. [Google Scholar]
  55. Zhai, J.-Q.; Zhang, H.-S.; Li, Y.; Zhang, Y.-W. Energy Efficient RF Front-Ends Architecture Design for Wireless Sensor Networks. In Proceedings of the 2010 Second International Conference on Networks Security, Wireless Communications and Trusted Computing, Wuhan, China, 24–25 April 2010; Volume 1, pp. 236–239. [Google Scholar] [CrossRef]
  56. Kurt, S.; Tavli, B. Pathloss modeling for wireless sensor networks. IEEE Antennas Propag. Mag. 2017, 59, 18–37. [Google Scholar] [CrossRef]
  57. Zhang, L.; Zhu, Q. Interference and Energy-Aware Topology Control. In Proceedings of the 2011 International Conference on Consumer Electronics, Communications and Networks (CECNet), Xianning, China, 16–18 April 2011; pp. 1357–1359. [Google Scholar]
  58. Heinzelman, W.R.; Chandrakasan, A.; Balakrishnan, H. Energy-efficient communication protocol for wireless microsensor networks. In Proceedings of the 33rd Annual Hawaii International Conference on System Sciences, Maui, Hawaii, 4–7 January 2000; p. 10. [Google Scholar]
  59. Wang, N.; Hong, Z. An energy-efficient topology control algorithm for earth building monitoring using heterogeneous wireless sensor networks. IEEE Access 2019, 7, 76120–76130. [Google Scholar] [CrossRef]
  60. Pantazis, N.A.; Nikolidakis, S.A.; Vergados, D.D. Energy-efficient routing protocols in wireless sensor networks: A survey. IEEE Commun. Surv. Tutor. 2012, 15, 551–591. [Google Scholar] [CrossRef]
  61. Dunkels, A. The Contikimac Radio Duty Cycling Protocol. 2011. Available online: https://dunkels.com/adam/dunkels11contikimac.pdf (accessed on 1 April 2024).
Figure 1. A general architecture for an IoT system.
Jsan 13 00056 g001
Figure 2. Layered framework and CL framework.
Jsan 13 00056 g002
Figure 3. Block diagram of a generic node model resulting from the proposed CL modeling methodology.
Jsan 13 00056 g003
Figure 4. Block diagram of a generic sink model resulting from the proposed CL modeling methodology.
Jsan 13 00056 g004
Figure 5. CL node-level model.
Jsan 13 00056 g005
Figure 6. Detailed block diagrams for different node-level models.
Jsan 13 00056 g006
Figure 7. Experimental setup using two Zolertia Re-Motes.
Jsan 13 00056 g007
Figure 8. Testbed implementation using two Zolertia Re-Motes.
Jsan 13 00056 g008
Figure 9. Battery current measured from the Zolertia Re-Mote target.
Jsan 13 00056 g009
Figure 10. Node-level lifetime estimation model and error comparison between simulation results and direct and indirect (powertrace) measurements.
Jsan 13 00056 g010
Figure 11. CL node and network model and blocks.
Jsan 13 00056 g011
Figure 12. Evaluated node-network level models.
Jsan 13 00056 g012
Figure 13. Battery current measured from Zolertia Re-Mote target.
Jsan 13 00056 g013
Figure 14. Network-level lifetime estimation model and error comparison between simulation results and direct and indirect (powertrace) measurements.
Jsan 13 00056 g014
Disclaimer/Publisher’s Note: The statements, opinions and data contained in all publications are solely those of the individual author(s) and contributor(s) and not of MDPI and/or the editor(s). MDPI and/or the editor(s) disclaim responsibility for any injury to people or property resulting from any ideas, methods, instructions or products referred to in the content.