You are currently viewing a new version of our website. To view the old version click .
Journal of Sensor and Actuator Networks
  • Article
  • Open Access

20 March 2023

Machine Learning-Based Detection for Unauthorized Access to IoT Devices

,
,
,
,
,
and
1
Department of Computer Science, College of Computers and Information Systems, Umm Al-Qura University, Makkah 21955, Saudi Arabia
2
Department of Networks and Communications, College of Computer Science and Information Technology, Imam Abdulrahman Bin Faisal University, P.O. Box 1982, Dammam 31441, Saudi Arabia
3
Department of Computer Information Systems, College of Computer Science and Information Technology, Imam Abdulrahman Bin Faisal University, P.O. Box 1982, Dammam 31441, Saudi Arabia
4
SAUDI ARAMCO Cybersecurity Chair, Department of Computer Science, College of Computer Science and Information Technology, Imam Abdulrahman Bin Faisal University, P.O. Box 1982, Dammam 31441, Saudi Arabia
This article belongs to the Special Issue Feature Papers in Network Security and Privacy

Abstract

The Internet of Things (IoT) has become widely adopted in businesses, organizations, and daily lives. They are usually characterized by transferring and processing sensitive data. Attackers have exploited this prospect of IoT devices to compromise user data’s integrity and confidentiality. Considering the dynamic nature of the attacks, artificial intelligence (AI)-based techniques incorporating machine learning (ML) are promising techniques for identifying such attacks. However, the dataset being utilized features engineering techniques, and the kind of classifiers play significant roles in how accurate AI-based predictions are. Therefore, for the IoT environment, there is a need to contribute more to this context by evaluating different AI-based techniques on datasets that effectively capture the environment’s properties. In this paper, we evaluated various ML models with the consideration of both binary and multiclass classification models validated on a new dedicated IoT dataset. Moreover, we investigated the impact of different features engineering techniques including correlation analysis and information gain. The experimental work conducted on bagging, k-nearest neighbor (KNN), J48, random forest (RF), logistic regression (LR), and multi-layer perceptron (MLP) models revealed that RF achieved the highest performance across all experiment sets, with a receiver operating characteristic (ROC) of 99.9%.

1. Introduction

In recent decades, the Internet of Things (IoT) concept has become widely popular with numerous fields and organizations implementing and investing in its use. IoT refers to the billions of devices that can connect to the internet, thus sharing and collecting vast amounts of data anywhere in the world. This ability of global devices coupled with communication technologies create a system that connects, exchanges, and analyzes data, resulting in faster and more efficient decision making. With the dawn of readily available inexpensive computer chips, and the omnipresence of wireless networks, it has become possible to transform anything into a part of the IoT [1]. Hence, the number of IoT devices has skyrocketed over the past years. According to Statistica [2], the global number of IoT devices has reached 16.4 billion, and by 2025, it is projected to reach more than 30 billion devices. However, with the rise in the wide use of IoT devices, vulnerabilities have arisen, leading to the breach of confidentiality and integrity of users and systems.
Most IoT devices perform operations on sensitive user data. Thus, various fundamental challenges in designing a secure IoT exist, such as privacy, access control, authentication, confidentiality, trust, etc. As discussed by Kolias et al. [3], various malware botnets, such as Mirai, can take control and quickly spread, exploiting the vulnerabilities of IoT devices. This especially points out that insecure IoT devices can lead to direct risks to all the interconnecting devices in their network. Further, attackers often gain access to users’ data and may cause monetary losses and eavesdropping [4,5]. Particularly, IoT devices are prone to network attacks such as phishing attacks, data thefts, spoofing, and denial of service (DoS) attacks. These attacks can cause other cyber security threats, including serious data breaches and ransomware attacks that can cost organizations a lot of money and effort to recover from [5].
Denial of service (DoS) attacks in such devices have also become pervasive, preventing access to services that the user has paid for [6]. Moreover, DoS attacks can negatively affect the services of small networks such as homes, hospitals, educational institutions, etc. [7,8]. What is more is that such attacks quickly spread, leading to exploiting vulnerabilities of a plethora of IoT devices. In 2021, Forbes reported that the attacks on IoT devices skyrocketed and surpassed 300% [9]. Thus, the need to have robust solutions to counter these attacks and prevent their expansion before it is too late is imminent.
The use of artificial intelligence (AI) techniques, mainly machine learning (ML), has become very useful due to their ability to learn from past experiences and prevent cyber-attacks before they spread and affect more and more devices [10]. ML is a field in AI that uses data and algorithms to mimic how humans learn, improving over time with experience. Network security, particularly IoT security, is a very challenging field. Utilizing ML’s power can lead to more robust solutions to protect the confidentiality, integrity, and availability of IoT networks and users [11,12]. Thus, several research studies focus on attack detection in IoT environments using AI techniques. Accordingly, this research uses a recent dataset to apply ML techniques for detecting attacks in IoT environments.
The main contributions of this paper are as follows:
  • Study the effect of different sets of features on building ML models for detecting various IoT attacks and investigate the models’ performance using features selection techniques;
  • Perform a comparative analysis of binary and multiclass experiments on the dataset to detect and classify IoT attacks;
  • Achieve better benchmark results on the utilized IoT attacks dataset.
The paper is divided as follows: Section 2 reviews related works in the field. Section 3 outlines the research methodology, which describes the dataset used, the preprocessing steps carried out, the models applied, and the performance metrics utilized. Section 4 discusses the experimental setup and the results obtained. Finally, Section 5 presents the conclusion and future work.

3. Methodology

The primary purpose of our study is to use ML algorithms to detect and classify IoT network security attacks. The models used include bagging, KNN, J48, RF, LR, and MLP. The models were trained using a publicly available dataset from Wheelus and Zhu [27] to detect and categorize IoT network attacks. The dataset underwent several preprocessing steps to convert it into the most suitable format for training the models. Furthermore, we evaluated the performance of these models based on evaluation parameters, including classification accuracy, F-score, recall, precision, and ROC. Moreover, we implemented 10-fold cross-validation to build the models and performed two experiments for detection—binary classification to distinguish between normal and attack sessions—and two experiments for classification—multiclass classification to categorize normal sessions and three types of attack, namely, no shared secret (NSS), query cache (QC), and zone transfer (ZT). Furthermore, the experiments were conducted using a subset of the features to emphasize the significance of the features selection process while maintaining, if not increasing, the models’ performance. Figure 1 demonstrates the research methodology steps.
Figure 1. Research methodology steps.

3.1. Dataset Description
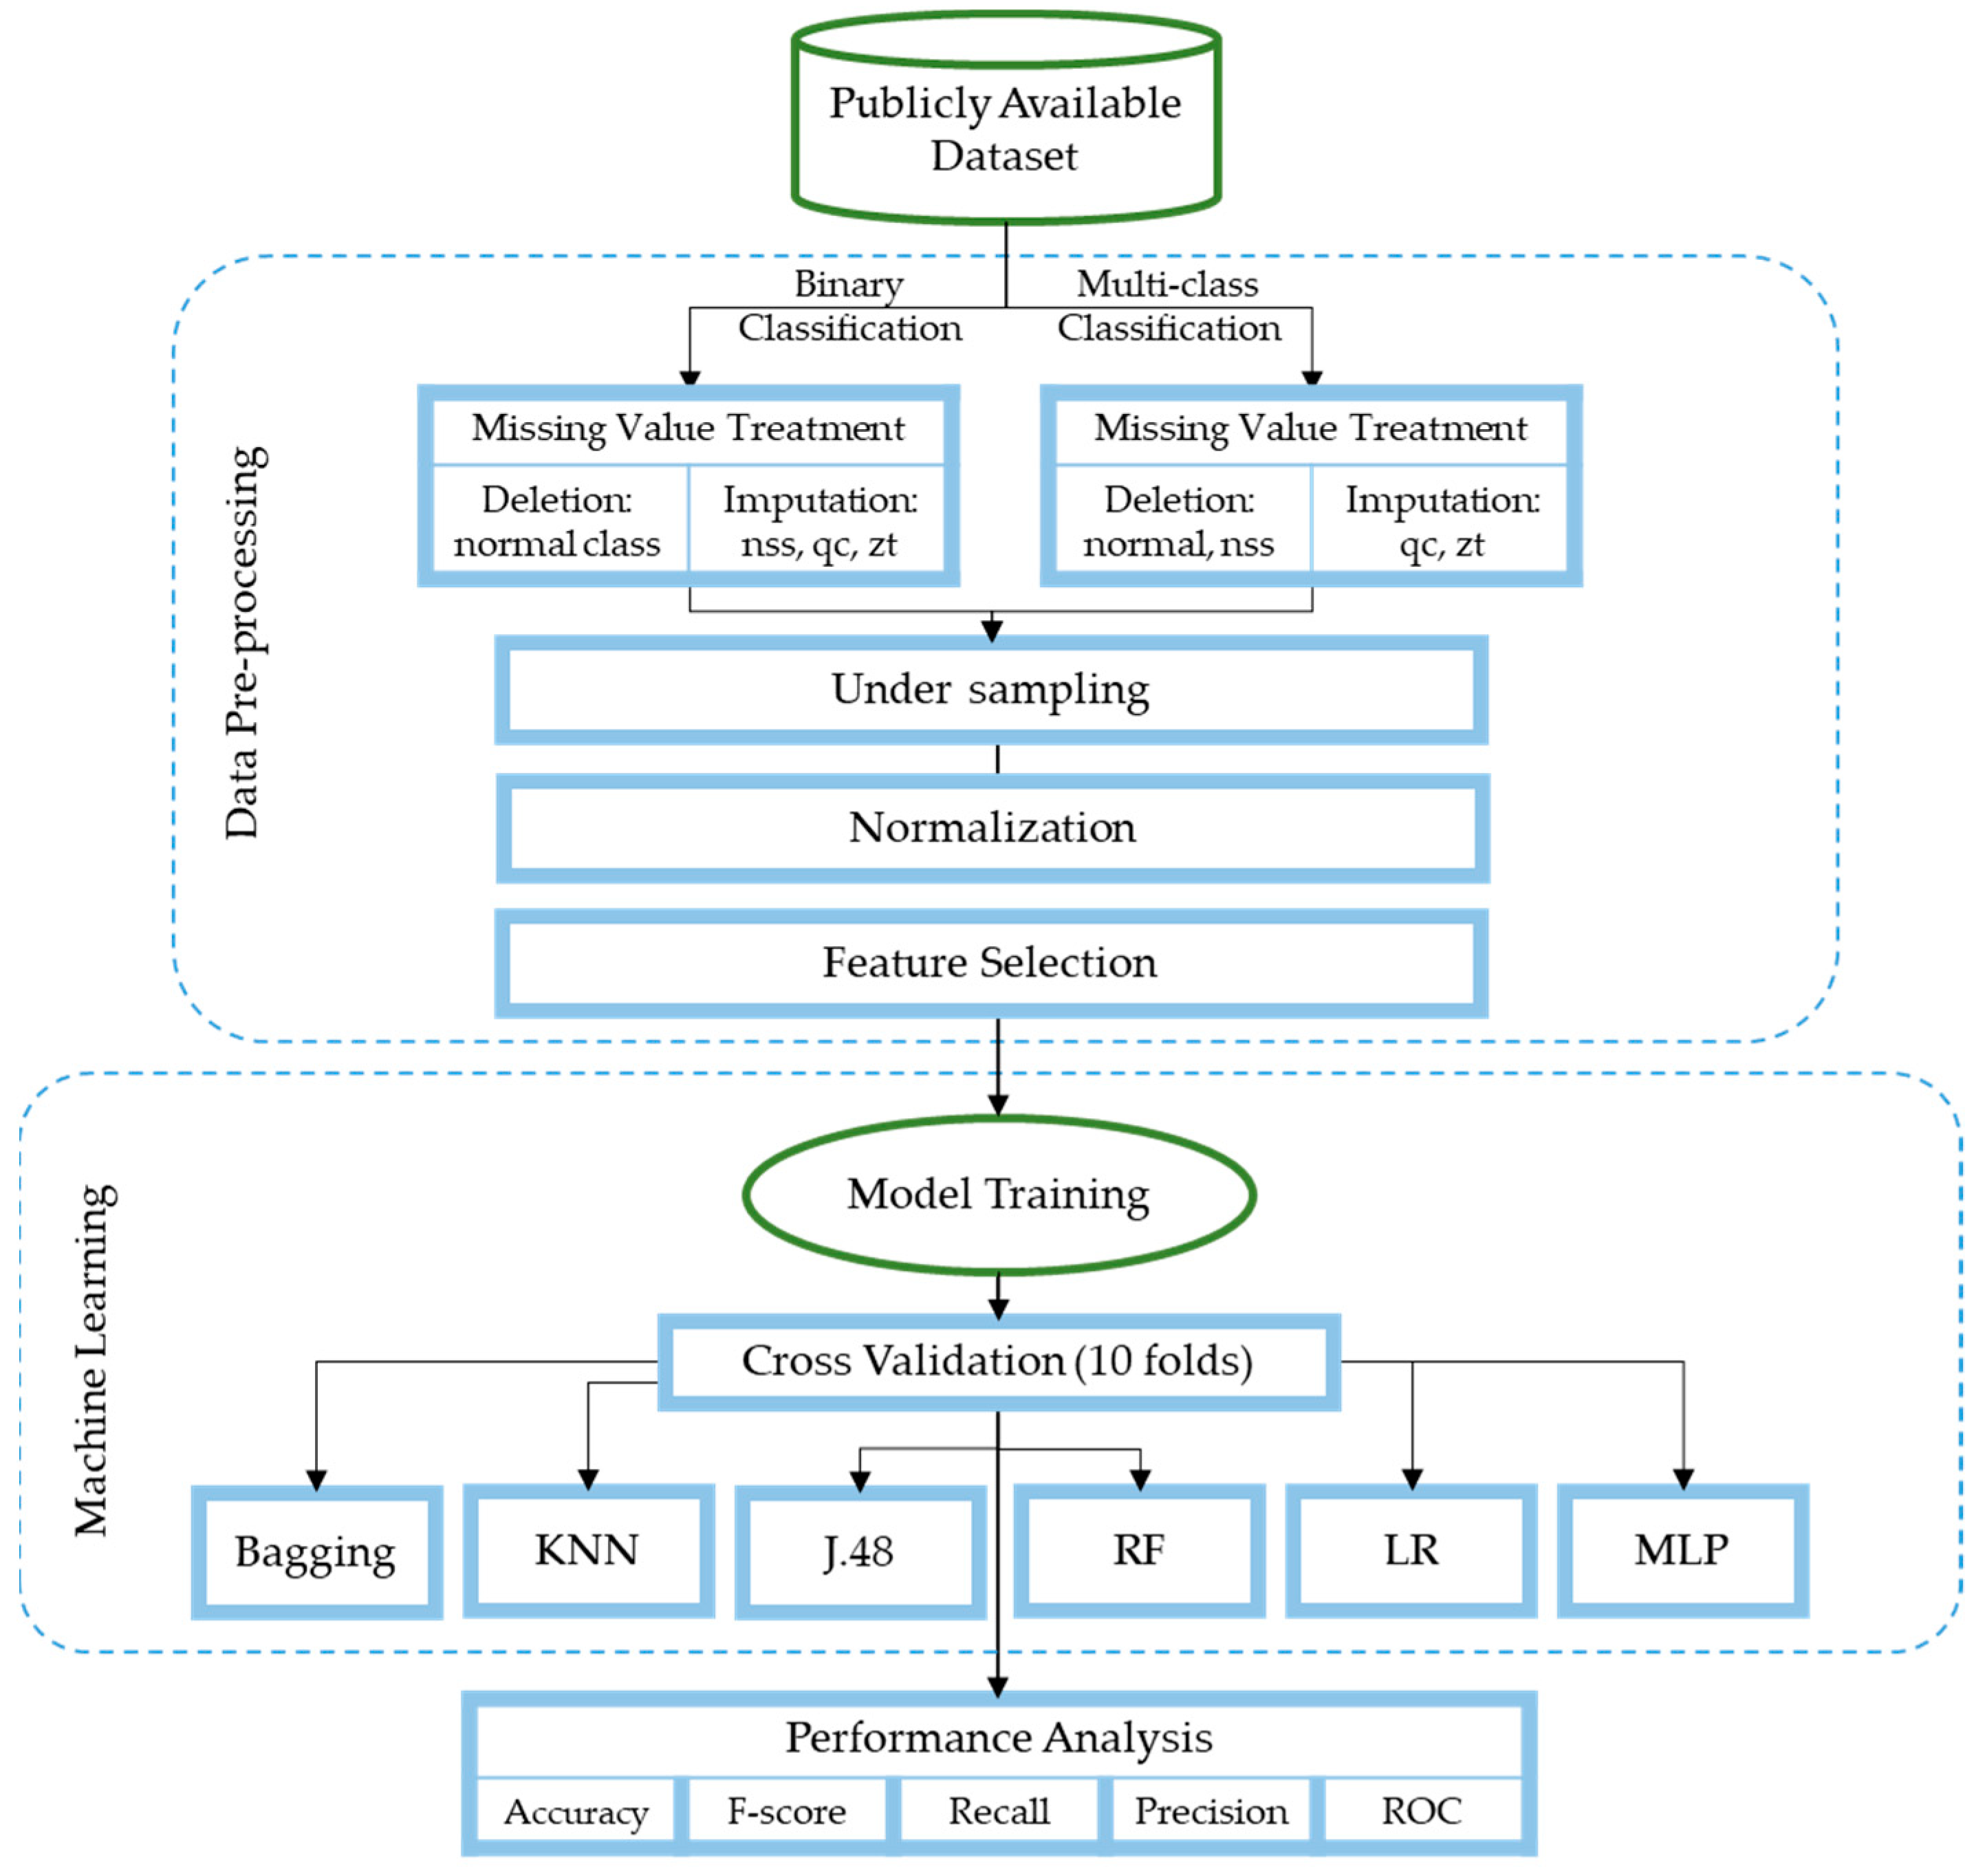
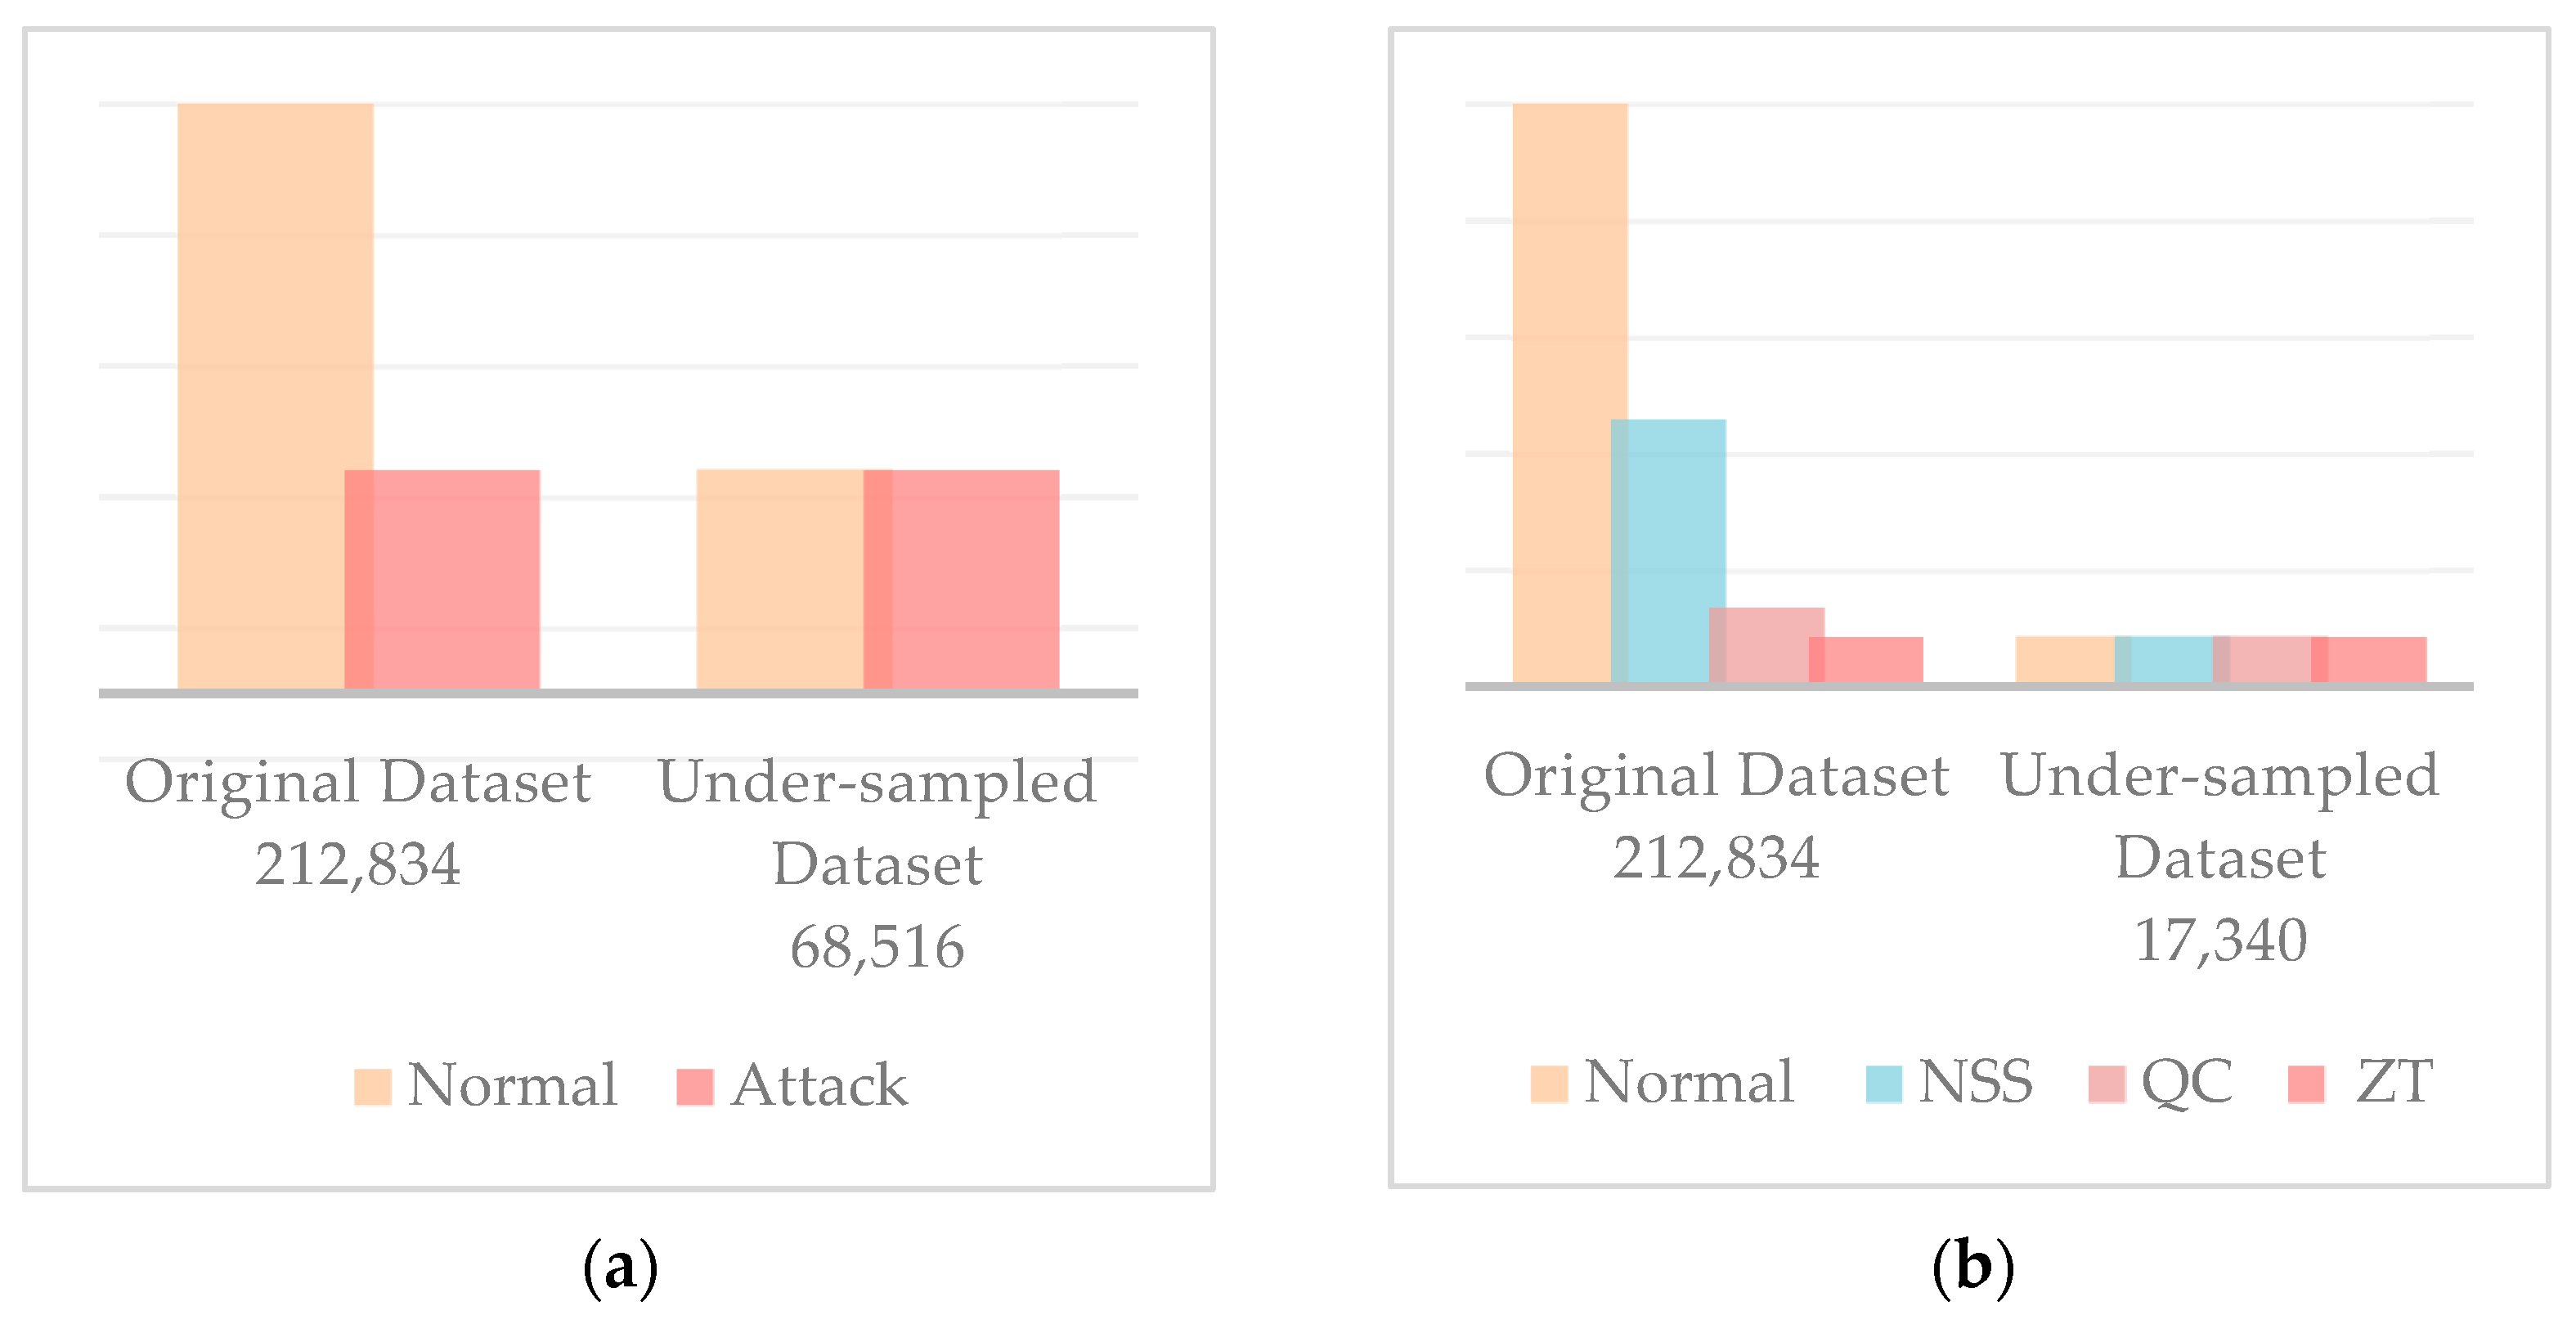
The dataset used in this study is a publicly available dataset released by Wheelus and Zhu [27]. The dataset was collected for nine months, and the raw data underwent several preprocessing phases and organizing into sessions based on packet commonalities such as source and destination IP addresses and ports, as well as temporal characteristics. The set of features included in the dataset is depicted in Table 2. For the binary case, the dataset aims to classify samples into attack or normal categories. For multiclass classification purposes, it aims to classify the sample into four categories of unauthorized attacks: normal, query cache (QC), zone transfer (ZT), and no shared secret (NSS). The QC error occurs when an unauthorized request for system data is evidenced by the incorrect sequence of requests made to the remote gate opener (RGO). In a ZT attack, a perpetrator tries to access domain name system (DNS) zone information to scan the IoT system’s components. The NSS attack happens when there is an unauthorized attempt to join the IoT network. This attempt is recognized when the shared secret, exchanged during authorization of RGO, is expired or invalid. The binary dataset consists of 212,834 samples, where 178,576 are normal and 34,258 are attacks. On the other hand, in the multiclass dataset, there are four classes: normal, NSS, QC, and ZT, where the number of examples that belong to each class are 178,576, 23,022, 6901, and 4335, respectively.
Table 2. Description of features present in the dataset.

3.2. Preprocessing

Preprocessing is performed before using the dataset to ensure the data is in a format appropriate for training and testing the models. This step involves loading, cleaning, treating, and converting the data into a suitable format for the intended tasks. The dataset originally contains 212,834 instances, 178,576 of which represent normal traffic. This represents 83.9% of the dataset, indicating the imbalance in the data as this class is substantially higher than the others. Considering that the dataset suffers from imbalance and the presence of missing values in all classes, we worked on treating the missing values differently for each class depending on the best method for each. Because the normal class was significantly higher than the others, the method chosen to treat its missing values was deletion for both experiments. The missing values in the second class representing attacks were imputed using the mean for the binary classification experiments. This was possible as the features included missing values corresponding to variance values. Hence, using the mean was appropriate to impute those missing values. As for the multiclass experiments, the missing values in the NSS class were deleted as doing so would maintain the number of NSS attack instances to still be more than the lowest class. In other words, as illustrated in Table 3, when the missing values of the NSS class are deleted, the number of instances becomes 5597, which is still more than the number of instances of the ZT class—4335. The missing values in the QC and ZT classes were treated by imputation using the mean because the number of instances was already low in those two classes. Table 3 shows how the dataset appears after treating missing values. Moreover, under-sampling was performed due to the imbalance that remained. In addition, the dataset records were also normalized to the range of −1:1. How the final dataset instances appear after all these steps is visualized in Figure 2 for the binary and multiclass classification experiments.
Table 3. Dataset values before and after missing values treatment.
Figure 2. Randomized under-sampling of the dataset for (a) binary classification and (b) multiclass classification.

3.3. Feature Selection

The dataset included 20 features depicting relevant information about the traffic sessions. We performed four different experiments to obtain the highest performance. The class attribute takes the values of normal or attack in the case of the binary experiments, and in the case of multiclass classification, the attack values are further classified into three types of attacks: NSS, QC, and ZT. The same set of features is used for all four experiments. Table 4 shows how the dataset appeared after feature selection. As shown in Table 4, the correlation and information gain of all features were calculated. The top 30% of the features were selected. Therefore, the seven features with the highest correlations were selected, and another feature (duration) was added due to its high information gain value. Later, the correlation among the features was calculated, indicating that the riotb and riotp attributes had a 100% correlation. Only one was to be used; otherwise, we would have a redundant feature. According to the higher information gain value of the riotb feature, it was the one we kept. Hence, we had seven features to use in the four experiments.
Table 4. Correlation and information gain values for each of the selected features.

3.4. Evaluation Metrics

The aforementioned model is evaluated in terms of accuracy, F1-score, recall, precision, and ROC. The following are the potential outcomes of attack prediction:
  • True positive (TP): TP refers to attack classes that were correctly predicted;
  • False positive (FP): FP signifies the normal classes that were incorrectly predicted as attack;
  • True negative (TN): TN reflects the normal classes that were correctly predicted;
  • False negative (FN): FN refers to attack classes that were incorrectly predicted as normal.
Accuracy indicates the overall rate of correctly identified instances in the test dataset compared with the total number of instances, defined as Equation (1):
A c c u r a c y = T P + T N T P + F N + F P + T N
F1 score measures both the precision and recall at the same time, calculated as Equation (2):
F 1 score = 2 × P × R P + R
Recall indicates how correctly the model predicts the true positives, calculated as the ratio of the true positives detected to the total actual positive, shown in Equation (3):
R e c a l l   ( R ) = T P T P + F N
Precision indicates the quality of prediction made, calculated as the ratio of true positives to the total positives (false and true), represented in Equation (4):
P r e c i s i o n   ( P ) = T P T P + F P
The ROC curve indicates the model’s performance at various classification thresholds. It plots two parameters: the true positive rate and false positive rate.

4. Results and Discussion

4.1. Experimental Setup

Different ML models were used to perform the experiments, including RF, LR, KNN, J48, bagging ensemble, and MLP. The rationale behind using these algorithms is the fact that they were successfully used for building classification models in different domains [14,18,20,24]. Further, these algorithms were selected to compare the performance between single-model and ensemble-based classification algorithms. The dataset used in these experiments contains 19 features and a target class divided into normal and attack traffic in the first set of experiments and divided into normal, QC, ZT, and NSS attacks in the second set of experiments. The number of instances was 212,834, but because of the imbalance problem, the dataset needed to be under-sampled to obtain a different number of instances for each set of experiments. Moreover, two more sets of experiments were performed with seven features that were chosen after performing feature selection based on the correlation with the target class.

4.2. Parameter Settings

Parameter settings are optimized to ensure obtaining the best possible results from the models. After exploring the best range for the most important parameter of each algorithm, different values were tested within these ranges. The best settings used in the binary and multiclass classification experiments are shown in Table 5.
Table 5. Parameter optimization settings.

4.3. Experimental Results

4.3.1. Binary Class Results

The first set of experiments was performed using a binary class of normal and attack traffic with 19 features. The classifiers used for this set of experiments are RF, LR, KNN, J48, bagging ensemble, and MLP. Table 6 shows binary experiment results before feature selection.
Table 6. Binary experiment results before feature selection.
As shown in Table 6, RF resulted in the best performance in all the evaluation metrics. The bagging ensemble model resulted in a ROC area of 0.999. KNN resulted in the lowest performance among all the classifiers, with an accuracy level of 92.4%. The nature of the RF classifier is the reason behind its performance. As RF is an ensemble of decision trees, it simultaneously trains multiple trees and then uses all the trees to make the final prediction. In addition, it applies feature selection during its learning process, and each of the trees could use a different set of features. Therefore, by combining all the learned trees, we obtain a very powerful algorithm with an enhanced prediction performance. The results of the bagging ensemble support the discussion before, as the strength of ensemble techniques is important to predicting the type of traffic. The reason behind overperforming the RF model to the bagging ensemble is the nature of the classifiers included in the bagging model. The nature of tree classifiers is more suitable to the prediction class of this study, as RF overperformed the bagging ensemble, and the J48 model overperformed other single classifiers. As mentioned earlier, the feature selection included in training the tree classifiers could be the reason why they select the more suitable features for detecting the attack traffic from normal traffic.
After performing feature selection, more experiments were performed using the best set of features as mentioned in Section 3.3. Table 7 shows the results after the feature selection.
Table 7. Binary experiment results after features selection.
As shown in Table 7, RF resulted in the best performance in all the evaluation metrics. As before, the bagging ensemble yielded the same ROC area of 0.999. The performance of the KNN model was significantly improved with an accuracy of 99.28% and beat the LR model which resulted in an accuracy of 97.83%, the lowest performance among all the models. The possible reason behind the improvement of the KNN performance could be that KNN is suited for lower dimensional data. In other words, the KNN model has benefited from feature selection which reduced the dimensionality of the input feature.

4.3.2. Multiclass Results

The second set of experiments was performed using a multiclass of normal and ZT, QC, and NSS attacks with 19 features. The classifiers used for this set of experiments are RF, LR, KNN, J48, bagging ensemble, and MLP. Table 8 shows the multiclass experiment results before feature selection.
Table 8. Multiclass experiment results before feature selection.
As shown in Table 8, RF resulted in the best performance in all the evaluation metrics used. The bagging ensemble model resulted in a ROC area of 0.999. KNN resulted in the lowest performance among all the classifiers with an accuracy level of 79.48%. As mentioned in Section 4.3.1, the strength of ensemble trees and the feature selection included in their training could be the reason for resulting in the best performance among all the classifiers.
Another set of experiments was performed using the best seven features. Table 9 below shows the results after the features selection.
Table 9. Multiclass experiment results after features selection.
As shown in Table 9, RF resulted in the best performance in all the evaluation metrics. The performance of the KNN model was significantly improved to result in an accuracy of 97.88% and beat the LR model, which resulted in an accuracy of 90.46%, the lowest performance among all the models.

4.4. Discussion

The experimental results showed that the performance of the models in binary classification is better than their performance in multiclass classification. This means the models can differentiate between normal and attack traffic but face some difficulty distinguishing between the attack types. The reason for that can be the similarity of the features of the attack traffic, which made it hard for the classifiers to find unique features for each attack. In comparison, the highest level of the ROC area was the same in all binary and multiclass experiments, with a level of 0.999. Because RF combines the strength of the decision trees, the ensemble techniques, and the feature selection, it achieved the highest performance among all the experiments. The bagging ensemble was the second model in terms of performance. This shows that ensemble models resulted in better performance compared with single classifiers. Moreover, the performance of all models was slightly decreased after applying feature selection, except in the KNN model, as its performance was significantly improved after feature selection. Table 10 and Table 11 show the confusion matrix of the RF model in binary and multiclass classifications.
Table 10. Confusion matrix for the binary class case.
Table 11. Confusion matrix for the multiclass case.

4.5. Comparison with Benchmark Study

This study used different ML models to create models using a well-known dataset for detecting attacks on IoT devices. The dataset that was used to train the models consists of 212,834 samples and 19 features. The target class is divided into binary classes as normal and attack traffic, and multiclass as normal, NSS, QC, and ZT attacks. To handle the missing values, both removing missing values and imputing them using the mean value were used depending on the number of samples in each class. The dataset suffered from an imbalance problem, and the randomized under-sampling technique was used to balance the data. In the end, feature selection was performed to use the best set of seven features and obtain the same accuracy as when using the whole set of features. It was compared with a benchmark study to compare the proposed model with the previous studies.
The benchmark study [27] compared with this study used the same dataset but with multiclass only. Moreover, the benchmark study used four ML algorithms: naive Bayes, J48, LR, RF, and the MLP algorithm. All the samples with missing values were dropped, and the random oversampling technique was used to solve the imbalance problem. Moreover, the entire set of 19 features was used to build the model. In addition, the binary classification of the dataset was experimented with for the first time in this study. The preprocessing techniques used in the proposed study have a significant impact on retaining improved results compared with the benchmark study. In addition, combining the imputing and removing methods in handling missing values helped save data of minority classes from being lost. Also, under-sampling techniques could be a better option to avoid overfitting caused by random oversampling. Lastly, experimenting with feature selection and reducing the number of the needed features to seven instead of 19 is very important in reducing the time required for both training ML models and using them for classification. In the benchmark study, the RF model achieved the best performance with a ROC area of 0.976. Although the same dataset is used in this study and the previous study, the model proposed resulted in better performance in all evaluation metrics. Table 12 shows the comparison in detail.
Table 12. Comparison with benchmark study.

5. Conclusions

With the growing number of IoT devices, the number of cyber threats in IoT networks has drastically surged. This imminent situation requires instant action as most devices share and process sensitive data. Therefore, AI methods have been widely adopted to counter these threats due to their robustness and efficiency. Many researchers focused on detecting various attacks in IoT by building ML classifiers. In this study, we have focused on features engineering and building ML models using a new dataset as it is necessary to explore new cybersecurity datasets due to the changing nature of cyber threats.
We performed two classes of experiments: one for binary classification into normal and attack class, and another for multiclass classification into normal, QC (query cache), ZT (zone transfer), and NSS (no shared secret) classes. In both cases, the dataset underwent randomized under-sampling to obtain an equal number of classes, followed by normalization, and feature selection using correlation and information gain. Then, for each case, two sets of experiments were performed. One uses all the features, and another uses the best features only. The 10-fold cross-validation technique was applied to the dataset and the models applied were bagging, KNN, J48, RF, LR, and MLP. We evaluated their performance in terms of accuracy, F-score, recall, precision, and ROC. The results of the experiments showed that RF achieved the highest performance in all the experiment sets, obtaining a ROC of 99.9%. Furthermore, binary classification experiments gave better results than multiclass. Additionally, feature selection had little effect in both the experiment sets as most of the classifier performance remained the same except for the case of KNN, where its performance significantly increased. As for future work, we suggest building real-time models capable of identifying attacks in IoT devices and classifying them in real-time to stop malicious activity before it leaks or destroys sensitive data. Furthermore, this dataset can be used as an inspiration to build our dataset and generate more attack types to try our ML models on it.

Author Contributions

Conceptualization, M.A. (Malak Aljabri); methodology, M.A. (Malak Aljabri), A.A.A., R.M.A.M., F.A., M.A. (Menna Aboulnour), D.M.A. and S.M.; software, M.A. (Menna Aboulnour), D.M.A. and S.M.; validation, M.A.(Malak Aljabri), A.A.A., R.M.A.M., F.A., M.A. (Menna Aboulnour), D.M.A. and S.M.; formal analysis, M.A. (Malak Aljabri), A.A.A., R.M.A.M., F.A., M.A. (Menna Aboulnour), D.M.A. and S.M.; investigation, M.A. (Malak Aljabri), A.A.A., R.M.A.M., F.A., M.A. (Menna Aboulnour), D.M.A. and S.M.; resources, M.A. (Menna Aboulnour), D.M.A. and S.M.; data curation, M.A. (Menna Aboulnour), D.M.A. and S.M.; writing—original draft preparation, M.A. (Menna Aboulnour), D.M.A. and S.M.; writing—review and editing, M.A. (Malak Aljabri), A.A.A., R.M.A.M., F.A., M.A., D.M.A. and S.M.; supervision, M.A. (Malak Aljabri), A.A.A., R.M.A.M. and F.A.; project administration, M.A. (Malak Aljabri), A.A.A., R.M.A.M. and F.A.; funding acquisition, M.A.(Malak Aljabri) and A.A.A.; All authors have read and agreed to the published version of the manuscript.

Funding

This research was funded by the SAUDI ARAMCO Cybersecurity Chair at Imam Abdulrahman Bin Faisal University.

Institutional Review Board Statement

Not applicable.

Data Availability Statement

Publicly available datasets were analyzed in this study. This data can be found here: https://www.kaggle.com/datasets/charleswheelus/iotdatadrivendefense (accessed on 4 August 2021).

Conflicts of Interest

The authors declare no conflict of interest.

References

  1. Aljabri, M.; Zagrouba, R.; Shaahid, A.; Alnasser, F.; Saleh, A.; Alomari, D.M. Machine learning-based social media bot detection: A comprehensive literature review. Soc. Netw. Anal. Min. 2023, 13, 20. [Google Scholar] [CrossRef]
  2. Global IoT and Non-IoT Connections 2010–2025|Statista. Available online: https://www.statista.com/statistics/1101442/iot-number-of-connected-devices-worldwide/ (accessed on 21 February 2022).
  3. Kolias, C.; Kambourakis, G.; Stavrou, A.; Voas, J. DDoS in the IoT: Mirai and other botnets. Computer Long. Beach. Calif. 2017, 50, 80–84. [Google Scholar] [CrossRef]
  4. Aljabri, M.; Alhaidari, F.; Mohammad, R.M.A.; Mirza, U.S.; Alhamed, D.H.; Altamimi, H.S.; Chrouf, S.M.B. An Assessment of Lexical, Network, and Content-Based Features for Detecting Malicious URLs Using Machine Learning and Deep Learning Models. Comput. Intell. Neurosci. 2022, 2022, 1–14. [Google Scholar] [CrossRef] [PubMed]
  5. Aljabri, M.; Aldossary, M.; Al-Homeed, N.; Alhetelah, B.; Althubiany, M.; Alotaibi, O.; Alsaqer, S. Testing and Exploiting Tools to Improve OWASP Top Ten Security Vulnerabilities Detection. In Proceedings of the 2022 14th International Conference on Computational Intelligence and Communication Networks (CICN), Al-Khobar, Saudi Arabia, 4–6 December 2022; pp. 797–803. [Google Scholar]
  6. Das, R.; Tuna, A.; Demirel, S.; Yurdakul, M.K. A Survey on the Internet of Things Solutions for the Elderly and Disabled: Applications, Prospects, and Challenges. Int. J. Comput. Netw. Appl. 2017, 4, 84–92. [Google Scholar] [CrossRef]
  7. Aljabri, M.; Alahmadi, A.A.; Mohammad, R.M.A.; Aboulnour, M.; Alomari, D.M.; Almotiri, S.H. Classification of Firewall Log Data Using Multiclass Machine Learning Models. Electron 2022, 11, 1851. [Google Scholar] [CrossRef]
  8. Aljabri, M.; Mirza, S. Phishing Attacks Detection using Machine Learning and Deep Learning Models. In Proceedings of the 2022 7th International Conference on Data Science and Machine Learning Applications (CDMA), Riyadh, Saudi Arabia, 1–3 March 2022; pp. 175–180. [Google Scholar]
  9. MORE Alarming Cybersecurity Stats For 2021 ! Available online: https://www.forbes.com/sites/chuckbrooks/2021/10/24/more-alarming-cybersecurity-stats-for-2021-/?sh=4a9c31b24a36 (accessed on 21 February 2022).
  10. Aljabri, M.; Aljameel, S.S.; Mohammad, R.M.A.; Almotiri, S.H.; Mirza, S.; Anis, F.M.; Aboulnour, M.; Alomari, D.M.; Alhamed, D.H.; Altamimi, H.S. Intelligent Techniques for Detecting Network Attacks: Review and Research Directions. Sensors 2021, 21, 7070. [Google Scholar] [CrossRef] [PubMed]
  11. Aljabri, M.; Altamimi, H.S.; Albelali, S.A.; Al-Harbi, M.; Alhuraib, H.T.; Alotaibi, N.K.; Alahmadi, A.A.; Alhaidari, F.; Mohammad, R.M.A.; Salah, K. Detecting Malicious URLs Using Machine Learning Techniques: Review and Research Directions. IEEE Access 2022, 10, 121395–121417. [Google Scholar] [CrossRef]
  12. Alzahrani, R.A.; Aljabri, M. AI-Based Techniques for Ad Click Fraud Detection and Prevention: Review and Research Directions. J. Sens. Actuator Netw. 2023, 12, 4. [Google Scholar] [CrossRef]
  13. The UNSW-NB15 Dataset|UNSW Research. Available online: https://research.unsw.edu.au/projects/unsw-nb15-dataset (accessed on 19 February 2022).
  14. Verma, A.; Ranga, V. Machine Learning Based Intrusion Detection Systems for IoT Applications. Wirel. Pers. Commun. 2020, 111, 2287–2310. [Google Scholar] [CrossRef]
  15. CIDDS—Coburg Intrusion Detection Data Sets: Hochschule Coburg. Available online: https://www.hs-coburg.de/forschung/forschungsprojekte-oeffentlich/informationstechnologie/cidds-coburg-intrusion-detection-data-sets.html (accessed on 19 February 2022).
  16. Datasets|Research|Canadian Institute for Cybersecurity|UNB. Available online: https://www.unb.ca/cic/datasets/index.html (accessed on 19 February 2022).
  17. Khatib, A.; Hamlich, M.; Hamad, D. Machine Learning based Intrusion Detection for Cyber-Security in IoT Networks. E3S Web Conf. 2021, 297, 01057. [Google Scholar] [CrossRef]
  18. Rashid, M.M.; Kamruzzaman, J.; Hassan, M.M.; Imam, T.; Gordon, S. Cyberattacks detection in iot-based smart city applications using machine learning techniques. Int. J. Environ. Res. Public Health 2020, 17, 9347. [Google Scholar] [CrossRef] [PubMed]
  19. Alrashdi, I.; Alqazzaz, A.; Aloufi, E.; Alharthi, R.; Zohdy, M.; Ming, H. AD-IoT: Anomaly detection of IoT cyberattacks in smart city using machine learning. In Proceedings of the 2019 IEEE 9th Annual Computing and Communication Workshop and Conference, CCWC, Las Vegas, NV, USA, 7–9 January 2019; pp. 305–310. [Google Scholar]
  20. Gad, A.R.; Nashat, A.A.; Barkat, T.M. Intrusion Detection System Using Machine Learning for Vehicular Ad Hoc Networks Based on ToN-IoT Dataset. IEEE Access 2021, 9, 142206–142217. [Google Scholar] [CrossRef]
  21. The TON_IoT Datasets|UNSW Research. Available online: https://research.unsw.edu.au/projects/toniot-datasets (accessed on 19 February 2022).
  22. Verma, P.; Dumka, A.; Singh, R.; Ashok, A.; Gehlot, A.; Malik, P.K.; Gaba, G.S.; Hedabou, M. A Novel Intrusion Detection Approach Using Machine Learning Ensemble for IoT Environments. Appl. Sci. 2021, 11, 10268. [Google Scholar] [CrossRef]
  23. IDS 2018|Datasets|Research|Canadian Institute for Cybersecurity|UNB. Available online: https://www.unb.ca/cic/datasets/ids-2018.html (accessed on 21 February 2022).
  24. Arora, P.; Kaur, B.; Teixeira, M.A. Evaluation of Machine Learning Algorithms Used on Attacks Detection in Industrial Control Systems. J. Inst. Eng. India Ser. B 2021, 102, 605–616. [Google Scholar] [CrossRef]
  25. Mothukuri, V.; Khare, P.; Parizi, R.M.; Pouriyeh, S.; Dehghantanha, A.; Srivastava, G. Federated Learning-based Anomaly Detection for IoT Security Attacks. IEEE Internet Things J. 2022, 9, 2545–2554. [Google Scholar] [CrossRef]
  26. Frazão, I.; Abreu, P.H.; Cruz, T.; Araújo, H.; Simões, P. Denial of Service Attacks: Detecting the Frailties of Machine Learning Algorithms in the Classification Process. Lect. Notes Comput. Sci. 2018, 11260, 230–235. [Google Scholar]
  27. Wheelus, C.; Zhu, X. IoT Network Security: Threats, Risks, and a Data-Driven Defense Framework. IoT 2020, 1, 259–285. [Google Scholar] [CrossRef]
Disclaimer/Publisher’s Note: The statements, opinions and data contained in all publications are solely those of the individual author(s) and contributor(s) and not of MDPI and/or the editor(s). MDPI and/or the editor(s) disclaim responsibility for any injury to people or property resulting from any ideas, methods, instructions or products referred to in the content.

Article Metrics

Citations

Article Access Statistics

Multiple requests from the same IP address are counted as one view.