Abstract
Recent advancements in Single-Image Super-Resolution (SISR) have explored the network architecture of deep-learning models to achieve a better perceptual quality of super-resolved images. However, the effect of the objective function, which contributes to improving the performance and perceptual quality of super-resolved images, has not gained much attention. This paper proposes a novel super-resolution architecture called Progressive Multi-Residual Fusion Network (PMRF), which fuses the learning objective functions of and Multi-Scale SSIM in a progressively upsampling framework structure. Specifically, we propose a Residual-in-Residual Dense Blocks (RRDB) architecture on a progressively upsampling platform that reconstructs the high-resolution image during intermediate steps in our super-resolution network. Additionally, the Depth-Wise Bottleneck Projection allows high-frequency information of early network layers to be bypassed through the upsampling modules of the network. Quantitative and qualitative evaluation of benchmark datasets demonstrate that the proposed PMRF super-resolution algorithm with novel fusion objective function ( and MS-SSIM) improves our model’s perceptual quality and accuracy compared to other state-of-the-art models. Moreover, this model demonstrates robustness against noise degradation and achieves an acceptable trade-off between network efficiency and accuracy.
1. Introduction
The image Super-Resolution (SR) problem has been drawing the attention of Internet of Things (IoT) researchers and artificial intelligence (AI) companies for a decade. Due to the restriction on capturing high-resolution images in image-based applications such as the Internet of Things (IoT), the image Super-Resolution (SR) technique is essential in enhancing the visual quality of low-resolution images. An acquired low-resolution image (image/video communications and edge IoT sensors) contains some degradation, such as noise and blur effects. A super-resolution algorithm is required to enlarge the low-resolution image and reconstruct a high-resolution image while reducing the negative effects of the degradation [1,2,3].
Single-Image Super-Resolution (SISR), which considers an ill-posed challenge, is a process of reconstructing a High-Resolution (HR) image from a Low-Resolution (LR) image and effectively improving the quality of captured images. Compared to conventional image-enhancement methods, deep-learning-based image enhancement is used in various computer vision applications such as haze visibility enhancement [4], environment-aware imagery [5] and video [6] for IoT services. In recent years, learning-based algorithms have demonstrated impressive performance compared to conventional SR methods when learning LR-to-HR mapping. In particular, the Convolution Neural Network (CNN) has been trained in a supervised manner to learn the abstract feature representation of the LR patch and a corresponding HR patch. According to this concept, Dong et al. [7] demonstrated a Super-Resolution Convolutional Neural Network (SRCNN) architecture hat learns based on an end-to-end nonlinear mapping from interpolated LR patch to HR patch in a three-layer network. This CNN model significantly improved the SR results regarding Peak Signal-to-Noise Ratio (PSNR) compared to conventional SR algorithms. However, the SRCNN suffered poor perceptual quality, noise amplification effects, and weakness in reconstructing image detail and recovering high-frequency details (tiny edges and lines). To modify the deep-learning-based SR algorithm, researchers have proposed various network architectures and learning strategies such as designing deeper networks, proposing different network topologies, modifying upsampling frameworks, and adopting attention mechanisms.
Following the SRCNN concept, the Very Deep SR network (VDSR) [8] and Deeply Recursive Convolutional Network (DRCN) [9] used pre-upsampling 20-layer network architectures and obtained superior performances over the previous model. The network architectures became deeper by improving the capability of CNN models and learning strategies. Inspired by Residual Net (ResNet) [10], several effective SR architectures [11,12,13,14,15] have used the residual block strategy. Multi-scale Deep Super-Resolution (MDSR) [16] and Enhanced Deep Super-Resolution (EDSR) [16] proposed by Lim et al. are two modified versions of the residual block architecture with a post-upsampling framework that demonstrates significant improvements in reconstructing HR images. MDSR is a deep network with simplified residual blocks, while EDSR architecture is considered a wide network. Although residual block architecture has improved the accuracy and quality of images compared to SRCNN, they suffer some limitations, such as weakness in reconstructing small detail and inaccurate structure reconstruction due to learning difficulties in mapping features in the post-upsampling method.
The first progressive upsampling framework SR model is Laplacian Pyramid Super-Resolution Network (LapSRN) [17]. In this SR model, the HR image is reconstructed using sub-band residuals of a high-dimensional image in a progressive procedure. Although the progressive LapSRN reduced the learning difficulty, the network structure is ineffective in reconstructing high-frequency detail. Weaknesses cause this problem in the projecting of high-frequency information from the early layer.
To improve the SR model’s high-frequency information and representation ability, Zhang et al. [18] proposed a very deep Residual Channel Attention Network (RCAN). Due to the robustness of the residual architecture in the SR field, the RCAN model used deep (over 400 layers) Residual-in-Residual block (RIR) architecture with short- and long-skip connections to directly transfer the high-frequency details of the image to the final output. The Channel Attention (CA) mechanism is also used to re-scale the features across channels. However, this model’s lack of global information due to convolutions operating across the local region leads to weakness in reconstructing the sophisticated structure (holes and lattices texture) similar to the ground-truth image and more enhancement in perceptual quality [19].
However, designing an image super-resolution algorithm with less network complexity, while maintaining the representation ability of the super-resolution model to reconstruct the tiny details of the output image, remains a challenge.
Moreover, most of the enhancements only consider the architecture of SR models, and the effect of the objective function has not gained much attention. In terms of the pixel-wise objective function in the SR algorithm, early models such as SRCNN [7], Fast Super-Resolution Convolutional Neural Network (FSRCNN) [20], Memory Network for image-Restoration purposes (MemNet) [13], and Deep Back-Projection Networks (DBPN) [21] used the loss function. The later SR models, such as LapSRN [17], EDSR [16], SRFBN [22], Meta-RDN [23], RCAN [18], and DRLN [24], used the loss function in their models and improved the model convergence and representation performances.
Although the trend of network depth from the first model of SRCNN [7] to DRLN [24] reveals that increasing the depth (network complexity) eventually leads to improving the network performance, these SR models face some limitations.
(1) The super-resolved images have a weakness in recovering high-frequency information. This limitation leads to reconstructing inaccurate SR images and a lack of capability to produce sophisticated structures such as lines, edges, and tiny shapes. (2) Most existing CNN-based SR models employ post-upsampling operations. Although the post-upsampling framework performs the most computations in a low-dimensional space and reduces the computation complexity, it increases the learning difficulties of the SR model on larger scale factors. (3) Despite the importance of the loss function in reconstructing the SR image, the effect of CNN’s loss function on the SR issue has not received considerable attention. A progressive upsampling architecture with an effective loss function is essential.
A practical way to develop a robust SR network is to use a gradual upsampling framework that contains fewer network layers at low dimensions and then use more convolution layers after the upsampling modules. Rather than using a very deep architecture with a post-upsampling framework that applies numerous convolution layers in low-dimensional space and then suddenly up-sample at the end of the model, we use the progressive upsampling framework. The progressive upsampling concept has been proven to improve the robustness of the SR model in recovering high-frequency information, reducing learning difficulties, and producing promising results in multiple degradations [25]. Specifically, we propose a progressive upsampling framework that stacks effective simplified Residual-in-Residual Dense Blocks (RRDB) at the low-dimensional space before the first upsampling module. Then, another RDB is used after the upsampling layer to explore the feature maps in higher-dimensional space. Additionally, the Depth-Wise (DW) bottleneck projections are used to easily flow the high-frequency details of the early CNN layers into our network’s progressively upsampling modules.
Moreover, a fusing approach for the practical loss function that combines and multi-scale structural similarity indexed measures (MS-SSIM) objective functions is proposed as the most effective loss function for our SR model.
In summary, our main contributions are listed as follows:
(1) Propose a simplified RRDB structure with depth-wise bottleneck projections to map the discriminative high-frequency details to each stage of upsampling layers of our network, which increases the network convergence in the training phase and maintains the representation ability.
(2) Employ the progressive upsampling framework for our architecture to reduce the learning difficulties of the model in larger scale factors due to the progressively upsampling procedure.
(3) Introduce a novel fusion objective function by combining and MS-SSIM loss functions to improve the representative capability of our model.
The remainder of this article is organized as follows. Section 2 briefly reviews the relevant works related to the proposed method. Section 3 details the proposed model’s architecture and fused loss function. The implementation details, datasets, and experimental results are demonstrated in Section 4, and discuss the relationships between state-of-art models and our own. Finally, the conclusion is given in Section 5.
2. Related Works
The past decade has witnessed incredible development of SISR using the deep-learning approach. Among the various aspects of SR developments, the network architecture, upsampling framework, and learning objective function are considered the essential aspects of any SR structure that directly contributes to the SR model representation capability [26].
As pioneer research, Dong et al. [7] used the CNN approach to introduce the SRCNN model, which could learn mapping from LR image to HR image in an end-to-end learning-based approach. This first CNN-based model achieved superior performance in reconstructing HR images from LR images compared to previous conventional SR algorithms. The SRCNN model consists of a shallow three-layer convolutional network that uses a pre-upsampling framework. This means the LR image at the first stage is enlarged by bicubic interpolation, then fed to the network as the input image. This single-path SR model, without any skip connections, directly learns an end-to-end mapping between the original HR image and the bicubic interpolated input. The SRCNN model uses the objective function. Despite improvements to SRCNN compared to classic models, the resultant SR images are blurry and noisy because of using a very shallow network architecture. In comprehensive research, Dong et al. [20] investigated the effect of depth network architecture on the SR model. Although the deeper network improved model performance, the perceptual quality was unsuitable. It required more improvement by modifying the network architecture, upsampling framework, and objective function.
Here, we review related SR research on the network architecture, and different residual connections, upsampling frameworks, and objective functions.
2.1. Network Architecture Review
Followed by SRCNN [7], the SR field has witnessed a variety of network architectures that aim to improve SR model performance and enhance the reconstructed image quality by designing deeper network architectures. Designing deeper architecture makes gradient vanishing an issue during the training of the models. Some strategies, such as residual architectures, are feasible solutions to this limitation. Inspired by the Residual Network (ResNet) concept [10] for image recognition models, a vast range of SR network architectures used residual learning strategy [9,11,13,14,16,18,21,27,28,29,30,31,32]. In contrast to single-path conventional network structures, the residual learning concept uses different variants of residual connections, such as residual projection, and short- and long-skip connections in network architecture to prevent gradient-vanishing problems and make it possible to design an incredibly deep network [10,31].
Since the topology of the residual blocks has a direct effect on the performance of the networks, several structures of the residual blocks, such as residual blocks in PixelCNN [33], projected convolution (PConv) [31], gated convolution blocks in advanced PixelCNN [34], and PixelCNN++ [35] were designed and explored in the deep-learning image-reconstruction models.
Van Oord et al. [34] stacked a three-layer convolutional structure consisting of , , and convolutions with nonlinear activation function. This residual approach (bottleneck) improves computational efficiency, but, because of single branch topology, had a less enhancing effect on model convergence. PixelCNN [33] used two-channel branches to improve the convergence of the model with sigmoid and hyperbolic tangent operations after the first convolution layer, then stacked them to a convolution layer. The convolution layer maintains computational efficiency. However, the hyperbolic tangent technique shows a limitation in mapping various features. Salimans et al. [35] used the idea of PixelCNN, where the hyperbolic tangent branch was replaced by identity mapping. Since the size of the features in this model is constant, mapping the high-frequency detail of the features that improve the reconstruction capability of the SR model is not very effective. The residual projection connection can enhance this limitation.
Fan et al. proposed a progressive residual network in Balanced Two-stage Residual Networks [31] (BTSRN). The feature maps of the low-dimensional stage are upsampled and fed into the higher-dimensional stages with a variant of residual block known as residual projection connection. The residual projection of this SR model consists of a two-layer projected convolution (PConv) structure including convolution layer as feature map projection followed by convolution layer with rectified linear activation function (ReLU). Despite the robustness of the model to reconstruct the high-frequency detail in super-resolved images, the high computation cost is an important issue.
Although studies have shown that deeper CNN architectures lead to superior performance, the drawback of numerous network layers in too deep architecture is an important obstacle to converging networks in training mode. Besides the different training strategies for deep networks, reducing the network layers and computational cost is a feasible solution. Based on the residual block architecture in SR models, Lim et al. proposed the EDSR model [16] by removing unnecessary Batch Normalization (BN) layers of each residual block and the activation functions outside the residual blocks while expanding the depth of network architecture. Although the EDSR model [16] reduced network layers, it has many network parameters and computation costs.
Xiao et al. [36] proposed a lightweight model (LAINet) using a novel residual architecture known as the dual-path residual approach to increase the diversity of the reconstructed features. Specifically, the LAINet [36] model is split into two branches (dual-path residual), and the extracted features are produced according to the different homogeneous functions of each branch. This lightweight model lacks reconstruction capability to recover the edges, due to limitations in combining the hierarchical features in its architecture.
Motivated by the DenseNet [37] architecture in the image classification field, various SR models based on the dense connection concept have been proposed. The main advantage of dense architecture is combining hierarchical features along the entire network to produce richer feature representations. Tong et al. [38] proposed the SRDenseNet model, which used the dense connection between SR network layers. These multiple skip connections improve information flow from low-level features to the high-level layers before final image reconstruction and avoid vanishing-gradient trouble. The Super-Resolution Feedback Network [22] (SRFBN) also used the dense skip connection and feedback projection to enrich the perceptual quality of the SR result.
Followed by the simplified concept of the residual block in the EDSR [16] model and the dense architecture of SEDenseNet [38], Zhang et al. [27] designed an effective Residual Dense Network (RDN) by combining the residual skip connections with dense connections, and proposed a deeper network architecture with a CA mechanism. The residual connection models in RDN are categorized into global and local skip connections. At the local connection, the input of each block is forwarded to all RDB layers and added to the model output. The local fusion approach reduced the dimension by convolution in each RDB. The global connection combines multiple RDB outputs and, via convolution, performs global residual learning in the model. These local and global residual connections improved the results compared to SRDenceNet and helped stabilize the network in training mode. However, it has a convergence issue in training mode that reduces the capability of the model to recover acceptable SR images.
Although the simplified version of the residual block in these models partly decreased the network layers, training such a very deep architecture containing millions of network parameters remains challenging. Due to the effectiveness of the Residual-in-Residual Dense Block (RRDB) structure in terms of the training facilitation and maintaining the perceptual quality of the reconstructed image, several successful models such as ESRGAN [15], RCAN [18], Deformable Non-local Network (DNLN) [39], and Densely Residual Laplacian Network (DRLN) [24] have employed this concept in their networks.
2.2. Upsampling Framework Review
In addition to the network structure, any SR model’s upsampling framework is highly important in generating reconstructed images [26]. Although the existing SR architectures differ broadly, the upsampling framework can be categorized into three main types: pre-upsampling, post-upsampling, and progressive upsampling frameworks, as shown in Figure 1.
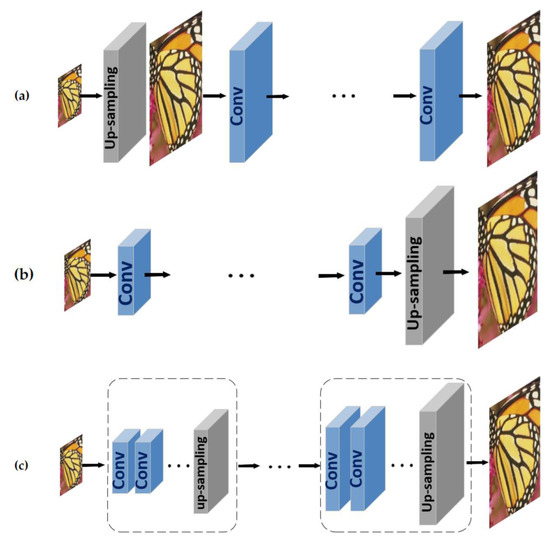
Figure 1.
(a) Pre-upsampling, (b) Post-upsampling, and (c) Progressive upsampling frameworks.
The first and most straightforward upsampling framework is the pre-upsample that Dong et al. [7,20] first adopted with the SRCNN model. As shown in Figure 1a, the LR image is enlarged to a coarse HR image by bicubic interpolation. Then, CNN is applied on coarse HR to refine the reconstructed HR image. However, this predefined up-sample model significantly reduces learning difficulty, increases the computational cost, and often produces blurring and noise amplification results [9,11,12,13,26].
The post-upsampling model is an alternative framework to solve post-upsampling limitations, and FSRCNN [20] is the pioneer of this framework. As shown in Figure 1b, the LR image is fed into the network without increasing the resolution, and most computations are performed in low-dimensional space. Then, at the tail of the network, the up-sample procedure is applied to the image. Using this upsampling approach improves computational efficiency while reducing the spatial complexity of the SR model. However, this framework has been considered to be one of the most mainstream upsampling strategies [14,15,16,24,29,38,40], and it exceeds the learning difficulty of the SR model. As a result of performing upsampling only in one stage at the end of architecture, learning difficulties are increased, especially for larger scaling factors (e.g., 4, 8). Due to the learning difficulties of this upsampling framework, some models such as RCAN [18], SAN [41], and DPAN [42] use the channel attention and non-local attention mechanisms for re-scaling the channel-wise features in low-dimensional space to improve the learning ability of the model [26].
To address the post-processing drawback, a progressive upsampling strategy was employed [17,31,43,44]. The topology of the progressive upsampling framework is demonstrated in Figure 1c.
Specifically, this framework comprises several stages of upsampling based on a cascade approach, and progressively reconstructs HR images to reduce the learning difficulties at larger scale factors. To transfer low-level features into the higher-level layers in the other stages of this framework, the projection connection that considers a variant of residual connection [10] is used [21,22,31,45].
Laplacian pyramid SR network [17] (LapSRN) and balanced two-stage residual network [31] (BTSRN) are the earlier progressive approaches. Other SR models, such as MS-LapSRN [43], Progressive SR (ProSR) [44] and Progressive convolutional Super-resolution [25] (PCSR), also used this framework and achieved higher performance compared to the other upsampling frameworks. The progressive upsampling framework of both LapSRN and MS-LapSRN uses the first image upsampled to the subsequent convolutional modules of the network. At the same time, the ProSR model maintains the main information stream, and the individual convolution branches generate intermediate upsampling. Motivated by the progressive upsampling framework of LapSRN [17], Xiao et al. [25] proposed the PCSR model by applying the dense architecture under the progressive upsampling framework (multi-stage upsampling) for the blind SR model and examined the results with multiple degradations such as blur and noise. PCSR [25] has proven this framework performs promising results in multiple degradations due to the progressive estimation of images’ high-frequency details according to previous stages’ outputs. As well as these three main upsampling frameworks, Haris et al. in D-DBPN [21] and Li et al. in SRFBN [22] used upsampling and downsampling modules in their models, which is supported by deep back-projection connections. The idea behind this iterative up-and-down upsampling framework is to use the mutual dependency of LR and HR pairs to improve the learning ability of the SR model. However, the network complexity in this framework is an important obstacle to having efficient execution time.
2.3. Objective Function Review
The loss function measures the pixel-wise difference (error) between the HR image and the corresponding reconstructed image, and consequently guides SR model optimization. The loss function of the SR model mainly includes loss and loss, which are known as the mean absolute error (MAE) and mean square error (MSE), respectively [46]. Due to the high correlation between pixel-wise loss and PSNR definition, loss function becomes the most broadly used loss function in SR models such as SRCNN [7], DRCN [9], FSRCNN [20], SRResNet [15], MemNet [13], SRDenseNet [38], and DBPN [23] given by
where p shows the pixel’s index and P denotes the patch, and and represent the values of the pixels in the SR patch and the corresponding HR, respectively. Since the penalizes large errors, it properly preserves the sharp edges of the image while showing more tolerance to minor errors, regardless of the underlying structure of the reconstructed image. Although the considers the most broadly applied cost function in the SR field, it suffers from independent Gaussian noise, especially in the smooth regions of the image [26,46].
To improve the limitations, EDSR [16], RDN [27], CARN [30], MSRN [47], RCAN [18], RNAN [48], Meta-RDN [23], SAN [41], SRFBN [22], and DRLN [24] used the loss function. The can be written as
where p is the pixel’s index, P demonstrates the patch, and and denote the values of the pixels in the SR patch and the corresponding HR, respectively. In contrast to the loss function, the does not over-penalize the error and provides less independent noise and a smoother result compared to loss. The weakness of the loss is a relatively slower convergence speed without the residual block. Ahn et al. [30] mitigated the slower convergence speed using a ResNet [10] architecture model.
Although the loss function demonstrates outperforming visually pleasing results over the loss, its result is not optimal. As well as the loss, Lai et al. [17] used a variant of the loss function known as the Charbonnier loss function, given by
where p represents the pixel’s index, P shows the patch and denotes the residual image while and represent the values of the pixels in the SR patch and the corresponding HR, respectively. This variant of the (Charbonnier loss) is not optimal and shows degradation in the edges area of the image [26].
Despite the importance of loss function in the learning process of neural networks, the loss function has attracted less attention in the SR field. Using a type of loss function in the SR model that correlates with the Human Visual System (HVS) improved the reconstructed quality of the image [49]. Some image-restoration learning-based models use MS-SSIM, such as underwater image restoration [50]. The image-dehazing model is not optimal, and successfully increased the performance of their model using this loss function. Since MS-SSIM loss operates based on HVS (luminance, contrast, and structure), it shows a noticeable improvement in the perceptual quality of results in image-restoration models.
3. Proposed Method
In this research, we proposed a novel objective function for a Single-Image Super-Resolution (SISR) model by fusion of MS-SSIM and . In addition, we adopt the progressive upsampling strategy for our network architecture. Moreover, based on the effectiveness of Depth-Wise convolution, we designed a Depth-Wise Bottleneck Projection connection to bypass the high-frequency details of the early layer through the multi-step prediction network, and improve the convergence of the model. In the following section, we describe our model architecture, then explain the details of the proposed fusion objective function to train our SR model as a combination of loss and Multi-Scale SSIM loss (MS-SSIM + ).
As demonstrated in Figure 2, our Progressive Multi-Residual Fusion (PMRF) network consists of the residual dense block (RDB) architecture under a three-stage progressively upsampling framework. At the end of each stage, the image is enlarged by a scale factor of two with the upsampling module. The output of each stage contains high-frequency detail of that stage, and thus it can be propagated to subsequent stages. The progressive prediction based on this approach that uses the generated image of the previous stage produces more accurate SR results. As shown in Figure 2, the multi-level residual dense topology called Residual-in-Residual Dense Blocks (RRDB) is employed in the first stage of our progressively upsampling framework. By contrast, the other stages use the RDB architecture and projection approach to transfer details of the early layer to the upsampling modules at the end of each stage.

Figure 2.
Network architecture with progressive upsampling framework.
3.1. Network Architecture
The residual network demonstrates outstanding performance to obtain high-level features from low-level features, especially in SR problems [11,13,15]. Due to improving the performance and computation costs of the residual network, a combination of residual architecture [16] and dense connections [38] under the three-stage progressively upsampling framework is employed. The combination of the multi-level residual network and the dense connections architecture (RRDB) [15,39] is used in the first stage of our progressive framework model. The residual dense block architecture [27] is applied in the second and third stages, while the Batch Normalization (BN) layers are removed [15]. The BN layer uses the mean and variance for normalizing feature maps during the training and testing phases of the model. In the training phase, BN operates based on the mean and variance of every batch, while in the testing phase, BN performs based on the mean and the variance of the whole training dataset [16]. The problems of unpleasant visual artifacts and inconsistent performance have appeared once the statistics of testing and training datasets are different [51]. The simplified structure of the residual block was introduced to tackle unpleasant visual artifacts and maintain stable training of the SR model.
The simplified structure of the residual network demonstrated in Figure 3 has proven to increase the performance of computer vision tasks such as deblurring and dramatically decreasing the computational complexity and memory usage [15,16,20]. The dense convolutional architecture (DenseNet) [37], aims to connect each layer of the network to every other layer in a feed-forward manner to increase information flow between layers in the network, as illustrated in Figure 4.

Figure 3.
Simplified residual block by remove batch normalization layer.

Figure 4.
The dense block and the simplified residual-in-residual dense block, = 0.2.
The dense convolutional architecture (DenseNet) [37], aims to connect each layer of the network to every other layer in a feed-forward manner, to increase information flow between layers in the network, as illustrated in Figure 4.
This means that the feature maps of all previous layers are used as the inputs in every single layer. Subsequently, the yielded feature maps of each layer are used as inputs into all further layers. According to research evidence [13,21,52], using more network layers and connections led to increasing information flow between layers and, consequently, a superior performance model. Combining the dense block approach and the simplified residual block creates the RDB architecture. Figure 4 shows the multi-level residual dense block network (RRDB) used in the first stage of our upsampling framework. is the scaling parameter of the residual architecture from the range 0 to 1. The residual scaling parameter is multiplied by the residual output before adding to the main block, as demonstrated in Figure 2 and Figure 4. According to previous studies [15,39], = 0.2 is the optimum value for the residual scaling parameter. The pixel shuffle [53] upsampling model is used as the upsampling module at each stage of our progressive upsampling network. According to progressive strategy, using the dense block after the upsampling module in the second and third stages improves our model’s reconstruction capability (multi-step prediction) more effectively due to the use of prior images across scales. However, increasing the size of feature maps after upsampling at each stage unavoidably increases the processing time.
In addition, the Depth-Wise Bottleneck Projection approach, which conveys the high-frequency information of extracted features from the early layer into each upsampling stage, is explained in the next section.
3.2. Residual Bottleneck Projection
The residual block concept has been presented in many CNN-based image SR models [28,30,47,48,53]. The residual concept prevents gradient vanishing in the training phase and makes it feasible to design deeper network architecture. The residual projection is considered to be a variant of a residual block, which changes the dimension of the features. In our architecture, the feature maps of the early layers at the low-dimensional stage are upsampled by the Bicubic interpolation method and fed into the higher-dimensional stages using the residual projection method. Multiple settings of the residual projection blocks are explored and demonstrated in Figure 5, including Residual Projection, Bottleneck Projection, and Depth-Wise Bottleneck Projection.
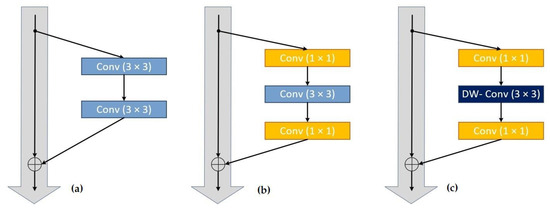
Figure 5.
(a) Residual Projection, (b) Bottleneck Projection, (c) Depth-wise (DW) Bottleneck Projection.
The residual projection architecture [10] consists of two convolutions of size , as demonstrated in Figure 5a, followed by nonlinear activation. The other topology stacks the , , and convolution layers are known as the “bottleneck” building block [10,54] displayed in Figure 5b. The first convolution layer reduces the dimension of the feature map from 256-dimensional to 64-dimensional. The second convolution layer of is used for computation, and ultimately the feature dimension is changed to 256 using the last convolution layer.
Our model uses an efficient bottleneck block structure using the Depth-Wise (DW) convolution layer called a Depth-Wise Bottleneck Projection block. In contrast to normal convolution in the Bottleneck Projection, the DW convolution disentangles spatial interactions such as height and width from the channel interactions [45]. Then, the convolutions are computed over each channel separately, and the result of each separated channel is stacked together [45].
Since projection aims to map the high-frequency information of low-level features to every stage of our progressive framework, the DW Bottleneck Projection method demonstrates a more effective result due to the different channel-wise convolution operations [54]. Moreover, the network convergence of the DW Bottleneck Projection approach is improved compared [55] to the residual projection, and the regular Bottleneck Projection approaches are demonstrated in the results section. As demonstrated in Figure 5c, the first layer contains a convolution layer to reduce the dimensions of the feature map. The dimension reduction of feature maps is known as the bottleneck concept. The second layer includes a Depth-Wise (DW) convolution operation. The main idea behind DW convolution is to replace a normal convolution with a special convolution that aims to implement more effective and lighter filtering by employing a single convolutional operation per each input channel and then stacking them back [45]. The third layer of convolution, known as a point-wise convolution, intends to construct new features via calculating linear combinations of the input channels [21,26,54,55]. The projected features increase the flow of low-level information into progressively upsampling modules and improve the reconstruction capability of the model.
3.3. Objective Function
The objective function measures the pixel-wise difference (error) between the reconstructed patch of the image and the corresponding ground-truth (GT) patch. To compute an error function [26], the loss for a patch P can be mentioned as (4):
where p is the index of pixels and denotes the values of the pixels in the error measurement. To obtain a smoother result for the SR model, the loss function perfumes better than the loss. However, both and losses are correlated inadequately with image quality as perceived by human observation [46]. Using the loss function that correlated independently with HVS is a feasible solution. The sensitivity of HVS depends on the reconstructed image’s local contrast, luminance, and structure [46]. To improve the network learning strategy according to the HVS, which reconstructs the image by attending to contrast, luminance, and structure qualities, the SSIM loss function is suggested.
Let us assume and are two patches of GT and reconstructed SR images, respectively. Then, let and be the mean and variance of x, respectively. The covariance of x and y is assumed to be . Therefore, and can be shown as estimates of the luminance and contrast of x, while measures the tendency of x and y to vary together, and define the structural similarity among x and y. According to [46], the luminance, contrast, and structure evaluations are demonstrated as follows:
, and are small constants defined by:
where L denotes the dynamic range of pixel values ( for 8 bits/pixel images), and and denote two scalar constants and are set to = 0.01 and = 0.03.
According to [56], the general form of the SSIM between GT and SR patches is described as follows:
where , and are parameters to explain the relative importance of these components which are considered to be = = = 1. According to [56] the SSIM index can be written as
where the dependencies of means and standard deviations on pixel p are obtained. The means and standard deviations are calculated using a Gaussian filter by a standard deviation , . Therefore, the SSIM loss function [50] can be mentioned as:
In Equation (10), the SSIM calculation needs to look at pixel neighborhood as large as can support. According to [46], the computation of and its derivatives in some patch regions is impossible. The derivative computation at for any other pixel in a patch can be defined as
where and are the first and second terms of Equation (11) and their derivatives are
and
demonstrates the Gaussian coefficient correlated with pixel q.
As mentioned above, the quality of the reconstructed image (SR) depends on . For instance, the large value of tends to preserve noise at the edge. In contrast, the small value of leads to unpleasant artifacts due to reducing the network’s ability to reconstruct the image’s local structure. Using the multi-scale structure of SSIM (MS-SSIM), which is designed according to a dyadic pyramid of M level resolution, is a feasible solution for the SSIM limitation. Figure 6 illustrates the MS-SSIM diagram. Based on [56] it is defined as
where demonstrates luminance, and demonstrates contrast and similarity. As observed in the diagram, the GT and SR patches are taken as inputs. The low-pass filter and downsample operation by a factor of 2 are applied iteratively on the inputs. The input patches are indexed as the first scale (scale 1), while the highest-order scale is considered to scale M obtained after iterations.
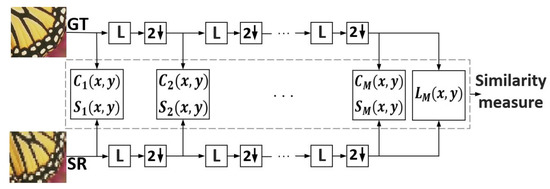
Figure 6.
Block diagram of MS-SSIM.
The diagram and equation show that the luminance comparison is calculated only at scale M, defined as . By contrast, the structure and contrast comparisons are computed at the j-th scale and defined as and , respectively. We set = = 1. According to [46] the final loss for a patch with its center pixel is defined as
Based on [46] the derivative of the MS-SSIM loss function can be described as
However, The MS-SSIM loss produces a smoother SR image compared to the loss, and it also preserves the image’s contrast in high-frequency regions better than the loss function. On the other hand, loss preserves the edges and is very sensitive to indicating sharp intensity changes. To reconstruct the best result of our SR model, the mix of MS-SSIM loss and loss function is proposed:
Point-wise multiplication is applied between and . The best performance of is obtained by setting as 0.8. Experiments with different weight in are demonstrated in the next section.
4. Experiments
The motivation for designing our PMRF model stems from the need to produce the SR image as similarly as possible to the HR image, which can reconstruct detail such as holes and minor lines, content sharpness, and texture diversity.
We conducted several examinations to validate the performance of our SR model. First, we examined the experimental setting of the proposed model. Second, we assessed the effect of different projection approaches in the training phase. Third, we explored the effect of several objective functions on the reconstructed images. The comparison of different in the mix of MS-SSIM loss and loss function is demonstrated in the fourth section. The performance comparison of our model with different projection approaches and objective functions is demonstrated in the fifth section. Moreover, we compared and evaluated our SR images using several selected representative SR methods and comparative analysis. Additionally, we compared our model network parameters and execution time with some selected SR models. Finally, learning difficulty analysis and noise degradation analysis for different objective functions of the proposed model are represented.
4.1. Experimental Setting
This section explains the experimental settings of the datasets used in the training and testing phases, the training details, and the evaluation metrics.
4.1.1. Dataset
We used the DIV2K dataset [57] to train our SR model. The DIV2K dataset contains 800 high-quality (2K resolution) images used for training purposes. In the testing phase, we compared the performance of our model on five benchmark datasets including Set5 [58], Set14 [59], BSD100 [60], Manga109 [61], and Urban100 [62]. Table 1 represents information regarding the training and testing benchmark dataset in this research.

Table 1.
Benchmark datasets for Single-Image Super-Resolution (SISR).
4.1.2. Training Details
In each training batch of our model, random LR patches in RGB mode with a size of 48 × 48 are extracted as the inputs with the corresponding HR patches. The ADAM optimizer [63] with setting of 1 = 0.9, 2 = 0.999, and = is used for training our model. Minibatch size set to 16. Python 3.5 programming language under Keras 2.2.4 framework [64] with TensorFlow 1.5 as the back end was used to implement our SR model, and it was trained on a Titan Xp GPU with 24 GB Memory. The learning rate of our proposed model is set to .
4.1.3. Evaluation Metrics
The PSNR and SSIM [56] evaluations are implemented on the Y channel of transformed YCbCr space to measure the quality of SR results.
4.2. Effects of Projection
The effect of different projection approaches, including Residual Projection, Bottleneck Projection, and Depth-Wise Bottleneck Projection in the training phase of our model, are compared in this section.
Figure 7 and Figure 8 demonstrate the graphs of average training loss and PSNR (dB), respectively, on 800 training epochs under the same training dataset (DIV2K).
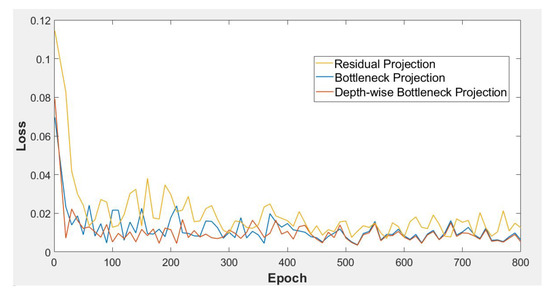
Figure 7.
Average training loss per epoch for training our model with different projection approaches on the DIV2K dataset.
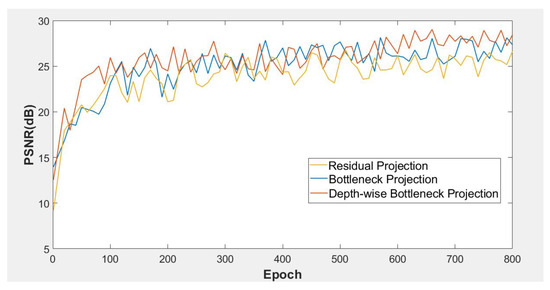
Figure 8.
Average PSNR (dB) per epoch for training our model with different projection approaches on the DIV2K dataset.
As observed in the graphs of Figure 7 and Figure 8, the Bottleneck Projection (blue) and Depth-Wise Bottleneck Projection (red) represent superior convergence performance over the residual projection approach (yellow). Although the performances of Bottleneck Projection and Depth-Wise Bottleneck Projection are almost close together, the Depth-Wise Bottleneck approach demonstrates smoother and better convergence performances in both average losses (Figure 7) and average PSNR (dB) (Figure 8) in the training mode.
4.3. Comparison of Different Objective Functions
The effect of different objective functions, including loss, loss, MS-SSIM loss, + MS-SSIM loss, and + MS-SSIM loss, are compared. The visual compression of our model with different objective functions is shown in Figure 9 and Figure 10. To better visually distinguish the results of these objective functions, we used the images with different textural structures at different scale factors ( scale and scale). The quantitative comparisons of the benchmark datasets among these objective functions at different scales are presented in Table 2, Table 3 and Table 4.
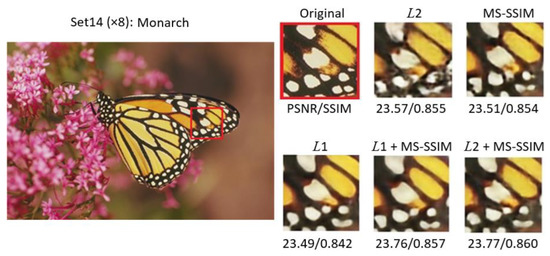
Figure 9.
Visual comparison of different objective functions on the “Monarch” image from the Set14 dataset at scale.
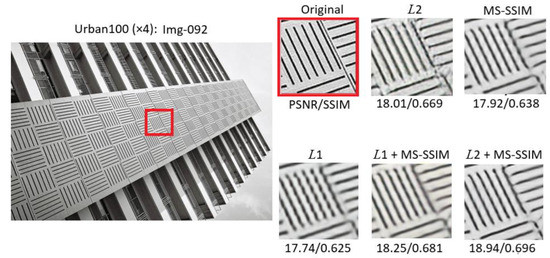
Figure 10.
Visual comparison of different objective functions on Img-092 image from the Urban100 dataset at scale.

Table 2.
Quantitative performance comparison among different objective functions at scale.

Table 3.
Quantitative performance comparison among different objective functions at scale.

Table 4.
Quantitative performance comparison among different objective functions at scale.
Figure 9 displays the results of our SR model with different objective functions on the “Monarch” image from the Set14 [59] dataset at scale. Since the loss function penalizes the smaller error compared to the loss function, the result of is smoother and sharper compared to while the high-frequency details and minor features in the regions connecting the edges vanish. This means that despite the smoothness of the result, it shows weakness in reconstructing the minor details of the image similar to the original image. Although the MS-SSIM result demonstrates a sharper image compared to , and more details than ; it shows weakness in reconstructing the edges equal to the original image. The mix of and MS-SSIM represents more realistic results than the other loss functions. It represents a sharp image while more minor details are preserved around the edges. The PSNR (dB) and SSIM evaluations also demonstrate the superior performance of the proposed loss function.
Figure 10 illustrates the results of our SR model with different objective functions on “Image-92” from the Urban100 [62] dataset at a scale. These results compare the effect of each objective function for reconstructing the vertical and horizontal lines over a constant surface. As observed in Figure 10, the objective function represents better performance for reconstructing vertical and horizontal lines than other non-mixed objective functions. However, the lack of smoothness due to the over-noise amplification (greater error penalized in ) makes it a non-pleasing image. The mixed and MS-SSIM loss function represents the best performance in producing a sharp image, while also detecting all the lines similar to the original image. The PSNR (dB) and SSIM evaluations also demonstrate the best performance compared to the other objective functions.
Comparing the generated results of different objective functions in Figure 9 and Figure 10, the combination of MS-SSIM and demonstrates the best performance in quantitative evaluations and perceptual quality. The MS-SSIM objective function operates based on visible structures of the image (luminance, contrast, and structure), and objective function computes based on more emphasis on the differences between the GT and the SR image. Thus, combining them produces better perceptual quality for the human viewer and more appealing SR results compared to other objective functions.
The quantitative performance comparisons include PSNR (dB) and SSIM on the benchmark datasets of Set5 [58], Set14 [59], BSD100 [60], Urban100 [62] and Manga109 [61] at , and scales, as demonstrated in Table 2, Table 3 and Table 4. The red numbers indicate the best performance, and the blue ones show the second best.
4.4. Comparison of Different in Mix of MS-SSIM Loss and Loss Function
The influence of different weight to fuse of MS-SSIM loss and loss function are compared in this section. The quantitative performance includes PSNR (dB) and SSIM with different weight on the benchmark datasets of Set5 [58], Set14 [59], BSD100 [60], Urban100 [62] and Manga109 [61] at and scales, as shown in Table 5 and Table 6, respectively.

Table 5.
Quantitative performance comparison among different objective functions at scale.

Table 6.
Quantitative performance comparison among different objective functions at scale.
4.5. Performance Comparison of Our Model with Different Objective Functions and Projection Approaches
Table 7 shows the performance investigation of our progressive upsampling SR model (PSNR value at scale four on the Set5 [58] dataset) using different objective functions and different projection approaches.

Table 7.
Quantitative performance of different objective functions and projection approaches on the Set5 [58] dataset at scale.
The DW Bottleneck Projection performs best in mapping the discriminative high-frequency details compared to the Residual and Bottleneck Projection approaches in all objective functions. Additionally, the proposed fused objective function demonstrates noticeable improvement in accuracy compared to the common objective functions ( or ) used in SR models. The best PSNR value (32.70 dB) belongs to the + MS-SSIM objective function and DW Bottleneck Projection.
4.6. Comparison with Other Super-Resolution Methods
Here, we compare our PMRF model method with state-of-the-art SR methods, including the visual and quantitative comparisons at , , and scales. In visual comparison, we compare the results of SRCNN [7], VDSR [8], LapSRN [17], MemNet [13], MS-LapSRN [44], EDSR [16] and RCAN [18] models with our model results at and scales on BSD100 [60], Manga109 [61] and Urban100 [62] datasets.
In Figure 11, we show visual comparisons at scale for image “3096” of the BSD100 [60] dataset. We observe that the compared SR models show weakness in reconstructing the sharp image with small details and suffer blurry artifacts. By contrast, our PMRF model reduces the blurring effect and reconstructs a better perceptual quality image due to the effectiveness of the proposed objective function.
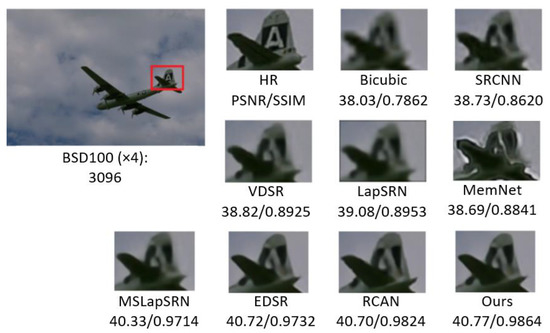
Figure 11.
Visual comparison of image “3096” at scale on the BSD100 dataset.
In Figure 12, we display visual comparisons at scale for the image “GakuenNoise”, which belongs to the Manga109 [61] dataset. Other models show weakness in representing the lattice’s circular shapes. Some models suffer from blurring artifacts, while in RCAN [18] and EDSR [16], the reconstructed lattice shapes are not similar to the original HR image. On the other hand, the result of our PMRF model represents better performance in recovering the circular lattice details due to using the progressive upsampling framework to reconstruct the detail progressively.
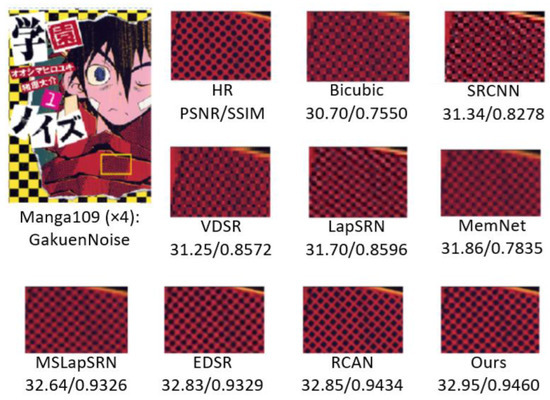
Figure 12.
Visual comparison of image “GakuenNoise” at scale on the Manga109 dataset.
In Figure 13, we demonstrate visual comparisons at scale for image “Img-12”, which belongs to the Urban100 [62] dataset. In contrast to the other SR models, our PMRF model performs better in reconstructing the parallel lines because of its robustness in mapping the high-frequency detail (edges and lines).
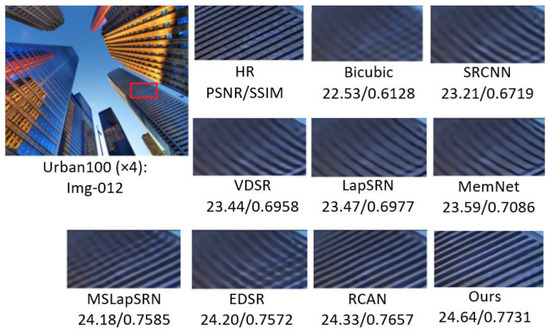
Figure 13.
Visual comparison of image “Img-012” at scale on the Urban100 dataset.
Figure 14 compares other SR results on image “302008” of the BSD100 [60] dataset. Due to the large scale factor, the Bicubic method’s result has lost the HR image’s correct structure. Reconstructing the wrong structure because of a very large scale factor also occurs in some other models such as SRCNN [7], VDSR [8] and LapSRN [17]. Our PMRF model performs better in recovering the original structure of black lines than the other state-of-the-art models, which lack smoothness, blurring artifacts, and the capability to recover tiny line connections. Notably, by reducing the learning difficulties in a progressively upsampling procedure, our model and MS-LapSRN [44] effectively recover the edge detail.
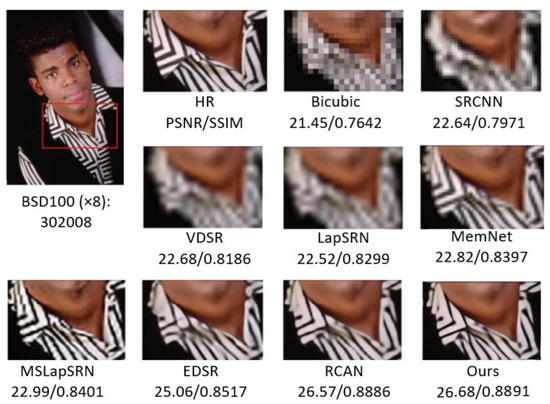
Figure 14.
Visual comparison of image “302008” at scale on the BSD100 dataset.
Figure 15 shows visual comparisons at scale for image “Img-096”, which belongs to the Urban100 [62] dataset. The progressive upsampling framework-based models such as LapSRN [17] and MS-LapSRN [44] show robustness in reconstructing the parallel lines at this large scale factor. However, these models demonstrate a lack of smoothness. Although the RCAN [18] model recovered the parallel lines, it did not produce a sharp result. This weakness in RCAN [18] is caused by a lack of global information in the CA mechanism that shows quality degradation on larger scales. The proposed progressive model outperforms the SR image in recovering parallel lines more effectively without blur and halo effect around the lines due to the effectiveness of the proposed fused objective function and multi-stage enlarging.
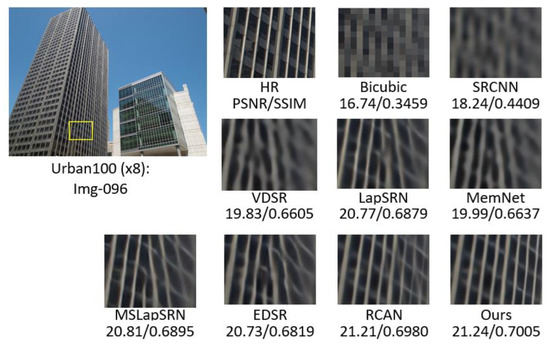
Figure 15.
Visual comparison of image “Img-096” at scale on the Urban100 dataset.
The quantitative results comparison using PSNR (dB) and SSIM evaluations at , , and scales on Set5 [58], Set14 [59], BSD100 [60], Manga109 [61], and Urban100 [62] datasets are illustrated in Table 8, Table 9 and Table 10. For the quantitative comparisons, we used 11 state-of-the-art models including Bicubic, SRCNN [7], FSRCNN [20], VDSR [8], LapSRN [17], MemNet [13], EDSR [16], SRMDNF [65], D-DBPN [21], PAN [66], LAINet [36], RDN [27] and SRFBN [22]. The results of other models are cited from their papers. The red numbers indicate the best performance, and the blue ones demonstrate the second best.

Table 8.
Quantitative benchmark test results at scale. Red indicates the best performance and blue indicates the second best.

Table 9.
Quantitative benchmark test results at scale. Red indicates the best performance and blue indicates the second best.

Table 10.
Quantitative benchmark test results at scale. Red indicates the best performance and blue indicates the second best.
In contrast to scale in Table 9 and scale in Table 10, our results at scale shown in Table 8 are slightly less than RDN [27] and SRFBN-S [22]. Since our model has the progressive upsampling framework, scale factor acts similar to a post-upsampling framework, although it has less network depth than the other post-upsampling-based models at this scale.
Compared with other SR models at and scales, our PMRF shows the best PSNR (dB) and SSIM results in all examined datasets. These results indicate that our progressive upsampling framework with the proposed fused objective function represents superior performance over the other SR models at larger scale factors ( and ). The comparisons of network parameters and the execution time are demonstrated in the following section.
4.7. Comparative Analysis
The performance of the SR model is evaluated using objective measures including PSNR and SSIM. In comparative analysis, we compare the performance of our proposed model with different state-of-the-art algorithms, including over five benchmark datasets (Set5 [58], Set14 [59], BSD100 [60], Manga109 [61], and Urban100 [62]) at and scales. Figure 16 and Figure 17 compare PSNR and SSIM at scale over five benchmark datasets, respectively. The proposed model (PMRF) is the most effective SR model regarding the PSNR and SSIM of the super-resolved images on all benchmark datasets compared to SRFBN-S [22], RDN [27], SRMDNF [65], EDSR [16], and SRCNN [7]. The best improvements compared to the other models regarding PSNR and SSIM belong to the performance of our model on the Urban100 dataset. Compared to the SRFBN-S model, our model (PMRF) improved by 0.28 dB of PSNR and around 0.01 of the SSIM. Figure 18 and Figure 19 compare PSNR and SSIM at scale over five benchmark datasets, respectively. According to the bar graphs, the most effective SR model on all benchmark datasets compared to D-DBPN [21], RDN [27], SRMDNF [65], EDSR [16], and SRCNN [7]. Only the PSNR of RDN model on the Set14 dataset is 0.01 dB more than our model. However, regarding SSIM, our model shows robustness compared to the other models.
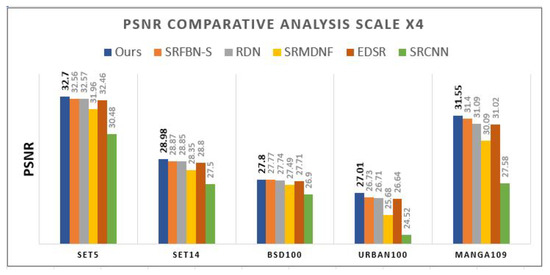
Figure 16.
PSNRcomparison at scale.
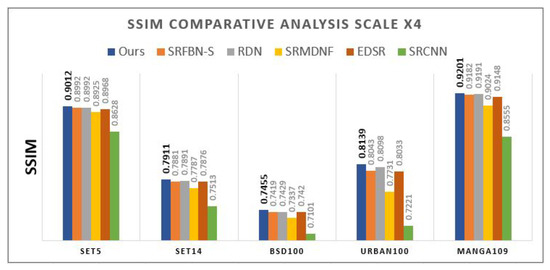
Figure 17.
SSIM comparison at scale.
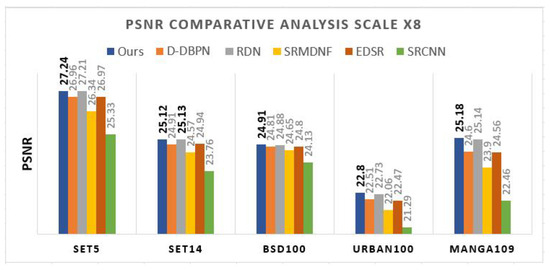
Figure 18.
PSNRcomparison at scale.
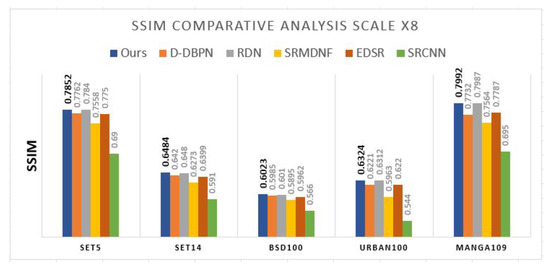
Figure 19.
SSIMcomparison at scale.
4.8. Model Size Analysis
We represent comparisons of model size and performance in this section. For these comparisons, we used nine state-of-the-art models including SRCNN [7], FSRCNN [20], VDSR [8], LapSRN [17], MemNet [13], EDSR [16], D-DBPN [21], MDSR [16] and RCAN [18]. These models have been implemented on a Titan Xp GPU with 24 GB Memory.
Figure 20 compares the performance and number of parameters on the Set5 [58] dataset at a scale of .
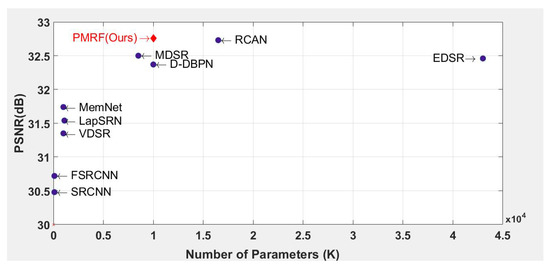
Figure 20.
Performance and number of parameters evaluated on the Set5 dataset at scale.
According to this graph, our PMRF model gains the highest PSNR (32.7 dB), and the number of parameters in our model is less than the RCAN [18] model as the second-best PSNR on this scale. Our model with a progressive upsampling framework and the proposed fused objective function archives acceptable trade-offs between accuracy and parameter efficiency.
Figure 21 compares the performance and the execution time on the Set5 [58] dataset. According to this graph, our PMRF model gains the highest PSNR (32.7 dB) while its execution time is faster than EDSR [16], RCAN [18], MDSR [16], and MemNet [13].
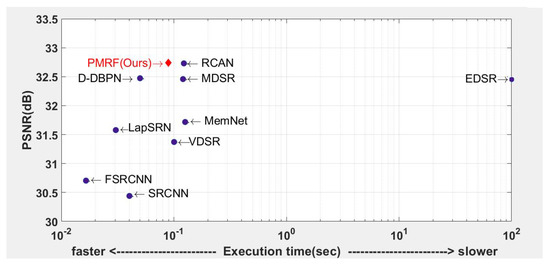
Figure 21.
Performance and execution time evaluated on the Set5 dataset at scale.
4.9. Learning Difficulty Analysis
The effect of the upsampling framework on the learning difficulty of the SR model is demonstrated in this section. Figure 22 shows the average PSNR (dB) per epoch in the training of our SR model with progressive upsampling and post-upsampling frameworks. To compare fairly, we trained both models under the same hyperparameters. As observed in the graphs of Figure 22, the progressive upsampling (blue) represents superior convergence performance compared to the post-upsampling (red) framework. According to the figure, the PSNR of the progressive upsampling (blue) graph at the initial stage of training is higher than the red one and grows rapidly with fewer fluctuations compared to the red graph.
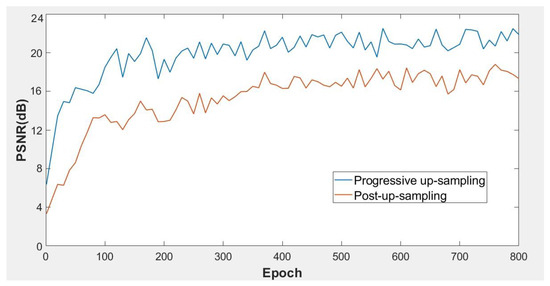
Figure 22.
Comparison of the convergence of progressive upsampling and post-upsampling framework at scale.
4.10. Noise Degradation Analysis
The evaluation of different objective functions including , , MS-SSIM, + MS-SSIM and + MS-SSIM on the degradation image of the Set14 [59] dataset is shown in Table 11. The Gaussian degradation with a kernel size of 0.5 and noise level of 15 is used for this evaluation. The red numbers indicate the best performance, and the blue ones demonstrate the second best.

Table 11.
Quantitative evaluation of different objective functions with noise degradation (kernel with = 0.5 and noise level = 15) for the Set14 dataset at scale.
The performance of and objective functions (PSNR and SSIM) are weaker than MS-SSIM and the combinations of MS-SSIM with and . Due to the greater sensitivity of to noise, it shows the weakest performance. The best performances belong to the fusion objective function approaches. The highest PSNR and SSIM of MS-SSIM with demonstrate the robustness of the proposed fusion objective function against noise degradation.
The list of abbreviations used in this article is tabulated in Table 12.

Table 12.
List of abbreviations used in this article.
5. Conclusions
This research proposes a novel fusion objective function by fusing and Multi-Scale SSIM loss function for the single-image super-resolution model to improve the accuracy and perceptual quality of the resultant images. Moreover, we designed a novel Progressive Multi-Residual architecture (PMRF) that uses Residual-in-Residual Dense Blocks (RRDB) under the progressive upsampling framework. Additionally, the Depth-Wise (DW) Bottleneck Projection approach was applied to bypass the high-frequency components of the early layer features in every stage of the upsampling module, which led to an increase in the training convergence of our model. Quantitative and qualitative evaluations were conducted on five benchmark datasets (Set5, Set14, BSD100, Urban100, and Manga109) at , , and scales. The proposed fused objective function ( and MS-SSIM) improved perceptual quality and accuracy (PSNR/SSIM). Additionally, the fused objective function demonstrates noticeable robustness against noise degradation compared to the conventional objective functions ( and ). The proposed Depth-Wise Bottleneck Projection improved the convergence of our model by mapping high-frequency detail to each stage of upsampling. Due to the progressive estimation of high-frequency components of images based on the outputs of previous stages in our progressive framework, the learning difficulty of the model is reduced, and the resultant images show effectiveness in recovering complex textures. Moreover, the experiments into execution time and the number of parameters reveal an acceptable trade-off between parameter efficiency and accuracy. The performance of the proposed model at scale is slightly less than two other models (RDN and SRFBN-S). At this scale, the progressive framework acts similarly to a post-upsampling framework, and it has network depth compared to other post-upsampling models.
In the future, we would like to implement our proposed SR model in the real-time application of high-definition video and explore the super-resolution model in larger scale factors in real-time image and video communications in edge IoT devices. The proposed SR algorithm is helpful in image-based smart IoT ecosystems, and in video and image communication systems to enhance the perceptual quality of the captured images and video frames in real-time applications.
Author Contributions
Conceptualization, A.H. and S.A.; methodology, A.H.; software, A.H.; validation, A.H.; formal analysis, A.H.; investigation, A.H.; resources, S.A.; data curation, A.H.; writing—original draft preparation, A.H.; writing—review and editing, S.A.; visualization, A.H.; supervision, S.A.; project administration, S.A.; funding acquisition, S.A. All authors have read and agreed to the published version of the manuscript.
Funding
This research is funded by the Graduate School of Chulalongkorn University scholarship from “The 100th Anniversary Chulalongkorn University for Doctoral Scholarship” and “The 90th Anniversary of Chulalongkorn University Fund (Ratchadaphiseksomphot Endowment Fund)” and “Thailand Science research and Innovation Fund Chulalongkorn University (CU_FRB65 _ind (9) _157_21_23)” and The NSRF via the Program Management Unit for Human Resources & Institutional Development, Research and Innovation [grant number B04G640053] and Thailand Science research and Innovation Fund Chulalongkorn University (IND66210019).
Institutional Review Board Statement
Not applicable.
Informed Consent Statement
Not applicable.
Data Availability Statement
Training dataset used in this study is available at https://cv.snu.ac.kr/research/EDSR/DIV2K.tar, accessed on 17 February 2023.
Conflicts of Interest
The authors declare no conflict of interest.
References
- Benbarrad, T.; Salhaoui, M.; Kenitar, S.B.; Arioua, M. Intelligent machine vision model for defective product inspection based on machine learning. J. Sens. Actuator Netw. 2021, 10, 7. [Google Scholar] [CrossRef]
- Salcedo, E.; Jaber, M.; Carrión, J.R. A novel road maintenance prioritisation system based on computer vision and crowdsourced reporting. J. Sens. Actuator Netw. 2022, 11, 15. [Google Scholar] [CrossRef]
- Muthukrishnan, A.; Kumar, D.V.; Kanagaraj, M. Internet of image things-discrete wavelet transform and Gabor wavelet transform based image enhancement resolution technique for IoT satellite applications. Cogn. Syst. Res. 2019, 57, 46–53. [Google Scholar] [CrossRef]
- Liu, R.W.; Guo, Y.; Lu, Y.; Chui, K.T.; Gupta, B.B. Deep Network-Enabled Haze Visibility Enhancement for Visual IoT-Driven Intelligent Transportation Systems. IEEE Trans. Ind. Inform. 2022, 19, 1581–1591. [Google Scholar] [CrossRef]
- Chiu, S.T.; Lu, C.H. Sequentially Environment-Aware and Recursive Multiscene Image Enhancement for IoT-Enabled Smart Services. IEEE Syst. J. 2022, 16, 6130–6141. [Google Scholar] [CrossRef]
- Lu, C.H.; Fan, G.Y. Environment-aware dense video captioning for IoT-enabled edge cameras. IEEE Internet Things J. 2021, 9, 4554–4564. [Google Scholar] [CrossRef]
- Dong, C.; Loy, C.C.; He, K.; Tang, X. Learning a deep convolutional network for image super-resolution. In Proceedings of the European Conference Computer Vision–ECCV, Zurich, Switzerland, 6–12 September 2014; pp. 184–199. [Google Scholar]
- Kim, J.; Lee, J.K.; Lee, K.M. Accurate image super-resolution using very deep convolutional networks. In Proceedings of the IEEE Conference on Computer Vision and Pattern Recognition, Las Vegas, NV, USA, 27–30 June 2016; pp. 1646–1654. [Google Scholar]
- Kim, J.; Lee, J.K.; Lee, K.M. Deeply-recursive convolutional network for image super-resolution. In Proceedings of the IEEE Conference on Computer Vision and Pattern Recognition, Las Vegas, NV, USA, 7–30 June 2016; pp. 1637–1645. [Google Scholar]
- He, K.; Zhang, X.; Ren, S.; Sun, J. Deep residual learning for image recognition. In Proceedings of the IEEE Conference on Computer Vision and Pattern Recognition, Las Vegas, NV, USA, 27–30 June 2016; pp. 770–778. [Google Scholar]
- Tai, Y.; Yang, J.; Liu, X. Image super-resolution via deep recursive residual network. In Proceedings of the IEEE Conference on Computer Vision and Pattern Recognition, Honolulu, HI, USA, 21–26 July 2017; pp. 3147–3155. [Google Scholar]
- Sajjadi, M.S.; Scholkopf, B.; Hirsch, M. Enhancenet: Single image super-resolution through automated texture synthesis. In Proceedings of the IEEE International Conference on Computer Vision, Venice, Italy, 22–29 October 2017; pp. 4491–4500. [Google Scholar]
- Tai, Y.; Yang, J.; Liu, X.; Xu, C. Memnet: A persistent memory network for image restoration. In Proceedings of the IEEE International Conference on Computer Vision, Venice, Italy, 22–29 October 2017; pp. 4539–4547. [Google Scholar]
- Ledig, C.; Theis, L.; Huszár, F.; Caballero, J.; Cunningham, A.; Acosta, A.; Aitken, A.; Tejani, A.; Totz, J.; Wang, Z.; et al. Photo-realistic single image super-resolution using a generative adversarial network. In Proceedings of the IEEE Conference on Computer Vision and Pattern Recognition, Honolulu, HI, USA, 21–26 July 2017; pp. 4681–4690. [Google Scholar]
- Wang, X.; Yu, K.; Wu, S.; Gu, J.; Liu, Y.; Dong, C.; Qiao, Y.; Change Loy, C. Esrgan: Enhanced super-resolution generative adversarial networks. In Proceedings of the European Conference on Computer Vision (ECCV) Workshops, Munich, Germany, 8–14 September 2018. [Google Scholar]
- Lim, B.; Son, S.; Kim, H.; Nah, S.; Mu Lee, K. Enhanced deep residual networks for single image super-resolution. In Proceedings of the IEEE Conference on Computer Vision and Pattern Recognition Workshops, Honolulu, HI, USA, 21–26 July 2017; pp. 136–144. [Google Scholar]
- Lai, W.S.; Huang, J.B.; Ahuja, N.; Yang, M.H. Deep laplacian pyramid networks for fast and accurate super-resolution. In Proceedings of the IEEE Conference on Computer Vision and Pattern Recognition, Honolulu, HI, USA, 21–26 July 2017; pp. 624–632. [Google Scholar]
- Zhang, Y.; Li, K.; Li, K.; Wang, L.; Zhong, B.; Fu, Y. Image super-resolution using very deep residual channel attention networks. In Proceedings of the European Conference on Computer Vision (ECCV), Munich, Germany, 8–14 September 2018; pp. 286–301. [Google Scholar]
- Lin, Z.; Garg, P.; Banerjee, A.; Magid, S.A.; Sun, D.; Zhang, Y.; Van Gool, L.; Wei, D.; Pfister, H. Revisiting rcan: Improved training for image super-resolution. arXiv 2022, arXiv:2201.11279. [Google Scholar]
- Dong, C.; Loy, C.C.; Tang, X. Accelerating the super-resolution convolutional neural network. In Proceedings of the European Conference on Computer Vision (ECCV), Amsterdam, The Netherlands, 11–14 October 2016; pp. 391–407. [Google Scholar]
- Haris, M.; Shakhnarovich, G.; Ukita, N. Deep back-projection networks for super-resolution. In Proceedings of the IEEE Conference on Computer Vision and Pattern Recognition, Honolulu, HI, USA, 21–26 July 2017; pp. 1664–1673. [Google Scholar]
- Li, Z.; Yang, J.; Liu, Z.; Yang, X.; Jeon, G.; Wu, W. Feedback network for image super-resolution. In Proceedings of the IEEE/CVF Conference on Computer Vision and Pattern Recognition, Long Beach, CA, USA, 16–17 June 2019; pp. 3867–3876. [Google Scholar]
- Hu, X.; Mu, H.; Zhang, X.; Wang, Z.; Tan, T.; Sun, J. Meta-SR: A magnification-arbitrary network for super-resolution. In Proceedings of the IEEE/CVF Conference on Computer Vision and Pattern Recognition, Long Beach, CA, USA, 15–20 June 2019; pp. 1575–1584. [Google Scholar]
- Anwar, S.; Barnes, N. Densely residual laplacian super-resolution. IEEE Trans. Pattern Anal. Mach. Intell. 2020, 44, 1192–1204. [Google Scholar] [CrossRef]
- Xiao, J.; Zhao, R.; Lai, S.C.; Jia, W.; Lam, K.M. Deep progressive convolutional neural network for blind super-resolution with multiple degradations. In Proceedings of the 2019 IEEE International Conference on Image Processing (ICIP), Taipei, Taiwan, 22–25 September 2019; pp. 2856–2860. [Google Scholar]
- Wang, Z.; Chen, J.; Hoi, S.C. Deep learning for image super-resolution: A survey. IEEE Trans. Pattern Anal. Mach. Intell. 2020, 43, 3365–3387. [Google Scholar] [CrossRef]
- Zhang, Y.; Tian, Y.; Kong, Y.; Zhong, B.; Fu, Y. Residual dense network for image super-resolution. In Proceedings of the IEEE Conference on Computer Vision and Pattern Recognition, Salt Lake City, UT, USA, 18–22 June 2018; pp. 2472–2481. [Google Scholar]
- Szegedy, C.; Ioffe, S.; Vanhoucke, V.; Alemi, A. Inception-v4, inception-resnet and the impact of residual connections on learning. In Proceedings of the AAAI Conference on Artificial Intelligence, New York, NY, USA, 12 February 2017; Volume 31. [Google Scholar]
- Muhammad, W.; Aramvith, S. Multi-scale inception based super-resolution using deep learning approach. Electronics 2019, 8, 892. [Google Scholar] [CrossRef]
- Ahn, N.; Kang, B.; Sohn, K.-A. Fast, accurate, and lightweight super-resolution with cascading residual network. In Proceedings of the European Conference on Computer Vision (ECCV), Munich, Germany, 8–14 September 2018; pp. 252–268. [Google Scholar]
- Fan, Y.; Shi, H.; Yu, J.; Liu, D.; Han, W.; Yu, H.; Wang, Z.; Wang, X.; Huang, T.S. Balanced two-stage residual networks for image super-resolution. In Proceedings of the IEEE Conference on Computer Vision and Pattern Recognition Workshops, Honolulu, HI, USA, 21–26 July 2017; pp. 161–168. [Google Scholar]
- Mei, Y.; Fan, Y.; Zhou, Y. Image super-resolution with non-local sparse attention. In Proceedings of the IEEE/CVF Conference on Computer Vision and Pattern Recognition, Nashville, TN, USA, 20–25 June 2021; pp. 3517–3526. [Google Scholar]
- Van Oord, A.; Kalchbrenner, N.; Kavukcuoglu, K. Pixel recurrent neural networks. In Proceedings of the International Conference on Machine Learning, New York, NY, USA, 19–24 June 2016; pp. 1747–1756. [Google Scholar]
- Van den Oord, A.; Kalchbrenner, N.; Espeholt, L.; Vinyals, O.; Graves, A. Conditional image generation with pixelcnn decoders. In Proceedings of the Neural Information Processing Systems (NIPS), Barcelona, Spain, 9 December 2017; pp. 29–38. [Google Scholar]
- Salimans, T.; Karpathy, A.; Chen, X.; Kingma, D.P. Pixelcnn++: Improving the pixelcnn with discretized logistic mixture likelihood and other modifications. arXiv 2017, arXiv:1701.05517. [Google Scholar]
- Xiao, J.; Ye, Q.; Zhao, R.; Lam, K.M.; Wan, K. Self-feature learning: An efficient deep lightweight network for image super-resolution. In Proceedings of the 29th ACM International Conference on Multimedia, Dublin, Ireland, 26–29 October 2020; pp. 4408–4416. [Google Scholar]
- Huang, G.; Liu, Z.; Van Der Maaten, L.; Weinberger, K.Q. Densely connected convolutional networks. In Proceedings of the IEEE Conference on Computer Vision and Pattern Recognition, Honolulu, HI, USA, 21–26 July 2017; pp. 4700–4708. [Google Scholar]
- Tong, T.; Li, G.; Liu, X.; Gao, Q. Image super-resolution using dense skip connections. In Proceedings of the IEEE International Conference on Computer Vision, Venice, Italy, 22–29 October 2017; pp. 4799–4807. [Google Scholar]
- Wang, H.; Su, D.; Liu, C.; Jin, L.; Sun, X.; Peng, X. Deformable non-local network for video super-resolution. IEEE Access 2019, 7, 177734–177744. [Google Scholar] [CrossRef]
- Lee, Y.; Jun, D.; Kim, B.G.; Lee, H. Enhanced single image super resolution method using lightweight multi-scale channel dense network. Sensors 2021, 21, 3551. [Google Scholar] [CrossRef]
- Dai, T.; Cai, J.; Zhang, Y.; Xia, S.T.; Zhang, L. Second-order attention network for single image super-resolution. In Proceedings of the IEEE/CVF Conference on Computer Vision and Pattern Recognition, Long Beach, CA, USA, 16–17 June 2019; pp. 11065–11074. [Google Scholar]
- Huang, Z.; Li, W.; Li, J.; Zhou, D. Dual-path attention network for single image super-resolution. Expert Syst. Appl. 2021, 169, 114450. [Google Scholar] [CrossRef]
- Wang, Y.; Perazzi, F.; McWilliams, B.; Sorkine-Hornung, A.; Sorkine-Hornung, O.; Schroers, C. A fully progressive approach to single-image super-resolution. In Proceedings of the IEEE Conference on Computer Vision and Pattern Recognition Workshops, Salt Lake City, UT, USA, 18–22 June 2018; pp. 864–873. [Google Scholar]
- Lai, W.S.; Huang, J.B.; Ahuja, N.; Yang, M.H. Fast and accurate image super-resolution with deep laplacian pyramid networks. IEEE Trans. Pattern Anal. Mach. Intell. 2018, 41, 2599–2613. [Google Scholar] [CrossRef] [PubMed]
- Chollet, F. Xception: Deep learning with depthwise separable convolutions. In Proceedings of the IEEE Conference on Computer Vision and Pattern Recognition, Honolulu, HI, USA, 21–26 July 2017; pp. 1251–1258. [Google Scholar]
- Zhao, H.; Gallo, O.; Frosio, I.; Kautz, J. Loss functions for image restoration with neural networks. IEEE Trans. Comput. Imaging 2018, 3, 47–57. [Google Scholar] [CrossRef]
- Li, J.; Fang, F.; Mei, K.; Zhang, G. Multi-scale residual network for image super-resolution. In Proceedings of the European Conference on Computer Vision (ECCV), Munich, Germany, 8–14 September 2018; pp. 517–532. [Google Scholar]
- Zhang, Y.; Li, K.; Li, K.; Zhong, B.; Fu, Y. Residual non-local attention networks for image restoration. arXiv 2019, arXiv:1903.10082. [Google Scholar]
- Zhang, L.; Zhang, L.; Mou, X.; Zhang, D. A comprehensive evaluation of full reference image quality assessment algorithms. In Proceedings of the 19th IEEE International Conference on Image Processing, Orlando, FL, USA, 30 September–3 October 2012; pp. 1477–1480. [Google Scholar]
- Lu, J.; Li, N.; Zhang, S.; Yu, Z.; Zheng, H.; Zheng, B. Multi-scale adversarial network for underwater image restoration. Opt. Laser Technol. 2019, 110, 105–113. [Google Scholar] [CrossRef]
- Nah, S.; Hyun Kim, T.; Mu Lee, K. Deep multi-scale convolutional neural network for dynamic scene deblurring. In Proceedings of the IEEE Conference on Computer Vision and Pattern Recognition, Honolulu, HI, USA, 21–26 July 2017; pp. 3883–3891. [Google Scholar]
- Duanmu, C.; Zhu, J. The image super-resolution algorithm based on the dense space attention network. IEEE Access 2020, 8, 140599–140606. [Google Scholar] [CrossRef]
- Shi, W.; Caballero, J.; Huszár, F.; Totz, J.; Aitken, A.P.; Bishop, R.; Rueckert, D.; Wang, Z. Real-time single image and video super-resolution using an efficient sub-pixel convolutional neural network. In Proceedings of the IEEE Conference on Computer Vision and Pattern Recognition, Las Vegas, NV, USA, 27–30 June 2016; pp. 1874–1883. [Google Scholar]
- Muhammad, W.; Aramvith, S.; Onoye, T. Multi-scale Xception based depthwise separable convolution for single image super-resolution. PLoS ONE 2021, 16, e0249278. [Google Scholar] [CrossRef]
- Sandler, M.; Howard, A.; Zhu, M.; Zhmoginov, A.; Chen, L.C. Mobilenetv2: Inverted residuals and linear bottlenecks. In Proceedings of the IEEE conference on Computer Vision and Pattern Recognition, Salt Lake City, UT, USA, 18–22 June 2018; pp. 4510–4520. [Google Scholar]
- Wang, Z.; Simoncelli, E.P.; Bovik, A.C. November. Multiscale structural similarity for image quality assessment. In In Proceedings of the Thrity-Seventh Asilomar Conference on Signals, Systems and Computers, Pacific Grove, CA, USA, 9–12 November 2003; Volume 2, pp. 1398–1402. [Google Scholar]
- Agustsson, E.; Timofte, R. Ntire 2017 challenge on single image super-resolution: Dataset and study. In Proceedings of the IEEE Conference on Computer Vision and Pattern Recognition Workshops, Honolulu, HI, USA, 21–26 July 2017; pp. 126–135. [Google Scholar]
- Bevilacqua, M.; Roumy, A.; Guillemot, C.; Alberi-Morel, M.L. Low-complexity single-image super-resolution based on nonnegative neighbor embedding. In Proceedings of the 23rd British Machine Vision Conference (BMVC), Surrey, UK, 3–7 September 2012; pp. 135–142. [Google Scholar]
- Zeyde, R.; Elad, M.; Protter, M. On single image scale-up using sparse-representations. In Proceedings of the International Conference on Curves and Surfaces, Avignon, France, 24–30 June 2010; pp. 711–730. [Google Scholar]
- Martin, D.; Fowlkes, C.; Tal, D.; Malik, J. A database of human segmented natural images and its application to evaluating segmentation algorithms and measuring ecological statistics. In Proceedings of the Eighth International Conference on Computer Vision (ICCV-01), Vancouver, BC, Canada, 7–14 July 2001; pp. 416–423. [Google Scholar]
- Matsui, Y.; Ito, K.; Aramaki, Y.; Fujimoto, A.; Ogawa, T.; Yamasaki, T.; Aizawa, K. Sketch-based manga retrieval using manga109 dataset. Multimed. Tools Appl. 2017, 76, 21811–21838. [Google Scholar] [CrossRef]
- Huang, J.B.; Singh, A.; Ahuja, N. Single image super-resolution from transformed self-exemplars. In Proceedings of the IEEE Conference on Computer Vision and Pattern Recognition, Boston, MA, USA, 7–12 June 2015; pp. 5197–5206. [Google Scholar]
- Kingma, D.P.; Ba, J. Adam: A method for stochastic optimization. arXiv 2014, arXiv:1412.6980. [Google Scholar]
- Chollet, F. Keras: The Python Deep Learning Library. Available online: https://keras.io/ (accessed on 6 August 2019).
- Zhang, K.; Zuo, W.; Zhang, L. Learning a single convolutional super-resolution network for multiple degradations. In Proceedings of the IEEE Conference on Computer Vision and Pattern Recognition, Long Beach, CA, USA, 16–17 June 2019; pp. 3262–3271. [Google Scholar]
- Zhao, H.; Kong, X.; He, J.; Qiao, Y.; Dong, C. Efficient image super-resolution using pixel attention. In Proceedings of the European Conference Computer Vision–ECCV Workshops, Glasgow, UK, 23–28 August 2020; pp. 56–72. [Google Scholar]
- Wang, C.; Li, Z.; Shi, J. Lightweight image super-resolution with adaptive weighted learning network. arXiv 2019, arXiv:1904.02358. [Google Scholar]
Disclaimer/Publisher’s Note: The statements, opinions and data contained in all publications are solely those of the individual author(s) and contributor(s) and not of MDPI and/or the editor(s). MDPI and/or the editor(s) disclaim responsibility for any injury to people or property resulting from any ideas, methods, instructions or products referred to in the content. |
© 2023 by the authors. Licensee MDPI, Basel, Switzerland. This article is an open access article distributed under the terms and conditions of the Creative Commons Attribution (CC BY) license (https://creativecommons.org/licenses/by/4.0/).