Article

Photorespiration Enhances Acidification of the Thylakoid Lumen, Reduces the Plastoquinone Pool, and Contributes to the Oxidation of P700 at a Lower Partial Pressure of CO2 in Wheat Leaves

1
Department of Biological and Environmental Science, Faculty of Agriculture, Graduate School of Agricultural Science, Kobe University, 1-1 Rokkodai, Nada, Kobe 657-8501, Japan
2
Core Research for Environmental Science and Technology, Japan Science and Technology Agency, K’s Goban-Cyo, 7 Goban-Cyo, Chiyoda-Ku, Tokyo 102-0076, Japan
3
Faculty of Agriculture, Iwate University, 3-18-8 Ueda, Morioka, Iwate 020-8550, Japan
*
Author to whom correspondence should be addressed.
Plants 2020, 9(3), 319; https://doi.org/10.3390/plants9030319
Submission received: 9 December 2019 / Revised: 24 February 2020 / Accepted: 27 February 2020 / Published: 3 March 2020
(This article belongs to the Special Issue ROS Responses in Plants)

Abstract

:
The oxidation of P700 in photosystem I (PSI) is a robust mechanism that suppresses the production of reactive oxygen species. We researched the contribution of photorespiration to the oxidation of P700 in wheat leaves. We analyzed the effects of changes in partial pressures of CO2 and O2 on photosynthetic parameters. The electron flux in photosynthetic linear electron flow (LEF) exhibited a positive linear relationship with an origin of zero against the dissipation rate (vH+) of electrochromic shift (ECS; ΔpH across thylakoid membrane), indicating that cyclic electron flow around PSI did not contribute to H+ usage in photosynthesis/photorespiration. The vH+ showed a positive linear relationship with an origin of zero against the H+ consumption rates in photosynthesis/photorespiration (JgH+). These two linear relationships show that the electron flow in LEF is very efficiently coupled with H+ usage in photosynthesis/photorespiration. Lowering the intercellular partial pressure of CO2 enhanced the oxidation of P700 with the suppression of LEF. Under photorespiratory conditions, the oxidation of P700 and the reduction of the plastoquinone pool were stimulated with a decrease in JgH+, compared to non-photorespiratory conditions. These results indicate that the reduction-induced suppression of electron flow (RISE) suppresses the reduction of oxidized P700 in PSI under photorespiratory conditions. Furthermore, under photorespiratory conditions, ECS was larger and H+ conductance was lower against JgH+ than those under non-photorespiratory conditions. These results indicate that photorespiration enhances RISE and ΔpH formation by lowering H+ conductance, both of which contribute to keeping P700 in a highly oxidized state.

1. Introduction

Plants, both wild and cultivated, face the threat of oxidative damage from reactive oxygen species (ROS) when they are exposed to environments in which photosynthesis is suppressed [1]. For example, low temperatures, high temperatures, and dryness promote stomata closure, which reduces photosynthesis abilities [2]. In these circumstances, superoxide radicals (O2) can be generated through the photoreduction of O2 in photosystem I (PSI), and H2O2 is generated by the disproportionation of O2 [2]. The photoreduction of O2 in PSI is regarded as the main ROS-generating process in photosynthetic organisms exposed to environmental stresses [2]. These ROS increase the risk of oxidative damage.
In angiosperms, ROS generation in PSI has been shown to cause oxidative damage [1,3]. To imitate situations in which electrons accumulate on the PSI acceptor side—situations of environmental stress that lowers photosynthesis efficiency and NADP+ regeneration efficiency—the leaves of sunflower plants were illuminated intermittently with saturating lights in darkness (repetitive short-pulse (rSP) illumination treatment). This rSP illumination treatment promoted PSI oxidative damage over time. On the other hand, almost no oxidative damage occurred in photosystem II (PSII) [1,3,4]. Under anoxic conditions, the PSI oxidative damage was suppressed [3]. The rSP illumination treatment promoted ROS generation within PSI, which was thought to be the cause of the oxidative damage. Additionally, this PSI damage also lowered the photosynthesis rate [3,5].
The reaction center chlorophyll P700 in PSI drives the photo-oxidation/reduction cycle. Ground state P700 absorbs light and transitions into its excited state (P700*). Then, oxidized P700 (P700+) is generated when P700* donates electrons to the electron acceptors in the PSI complex (Ao, A1, Fx, and FA/FB) [6]. When leaves are irradiated with a pulse light, P700+ is generated rapidly. However, during the pulse, P700+ decreases and P700* accumulates [1,4,7]. P700* accumulation promotes electron transfer from A0, A1, FX, and/or FA/FB to O2 to produce O2. This is the mechanism of ROS generation in PSI by rSP illumination, as well as a molecular mechanism of PSI oxidative damage.
The accumulation of photoexcited P700* implies that the rate-determining step of the P700 photo-oxidation/reduction cycle is the electron transfer reaction from P700* to the electron acceptors on the PSI acceptor side. This has been motivating us to clarify the reason why O2-evolving photosynthesis organisms can safely perform photosynthesis under field conditions [1,3,4]. If P700* does not accumulate under pulse light illumination, ROS generation should be suppressed. Therefore, to keep P700* from accumulating, the reduction of P700+ in the P700 photo-oxidation/reduction cycle should be the rate-determining step of the cycle.
In this study, we conducted rSP illumination treatment under steady-state actinic light (AL) conditions [3]. As the intensity of AL increased, the PSI oxidative damage caused by the rSP illumination treatment was lowered. Furthermore, it was found that an increase in AL intensity increased the proportion of P700+ in the photo-oxidation reduction cycle of P700 in PSI [3]. We revealed a negative relationship between PSI oxidative damage and P700+ accumulation under AL conditions [3]. These results show that P700+ accumulation lowers the proportion of P700*, which causes the generation of ROS by pulse illumination.
We clarified that O2-evolving photosynthesis organisms suppress ROS generation in PSI through P700 oxidation [1,3,4,7,8,9,10,11,12]. Shimakawa et al. [4], in particular, revealed that a cyanobacterial strain that does not maintain a high level of P700+ suffers from rapid PSI oxidative damage under AL illumination. Nearly 30 years ago, it was reported that under conditions with strong light or a low partial pressure of CO2 (pCO2), i.e., conditions with a reduced photosynthetic efficiency, plants display the oxidation of P700 in PSI [13,14,15,16,17,18,19]. We suggest that P700 oxidation is a robust physiological response for suppressing ROS generation.
Photorespiration is thought to contribute to P700 oxidation [1,20]. For the PSI reaction center chlorophyll P700 to be kept in a higher oxidized state, the regeneration rate of the ground state of P700 in the photo-oxidation/reduction cycle must be limited by the P700+ reduction rate. In this study, we attempted to explain the molecular mechanism by which photorespiration facilitates the oxidation of P700.

2. Materials and Methods

2.1. Plant Materials and Growth Conditions

The winter wheat cultivar “Norin 61” was used in this study. Seeds were incubated on wet cotton at 4 °C for 3 days to promote synchronized germination. The moistened seeds were grown in a mixture of soil (Metro-Mix 350; Sun Gro Horticulture, Bellevue, WA, USA) and vermiculite (Konan, Osaka, Japan) in pots (7.5 cm length × 7.5 cm width × 6 cm depth). The ratio of soil to vermiculite was 1:1. The plants were grown under standard air-equilibrated conditions in an environmentally controlled chamber set at 25 °C day/20 °C night, with a 16 h light/10 h dark photoperiod and 700–800 µmol photon m−2 s−1 light intensity. They were watered every other day with 0.1% Hyponex solution (N:P:K = 5:10:5; Hyponex, Osaka, Japan). The plants were grown for at least 6 weeks, and fully expanded, mature leaves were harvested for further analysis.

2.2. Gas Exchange, Chlorophyll Fluorescence, P700+, Electrochromic Shift, and Spectroscopic Analyses

Exchanges of CO2 and H2O were measured using the GFS-3000 system equipped with a 3010-DUAL gas exchange chamber (Walz, Effeltrich, Germany), in which ambient air was saturated with water vapor at 14.0 ± 0.1 °C and the leaf temperature was maintained at 25 ± 2 °C. The photosynthesis rate (A) and dark respiration rate (Rd) were measured. The photosynthesis rate as a function of the intercellular partial pressure of CO2 (Ci) was determined. Three plants were used for each experiment. Gas exchange parameters were calculated by the software of the GFS-3000 system, which follows the method of von Caemmerer and Farquhar [21].
The chlorophyll fluorescence and P700+ in PSI were measured with a DUAL-PAM system (Walz), simultaneously with the gas exchange analysis of GFS-3000 (Walz). The chlorophyll fluorescence parameters were calculated as follows [22]: Fo, minimum fluorescence from a dark-adapted leaf; Fo′, minimum fluorescence from a light-adapted leaf; Fm, maximum fluorescence from a dark-adapted leaf; Fm′, maximum fluorescence from a light-adapted leaf; Fs, fluorescence emission from a light-adapted leaf; effective quantum yield of PSII, Y(II) = (Fm′ − Fs)/Fm′; non-photochemical quenching, non-photochemical quenching (NPQ) = (Fm − Fm’)/Fm’; and QA oxidized state (qL) = (Fm’ − Fs)/(Fm’ − Fo’) x (Fo’/Fs). To obtain Fm and Fm′, a saturating pulse light (630 nm, 8000 µmol photons m−2 s−1, 300 ms) was applied. Red actinic light (630 nm, 500 µmol photons m−2 s−1) was supplied using a chip-on-board LED array. The oxidation-reduction state of P700 in PSI was determined according to the methods of Klughammer and Schreiber [23], as follows: Pm, total amount of photo-oxidizable P700; Pm′, maximum amount of P700 photo-oxidized by the saturating pulse light under actinic light; P, amount of photo-oxidized P700 at a steady state under actinic light; the effective quantum yield of PSI, Y(I) = (Pm’ – P)/Pm; the quantum yield of non-photochemical energy dissipation of oxidized P700 (P700+), Y(ND) = P/Pm; and the quantum yield of non-photochemical energy dissipation of photo-excited P700 (P700*), Y(NA) = (Pm − Pm′)/Pm. The summation of these quantum yields is 1 (Y(I) + Y(ND) + Y(NA) = 1).
We set the intensity of actinic light at 500 μmol photons m−2 s−1, so that we could detect Y(II) and Y(I) signals at a lower Ci. Generally, P700 is oxidized under high light and/or low CO2 conditions. At extremely high light (ex. >1500 μmol photons m−2 s−1), Y(II) and Y(I) are too small to allow a precise estimation of them.
For P700 in PSI to be oxidized, the reduction rate of P700+ must be the rate-determining step in the P700 photo-oxidation/reduction cycle. H+ accumulation in the lumen of thylakoid membranes, ΔpH formation, suppresses the plastoquinol (PQH2) oxidation of the cytochrome (Cyt) b6/f complex, which is called photosynthesis control, to oxidize P700 [24]. To evaluate the contribution of photorespiration to the oxidation of P700 in PSI, the electrochromic shift (ECS) signal was measured. The ECS signal reflects both the ΔpH and Δψ across the thylakoid membranes [25,26]. The ECS signal was measured simultaneously with the above gas exchange analysis using the DUAL-PAM system (Walz), equipped with a P515 analysis module [27]. The P515 analysis module monitored the formation of the ECS signal due to the carotenoid spectrum shift in response to the membrane potential produced by ΔpH and [25]. The magnitude of the ECS signal was evaluated by dark-interval relaxation kinetics (DIRK) analysis [25,26]. At the steady state of photosynthesis, actinic light (AL) illumination was transiently turned off for 400 ms. On the turning-off of AL illumination, the ECS signal rapidly decayed. The magnitude of the full decay of the ECS signal reflects the summation of both ΔpH and Δψ. The decay rate of the ECS signal after the turning-off of AL illumination reflects the activity of ATP synthase in thylakoid membranes [25,26]. The half time of the ECS decay reflects the proton conductance (gH+), which in turn reflects the apparent rate constant of ATP synthesis catalyzed by ATP synthase and depends on the concentrations of ADP and inorganic phosphate and the catalytic constant of ATP synthase [25,26].
The magnitude of the ECS signal was normalized, as follows [27]. A single turnover flash (10s) was used to illuminate the leaf under far-red light. The ECS signal was induced by the single turnover of PSII, which corresponds to the membrane potential induced by single charge separation. The average value of a single turnover (ST) flash-induced ECS signal (ECSST) was 3.73 ± 0.04 × 10⁻³ ΔI/Io (n = 3). Then, the measured ECS signal was divided by ECSST, and was used as the normalized ECS signal (ECSN) [25] (Equation (1)).
ECSN = ECS/ECSST
The contribution of both ΔpH and Δψ to the total ECS signal was separately evaluated after the turning-off of AL illumination over longer periods of darkness [26]. Under all experimental conditions in this study, the contribution of Δψ to ECSN was less than 10% (Figure S1). Therefore, ECSN is regarded as mainly representing ΔpH.
The H+ consumption flux vH+ (μmol H+ m−2 s−1) is proportional to both ECSN and gH+. Namely (Equation (2)),
vH+ = m × gH+ × ECSN,
where m is a coefficient that has the dimension of “mol H+ m−2”. In this study, we assumed that m was constant.

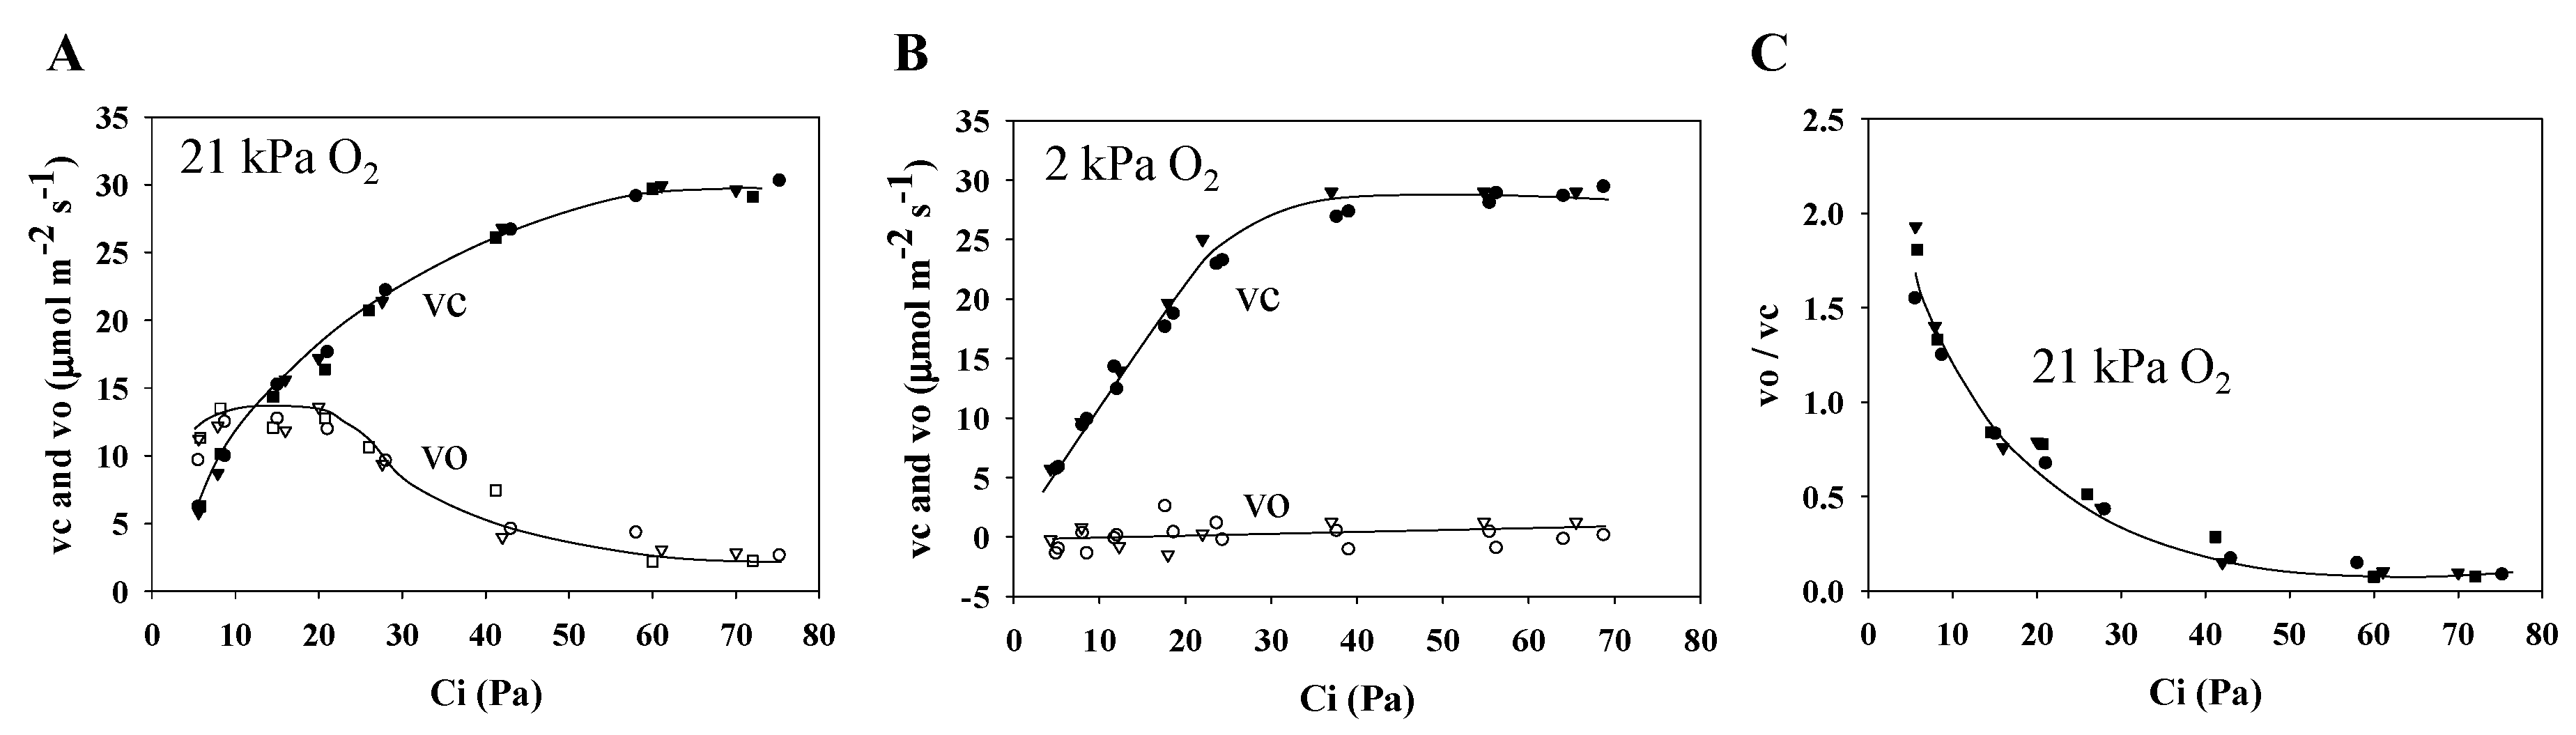
2.3. Ribulose 1,5-Bisphosphate (RuBP) Carboxylation Rate and RuBP Oxygenation Rate in Wheat Leaves

The RuBP carboxylation rate (vc) and RuBP oxygenation rate (vo) during photosynthesis and photorespiration in wheat leaves were measured by simultaneous chlorophyll fluorescence and CO2 exchange analyses [28,29]. The values for vc and vo were obtained from the following equations (Equations (3) and (4)):
vc = (1/6) × [Jf/2 + 4 × (A + Rd)],
vo = (1/6) × [Jf − 4 × (A + Rd)],
where Jf is the electron flux in the photosynthetic linear electron flow (LEF) and is equal to α × Y(II) × PFD [30]. The photosynthesis rate (A) and dark respiration rate (Rd) were measured as described above. The photon energy absorbed by the leaves is distributed to both PSII and PSI. The coefficient α is the distribution ratio of the photon energy to PSII in the thylakoid membrane. The value of α for wheat leaves, which was 0.42 ± 0.02 (n = 4) in this study, was determined following the method of Miyake and Yokota [31]. The term PFD stands for the photon flux density, which is the intensity of light illuminated on the leaves.

2.4. H+ Consumption Rate Estimated from the Stoichiometries of Photosynthesis and Photorespiration

The H+ consumption rate (JgH+) was estimated from the ATP consumption rate (vATP) during photosynthesis and photorespiration [32]. In C3 photosynthesis, the ratio of JgH+ to vATP is 4.67, because ATP synthase uses 4.67 H+ ions for the synthesis of one molecule of ATP [33]. The ratio of vATP to the NADPH consumption rate (vNADPH) is [3 + 3.5 (vo/vc)]/[(2 + 2 (vo/vc)]. Considering JgH+/vNADPH = 4.67 × [3 + 3.5 (vo/vc)]/[(2 + 2 (vo/vc)] and the electrons in photosynthetic linear electron flow for the production of NADPH, JgH+ could be expressed as follows [21] (Equation (5)):
JgH+ = 9.34 × (vc + vo) × [3 + 3.5 (vo/vc)]/[2 + 2 (vo/v c)].
The values of both vc and vo were estimated as described above.

3. Results

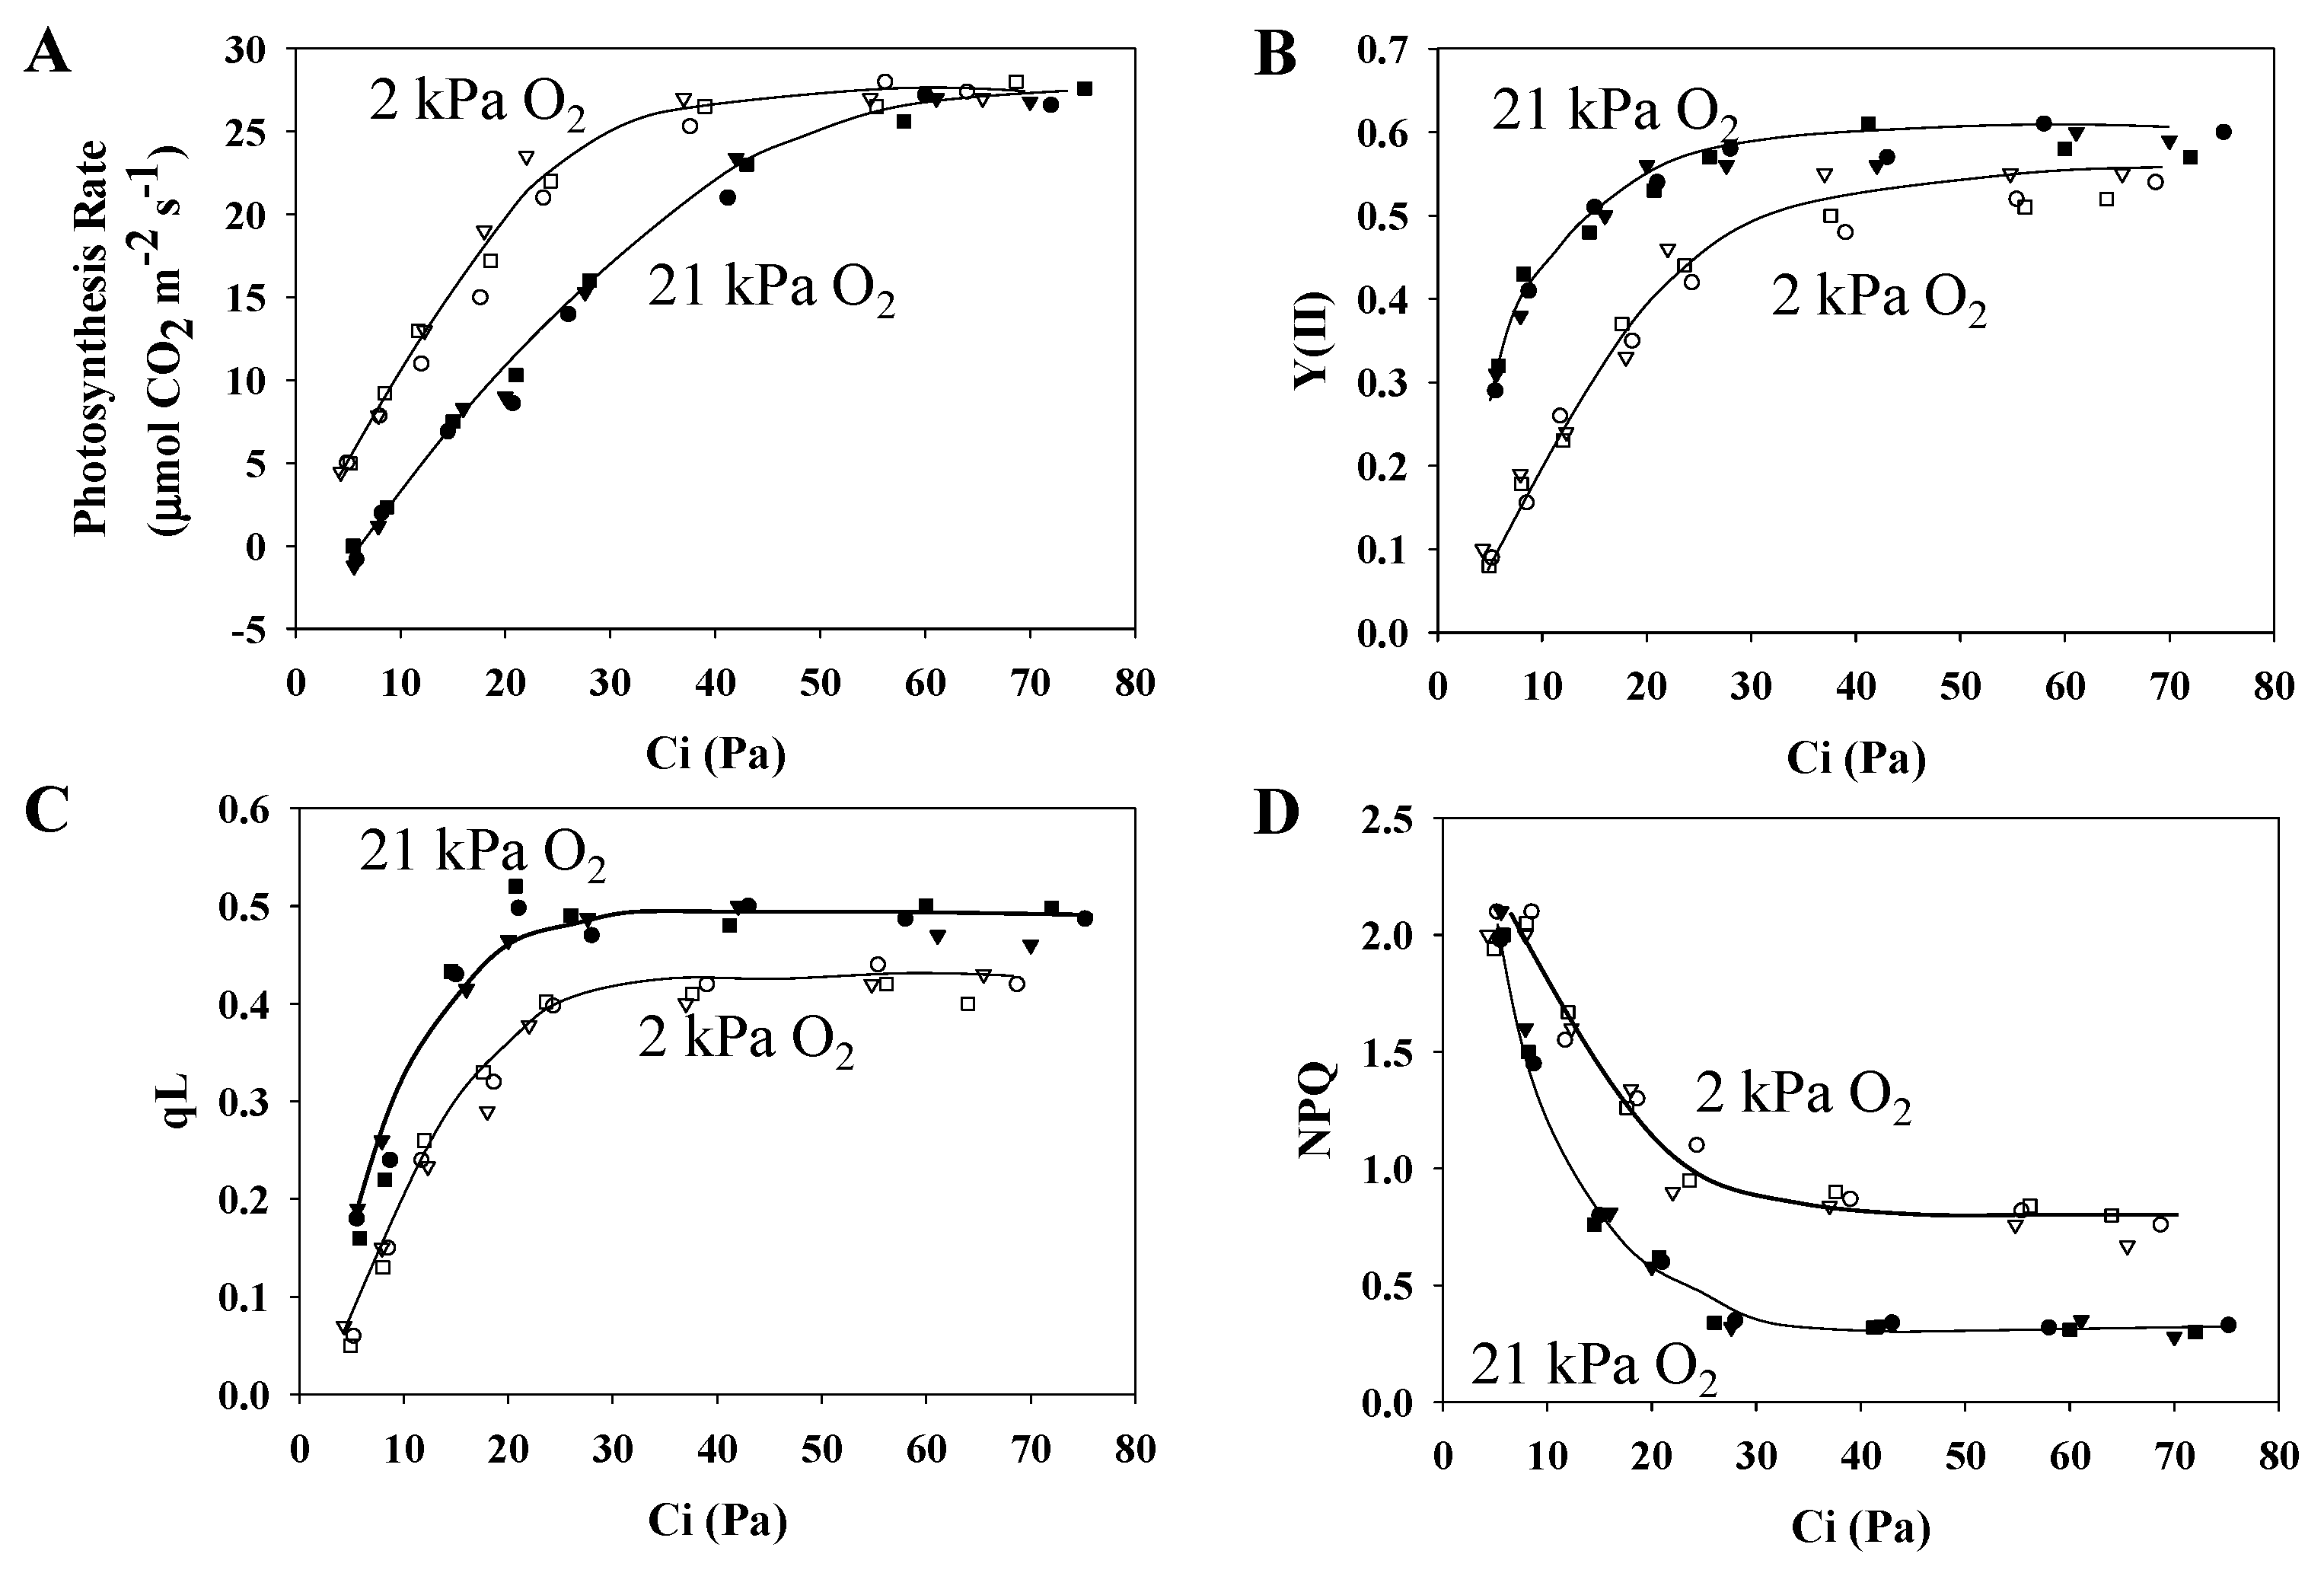
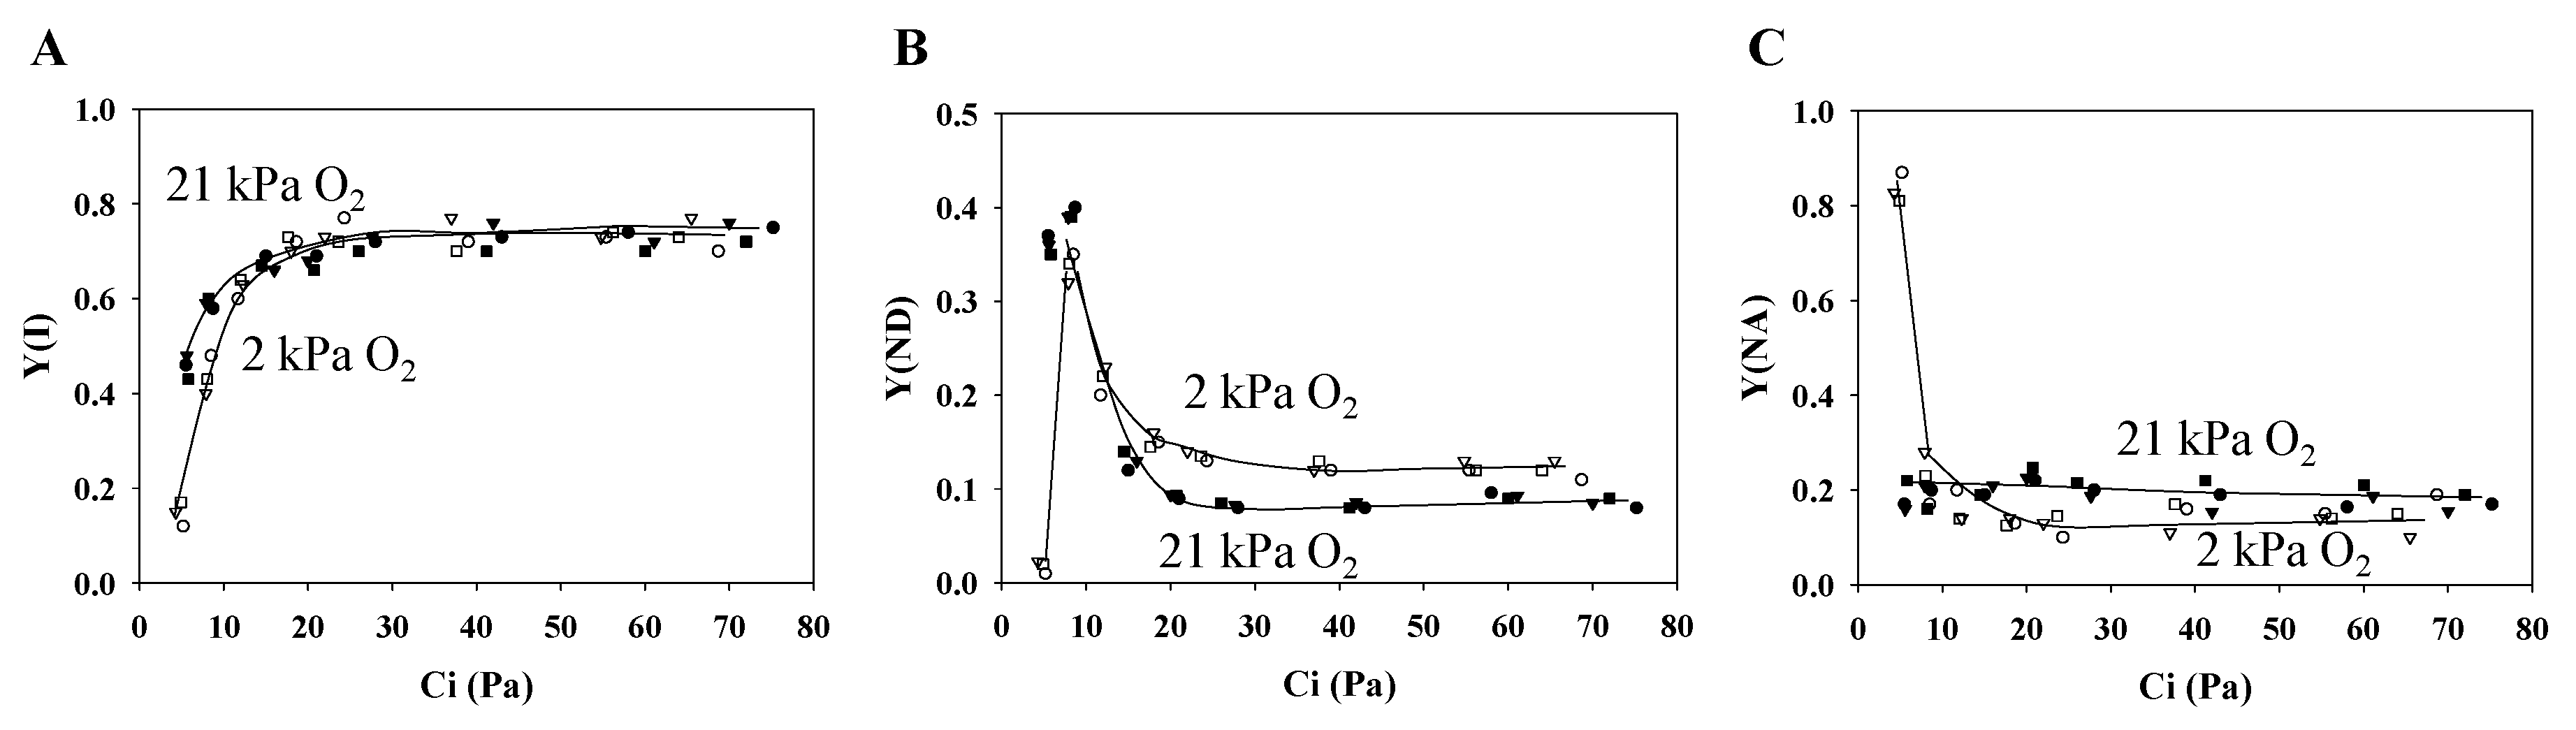
3.1. Characteristics of PSII and PSI Parameters in Response to Changes in the Partial Pressure of CO2

To examine the effect of photorespiration on the photochemical parameters in PSII and PSI, we modulated the photorespiration rate by manipulating the partial pressure of CO2 (pCO2). Photorespiration activity is expected to increase when lowering pCO2 under atmospheric conditions [34,35,36], and lowering the atmospheric partial pressure of O2 (pO2) (21 kPa) to 2 kPa achieves negligible photorespiration activity [34,35,36]. We set pO2 to 21 kPa, pCO2 to 40 Pa, and the light intensity to 500 µmol photons m−2 s−1. After the photosynthesis rate reached a steady-state level, we increased pCO2 to 100 Pa. Next, we lowered pCO2 to 5 Pa from 100 Pa, and under all pCO2, we assessed the photosynthesis rate, along with the PSII and PSI parameters (Figure 1 and Figure 2). These assessments were conducted under two pO2 conditions (21 kPa, normoxic condition; 2 kPa, hypoxic conditions).
The following parameters were plotted against the leaf intercellular CO2 partial pressure (Ci) under the two pO2 conditions: the photosynthesis rate (Figure 1A), the PSII quantum yield (Y(II)) (Figure 1B), qL reflecting the QA redox state in PSII (Figure 1C), and NPQ (Figure 1D).
The photosynthesis rate under the normoxic condition showed a CO2 compensation point of approximately 6 Pa pCO2, and the photosynthesis rate increased as Ci increased, becoming saturated at roughly 60 Pa Ci (Figure 1A). On the other hand, under the hypoxic condition, the CO2 compensation point decreased, and the photosynthesis rate was even greater than that under the normoxic condition. This is because, under the hypoxic condition, photorespiration was suppressed [31,36]. Y(II) also increased as Ci increased (Figure 1B). However, unlike the photosynthesis rate, Y(II) values were greater under the normoxic condition rather than under the hypoxic condition. This reflects the increased electron sink provided by photorespiration [31]. Furthermore, as with Y(II), qL showed a response to changes of both Ci and pO2 (Figure 1C); that is, QA was oxidized in response to Y(II) increasing, and this was caused by the increased electron sink provided by photorespiration [31]. NPQ decreased in response to the increase in Y(II) (Figure 1D). Furthermore, the increase in both Y(II) and qL facilitated by photorespiration lowered the NPQ values further under the normoxic condition than under the hypoxic condition, considering that (Equation (6)) [37]
NPQ = qL × [1 − Y(II)]/Y(II) × (Fv/Fm)/[1 − (Fv/Fm)]
The quantum yields of PSI were plotted against Ci under the two pO2 conditions: Y(I) (Figure 2A), Y(ND) (Figure 2B), and Y(NA) (Figure 2C).
Y(I) increased as Ci increased (Figure 2A). Unlike the photosynthesis rate, the Y(I) values were approximately the same under the normoxic condition. On the other hand, under the hypoxic condition, Y(I) decreased to roughly 0.15 when Ci was lower than 5Pa, where photosynthesis and photorespiration activities were negligible. Furthermore, Y(ND), representing the oxidation level of P700, also showed a response to Ci changes (Figure 2B). Drops in Ci led to increases in Y(ND). Y(ND) under the normoxic condition was lower than under the hypoxic condition, above 15 Pa Ci. Meanwhile, under photorespiration-suppressed conditions, the suppression of photosynthesis activity in the Ci range lower than 10 Pa caused Y(ND) to fall to roughly 0.01. However, Y(ND) did not fall in the same Ci range under the normoxic condition. Y(NA) did not depend on photorespiration activity and showed no Ci response (Figure 2C), except when photorespiration was suppressed and Ci was low, where Y(NA) only increased to approximately 0.85. Below 10 Pa Ci under the hypoxic condition, photosynthesis and photorespiration, that is, almost all electron sinks, were suppressed, as shown by the extremely small Y(I) and Y(II). Because of the suppressed electron flux in both PSII and PSI, the P700 oxidation reflected in Y(ND) was suppressed and Y(NA) was enhanced.

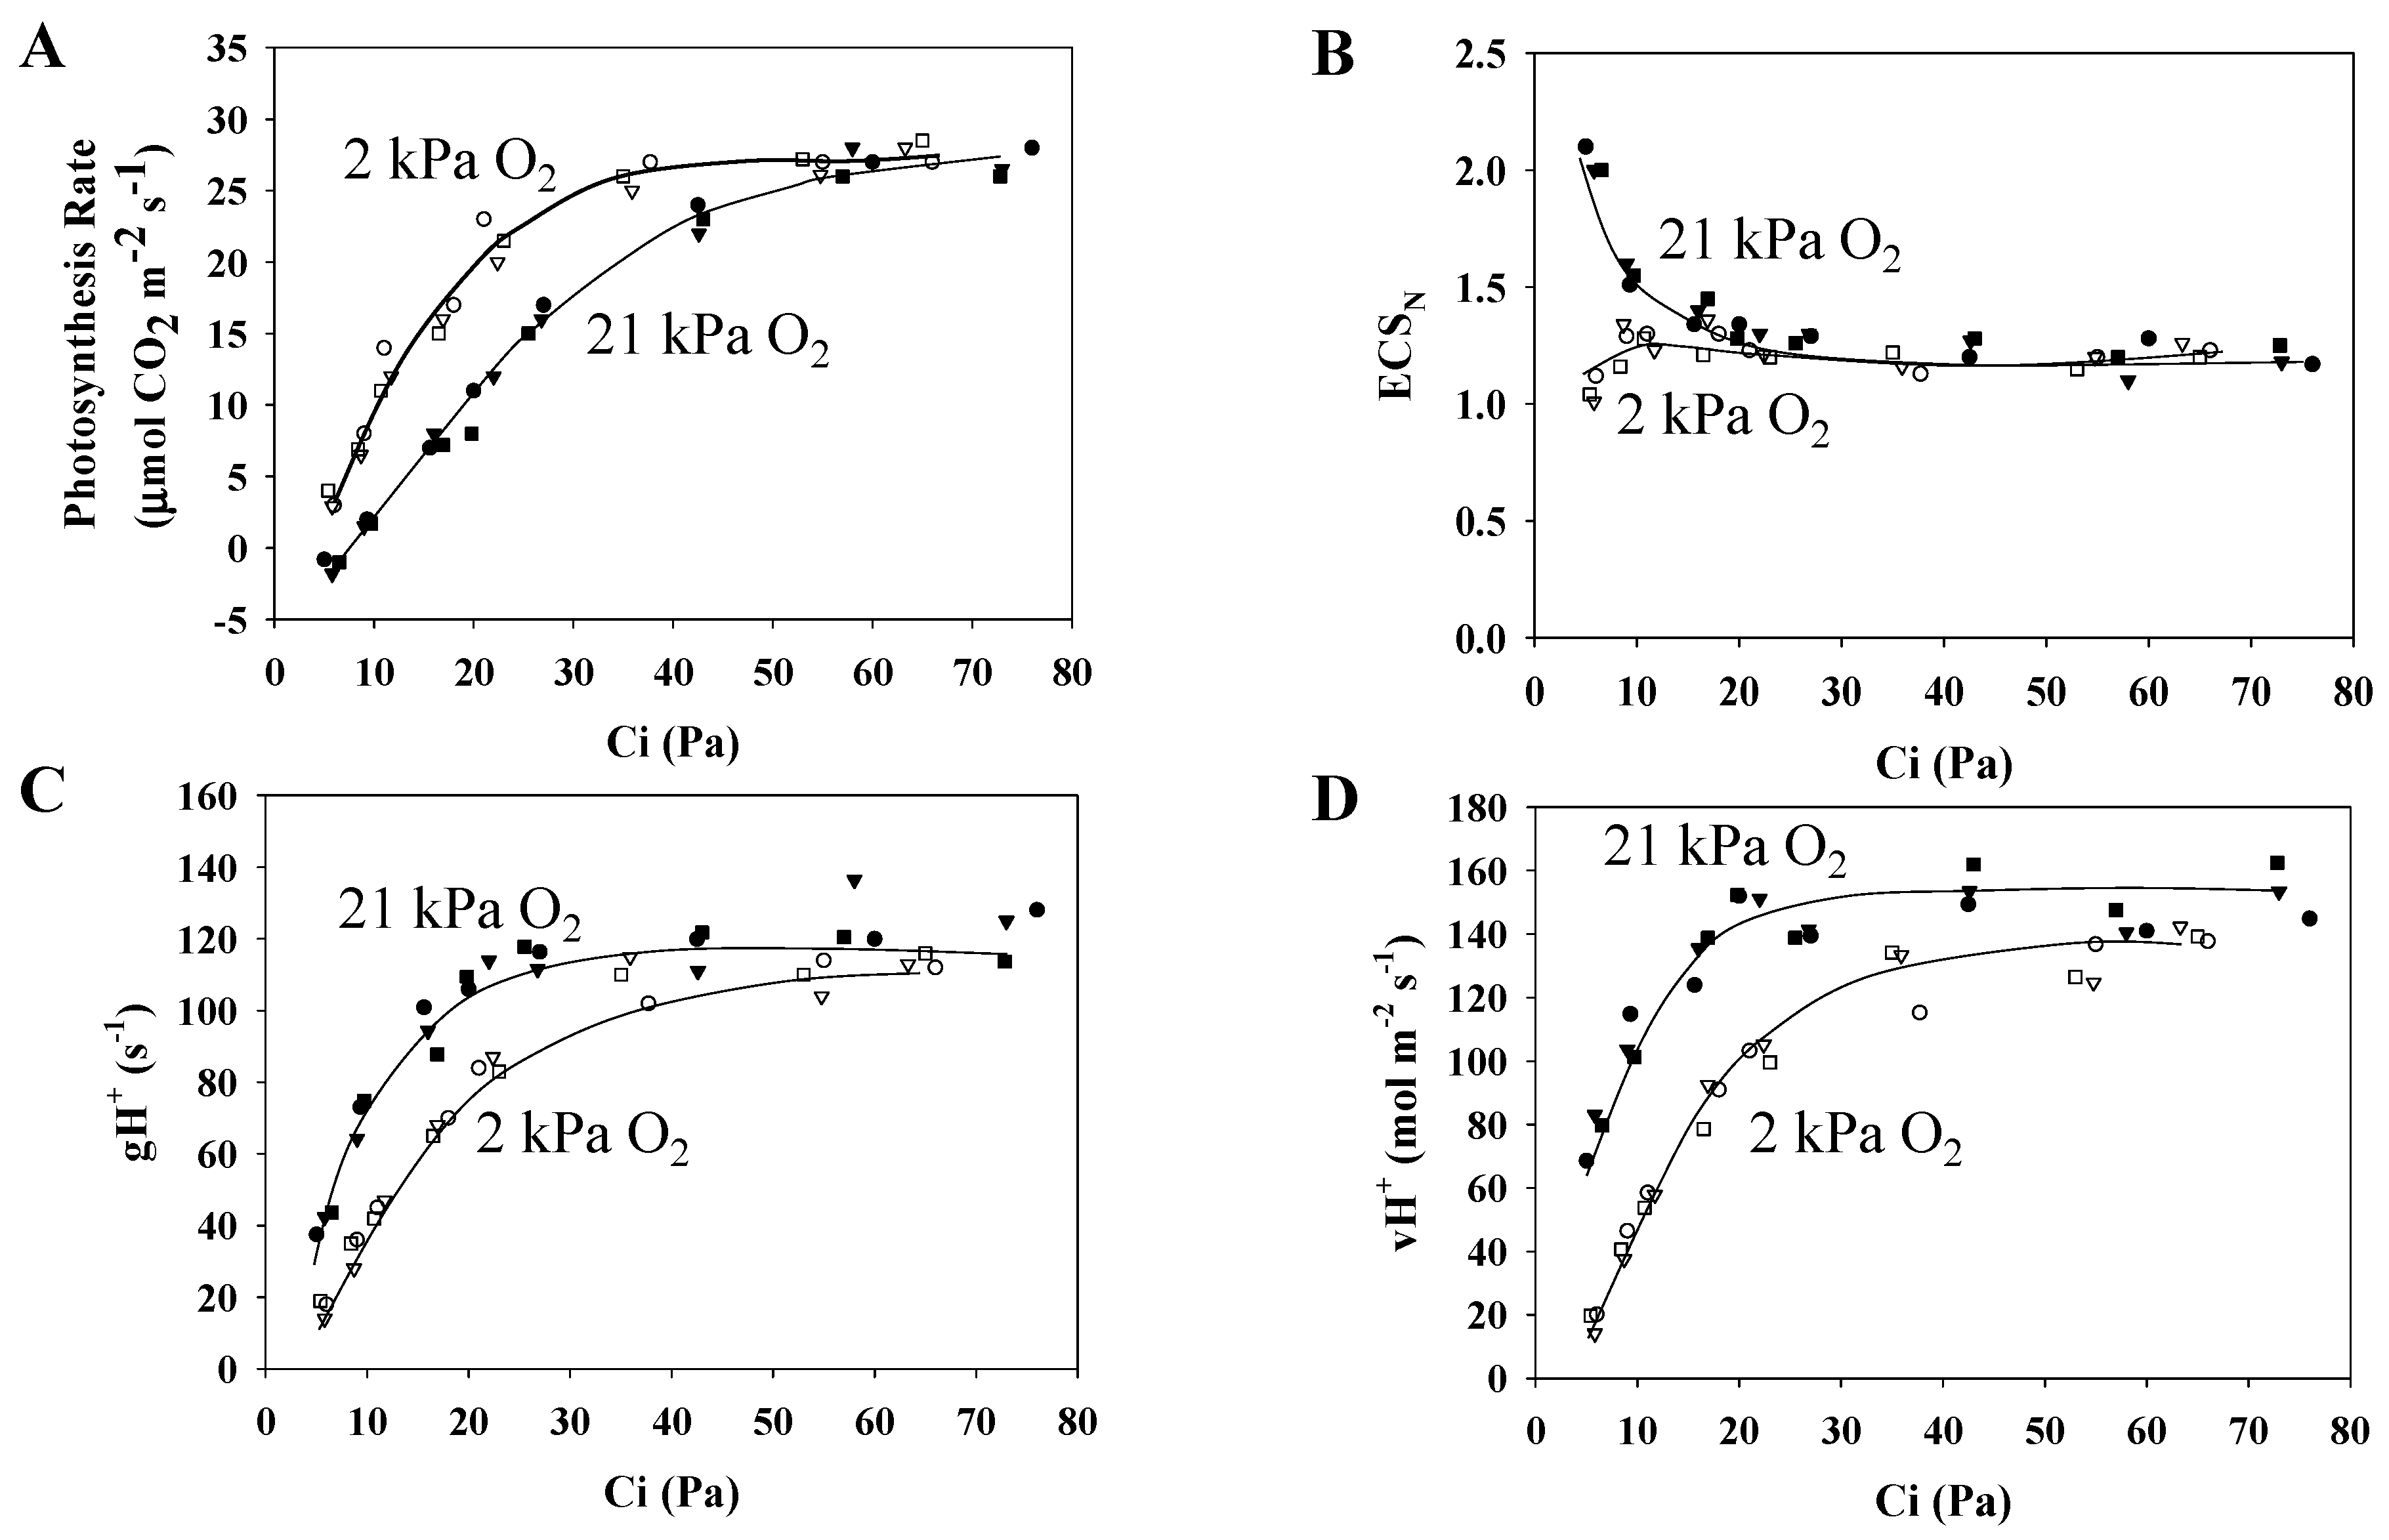
3.2. Characteristics of the Electrochromic Shift Signal and H+ Conductance in Response to Changes in pCO2

To reveal the effects of photorespiration on the electrochromic shift (ECSN) signal and on H+ conductance (gH+), we analyzed the effects of pCO2 on photosynthesis in wheat leaves. The methods for analyzing the photosynthesis rate and these parameters are described in Figure 1 (Figure 3A).
The following parameters were plotted against Ci, under normoxic and hypoxic conditions: the photosynthesis rate (Figure 3A), ECSN (Figure 3B), gH+ (Figure 3C), and the ECSN decay rate (vH+) (Figure 3D).
ECSN did not show Ci dependence in response to the photorespiration-suppressed situation of the hypoxic condition (Figure 3B). In contrast, in the photorespiration-functional situation of the normoxic condition, lowering Ci caused ECSN to increase, suggesting that photorespiration contributed to ΔpH induction. Under both normoxic and hypoxic conditions, the proportion of ΔpH in the ECSN was over 90%, while the proportion of ΔΨ was under 10% (Figure S1A,B). As with Y(II), gH+ showed Ci dependence (Figure 3C). The gH+ values were greater under the normoxic condition than under the hypoxic condition. Furthermore, as with both Y(II) and gH+, vH+ showed Ci dependence (Figure 3D). The value of vH+ was estimated by multiplying gH+ by ECSN (see Section 2, “Materials and Methods”). These facts support that photorespiration increased vH+ in the thylakoid membrane, compared to the hypoxic condition.

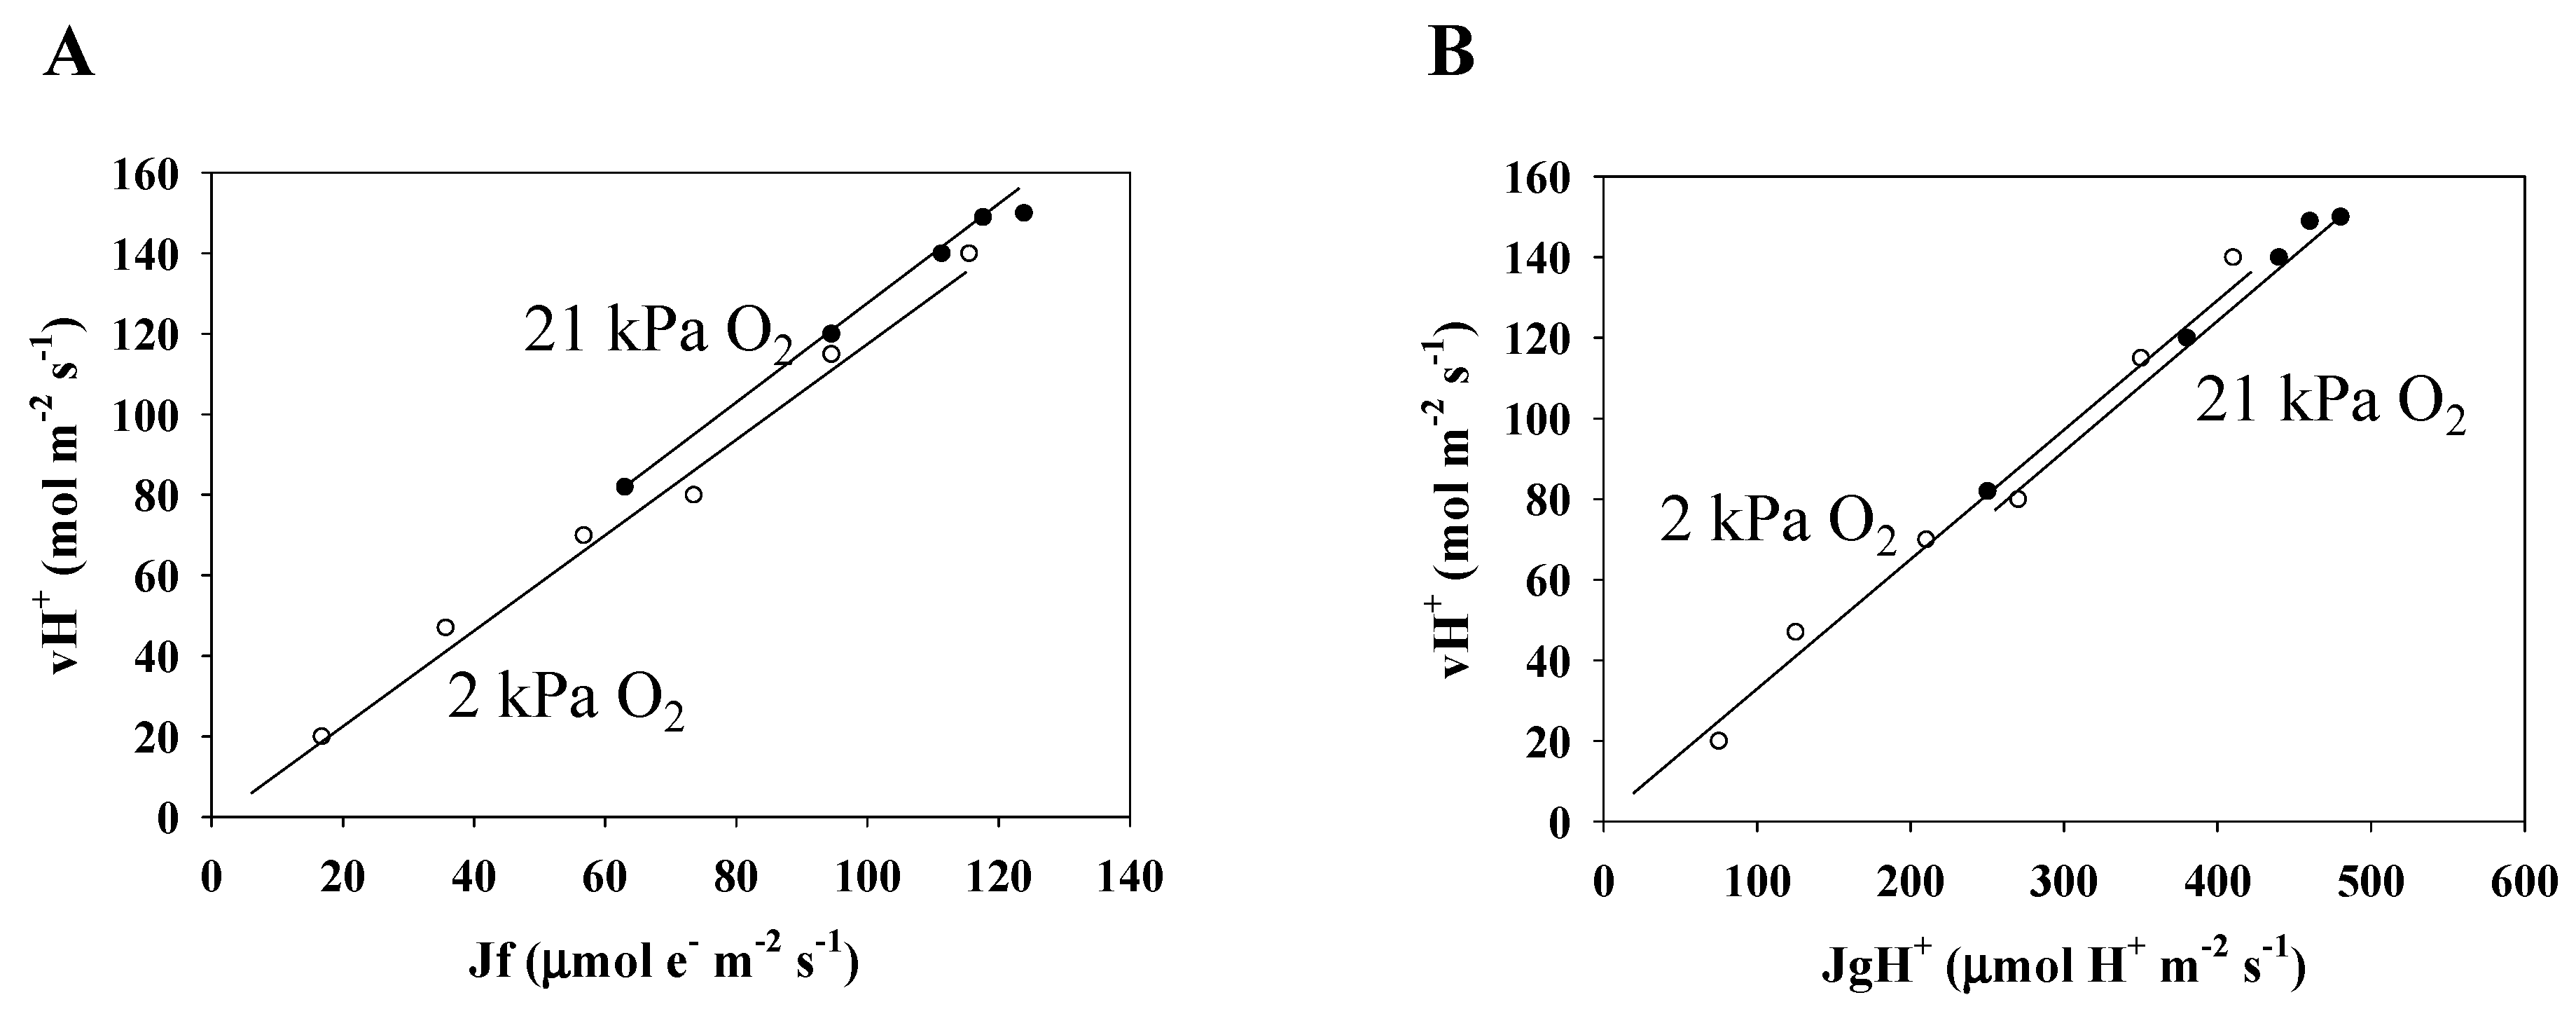
3.3. Electron Flux of Photosynthetic LEF Matches the Rate of ECS Deay Driven by Photosynthesis and Photorespiration

We examined the relationship between the electron flux in photosynthetic linear electron flow (LEF) and the H+ consumption flux of both photosynthesis and photorespiration in the thylakoid membrane. In this study, Jf, reflecting LEF, and vH+, were not measured simultaneously. Therefore, the Jf values were plotted against A + Rd, based on Figure 1 (Figure S2A). The relationships between Jf and A + Rd are shown by the arbitrarily drawn lines, which represent the trend of the data. Furthermore, the vH+ values were plotted against A + Rd based on Figure 3 (Figure S2B). The relationships between vH+ and A + Rd are shown as the same as with Jf. In Figure S2A,B, Jf and vH+ were sampled at the same values of A + Rd, on the basis of the arbitrarily drawn lines. Then, vH+ was plotted against the Jf values (Figure 4A). Under the two pO2 conditions, vH+ showed a positive linear relationship with Jf, with an origin of zero. These results agree with those of Avenson et al. [26] Kadota et al. [38] reported that the electron flux in ferredoxin (Fd)-dependent cyclic electron flow (CEF) activity is negligible compared to the electron flux in LEF under high light intensity conditions [38]. Therefore, it is implied that in a steady state, vH+ is equal to the rate of H+ accumulation in the thylakoid lumen driven by LEF.
Next, we estimated the flux of H+ consumption (JgH+) for the regeneration of ATP that is required for driving photosynthesis and photorespiration, on the basis of the Ci dependence data for both the photosynthesis rate and Y(II) (Figure 1A,B) (see “Materials and Methods” [32]). JgH+ values were plotted against A + Rd (Figure S2C). In Figure S2B,C, vH+ and JgH+ were sampled at the same A + Rd values (Figure 2A,B). Then, vH+ was plotted against JgH+ (Figure 4B). Under both normoxic and hypoxic conditions, vH+ showed a positive linear relationship with JgH+, with an origin of zero. These results agree with the results of Sejima et al. [32]. These sets of results show that the vH+ is determined by the ATP regeneration rate in photosynthesis and photorespiration. From the fact that LEF driven by photosynthesis and photorespiration shows a clear linear relationship with vH+ having an origin point of zero, we can conclude that the light reaction tightly couples with the dark reaction; that is, these results also support that the activities of alternative electron flows producing ΔpH across thylakoid membranes, the water–water cycle, and/or Fd-CEF, are extremely low and/or negligible.

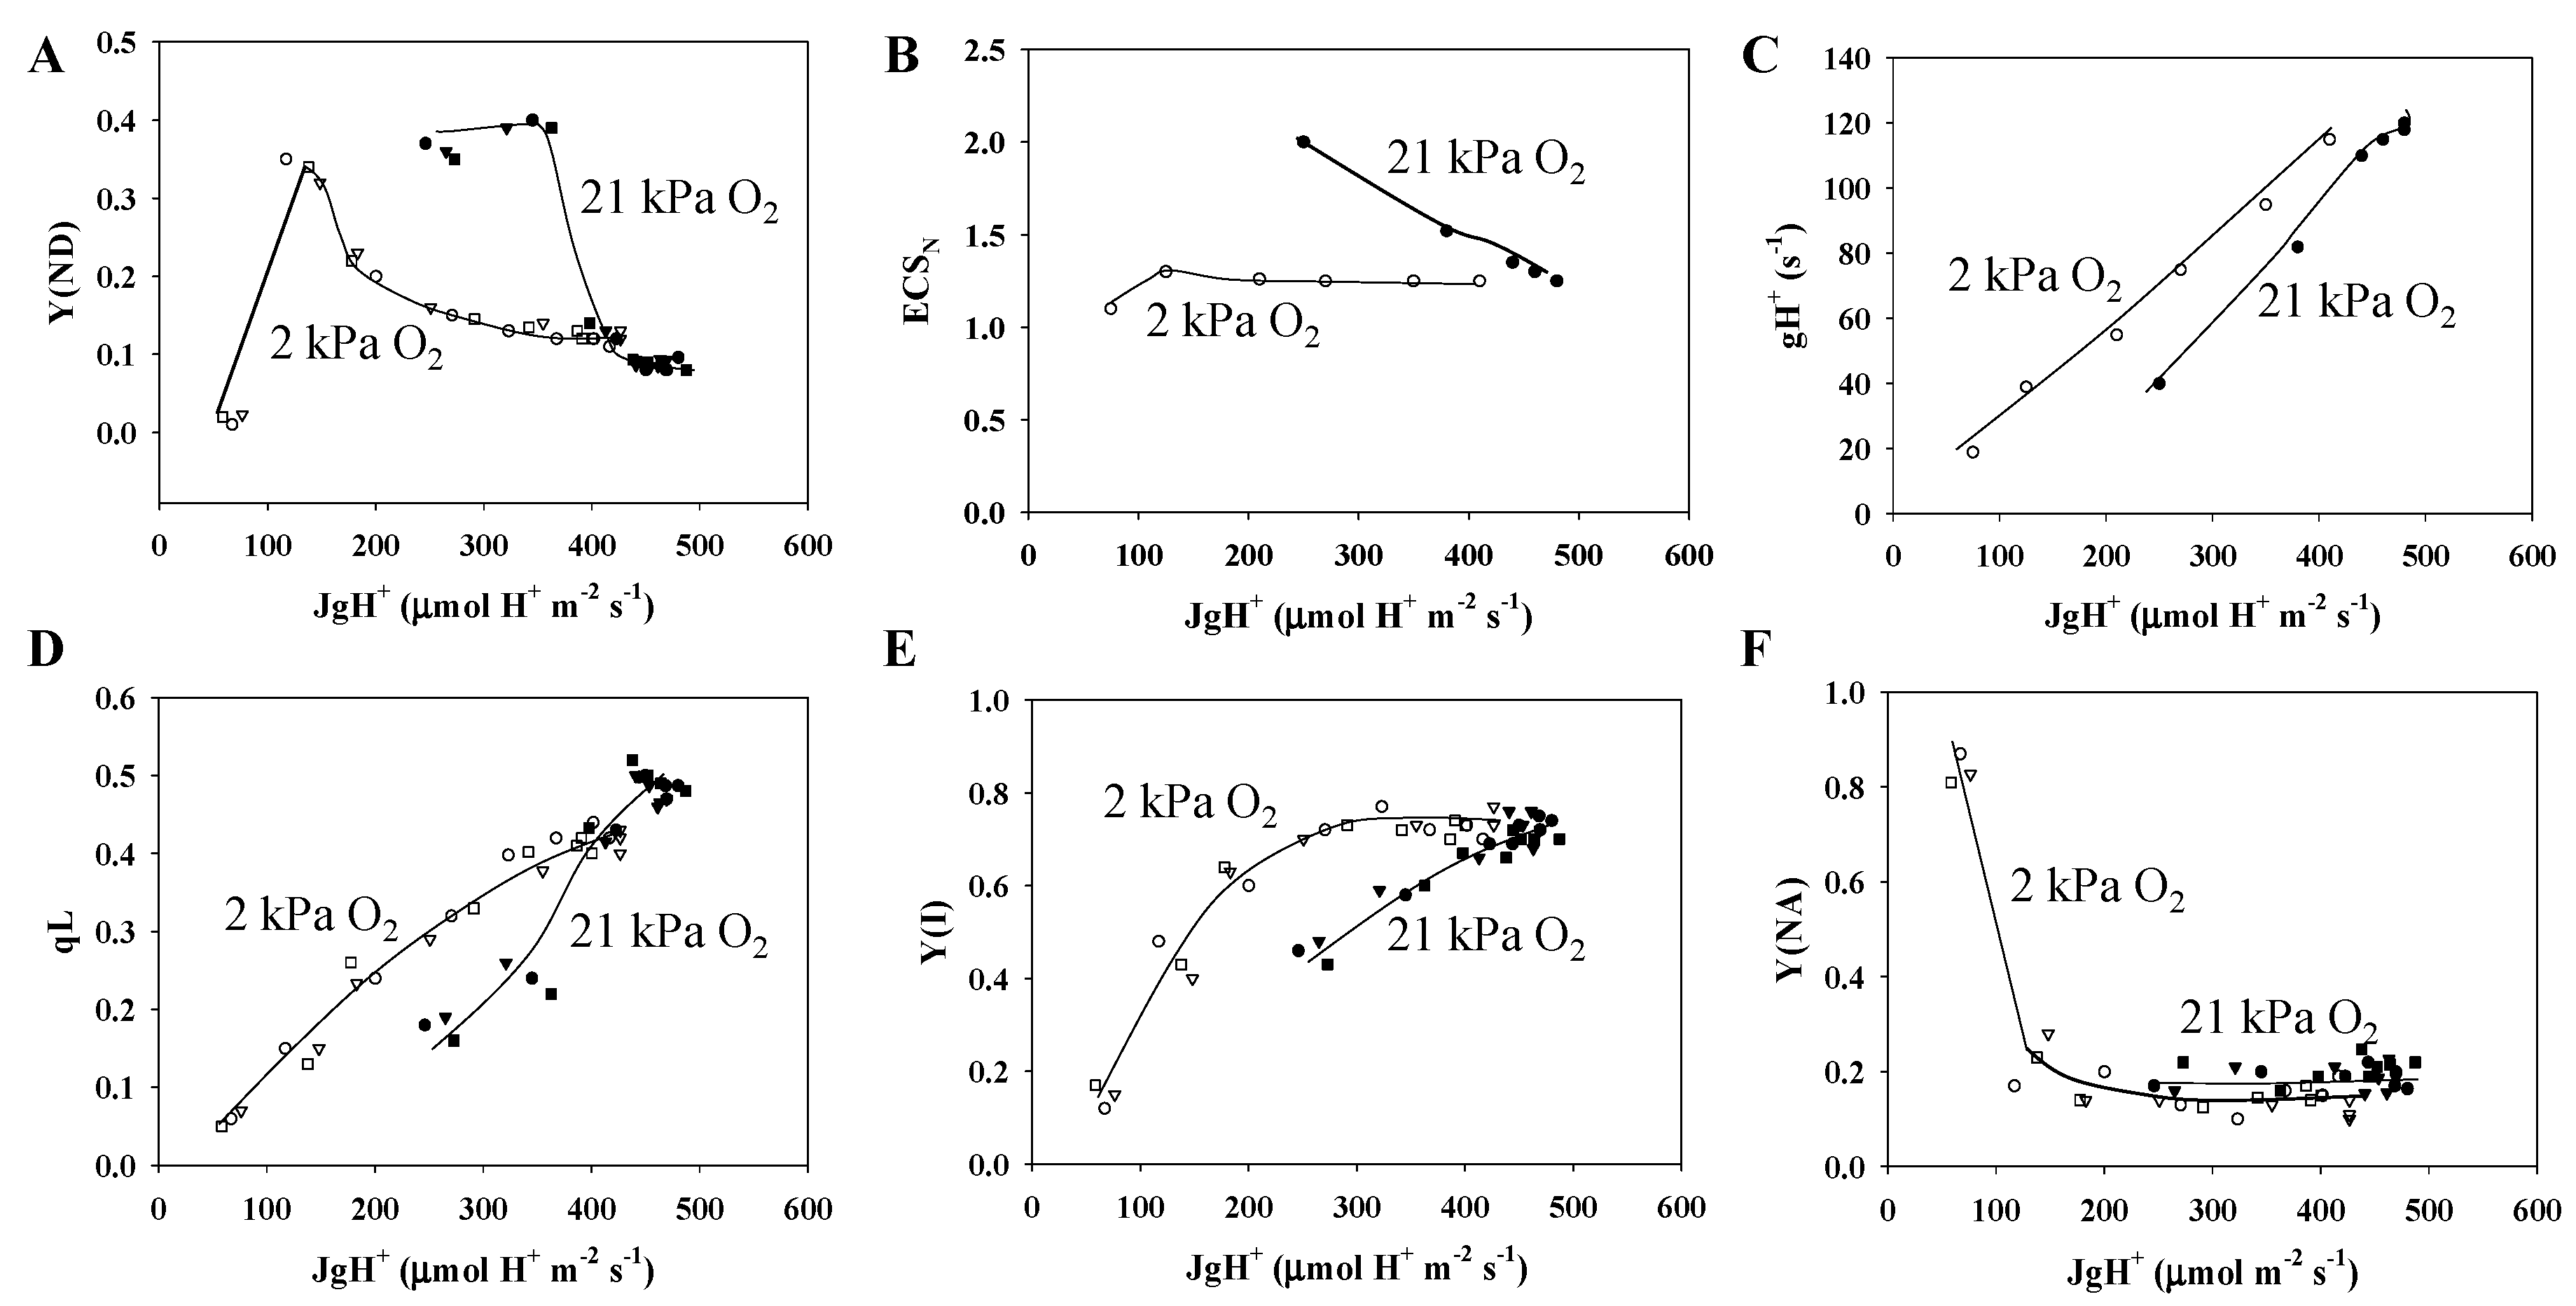
3.4. Contribution of Photorespiration to P700 Oxidation and ECSN in Response to Changes in the H+ Consumption Rate

The role of photorespiration in P700 oxidation was assessed (Figure 5). Under the normoxic condition, decreases in JgH+ from 450 to 250 μmol H+ m−2 s−1 induced by lowering Ci enhanced P700 oxidation, as shown by the increase in Y(ND), compared to the hypoxic condition (Figure 5A). These results indicate that photorespiration contributes to the oxidation of P700 in PSI. We tried to clarify the molecular mechanism required to oxidize P700 by photorespiration, for which the reduction of P700+ should be suppressed in the P700 photo-oxidation reduction cycle. The PQH2 oxidation activity exhibited by the Cyt b6/f complex is suppressed by the acidification of the luminal space of thylakoid membranes and RISE, which contribute to the suppression of the reduction of P700+ in PSI. A decrease in JgH+ induces a reduction of PQ-pool, as shown by the decrease in qL under the normoxic condition, the extent of which was larger than that under the hypoxic condition (Figure 5D). These results correspond to those of Shaku et al. [8] and Shimakawa, Shaku et al. [10]. One of the molecular mechanisms for the oxidation of P700 is RISE [10]. Compared to the hypoxic condition, qL decreased much more under the normoxic condition (Figure 5D). The range of the smaller qL under the normoxic condition compared to the hypoxic condition corresponds to the range of the larger Y(ND). On the other hand, the acidification of the luminal space of thylakoid membranes suppresses PQH2 oxidation activity of the Cyt b6/f complex [24]. The ΔpH was evaluated as the ECSN increased in response to the decrease in JgH+ under the normoxic condition, but did not change under the hypoxic condition (Figure 5B). That is, photorespiration stimulated the formation of ΔpH across thylakoid membranes to suppress the PQH2 oxidation activity of the Cyt b6/f complex [24] and enhance the oxidation of P700. The reason why the ΔpH increased under the normoxic condition could be because the values of gH+ were lower than those under the hypoxic condition (Figure 5C). These facts suggest that the regulatory mechanism lowers the H+ conductance of thylakoid membranes by photorespiration.
Under the normoxic condition, decreases in JgH+ from 450 to 250 μmol H+ m−2 s−1 lowered the electron flux in PSI, as shown in the decrease in Y(I), compared to the hypoxic condition (Figure 5E). These results indicate that photorespiration suppresses the electron flux in PSI by enhancing the oxidation of P700, because Y(NA) did not change (Figure 5F); that is, the suppression of the photosynthetic linear electron flow from the Cyt b6/f complex to PSI gets preference over the activity of PSI under the normoxic condition. The oxidation of P700 lowers the chance of O2 being reduced to O2 at the acceptor side of PSI by decreasing Y(I) and keeping Y(NA) at a lower value. Under the hypoxic condition, Y(I) further decreased with the increase in Y(NA) below 250 μmol H+ m−2 s−1 (Figure 5E,B). The increase in Y(NA), reflecting the accumulation of electrons at the acceptor side of PSI, is not dangerous for PSI, because the probability of producing ROS is too small under the hypoxic condition [3].
The results detailed above show that photorespiration contributes to P700 oxidation. The Ci dependencies of Rubisco’s vc and vo were plotted under the normoxic and hypoxic conditions (Figure 6A,B). Furthermore, vo/vc was plotted against Ci (Figure 6C). These results show that vo increases owing to the decrease in Ci, and that photorespiration activity increases under the normoxic condition. Interestingly, when Ci < 20 Pa, Ci decreases do not increase the photorespiration activity. These results agree with the results of Miyake and Yokota [31]. The causes of the suppression of the increase in photorespiration activity with the Ci drop will be discussed in the Discussion section. In contrast, the photorespiration activity was negligible under the hypoxic condition (Figure 6B).

4. Discussion

In the present research, we tried to elucidate the physiological function of photorespiration in P700 oxidation in PSI. Generally, P700 is oxidized by the limitation of electron flow to the oxidized form of P700, P700+ [1], and the oxidation activity of PQH2 of the cytochrome b6/f complex is down-regulated by the acidification of the luminal space (photosynthetic control) and RISE. We compared the relationship between P700 oxidation and photorespiration in terms of both photosynthetic control and RISE. We clarified that photorespiration decreased the H+ conductance and gH+, induced ΔpH formation, and simultaneously enhanced the reduction of PQ. These facts show that the rate of ATP consumption in photorespiration would be lower than that in photosynthesis; that is, a metabolic transition from only photosynthesis to both photosynthesis and photorespiration would cause a decrease in the efficiency of the regeneration of ATP due to photorespiration. The enhanced ΔpH formation induced the reduction of PQ to further suppress the PQH2 oxidation activity of the Cyt b6/f complex. Photorespiration might induce RISE by ΔpH formation.
We next considered the molecular mechanism for ΔpH formation across the thylakoid membranes to understand the P700 oxidation mechanism. In C3 angiosperms, the electron flux in photosynthetic LEF showed a positive linear relationship (with an origin of zero) with electron consumption rates (Jg) in both photosynthesis and photorespiration [30,39]. These results show that photosynthetic LEF drives both photosynthesis and photorespiration activity. Furthermore, we recently found that the LEF rate and Fd oxidation rate have a similar relationship to that between the LEF rate and Jg [38]. These results show that ferredoxin (Fd)-dependent CEF [40,41,42,43,44,45,46] is negligibly small; that is, photosynthetic LEF is responsible for the majority of ΔpH formation [38]. The induction mechanism of ΔpH formation across the thylakoid membranes is shown in the following manner: ΔpH formation is observed as an ECS signal increase [26,47]. Then, the ECS generation and decay rate [d(ECS)/dt] are determined by the difference between the ECS generation rate dependent on the LEF flux (Jf = α × Y(II) × PFD, see the detail in “Materials and Methods”) and the ECS decay rate (vH+) of the ATP regeneration reaction required for photosynthesis and photorespiration (Equations (7) and (8)),:
d(m × ECSN)/dt = k × Jf − vH+,
= k × Jf − m × gH+ × ECSN.
The coefficient k reflects H+ accumulation in the lumens, which is driven by LEF, and depends on H2O oxidation in PSII and on Q-cycle rotation in the Cyt b6/f complex. Furthermore, vH+ is expressed as m × gH+ × (ECSN). The gH+, H+ conductance is a rate constant that reflects the apparent rate constant of ECS decay. The vH+ reflects the ΔpH dissipation rate, and vH+ can be replaced with JgH+ as follows (Equation (9)):
d(m × ECSN)/dt = k × Jf − JgH+.
The validity of vH+ = JgH+ is provided by the fact that the relationship between the two in a steady state is shown to be positive and linear, with an origin of zero (Figure 4B). This confirms that vH+ is equal to the H+ usage rate for the ATP regeneration required for photosynthesis and photorespiration. These results agree with the results of [32].
We could confirm that, in a steady state where [d(m × ECSN)/dt = 0], vH+ shows a positive linear relationship with the LEF rate, with an origin of zero (Figure 4A). These results agree with the results of [26]. Therefore, the fact that vH+ reflects JgH+ shows that the ATP consumed in photosynthesis and photorespiration can only be supplied by LEF; that is to say, the following relationship is proposed (Equation (10)):
k × Jf = m × gH+ × ECSN = JgH+.
Equation (4) shows that LEF activity links photosynthesis and photorespiration activity through ΔpH formation and dissipation. From these results (Equations (11) and (12)),
ECSN = (k × Jf)/(m × gH+),
= JgH+/(m × gH+).
Based on this model, we will discuss the molecular mechanism of P700 oxidation.
The primary causes of P700 oxidation under the hypoxic condition, in which only photosynthesis functions, can be explained as follows. Decreases in JgH+ gradually oxidized P700 (Figure 5A). However, the ECSN values remained the same (Figure 5B). Meanwhile, decreases in JgH+ lowered gH+ (Figure 5C). The ratio of the JgH+ decrease was equal to the ratio of the gH+ decrease. This is the reason that ECSN remained constant (equations (5) and (6)). We found that qL decreased along with decreases in JgH+ (Figure 5D). This shows that the PQ pool is reduced along with the lowering of Jf [48]. This may be the reason why RISE is induced [1,8,10,49]. RISE caused by PQ reduction induces P700 oxidation by lowering the activity of PQH2 oxidation of the Cyt b6/f complex.
Next, we attempted to elucidate how photorespiration contributes to the oxidation of P700 in PSI. In the photorespiratory situation under the normoxic condition, the decrease in JgH+ from 400 to 200 μmol H+ m−2 s−1 enhanced the increase in Y(ND) compared to the non-photorespiratory situation under the hypoxic condition (Figure 5A). ECSN also increased, which was due to the enhanced decrease in gH+, compared to the decrease in JgH+ (Figure 5C; Equation (6)). Furthermore, qL also decreased under the normoxic condition compared to the hypoxic condition (Figure 5D); that is, photorespiration oxidized P700 by photosynthetic control through ΔpH formation and RISE through PQ reduction.
In this study, we discovered important facts about photorespiration. Under the normoxic condition, the values of gH+ were lower compared to under the hypoxic condition, in the range of JgH+ from 250 to 400 μmol H+ m−2 s−1 (Figure 5C). This fact shows that the activity of ATP synthase might decrease under the normoxic condition. The detailed mechanism for this remains to be clarified.
When photorespiration functions, both gH+ and qL decrease, both of which induce photosynthetic control and RISE (Figure 5C,D). This contributes to the oxidation of P700 in PSI, as described above. On the other hand, we found suppressed rates of the ribulose-1,5-bisphosphate (RuBP) carboxylase reaction (vc) and RuBP oxygenase reaction (vo), catalyzed by RuBP carboxylase/oxygenase (Rubisco) (Figure 6). Following Rubisco kinetics, a decrease in Ci should cause an increase in vo [34,35,36]. The data in Figure 6 correspond to the results of Miyake and Yokota [31]. RISE has the potential to lower LEF activity while simultaneously contributing to P700 oxidation [8]. These facts show that the photosynthetic electron transport reaction, a light reaction, regulates both photosynthesis and photorespiration with the oxidation of P700 in PSI.

Supplementary Materials

The following are available online at https://www.mdpi.com/2223-7747/9/3/319/s1, Figure S1: Both ΔpH and ΔΨ which contribute to proton motive force (pmf), reflected as the total electrochromic shift (ECS) signal, were separately determined with ECS in Figure 3 following the method of Cruz et al. (2001), Figure S2: Relationships of Y(II), vH+, JgH+, ECS, and gH+ with (A + Rd), Figure S3: Dependence of Jf and JgH+ on Ci, and the relationship between JgH+ and Jf.

Author Contributions

S.W. and C.M. performed the experiments and data analysis; S.W., Y.S., and C.M. wrote the article; C.M. conceived the research plan and supervised the experiments. All authors have read and agreed to the published version of the manuscript.

Funding

This work was supported by JST CREST Grant Number JPMJCR1503, Japan.

Acknowledgments

The authors are thankful to MDPI for English language editing.

Conflicts of Interest

The author declares no conflict of interest.

References

  1. Shimakawa, G.; Miyake, C. Oxidation of P700 ensures robust photosynthesis. Front. Plant Sci. 2018, 9, 1617. [Google Scholar] [CrossRef] [Green Version]
  2. Asada, K. THE WATER-WATER CYCLE IN CHLOROPLASTS: Scavenging of Active Oxygens and Dissipation of Excess Photons. Annu. Rev. Plant Physiol. Plant Mol. Biol. 1999, 50, 601–639. [Google Scholar] [CrossRef] [PubMed]
  3. Sejima, T.; Takagi, D.; Fukayama, H.; Makino, A.; Miyake, C. Repetitive short-pulse light mainly inactivates photosystem I in sunflower leaves. Plant Cell Physiol. 2014, 55, 1184–1193. [Google Scholar] [CrossRef] [PubMed]
  4. Shimakawa, G.; Shaku, K.; Miyake, C. Oxidation of P700 in Photosystem I Is Essential for the Growth of Cyanobacteria. Plant Physiol. 2016, 172, 1443–1450. [Google Scholar] [CrossRef] [PubMed] [Green Version]
  5. Zivcak, M.; Brestic, M.; Kunderlikova, K.; Sytar, O.; Allakhverdiev, S.I. Repetitive light pulse-induced photoinhibition of photosystem I severely affects CO2 assimilation and photoprotection in wheat leaves. Photosynth Res. 2015, 126, 449–463. [Google Scholar] [CrossRef]
  6. Charepanov, D.A.; Milanovsky, G.E.; Petrova, A.A.; Tikhonov, A.N.; Semenov, A.Y. Electron transfer through the acceptor side of photosystem I: Interaction with exogenous acceptors and molecular oxygen. Biochemistry (Moscow) 2017, 82, 1249–1268. [Google Scholar] [CrossRef]
  7. Shimakawa, G.; Murakami, A.; Niwa, K.; Matsuda, Y.; Wada, A.; Miyake, C. Comparative analysis of strategies to prepare electron sinks in aquatic photoautotrophs. Photosynth Res. 2019, 139, 401–411. [Google Scholar] [CrossRef]
  8. Shaku, K.; Shimakawa, G.; Hashiguchi, M.; Miyake, C. Reduction-Induced Suppression of Electron Flow (RISE) in the Photosynthetic Electron Transport System of Synechococcus elongatus PCC 7942. Plant Cell Physiol. 2016, 57, 1443–1453. [Google Scholar] [CrossRef] [Green Version]
  9. Shimakawa, G.; Matsuda, Y.; Nakajima, K.; Tamoi, M.; Shigeoka, S.; Miyake, C. Diverse strategies of O2 usage for preventing photo-oxidative damage under CO2 limitation during algal photosynthesis. Sci. Rep. 2017, 7, 41022. [Google Scholar] [CrossRef] [Green Version]
  10. Shimakawa, G.; Shaku, K.; Miyake, C. Reduction-Induced Suppression of Electron Flow (RISE) Is Relieved by Non-ATP-Consuming Electron Flow in Synechococcus elongatus PCC 7942. Front. Microbiol. 2018, 9, 886. [Google Scholar] [CrossRef] [Green Version]
  11. Takagi, D.; Amako, K.; Hashiguchi, M.; Fukaki, H.; Ishizaki, K.; Goh, T.; Fukao, Y.; Sano, R.; Kurata, T.; Demura, T.; et al. Chloroplastic ATP synthase builds up a proton motive force preventing production of reactive oxygen species in photosystem I. Plant J. 2017, 91, 306–324. [Google Scholar] [CrossRef] [PubMed] [Green Version]
  12. Takagi, D.; Ishizaki, K.; Hanawa, H.; Mabuchi, T.; Shimakawa, G.; Yamamoto, H.; Miyake, C. Diversity of strategies for escaping reactive oxygen species production within photosystem I among land plants: P700 oxidation system is prerequisite for alleviating photoinhibition in photosystem I. Physiol. Plant 2017, 161, 56–74. [Google Scholar] [CrossRef] [PubMed]
  13. Golding, A.J.; Johnson, G.N. Down-regulation of linear and activation of cyclic electron transport during drought. Planta 2003, 218, 107–114. [Google Scholar] [CrossRef]
  14. Miyake, C.; Miyata, M.; Shinzaki, Y.; Tomizawa, K. CO2 response of cyclic electron flow around PSI (CEF-PSI) in tobacco leaves--relative electron fluxes through PSI and PSII determine the magnitude of non-photochemical quenching (NPQ) of Chl fluorescence. Plant Cell Physiol. 2005, 46, 629–637. [Google Scholar] [CrossRef] [PubMed]
  15. Harbinson, J.; Foyer, C.H. Relationships between the Efficiencies of Photosystems I and II and Stromal Redox State in CO2-Free Air: Evidence for Cyclic Electron Flow in Vivo. Plant Physiol. 1991, 97, 41–49. [Google Scholar] [CrossRef] [Green Version]
  16. Harbinson, J.; Genty, B.; Baker, N.R. Relationship between the Quantum Efficiencies of Photosystems I and II in Pea Leaves. Plant Physiol. 1989, 90, 1029–1034. [Google Scholar] [CrossRef] [Green Version]
  17. Harbinson, J.; Genty, B.; Baker, N.R. The relationship between CO2 assimilation and electron transport in leaves. Photosynth Res. 1990, 25, 213–224. [Google Scholar] [CrossRef]
  18. Harbinson, J.; Genty, B.; Foyer, C.H. Relationship between Photosynthetic Electron Transport and Stromal Enzyme Activity in Pea Leaves: Toward an Understanding of the Nature of Photosynthetic Control. Plant Physiol. 1990, 94, 545–553. [Google Scholar] [CrossRef] [Green Version]
  19. Harbinson, J.; Hedley, C.L. Changes in P-700 Oxidation during the Early Stages of the Induction of Photosynthesis. Plant Physiol. 1993, 103, 649–660. [Google Scholar] [CrossRef] [Green Version]
  20. Wada, S.; Takagi, D.; Miyake, C.; Makino, A.; Suzuki, Y. Responses of the Photosynthetic Electron Transport Reactions Stimulate the Oxidation of the Reaction Center Chlorophyll of Photosystem I, P700, under Drought and High Temperatures in Rice. Int. J. Mol. Sci. 2019, 20, 2068. [Google Scholar] [CrossRef] [Green Version]
  21. von Caemmerer, S. Biochemical Models of Leaf Photosynthesis; CSIRO Publishing: Collingwood, Australia, 2000. [Google Scholar]
  22. Baker, N.R.; Harbinson, J.; Kramer, D.M. Determining the limitations and regulation of photosynthetic energy transduction in leaves. Plant Cell Environ. 2007, 30, 1107–1125. [Google Scholar] [CrossRef] [PubMed]
  23. Klughammer, C.; Schreiber, U. An improved method, using saturating light pulses, for the determination of photosystem I quantum yield via P700+-absorbance changes at 830 nm. Planta 1994, 192, 261–268. [Google Scholar] [CrossRef]
  24. Tikhonov, A.N. The cytochrome b6f complex at the crossroad of photosynthetic electron transport pathways. Plant Physiol. Biochem. 2014, 81, 163–183. [Google Scholar] [CrossRef] [PubMed]
  25. Cruz, J.A.; Sacksteder, C.A.; Kanazawa, A.; Kramer, D.M. Contribution of electric field (Δψ) to steady-state transthylakoid proton motive force (pmf) in vitro and in vivo. control of pmf parsing into Δψ and ΔpH by ionic strength. Biochemistry 2001, 40, 1226–1237. [Google Scholar] [CrossRef] [PubMed]
  26. Avenson, T.J.; Cruz, J.A.; Kramer, D.M. Modulation of energy-dependent quenching of excitons in antennae of higher plants. Proc. Natl. Acad. Sci. USA 2004, 101, 5530–5535. [Google Scholar] [CrossRef] [Green Version]
  27. Klughammer, C.; Siebke, K.; Schreiber, U. Continuous ECS-indicated recording of the proton-motive charge flux in leaves. Photosynth Res. 2013, 117, 471–487. [Google Scholar] [CrossRef] [Green Version]
  28. Cornic, G.; Ghashghaie, J. Effect of temperature on net CO2 assimilation and photosystem II quantum yield of electron transfer of French bean (Phaseolus vulgaris L.) leaves during drought stress. Planta 1991, 185, 255–260. [Google Scholar] [CrossRef]
  29. Cornic, G.; Briantais, J.M. Partitioning of photosynthetic electron flow between CO2 and O2 reduction in a C3 leaf (Phaseolus vulgaris L.) at different CO2 concentrations and during drought stress. Planta 1991, 183, 178–184. [Google Scholar] [CrossRef]
  30. Genty, B.; Briantais, J.; Baker, N.R. The relationship between the quantum yield of photosynthetic electron transport and quenching of chlorophyll fluorescence. Biochim. Biophys. Acta 1989, 990, 87–92. [Google Scholar] [CrossRef]
  31. Miyake, C.; Yokota, A. Determination of the rate of photoreduction of O2 in the water-water cycle in watermelon leaves and enhancement of the rate by limitation of photosynthesis. Plant Cell Physiol. 2000, 41, 335–343. [Google Scholar] [CrossRef] [Green Version]
  32. Sejima, T.; Hanawa, H.; Shimakawa, G.; Takagi, D.; Suzuki, Y.; Fukayama, H.; Makino, A.; Miyake, C. Post-illumination transient O2-uptake is driven by photorespiration in tobacco leaves. Physiol. Plant 2016, 156, 227–238. [Google Scholar] [CrossRef] [PubMed]
  33. Seelert, H.; Poetsch, A.; Dencher, N.A.; Engel, A.; Stahlberg, H.; Muller, D.J. Structural biology. Proton-powered turbine of a plant motor. Nature 2000, 405, 418–419. [Google Scholar] [CrossRef] [PubMed]
  34. Farquhar, G.D. Models describing the kinetics of ribulose biphosphate carboxylase-oxygenase. Arch. Biochem. Biophys. 1979, 193, 456–468. [Google Scholar] [CrossRef]
  35. Farquhar, G.D.; von Caemmerer, S.; Berry, J.A. A biochemical model of photosynthetic CO2 assimilation in leaves of C3 species. Planta 1980, 149, 78–90. [Google Scholar] [CrossRef] [PubMed] [Green Version]
  36. Farquhar, G.D.; von Caemmerer, S.; Berry, J.A. Models of photosynthesis. Plant Physiol. 2001, 125, 42–45. [Google Scholar] [CrossRef] [Green Version]
  37. Miyake, C.; Amako, K.; Shiraishi, N.; Sugimoto, T. Acclimation of tobacco leaves to high light intensity drives the plastoquinone oxidation system--relationship among the fraction of open PSII centers, non-photochemical quenching of Chl fluorescence and the maximum quantum yield of PSII in the dark. Plant Cell Physiol. 2009, 50, 730–743. [Google Scholar] [CrossRef]
  38. Kadota, K.; Furutani, R.; Makino, A.; Suzuki, Y.; Wada, S.; Miyake, C. Oxidation of P700 Induces Alternative Electron Flow in Photosystem I in Wheat Leaves. Plants 2019, 8, 152. [Google Scholar] [CrossRef] [Green Version]
  39. Ruuska, S.A.; Badger, M.R.; Andrews, T.J.; von Caemmerer, S. Photosynthetic electron sinks in transgenic tobacco with reduced amounts of Rubisco: Little evidence for significant Mehler reaction. J. Exp. Bot. 2000, 51, 357–368. [Google Scholar] [CrossRef] [Green Version]
  40. Munekage, Y.; Hojo, M.; Meurer, J.; Endo, T.; Tasaka, M.; Shikanai, T. PGR5 is involved in cyclic electron flow around photosystem I and is essential for photoprotection in Arabidopsis. Cell 2002, 110, 361–371. [Google Scholar] [CrossRef] [Green Version]
  41. Shikanai, T. Regulatory network of proton motive force: Contribution of cyclic electron transport around photosystem I. Photosynth Res. 2016, 129, 253–260. [Google Scholar] [CrossRef]
  42. Shikanai, T.; Yamamoto, H. Contribution of Cyclic and Pseudo-Cyclic Electron Transport to the Formation of Proton Motive Force in Chloroplasts. Mol. Plant 2017, 10, 20–29. [Google Scholar] [CrossRef] [PubMed] [Green Version]
  43. Yamamoto, H.; Shikanai, T. PGR5-Dependent Cyclic Electron Flow Protects Photosystem I under Fluctuating Light at Donor and Acceptor Sides. Plant Physiol. 2019, 179, 588–600. [Google Scholar] [CrossRef] [PubMed] [Green Version]
  44. Yamamoto, H.; Takahashi, S.; Badger, M.R.; Shikanai, T. Artificial remodelling of alternative electron flow by flavodiiron proteins in Arabidopsis. Nat. Plants 2016, 2, 16012. [Google Scholar] [CrossRef] [PubMed]
  45. Yamori, W.; Shikanai, T. Physiological Functions of Cyclic Electron Transport Around Photosystem I in Sustaining Photosynthesis and Plant Growth. Annu. Rev. Plant Biol. 2016, 67, 81–106. [Google Scholar] [CrossRef]
  46. Yamori, W.; Makino, A.; Shikanai, T. A physiological role of cyclic electron transport around photosystem I in sustaining photosynthesis under fluctuating light in rice. Sci. Rep. 2016, 6, 20147. [Google Scholar] [CrossRef] [Green Version]
  47. Kramer, D.M.; Avenson, T.J.; Edwards, G.E. Dynamic flexibility in the light reactions of photosynthesis governed by both electron and proton transfer reactions. Trends Plant Sci. 2004, 9, 349–357. [Google Scholar] [CrossRef]
  48. Shimakawa, G.; Miyake, C. Changing frequency of fluctuating light reveals the molecular mechanism for P700 oxidation in plant leaves. Plant Direct 2018, 2, e00073. [Google Scholar] [CrossRef] [Green Version]
  49. Zhang, M.M.; Fan, D.Y.; Murakami, K.; Badger, M.R.; Sun, G.Y.; Chow, W.S. Partially dissecting electron fluxes in both photosystems in spinach leaf discs during photosynthetic induction. Plant Cell Physiol. 2019. [Google Scholar] [CrossRef]
Figure 1. Influence of the partial pressure of O2 on the photosynthesis rate and chlorophyll (Chl) fluorescence parameters as a function of the partial pressure of intercellular CO2 (Ci) in wheat leaves. Photosynthesis rates (A) were measured at 21 and 2 kPa O2, at 500 µmol photons m−2 s−1, simultaneously with the measurement of the effective quantum yield of photosystem II (PSII) (Y(II)) (B), the photochemical quenching of Chl fluorescence, the QA oxidized state (qL) (C), and the non-photochemical quenching (NPQ) of Chl fluorescence (D). Data were obtained from three independent experiments using leaves attached to three wheat plants (N = 3: sample 1, circle; 2, square; 3, triangle). The ambient partial pressures of CO2 were changed from 100 to 5 through 80, 60, 40, 30, 20, and 10 Pa at 21 and 2 kPa O2 for the same leaves. Closed symbols, 21 kPa O2; open symbols, 2 kPa O2. Lines in the graphs were arbitrarily drawn to indicate the trends of the data.
Plants 09 00319 g001
Figure 2. Influence of the partial pressure of O2 on the redox state of P700 in PSI as a function of the partial pressure of intercellular CO2 (Ci) in wheat leaves. The effective quantum yield of photosystem I (PSI) (Y(I)) (A), the oxidized state of P700 (Y(ND)) (B), and the excited state of P700 (Y(NA)) (C) were simultaneously measured with the photosynthesis rate and chlorophyll fluorescence yield measurements. Y(I) + (ND) + Y(NA) = 1. Data were obtained from three independent experiments using leaves attached to three wheat plants (N = 3: sample 1, circle; 2, square; 3, triangle). The ambient partial pressures of CO2 were changed from 100 to 5 through 80, 60, 40, 30, 20, and 10 Pa at 21 and 2 kPa O2 for the same leaves. Closed symbols, 21 kPa O2; open symbols, 2 kPa O2. Lines in the graphs were arbitrarily drawn to indicate the trends of the data.
Plants 09 00319 g002
Figure 3. Influence of the partial pressure of O2 on the parameters of proton motive force reflected as an electrochromic shift (ECS) signal, H+ conductance (gH+), and the ECS decay rate (vH+) due to CO2 fixation and photorespiration as a function of the partial pressure of intercellular CO2 (Ci) in wheat leaves. Photosynthesis rates (A) were measured at 21 and 2 kPa O2, at 500 µmol photons m−2 s−1, simultaneously with the measurements of electrochromic shift (ECSN) (B), H+ conductance (gH+) (C), and the ECS decay rate (vH+) (D). Data were from three independent experiments using leaves attached to three wheat plants (N = 3: sample 1, circle; 2, square; 3, triangle). The ambient partial pressures of CO2 were changed from 100 to 5 through 80, 60, 40, 30, 20, and 10 Pa at 21 and 2 kPa O2 for the same leaves. Closed symbols, 21 kPa O2; open symbols, 2 kPa O2. Lines in the graphs were arbitrarily drawn to indicate the trends of the data.
Plants 09 00319 g003
Figure 4. Relationships between the ECS decay rate (vH+) and the electron flux in photosynthetic linear electron flow (Jf), reflected as α × Y(II) × PFD, and between vH+ and the H+ consumption rate (JgH+). The data for vH+, Jf, and JgH+ were obtained from Figure S2 (see further details in the text). (A) vH+ was plotted against Jf. (B) vH+ was plotted against JgH+. Closed symbols, 21 kPa O2; open symbols, 2 kPa O2. Lines in the graphs were arbitrarily drawn to indicate the trends of the data.
Plants 09 00319 g004
Figure 5. Relationships between Y(ND) and JgH+, ECS and JgH+, gH+ and JgH+, qL and JgH+, Y(I) and JgH+, and Y(NA) and JgH+. The data for each parameter were taken from Figure 1, Figure 2 and Figure 3, and Figure S3 (see further details in the text). (A) Y(ND), (B) ECSN, (C) gH+, (D) qL, (E) Y(I), and (F) Y(NA) were plotted against JgH+ at 21 and 2 kPa O2. Closed symbols, 21 kPa O2; open symbols, 2 kPa O2. Lines in the graphs were arbitrarily drawn to indicate the trends of the data.
Plants 09 00319 g005
Figure 6. Influence of the intercellular partial pressure of CO2 (Ci) on both the ribulose 1,5-bisphosphate (RuBP) carboxylase reaction rate (vc) and the RuBP oxygenase reaction rate (vo) in wheat leaves. Photosynthesis rates were measured at 21 and 2 kPa O2, at 500 µmol photons m−2 s−1, simultaneously with the measurement of chlorophyll fluorescence. Both vc and vo were estimated from the photosynthesis rates and the values of Y(II) [21]. Data were obtained from Figure 1 (sample 1, circle; 2, square; 3, triangle). (A) Both vc and vo were plotted against Ci at 21 kPa O2. Closed symbols, vc; open symbols, vo. (B) Both vc and vo were plotted against Ci at 2 kPa O2. Closed symbols, vc; open symbols, vo. (C) The values of vo/vc at 21 kPa O2 were plotted against Ci. Lines in the graphs were arbitrarily drawn to indicate the trends of the data.
Plants 09 00319 g006

