Article

Physiological Performance of Pyrus pyraster L. (Burgsd.) and Sorbus torminalis (L.) Crantz Seedlings under Drought Treatment

1
Faculty of Horticulture and Landscape Engineering, Slovak University of Agriculture, 949 76 Nitra, Slovakia
2
Faculty of European Studies and Regional Development, Slovak University of Agriculture, 949 76 Nitra, Slovakia
*
Author to whom correspondence should be addressed.
Plants 2020, 9(11), 1496; https://doi.org/10.3390/plants9111496
Submission received: 8 October 2020 / Revised: 30 October 2020 / Accepted: 1 November 2020 / Published: 5 November 2020
(This article belongs to the Special Issue Plant Acclimatization to Abiotic Stress)

Abstract

:
In this study, seedlings of Pyrus pyraster and Sorbus torminalis were grown for 60 days in the regulated environment of a growth chamber under different water regimes. The measured indicators were the growth and distribution of mass to organs, total biomass, root to shoot mass ratio (R:S), and gas exchange parameters (gs, E, An, and water use efficiency (WUE)). The amount of total biomass was negatively affected by drought. Differences between species were confirmed only for the dry matter of the leaves. P. pyraster maintained the ratio of the mass distribution between belowground and aboveground organs in both variants of the water regime. S. torminalis created more root length for a given dry-mass under drought treatment, but its R:S was lower compared to P. pyraster. The water potential of the leaves (Ψwl) was affected by substrate saturation and interspecific differences. P. pyraster had a demonstrably higher water potential and maintained this difference even after prolonged exposure to drought. After 30 days of different water regimes, Pyrus maintained higher values of gs, An, and E in control and drought treatments, but over a longer period of drought (after 50 days), the differences between species were equalized. The changes of the leaf gas exchange for Pyrus were accompanied by a significant increase in WUE, which was most pronounced on the 40th day of the experiment. A significant and strong relationship between WUE and gs was demonstrated. The results confirmed the different physiological performances of seedlings of tree species and the different mechanisms of their response to water scarcity during drought treatment. P. pyraster presented more acclimation traits, which allowed this taxon to exhibit better performance over a longer period of water scarcity.

1. Introduction

The increasing frequency of drought events in Central Europe has adverse effects on tree life, reducing the biodiversity and ecological value of the ecosystems. In particular, tree seedlings with a shallow or undeveloped root system suffer and often die from drought [1,2,3]. Therefore, species with higher resistance to drought, which maintain higher productivity and intensive photosynthesis even under a lack of water, receive attention especially in locations which are prone to drought. The identification of such species is important as climate change is expected to increase the number of drought-prone areas worldwide [4,5].
Drought reduces plant productivity [6]; therefore, measurable indicators need to be defined as well as quantified to reveal the effects of drought on plants. Drought-tolerant trees are able to withstand short-term fluctuations in water supply as a result of their physiological and metabolic functions. According to Kunz et al. [7], resistance is the ability of plants to withstand stress and can be quantified as the ratio between their physiological performance during drought and under normal conditions without drought stress. Gregory et al. [8] and Gebrekirstos et al. [9] characterize resistance by the time course of three physiological processes: the rate of photosynthesis (An), rate of transpiration (E), and stomatal conductivity (gs).
Klein [10] considers stomatal conductivity (gs) and leaf water potential (Ψwl) to be key characteristics for understanding plant functions under changing climatic conditions. The experimental and theoretical basis of the stomatal conductivity (gs) model and indicators of the leaf and stand water regime were provided by Tardieau and Davies, [11]. Hammer et al. [12] consider the Tardieau–Davies model suitable for the evaluation of the mentioned relationships and their consequences in short-term and long-term intervals in a given climate scenario.
Water use efficiency (WUE) is used to analyze the influence of environmental factors and structural and functional traits of plants, as well as to optimize the relationship between dry matter production and water consumption. It is the ratio of the rate of photosynthesis and rate of transpiration (An/E) and refers to the gas exchange of assimilation organs over a short period of time. The WUE for carbon assimilation needs to be studied at the leaf level along with responses to physical environmental factors. Hatfield and Dold [13] predict that WUE will increase as a result of climate change. According to their data, it will be necessary to identify genotypes that are capable of intensive carbon assimilation even under conditions of water stress. To understand the impact of climate change on WUE, we need to determine the impact of drought on the growth and use of water under controlled conditions. Furthermore, it is important to determine the interactions of the physical and biological factors of genotypes that are able to use water more efficiently without significant costs for photosynthesis.
Knowledge of the parameters of physiological performance of young trees is important for further study of the physiological mechanisms regulating utilization and management of water. It is important also for the economic analysis of the tree ability survive/withstand drought events. The quantitative description of the relationships between the physiological processes and environmental factors provides the background for creation of the ecological models describing acclimation and adaptive behavior of plants [14]. These models and simulations composed of the ecophysiological measurements will also be used for prognosis and planning of the natural ecosystem’s recovery after disturbance.
In the natural conditions, the study of woody plants responses to extreme climatic events (drought) can be difficult, due to the large species, ontogenetic and age heterogeneity of their communities. The field measurements of the eco-physiological parameters should be supplemented by experiments held under regulated and controlled conditions, where is possible to obtain reproducible data and identify the limit values of the investigated factors.
Changing environmental conditions have significant impact on the growth and survival of woody plants in both, natural and urban environments. The identification of adaptable species that are able survive under longer periods of drought is essential for sustainability of the biomass production and environmental benefits of woody plants in the context of climate change. The subjects of the presented research are tree species, Pyrus pyraster L. (Burgsd.) and Sorbus torminalis (L.) Crantz, which belong to the natural European Flora; both studied species are considered to be light-demanding woody plants [15,16,17,18,19,20] which can grow even on sites with periodic drought events [15,18,19,20].
S. torminalis is considered to be a submediterranean species [21,22]. It requires a warm climate specific to oak-dominated forests (Quercetalia pubescentis, Quercetalia robori-petraeae, Querco robori-Carpinenion betuli) and beech forests on calcareous stands (Cephalanthero-Fagenion). S. torminalis prefers rich, deep, and fresh soils which are continuously supplied with water [19,23]; however, it also grows in locations influenced by a short-term water deficit in soils [20]. According to the findings of Wilhelm [24], S. torminalis is more tolerant to shading than P. pyraster.
P. pyraster is the native pear species in central Europe distributed across a large area within the temperate zone [25,26]. The wild Pyrus species grow also in more xeric Mediterranean or steppe environment [27]. Due to the high light demands, P. pyraster occurs in rather extreme or marginal site conditions, where competition with other tree species is weakened [28]. This taxon grows on almost all soil types, except for extremely acidic soil. Its quite deep tap root system permits successful growth on very dry soils [18]. According to the Ellenberg’s moisture scheme P. pyraster has quite wide ecological amplitude [29]. This taxon is tolerant to short-term flooding and appears in the communities of hardwood floodplain forests (Ulmeto-Quercetum) [30,31].
The purpose of the presented study was to determine the physiological performance of the above-ground and underground organs of two juvenile tree species P. pyraster and S. torminalis in conditions of water scarcity. We assume that it is a local stress affecting the plant roots. Therefore, it was of interest to investigate (1) how will change the physiological performance of the aboveground organs (parameters gs, An, E, RWC and Ψwl) of the studied taxa in relation to the documented interspecies variability; (2) whether expected differences in the physiological performance of the studied species will have impact on their growth and biomass production; (3) whether obtained findings can be applied for selection of the tree species more resilient to climate change?
The aims of study were (1) to quantify the physiological performance of the juvenile plants of P. pyraster and S. torminalis under drought conditions; (2) to determine the effect of drought events on seedling growth, parameters of photosynthesis and transpiration of the studied taxa; (3) to verify the relationship between Ψwl, An, E and gs of the leaves of experimental plants.

2. Material and Methods

2.1. Plant Material

S. tominalis inhabits mostly horizontal terrains or sun-facing (south, south-west, and south-east) slopes [19,32,33]. The majority of sites with S. torminalis have been found at lower altitudes of 200–450 m. The majority of stands with P. pyraster have been found at altitudes up to 500 m [18]; however, P. pyraster appears also in cold climates in the mountain areas and can be found at altitudes up to 1400 m.
The plants used in the experiment were grown from seeds collected from locations in Slovakia and in Czech Republic; the characteristics are given in Table 1. The selected provenances represent optimum growth conditions of the studied taxa within their natural area of distribution in Central Europe; the climatic conditions of their stands are rather similar. The seeds were extracted manually after harvest and subjected to a cold stratification treatment outdoors for 90 days with temperatures ranging from −10 °C to +5 °C.
Seeds were germinated in plastic plates filled with the peat-based sowing substrate (pH of 5.5–6.5, enriched with nutrients 0.5 kg/m3 NPK ratio 12:14:24) in a cold greenhouse under natural light conditions with temperatures ranging between 5–15 °C. The growth rates of P. pyraster and S. torminalis juvenile plants are different; therefore, plants of both taxa were selected for experiment at the time when they reached principal growth stage 1: leaf development, after the cotyledons have been completely unfolded (BBCH10) according to the BBCH-scale [35].
During the phenological growth stage ”cotyledons completely unfolded”, the seedlings were placed in plastic pots (90 mm in diameter, volume 0.47 L) with a fertilized peat-based growth substrate (20% black peat and 80% white peat moss, 0–5 mm fraction, pH of 5.5–6.5, enriched with nutrients 1.0 kg/m3 NPK 14:16:18). Each pot was placed in the plastic bag to avoid uncontrolled water leakage.
At the beginning of the experiment, the plant biomass per unit rooting volume was calculated for both species to avoid the risk of pot size having an effect on growth. According to the findings of Poorter et al [36], the plant biomass to pot volume should not be larger than 2 g·L−1; thus, the plant biomass to pot volume ratio was calculated for P. pyraster (0.89 g·L−1), as well as for S. torminalis (1.06 g·L−1).

2.2. Experimental Design

The experimental plants were cultivated in different water regimes, where drought was considered as 40% water according to the weight of the fully saturated substrate, and the control condition was considered as 80% water according to the weight of the fully saturated substrate. The water content in the growth substrate was calculated based on wet weight [37].
M n = W w W d W w × 100
  • Mn = moisture content (%) of material n
  • Ww = wet weight of the sample
  • Wd = weight of the sample after drying
The different water regimes (drought and control) were maintained by regularly weighing the pots on a precision industrial scale (Kern & Sohn GmbH, Balingen Germany) with laboratory accuracy (max = 8000 g, standard deviation = 0.05 g) at 2-day intervals. There were 12 replications for each substrate saturation level.
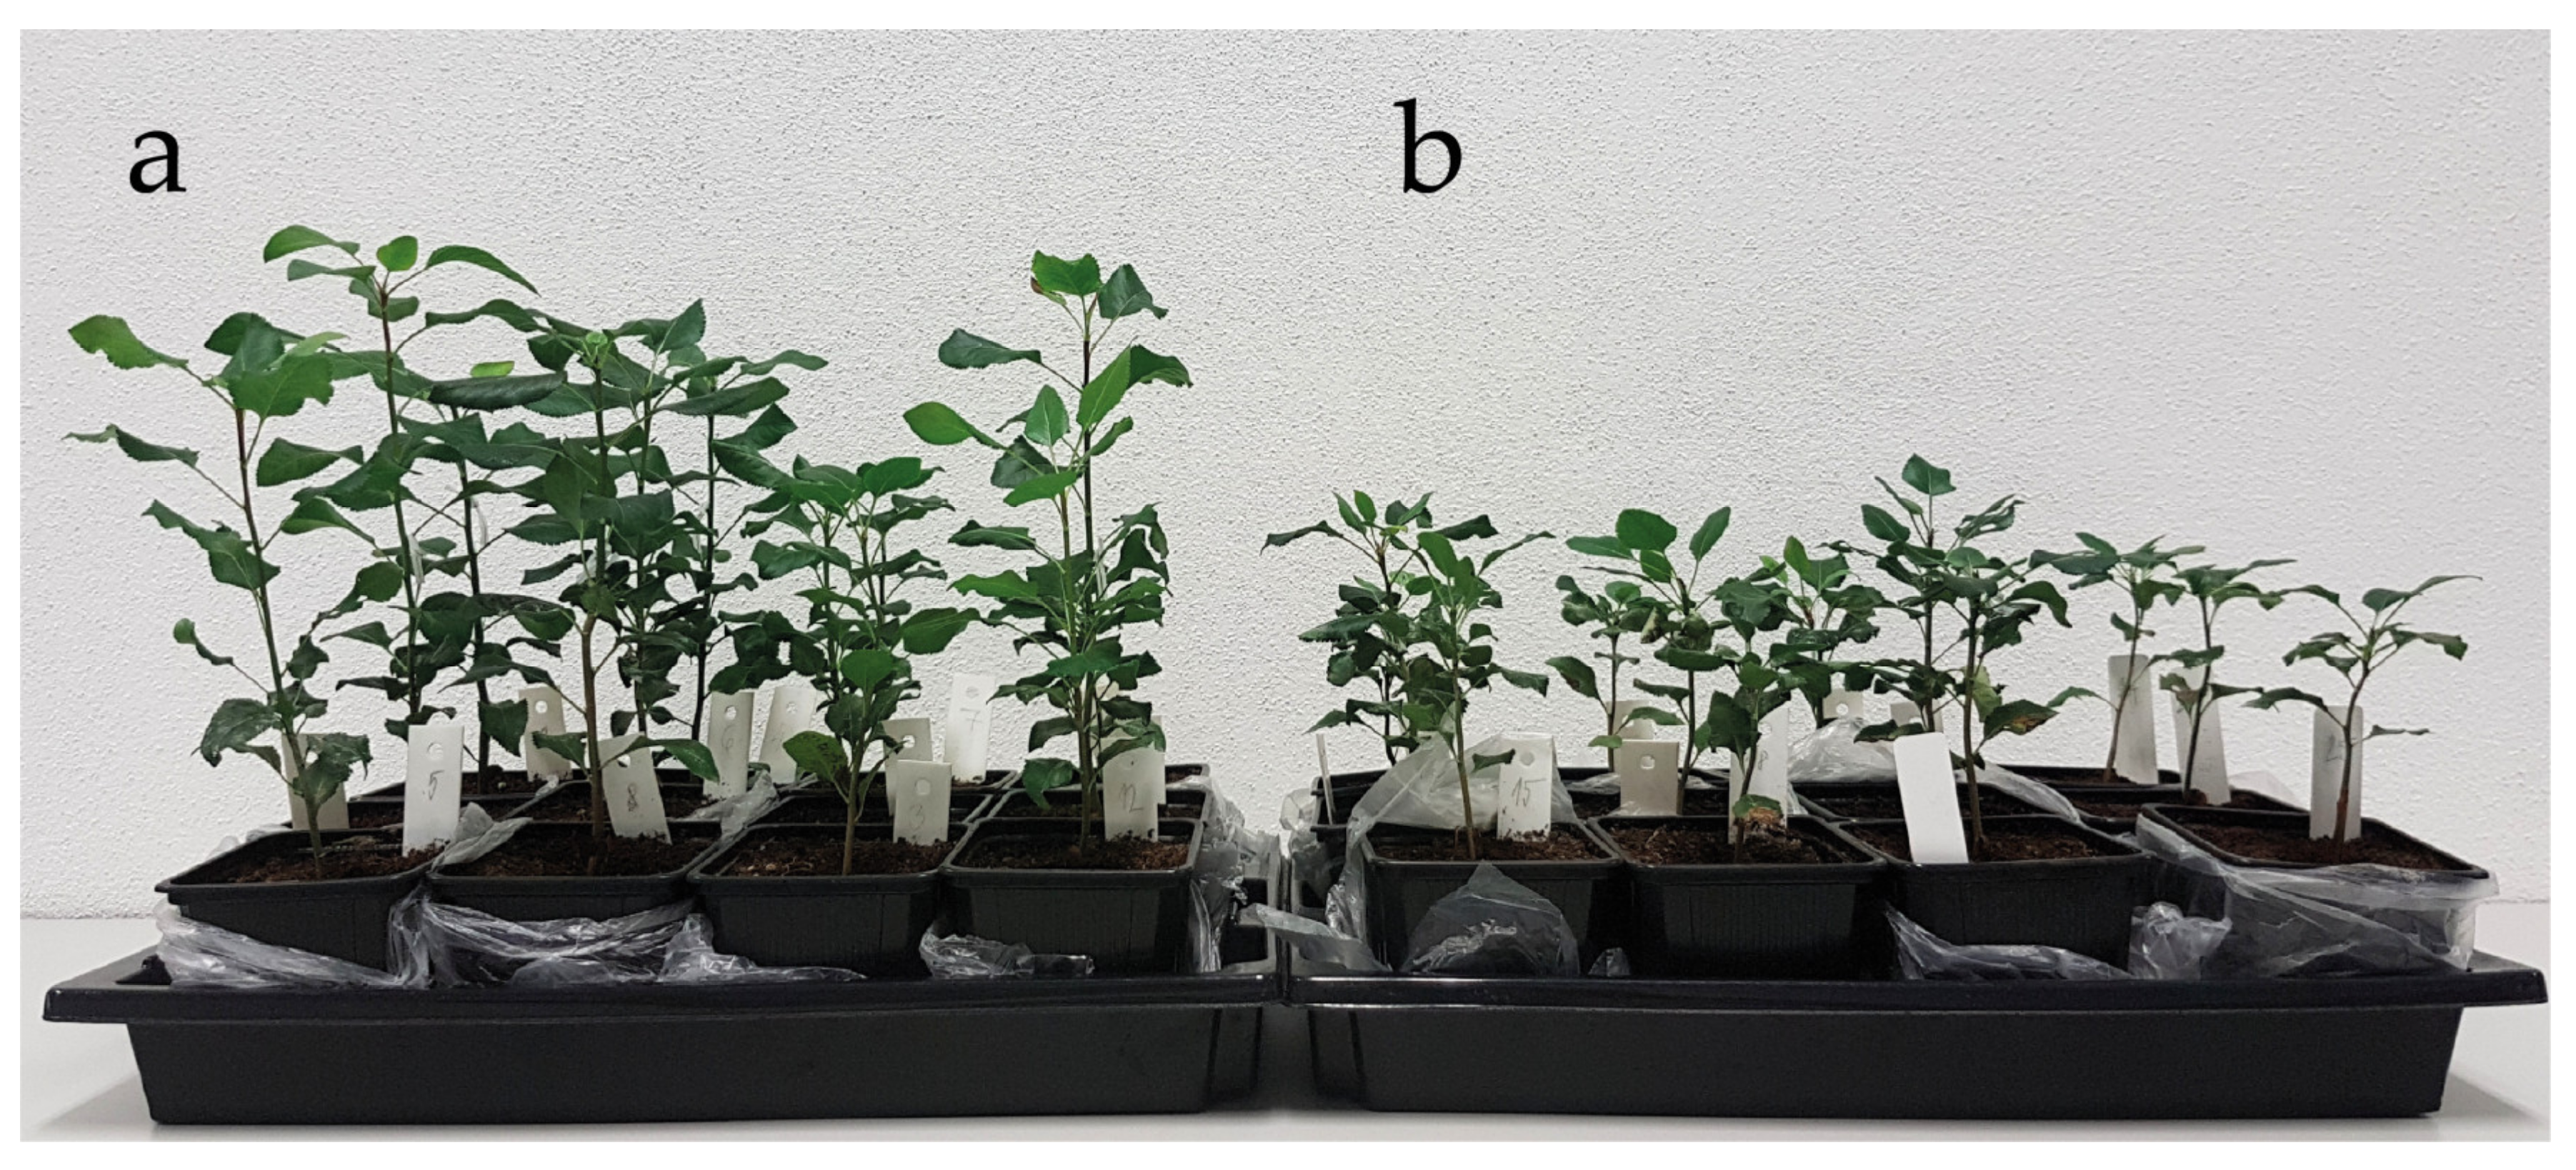
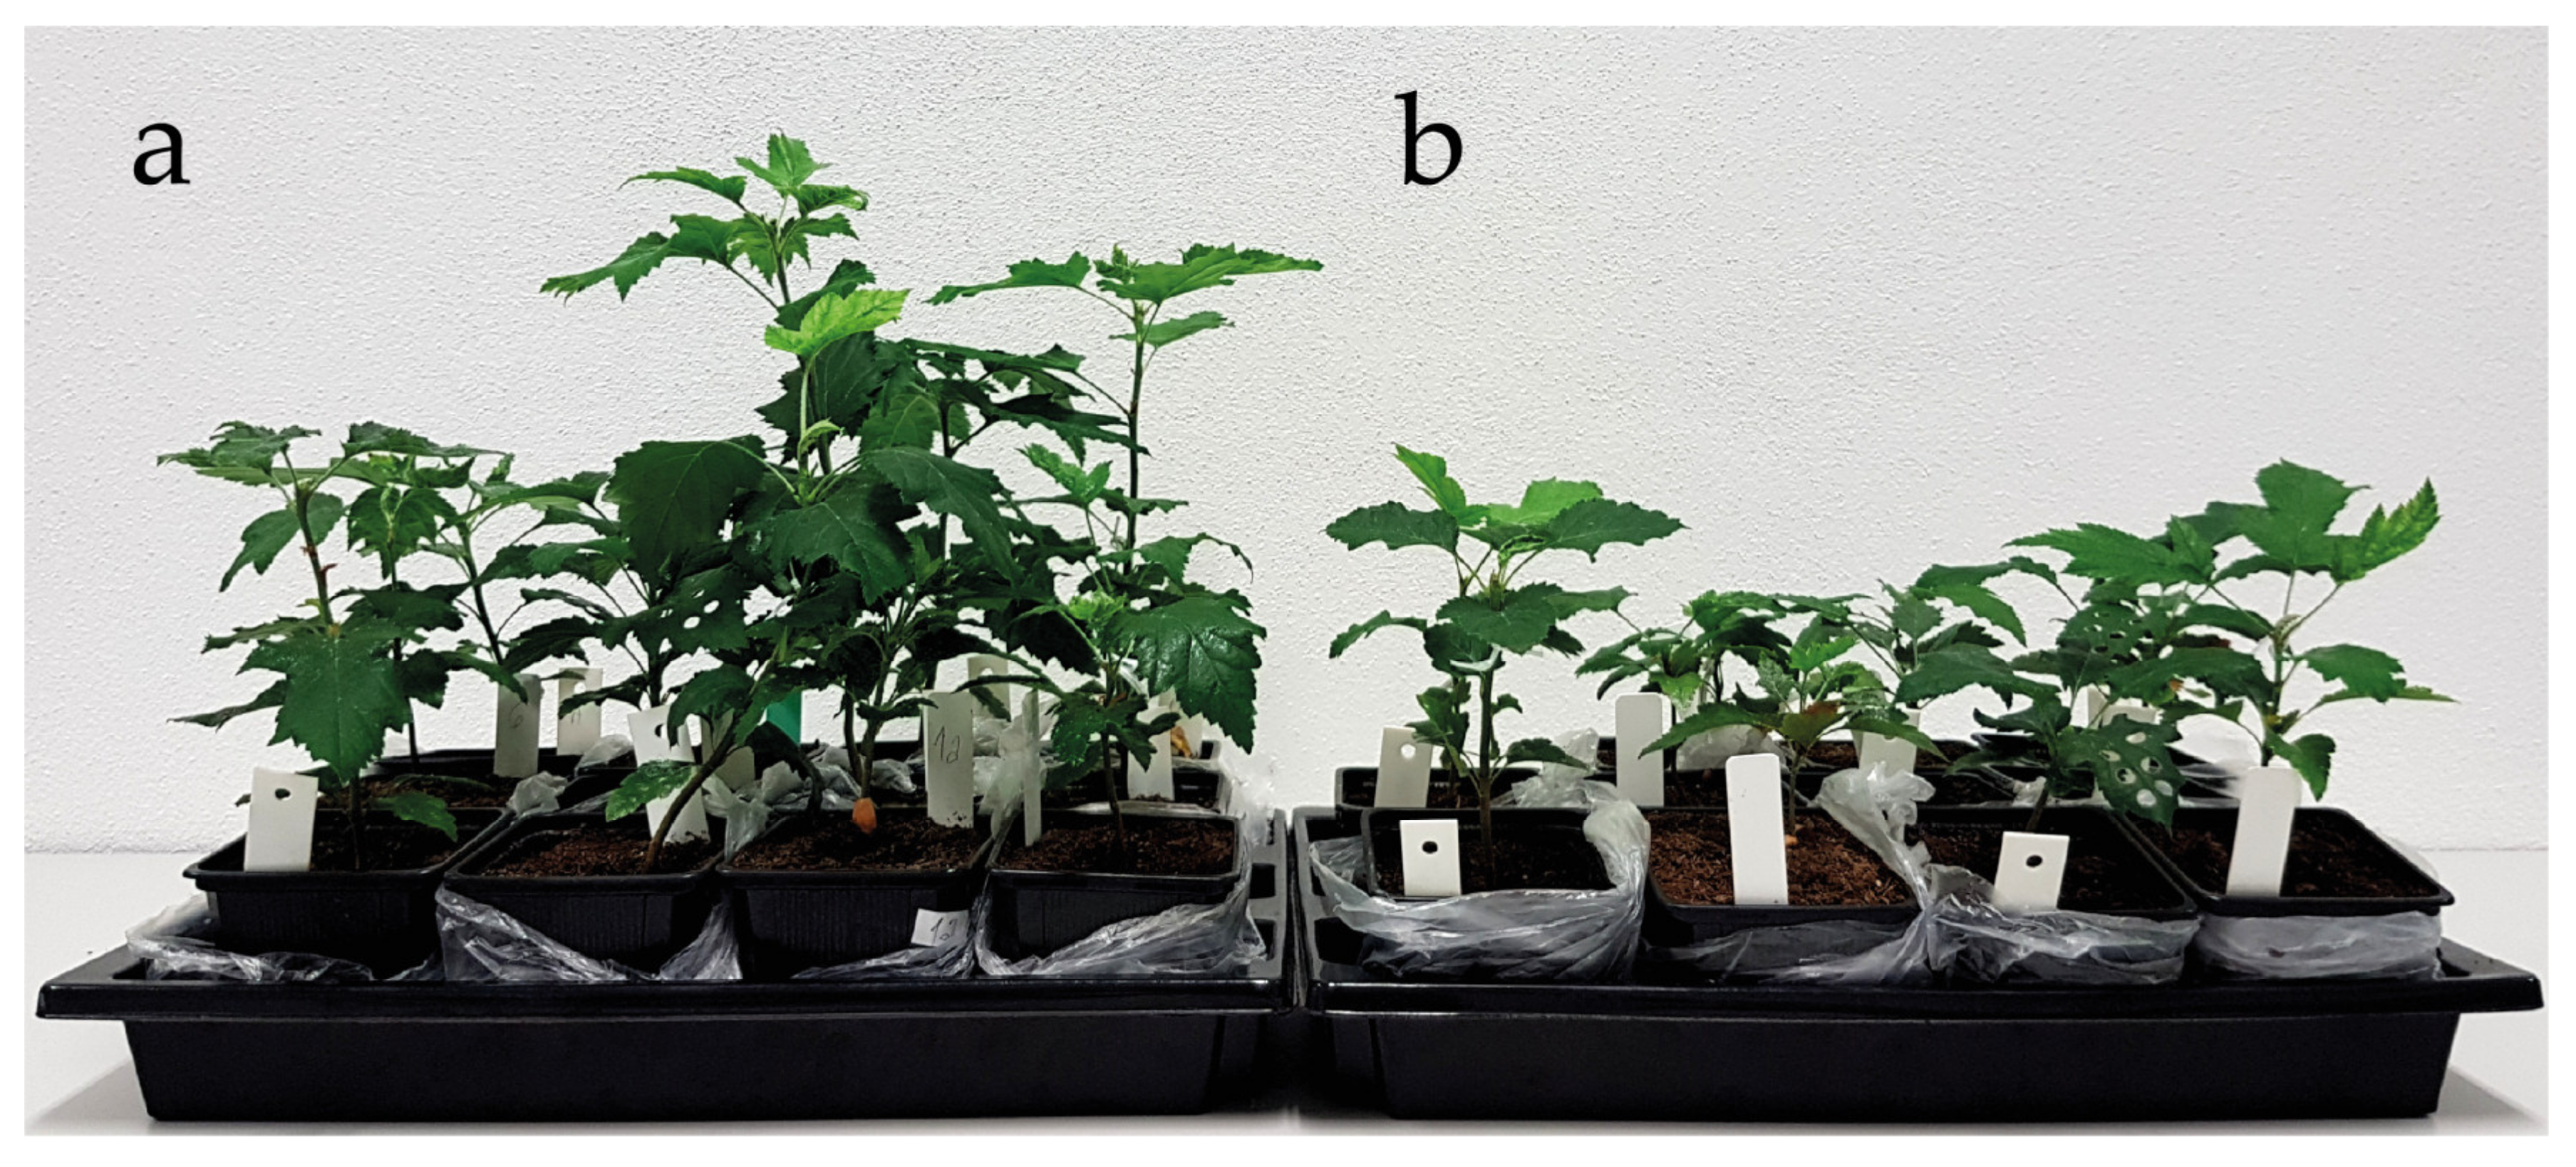
After 14 days of acclimatization (Figure 1), the plants were maintained under different water regimes for 60 days from May to July in the growth chamber PolEko KK1450. The photoperiod of the growth chamber was set to 14/10 h; the irradiation density on the surface of the uppermost leaves was 202.5 μmol m−2·s−1. Air humidity was 65%, and the temperature was maintained at 22 °C during the light period and 14 °C during the dark period. The plants were randomly placed and rotated within the chamber once a week in order to avoid a potential within-chamber effect [38,39].
Measurements of leaf gas exchange were carried out at the 30th, 40th, and 50th day of the experiment. Water potential measurements were performed at the 40th and 50th day of the experiment. Earlier measurements were not feasible due the small size of the seedlings. The measurements of morphometric traits, as well as the determination of the biomass distribution in the plant organs, were performed at the end of the experiment.

2.3. Measurement and Analysis of Plant Parameters

The total fresh mass of all individuals was determined before seedlings were planted in the pots and also at the end of the experiment. Before weighing, the plant roots were gently extracted from the growth substrate by hand and carefully washed to minimize fine root loss.
The WinRhizo REG 2009 system (Regent Instruments, Québec, QC, Canada, SK0410192) was used for the measurement of the root length (mm). The length of the primary stem of the experimental plants was also measured, and the total leaf area (LA) was determined by scanning fresh leaves using ImageJ software.
The dry weight of the plant organs was determined after the plant material was dried at 105 °C until it reached a constant weight. Other parameters calculated were the leaf water content (LWC), the specific root length (SRL), the specific leaf area (SLA), and the root to shoot ratio (R:S). SLA was calculated as the ratio of leaf area to leaf dry mass [40].

2.4. Leaf Gas Exchange

The net photosynthetic rate (An), stomatal conductance (gs), transpiration rate (E), and water use efficiency (WUE) were measured, beginning 30 days after the initiation of the different water regimes and then twice at 10-day intervals. The measurements were performed using the gasometer CIRAS-3 (PP-systems, Amesbury, MA, USA) attached to a PLC3 universal leaf cuvette fitted with a 1.75 cm2 measurement window, on the fully expanded leaf for each plant on the upper part of the seedling. The determination of leaf gas exchange was performed between 8 a.m. and 11 a.m. The molar flow rate of air entering the leaf chamber was kept constant at 300 cm3·min−1. The average leaf temperature was maintained near 26 °C (±0.26 °C SD), the vapor partial pressure deficit was 1.38 ± 0.25 kPa, the photosynthetically active radiation (PAR) was kept constant at 250 μmol·m−2·s−1, and the CO2 concentration was kept constant at 400 µmol·mol−1. Upon clumping the leaf in the cuvette, measurements were taken after the full stabilization of An and gs, which took up to 5 min. The actual measurement of leaf gas exchange lasted for 5 min per seedling.

2.5. Leaf Water Potential and Relative Water Content

The water potential of the leaf tissues (Ψwl) was determined by psychrometric measurement performed by Wescor (model Psypro, EliTech Incc, Logan, UT, USA) using a C-52 sample chamber at an ambient temperature of 21 °C. The water potential of leaf tissue was measured on the fifth leaf in the central part of the experimental plants. The leaf samples were taken from three plants of each taxon in each of the two variants of water regime. The measurements were performed at the 40th and 50th day of experiment from 7 a.m. to 4 p.m. in three replicates for each taxon and water regime. Data were analyzed by a multifactor analysis of variance (ANOVA) to detect significant factors (water regime/taxon) influencing water potential.
Relative water content (RWC; %) was determined by gravimetric method according to Barrs and Weatherley [41] with 4 h saturation of leaf samples in water at 4 °C in the dark. RWC was calculated as: RWC = [(FW − DW)/(SW − DW)] × 100, where FW is fresh weight, DW is dry weight and SW is the weight after full saturation of leaf samples.

2.6. Statistical Analysis

Mathematical and statistical data analysis was performed using the Statgraphics Centurion XVII software (StatPoint Technologies, Warrenton, VA, USA, XVIII, license number: B480-E10A-00EA-P00S-60PO).
Analyses of normality and homogeneity of variance for all variables were performed with Shapiro–Wilk’s test (at significance level of α = 0.001) and Leven’s test (at significance level of α = 0.05). Grubbs’ test was used to detect and remove single outliers in the experimental data set. Variables that did not fulfil the requirements for an analysis of variance were log transformed.
The parameters of the plant organs were analyzed with a two-way analysis of variance (ANOVA) assuming the level of growth of substrate saturation (drought and control) and tree species as fixed effects. Differences within treatments and tree species were subsequently tested with the Tukey honest significant difference (HSD) test.
The repeated measurements of the leaf gas exchange and water potential of the leaf tissues were conducted periodically on the 30th, 40th, and 50th day of drought treatment. The leaf gas exchange and water potential of leaf tissues were analyzed using a multifactor analysis of variance with the species, treatment, and duration of experiment as fixed factors. Differences within treatments, tree species, and measurements were subsequently tested with the Tukey HSD test at significance levels of 0.05 and 0.01.

3. Results

3.1. Growth and Biomass Allocation in the Plant Organs

In the juvenile stage of growth, the studied tree species differed in terms of the mass formation and allocation in the plant organs (Table 2). Compared to P. pyraster, S. torminalis had larger leaf area, and higher values of root length and specific root length. It maintained higher values of SRL and LA parameters even during drought treatment. P. pyraster had significantly higher stem increment and stem length (Figure 2 and Figure 3) and invested more to root growth (higher R:S), even under drought treatment. Under a lack of water, P. pyraster formed thicker leaves (SLA = 16.45 mm2·mg−1).
The biomass formation was negatively affected by drought in both species: P. pyraster (−44%), S. torminalis (−54%). The interspecific differences were not confirmed for the total biomass (Table 2), only for the dry weight of leaves (DWL). S. torminalis accumulated more dry mass in the leaves in control conditions (+56%) as well as under drought treatment (+38%). P. pyraster, which has high demands on light, presented intensive stem growth already in the juvenile stage of growth and, compared to S. torminalis, allocated more dry mass in the root (higher R:S values). S. torminalis created more root length for a given dry-mass investment (SRL) in control conditions, as well as under drought treatment (Table 2).

3.2. Leaf Gas Exchange

Significant differences between P. pyraster and S. torminalis were identified in all leaf gas exchange parameters based on the results of the multifactor ANOVA. We also tested the impacts of the treatment (regime) and duration of experiment (measurement) as fixed factors. The null hypothesis was adopted for An under different treatments (regimes). The duration of the experiment with the drought treatment of the seedlings had a significant impact on all studied leaf gas exchange parameters except An. Quantitative data analyses were performed, including multiple comparisons of means using Tukey’s HSD procedure (Table 3).
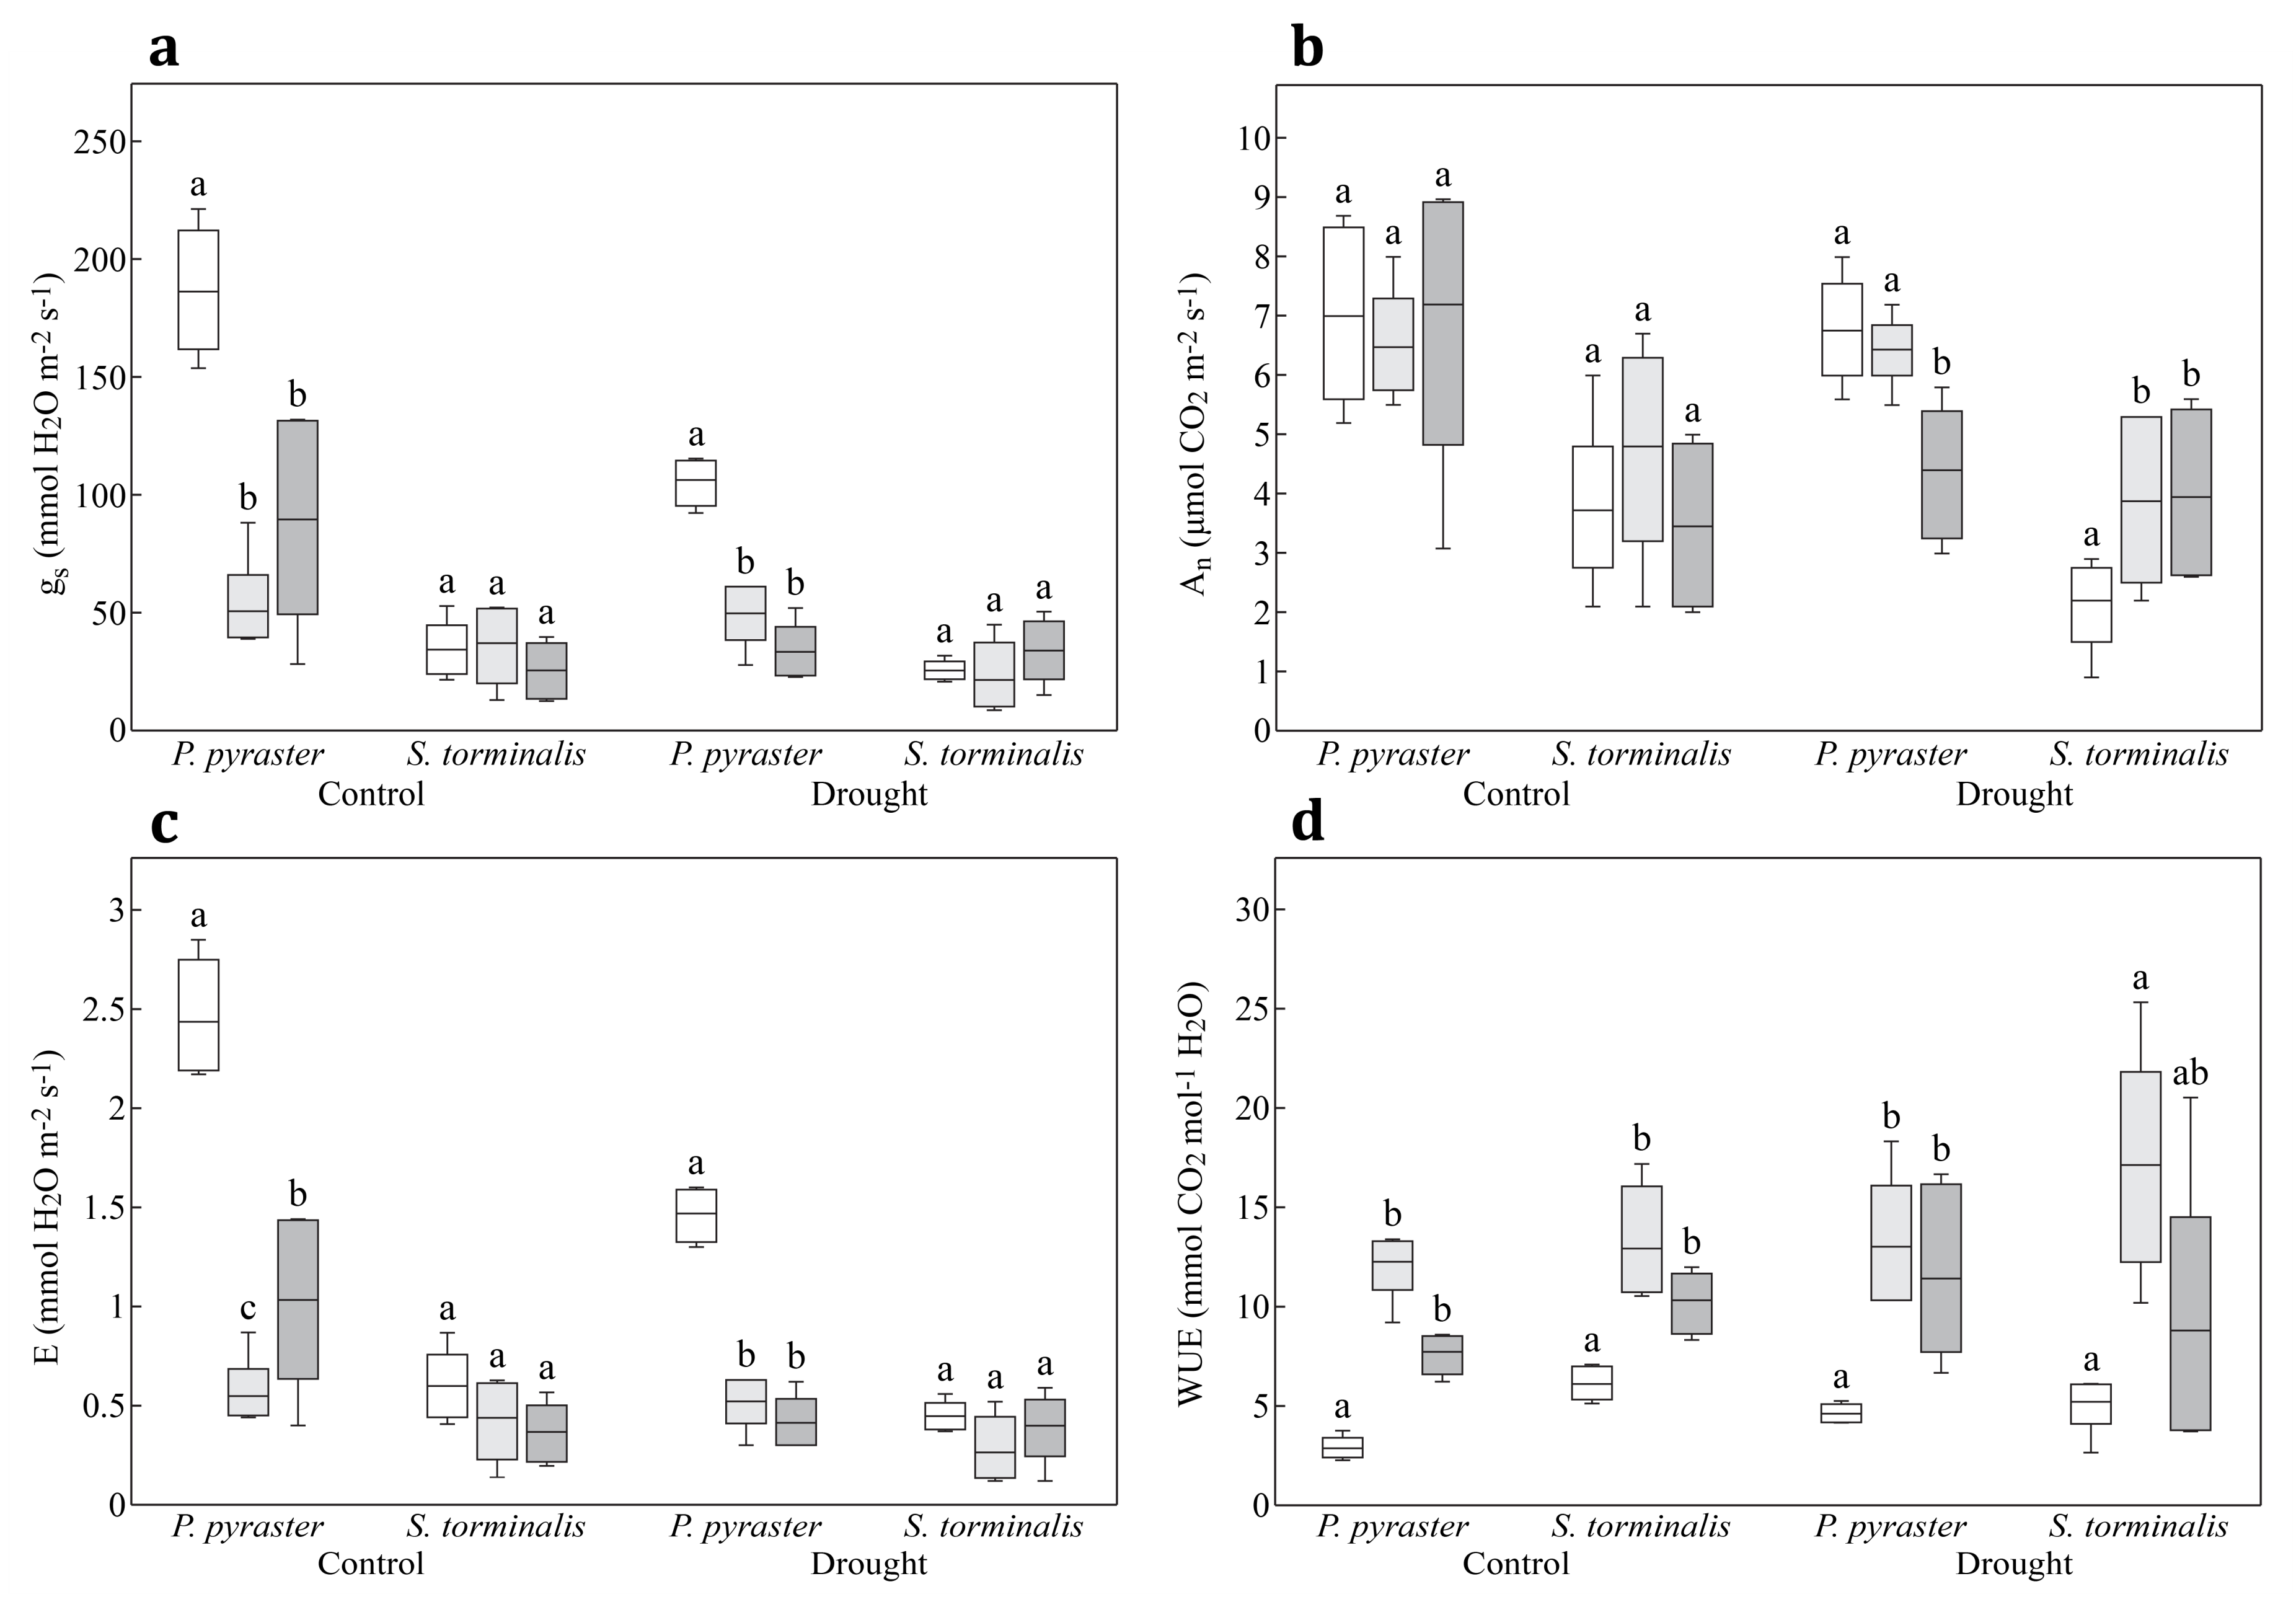
Significant differences in the physiological performance of the studied species were found after 30 days of the different water regimes. Compared to S. torminalis, P. pyraster had higher values of gs, An, and E under control and drought treatments (Table 3). The most significant differences between the studied species were manifested in gs. The parameter was four-times higher (control) and five-times higher (drought) for P. pyraster seedlings compared to S. torminalis. After 40 days of the different water regimes, significant interspecific differences were found in the parameters gs, An, and E only under drought treatment. After 50 days of the different water regimes, demonstrable interspecific differences were observed only for control plants for the parameters gs and E (Table 3).
A more detailed analysis of the gas exchange parameters based on the duration of the different water regimes shows that S. torminalis maintained relatively low values of gs in both regimes (control and drought) without significant differences between measurements (Figure 4a). During the experiment, the balanced physiological performance of S. torminalis was shown under control, along with balanced values of An and E (Figure 4b,c). These parameters were not affected by the different water regime (Table 3). The duration of the drought treatment affected An (Figure 4b). The differences were noticed also for the WUE of the control and drought-treated seedlings, with a significant increase in the mean values on the 40th day of the experiment (Figure 4d). The mean values of WUE were 12.93 ± 2.97 mmol CO2 mol−1 H2O (control) and 17.13 ± 5.59 mmol CO2 mol−1 H2O (drought).
P. pyraster maintained a balanced course of An in the control and also under drought treatment for 40 days. A demonstrable decrease of the An was not recorded in the drought treatment until the third measurement (50th day) (Figure 4b). These changes in An and E were accompanied by a significant increase in values of WUE for P. pyraster (Figure 4d). After 30 days of the drought treatment, the mean value of WUE was 4.60 ± 0.48 mmol CO2·mol−1 H2O. After 40 days, the mean value increased significantly to 13.02 ± 3.32 mmol CO2·mol−1 H2O.
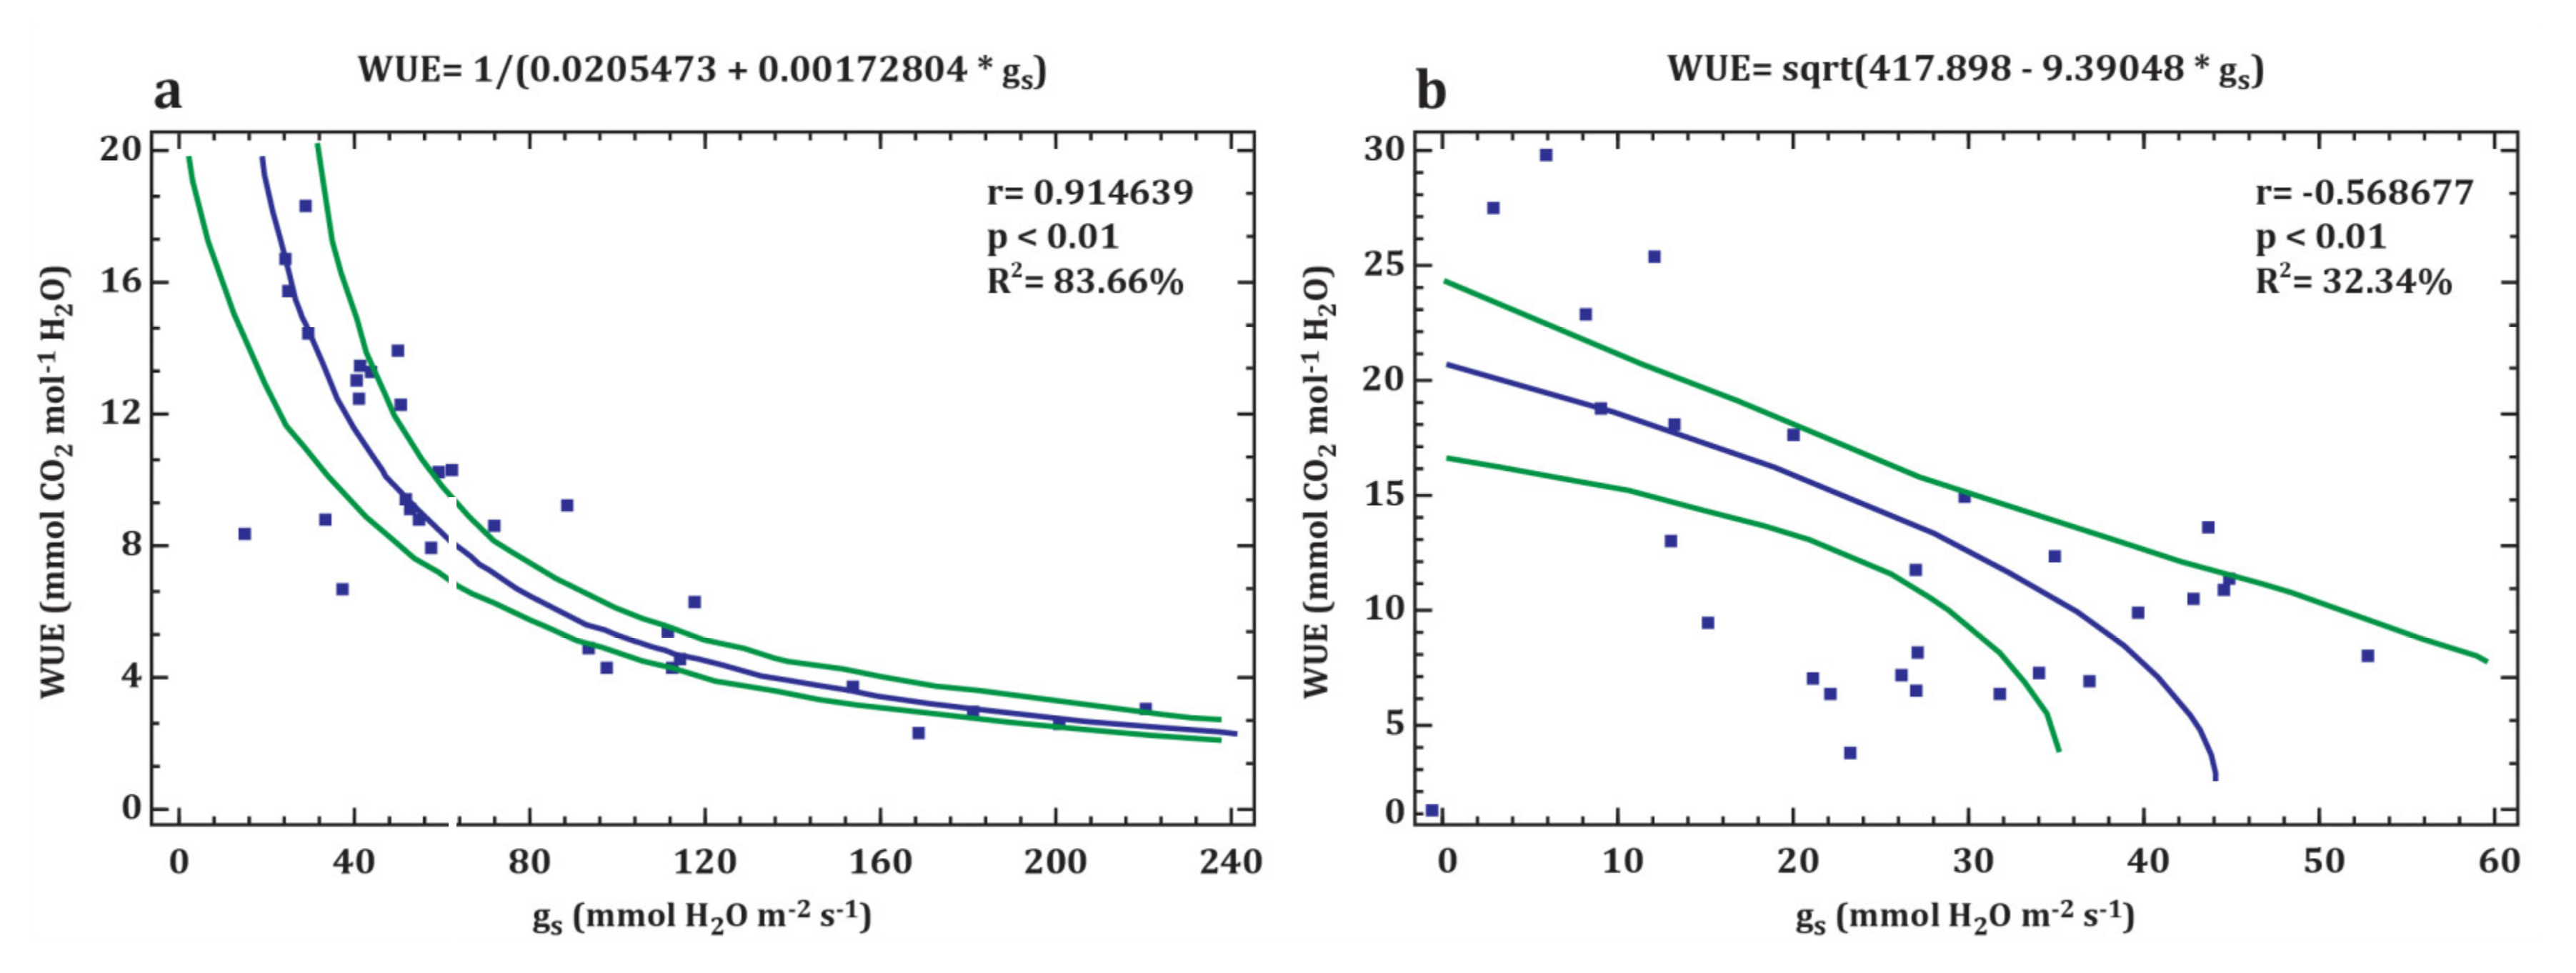
A strong correlation was found between the WUE and gs parameters for P. pyraster (r = 0.914639, p < 0.05) (Figure 5a). The relationship between the above-mentioned physiological parameters is highly significant and closely correlated. The values of WUE for P. pyraster significantly increased following the reduction of gs to under 80 mmol H2O m−2·s−1. In contrast, the results of the regression analysis for S. torminalis show a weak correlation relationship between WUE and gs (r = −0.568677, p < 0.05) (Figure 5b). The seedlings maintained lower values of gs (gs < 60 mmol H2O m−2·s−1), and the changes of WUE were insignificant.
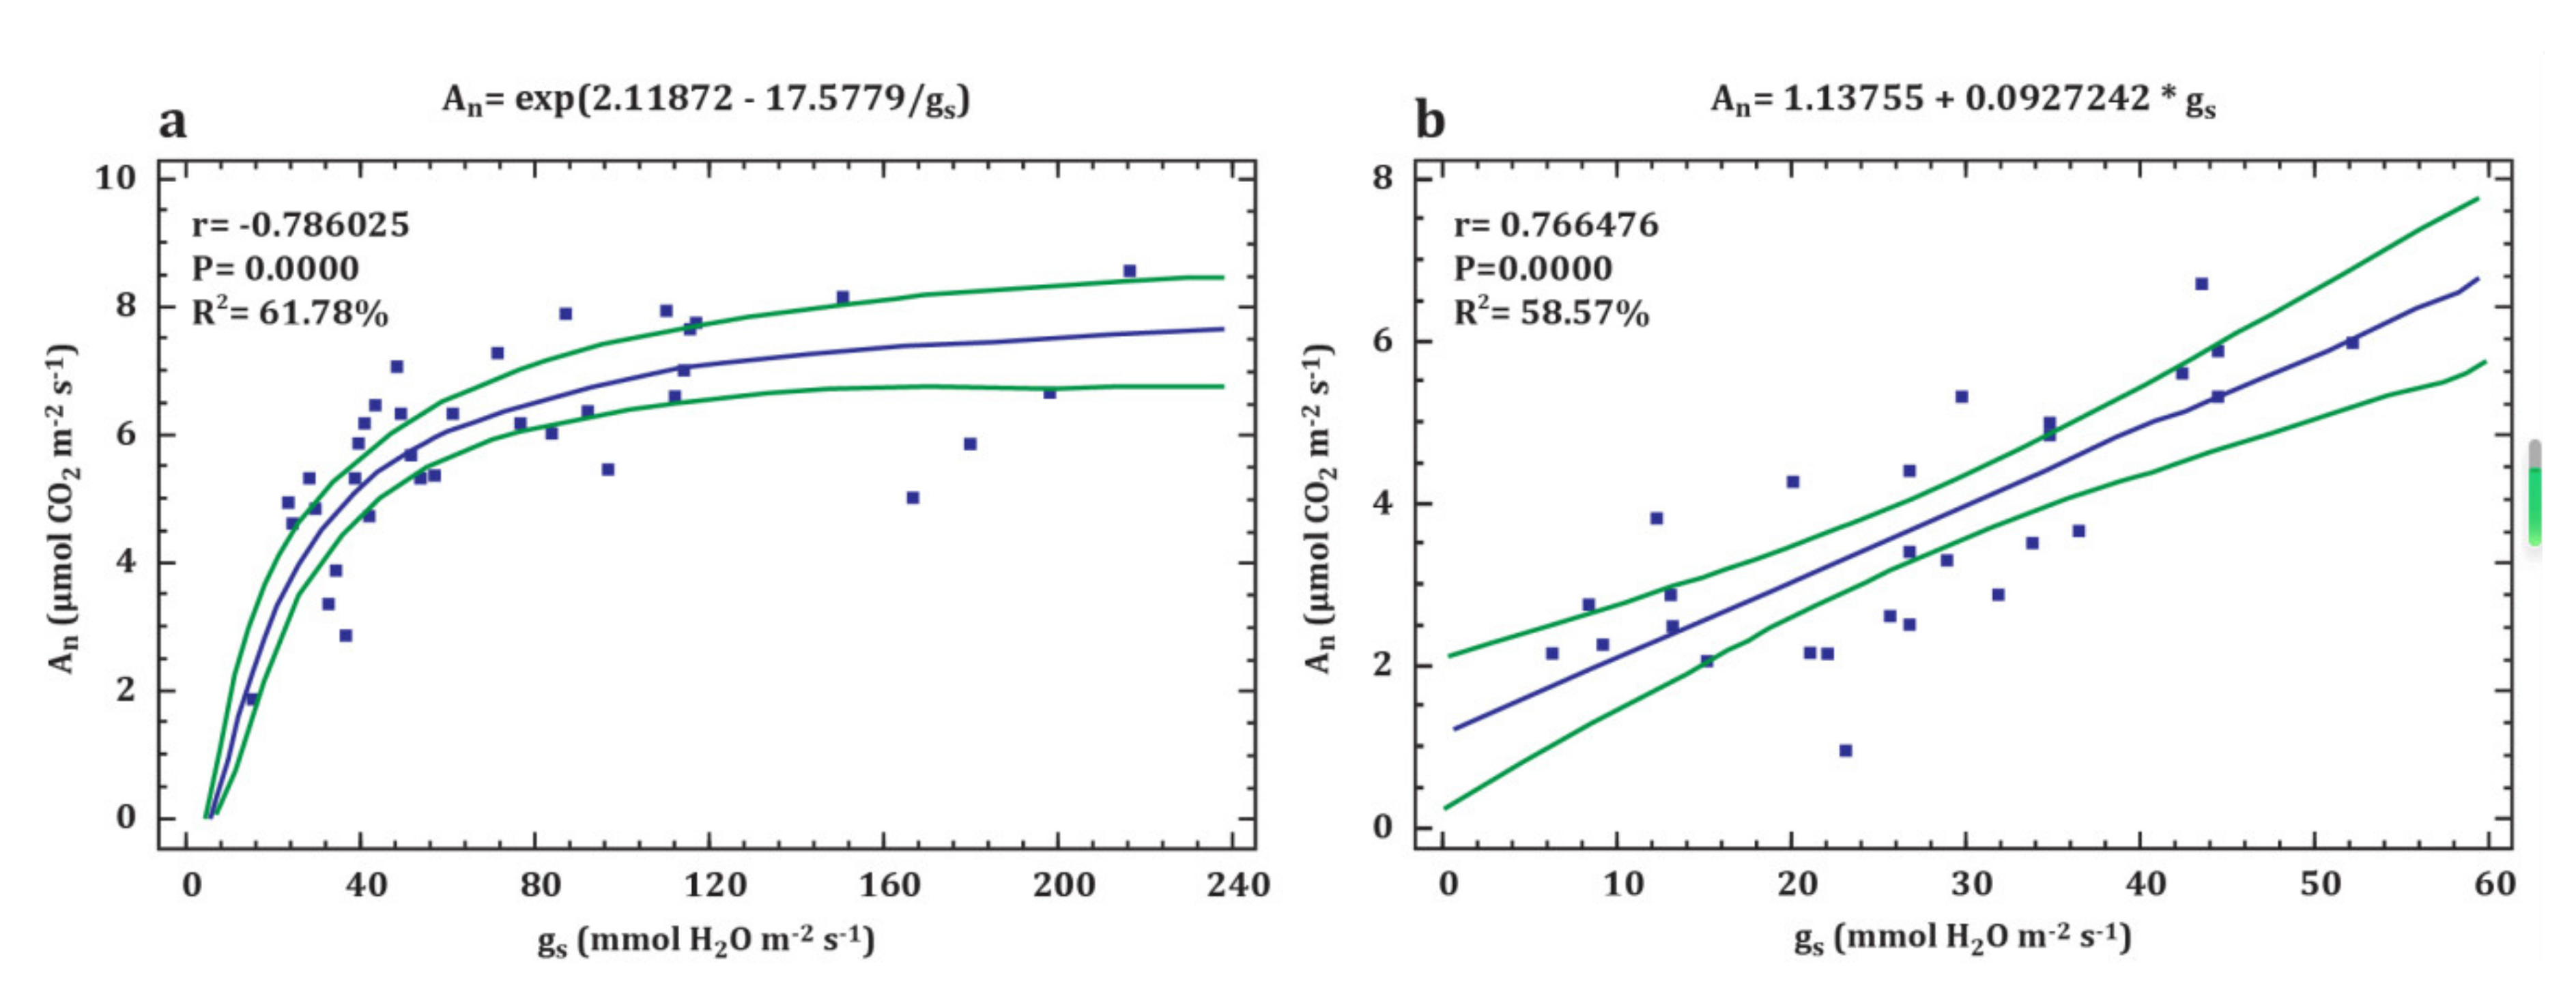
Interspecific differences were recorded also in the values of An. In the different water regimes, the An values for P. pyraster increased sharply following the increase of gs to 60 mmol H2O m−2·s−1; then, values of An oscillated within a relatively wide range even at higher values of gs (Figure 6a). In contrast, the rise of the An values was linearly correlated with gs values for S. torminalis (Figure 6b).

3.3. Leaf Water Status

The water potential of experimental plants was significantly influenced by the taxon and level of the growth substrate saturation (Table 4). The water potential of leaf tissues was lower in S. torminalis compared with P. pyraster. In the control, Ψwl was −0.81 MPa and −0.84 MPa. After 40 days of drought treatment, Ψwl decreased to −1.15 MPa, and after 50 days of drought treatment, this dropped to −1.53 MPa. The water potential of P. pyraster leaf tissues was also affected by drought. After 40 days of drought treatment, the value of Ψwl decreased to −1.27 MPa, and after 50 days of drought treatment, this decreased to −1.33 MPa. RWC values for control plants demonstrated interspecific differences after 50 days of the experiment (Table 4), when S. torminalis had significantly lower RWC (89.30%) compared to P. pyraster (94.56%). RWC values for drought-treated plants decreased significantly in both species (RWC˂ 80%), but interspecific differences were not confirmed.
The obtained data describe the different properties of the studied taxa under conditions of different water regimes (control and drought) and indicate the potential capacity of plants to take up the available water. P. pyraster had significantly higher water potential of the leaf tissues in comparison with S. torminalis and maintained this difference even after prolonged exposure to drought (50 days).

4. Discussion

The processes of photosynthesis and transpiration carried out in the plant leaves are reflected in the relationship between plant productivity and water use. Water scarcity is a crucial factor that negatively affects this relationship because it is limiting for growth and the utilization of water. Lack of water significantly inhibits CO2 exchange and the rate of transpiration, and both processes are controlled by the stomatal conductance (gs). According to [42], stomatal conductance is the evidence of physiological performance because it expresses the rate of CO2 availability for photosynthesis (An) and the management of water.
The impact of drought on the physiological performance of P. pyraster and S. torminalis seedlings was studied in our measurements, and we found significant interspecific differences. P. pyraster had higher values of all measured parameters both in the control and under drought treatment. The most marked differences were found in gs. The values varied significantly between the species; compared with Sorbus, the values were several times higher for Pyrus. This parameter changed against the background of the changes in leaf water potential, which decreased after 40 days of drought treatment to −1.27 MPa and after 50 days to −1.33 MPa. The stomatal conductance decreased in both drought and control conditions, depending on the duration of exposure to the different water regimes (control and drought). According to [10,43], the stomatal conductance and the leaf water potential interact on the principle of feedback, which results to stomatal sensitivity, i.e., a decrease in gs occurs in response to the decreasing leaf water potential. In Pyrus leaves, transpiration (E) was reduced as well, according to the decrease of gs in both regimes of the substrate saturation by water. After 40 days of the experiment, balanced An values were maintained despite the decreasing gs for both control and drought-treated plants. The factor of water shortage did not show a negative impact on photosynthesis until the 50th day of drought treatment, when a significant decrease of An was found.
A lower water potential was found in the leaves of S. torminalis seedlings. It decreased over the entire duration of the experiment from −0.81 MPa to −1.53 MPa and was accompanied by low and balanced gs values with non-significant differences between measurements. According to [44], gs reduces the water potential of leaves and negatively affects the leaf expansion. On the other hand, it has a positive effect on the photosynthesis rate. This was not confirmed in our measurements, because S. torminalis showed low photosynthesis and transpiration rates and formed a larger leaf area.
When comparing the characteristics of the studied species, S. torminalis had relatively low gs values in both regimes of irrigation, and the decrease of gs due to stress was insignificant, regardless of the duration of the drought treatment. After 50 days of the different water regimes, the gs of the drought-treated seedlings were equal to the control. The other measured parameters, An and E, showed balanced and relatively low values in the control as well as during drought treatment. We did not confirm the data of [7,45], who found rapid changes in the physiological performance of S. torminalis after 32 days of drought treatment. The authors explain these changes by the rapid decrease of gs recorded after the restricted availability of water. Zhang et al. [42] confirmed a nonsignificant correlation between gs and WUE, but found a significant correlation between An and E. In our experiment, S. torminalis maintained low values of gs, and we confirmed a weak correlation between gs and WUE (r = −0.41, p <0.05).
There were not confirmed interspecific differences in total biomass production, but S torminalis despite the low physiological performance distributed more dry mass to the leaves in control (+56%) and in drought (+38%) conditions. The seedlings also created more root length for a given dry mass investment, which was reflected in higher SRL values.
We accept the opinion of [46], whose hypothesis was based on the assumption that plant productivity (maize in their experiment) can increase without changing the amount of water used; i.e., with an unchanged WUE. Caldeira et al. [44] suggest that particularly expansive volume growth is negatively correlated with gs and daytime transpiration rate, which is typical for the genotypes with the lowest gs values.
The interspecific differences are also interesting due to the difference found in WUE values. The changes in An and E were accompanied by a significant increase in the water use of P. pyraster seedlings, and regression analysis confirmed that WUE demonstrably increased with decreasing gs. S. torminalis had low An and E values, leading to a decrease in WUE values. Kunz et al. [7], in a study of the effects of drought on the growth, rewetting, and gas exchange of several European deciduous trees, concluded that S. torminalis is a less drought-resistant species compared to Acer campestre and Acer platanoides, as its physiological performance declined rapidly when the seedlings were affected by drought. In accordance with this opinion, and based on our measurements, it can be added that seedlings under conditions of water deficiency reduce the exchange of CO2 and H2O to prevent drought damage. The strategy used by S. torminalis is to use and spend available water. Zhang et al. [42] also investigated the effect of drought on the leaf gas exchange of various tree species, herbs, and climber plants. The authors found a significant inhibition of CO2 exchange in the leaves of the deciduous tree species induced by drought. The inhibitory effect escalated depending on the duration of stress. Drought significantly reduced An, E, and gs; however, this occurred according to the characteristics of the species.
Within our study a moderately strong relationship has been confirmed between An and gs for P. pyraster and S. torminalis. In agreement with findings of Héroult et al. [47] we confirmed, that under controlled conditions, species with different ecological amplitude to the soil moisture demonstrated different magnitude in response to water regime. According to several studies, the differences in stomatal conductance and its relationship with photosynthesis for humid zone species compared with drought-tolerant species, suggest strong selection for leaf and whole-plant characteristics and different stomatal optimization behavior for species from climates with contrasting rainfall and drought frequencies [47,48,49]. In our study, significant differences have been confirmed for leaf and root characteristics, where P. pyraster created thicker leaves (SLA) and S. torminalis invested more dry mass to root length (SRL) under conditions of water scarcity.
Pyrus maintains it physiological performance even under conditions of increased and prolonged water shortage. We observed decreased gs and E values; however, a higher photosynthetic rate was maintained for a longer period of time. The significant decrease of An occurred after 50 days of drought treatment. Dias and Brüggemann [50] considered a significant increase of WUE (on the 40th day of experiment) accompanied by decreased or low values of An and E to be a common reaction of various tree species to the reduction of soil moisture. On the other hand, the increase of WUE together with the decrease in functions related to CO2 and H2O exchange is considered to be an indicator of higher drought resistance. Under drought, Pyrus significantly increases the efficiency of water use; this strategy is used to save water.

5. Conclusions

Interspecific differences were identified in the physiological performance of P. pyraster and S. torminalis seedlings in drought in this experimental research work. It was confirmed that the gain of CO2 and the loss of water by transpiration are species-dependent and significantly influenced by stomatal conductance (gs). This variable endogenous factor exhibited several times higher values in P. pyraster leaves compared with S. torminalis in the control, as well as for plants under drought treatment. Sorbus maintained a low gs during the experiment in both control and drought conditions.
Under conditions of water shortage, the strategy of the studied tree species was based not only on the ability to assimilate C and the transpiration of water, but also on the mass balance for a specific period of time. The results show that P. pyraster maintained the mass distribution ratio between belowground and aboveground organs, even in conditions of water scarcity, and the R:S ratio did not change significantly. In drought, Pyrus formed thicker leaves (lower SLA) and reduced stomatal conductance and transpiration; additionally, it maintained a higher rate of photosynthesis. Sorbus created more root length for a given dry-mass investment (SRL), although the R:S ratio was lower compared to Pyrus. The seedlings reduced the assimilation of CO2 and H2O transpiration to prevent drought damage. In response to drought, S. torminalis applied a water-saving strategy, maintaining low leaf stomatal conductance. The changes of the leaf gas exchange for Pyrus were accompanied by a significant increase in WUE, which was most pronounced on the 40th day of the drought treatment. We have confirmed a significant and strong relationship between WUE and gs for Pyrus. The correlation between WUE and gs for Sorbus was weak.
Our results confirmed the different physiological performances of seedlings of tree species and the use of different mechanisms in their response to water scarcity and duration of drought.

Author Contributions

V.P. and Z.J. contributed to the conception and design of the study. M.H. performed data collection. V.P. and M.H. performed statistical analyses. V.P. and Z.J. wrote the first draft of the manuscript. V.P., Z.J. and M.H. wrote sections of the manuscript. All authors have read and agreed to the published version of the manuscript.

Funding

This research and APC were funded by Kultúrna a Edukačná Grantová Agentúra MŠVVaŠ SR (Cultural and Educational Grant Agency of the Ministry of Education, Science, Research, and Sport of Slovak Republic) grant number 007SPU-4/2020.

Acknowledgments

The authors are thankful to Helena Lichtnerová for her help with the laboratory analyses. This work was supported by the AgroBioTech Research Centre (ITMS 26220220180).

Conflicts of Interest

The authors declare that they have no conflict of interest.

References

  1. Donovan, L.; Ehleringer, J.R. Contrasting water-use patterns among size and life-history classes of a semi-arid shrub. Funct. Ecol. 1992, 6, 482–488. [Google Scholar] [CrossRef]
  2. McDowell, N.; Pockman, W.T.; Allen, C.D.; Breshears, D.D.; Cobb, N.; Kolb, T.; Plaut, J.; Sperry, J.; West, A.; Yepez, E.A.; et al. Mechanisms of plant survival and mortality during drought: Why do some plants survive while others succumb to drought? New Phytol. 2008, 178, 719–739. [Google Scholar] [CrossRef] [PubMed]
  3. Wang, C.J.; Yang, W.; Wang, C.; Gu, C.; Niu, D.D.; Liu, H.X.; Wang, Y.P.; Guo, J.H. Induction of drought tolerance in cucumber plants by a consortium of three plant growth-promoting rhizobacterium strains. PLoS ONE 2012, 7, e52565. [Google Scholar] [CrossRef] [Green Version]
  4. Dai, A. Increasing drought under global warming in observations and models. Nat. Clim. Chang. 2013, 3, 52–58. [Google Scholar] [CrossRef]
  5. Huang, Y.; Gerber, S.; Huang, T.; Lichstein, J.W. Evaluating the drought response of CMIP5 models using global gross primary productivity, leaf area, precipitation, and soil moisture data. Glob. Biogeochem. Cycles 2016, 30, 1827–1846. [Google Scholar] [CrossRef]
  6. Zhao, M.; Running, S.W. Drought-induced reduction in global terrestrial net primary production from 2000 through 2009. Science 2010, 329, 940–943. [Google Scholar] [CrossRef] [PubMed] [Green Version]
  7. Kunz, J.; Räder, A.; Bauhus, J. Effects of drought and rewetting on growth and gas exchange of minor European broadleaved tree species. Forests 2016, 7, 239. [Google Scholar] [CrossRef]
  8. Gregory, P.J.; Simmonds, L.P.; Pilbeam, C.J. Soil type, climatic regime, and the response of water use efficiency to crop management. Agron. J. 2000, 92, 814–820. [Google Scholar] [CrossRef]
  9. Gebrekirstos, A.; Van Noordwijk, M.; Neufeldt, H.; Mitlöhner, R. Relationships of stable carbon isotopes, plant water potential and growth: An approach to assess water use efficiency and growth strategies of dry land agroforestry species. Trees 2011, 25, 95–102. [Google Scholar] [CrossRef] [Green Version]
  10. Klein, T. The variability of stomatal sensitivity to leaf water potential across tree species indicates a continuum between isohydric and anisohydric behaviours. Funct. Ecol. 2014, 28, 1313–1320. [Google Scholar] [CrossRef]
  11. Tardieu, F.; Davies, W.J. Integration of hydraulic and chemical signalling in the control of stomatal conductance and water status of droughted plants. Plant Cell Environ. 1993, 16, 341–349. [Google Scholar] [CrossRef]
  12. Hammer, G.; Cooper, M.; Tardieu, F.; Welch, S.; Walsh, B.; Eeuwijk, F.; Chapman, S.; Podlich, D. Models for navigating biological complexity in breeding improved crop plants. Trends Plant Sci. 2006, 11, 587–593. [Google Scholar] [CrossRef]
  13. Hatfield, J.L.; Dold, C. Water-use efficiency: Advances and challenges in a changing climate. Front. Plant Sci. 2019, 10, 103. [Google Scholar] [CrossRef] [Green Version]
  14. Larcher, W. Physiological Plant Ecology: Ecophysiology and Stress Physiology of Functional Groups; Springer Science & Business Media: Berlin, Germany, 2003. [Google Scholar]
  15. Roper, P. The distribution of the wild service tree, Sorbus torminalis (L.) Crantz, in the British Isles. Watsonia 1993, 19, 209–229. [Google Scholar]
  16. Kausch-Blecken Von Schmeling, W. Die Elsbeere (Sorbus torminalis (L.) Crantz; Selbstverlag: Bovenden, Germany, 1994; p. 253. [Google Scholar]
  17. Wagner, I. Identifikation von Wildapfel (Malus sylvestris (L.) Mill.) und Wildbirne (Pyrus pyraster (L.) Burgsd.). Forstarchiv 1995, 66, 39–47. [Google Scholar]
  18. Paganová, V. Wild pear Pyrus pyraster (L.) Burgsd. requirements on environmental conditions. Ekológia (Bratislava) 2003, 22, 225–241. [Google Scholar]
  19. Paganová, V. Ecology and distribution of Sorbus torminalis (L.) Crantz. in Slovakia. Hortic. Sci. 2007, 34, 138–151. [Google Scholar] [CrossRef] [Green Version]
  20. Paganová, V. Ecological requirements of wild service tree (Sorbus torminalis [L.] Crantz.) and service tree (Sorbus domestica L.) in relation with their utilization in forestry and landscape. J. For. Sci. 2008, 54, 216–226. [Google Scholar] [CrossRef] [Green Version]
  21. Rameau, J.C.; Mansion, D.; Dumé, G.; Timbal, J.; Lecointe, A.; Dupont, P.; Keller, R. Flore Forestière Française. Plaines et Collines; IDF: Paris, France; ENGREF: Nancy, France, 1989; Volume 1. [Google Scholar]
  22. Májovský, J.; Crantz, S.L. Flóra Slovenska IV/3; Berthová, L., Ed.; Vydavateľstvo SAV: Bratislava, Slovakia, 1992; pp. 401–446. [Google Scholar]
  23. Drapier, N. Ecologie de l‘alisier torminal Sorbus torminalis (L.) crantz. Rev. For. Fr. 1993, 45, 229–242. [Google Scholar] [CrossRef] [Green Version]
  24. Wilhelm, G.J. Im vergleich mit elsbeere und speierling beobachtungen zur wildbirne. Allg. Forstz. Wald 1998, 16, 856–859. [Google Scholar]
  25. Wagner, I.; Büttner, R. Hybridization in wild pear (Pyrus pyraster) from various regions in Germany and from Luxembourg with respect to Pyrus × communis. In III International Symposium on Horticulture in Europe-SHE2016; International Society for Horticultural Science: Leuven, Belgium, 2016; Volume 1242, pp. 427–434. [Google Scholar]
  26. Stephan, B.R.; Wagner, I.; Kleinschmit, J. EUFORGEN Technical Guidelines for Genetic Conservation and Use for Wild Apple and Pear (Malus sylvestris and Pyrus pyraster); International Plant Genetic Resources Institute: Rome, Italy, 2003; p. 6. Available online: http://www.euforgen.org/publications/publication/imalus-sylvestrisi-and-ipyrus-pyrasteri-technical-guidelines-for-genetic-conservation-an/ (accessed on 18 August 2020).
  27. Zohary, D. Wild apples and wild pears. Bocconea 1997, 7, 409–416. [Google Scholar]
  28. Milner, E. Trees of Britain and Ireland; Natural History Museum: London, UK, 2011. [Google Scholar]
  29. Ellenberg, H. Vegetation Mitteleuropas Mit Den Alpen in Ökologischer Sicht, 3rd ed.; Ulmer Verlag: Stuttgart, Germany, 1983. [Google Scholar]
  30. Peniašteková, M.; Pyrus, L. Hruška. In Flóra Slovenska IV/3; Berthová, L., Ed.; Vydavateľstvo SAV: Bratislava, Slovakia, 1992; pp. 384–388. [Google Scholar]
  31. Machar, I. Historical development of floodplain forests in the Upper Moravian Vale (Vrapač National Nature Reserve, Czech Republic). J. For. Sci. 2008, 54, 426–437. [Google Scholar] [CrossRef] [Green Version]
  32. Ewald, C.; Zander, M.; Jander, A. Die elsbeere (Sorbus torminalis/L./crantz.) in brandenburg. Der Wald 1994, 44, 232–235. [Google Scholar]
  33. Dinca, L. Elsbeere in Rumänien. Corminaria 2000, 14, 28. [Google Scholar]
  34. Lapin, M.; Faško, P.; Melo, M.; Štastný, P.; Tomlain, J. Klimatické oblasti. In Atlas Krajiny Slovenskej Republiky; Ministerstvo Životného Prostredia SR: Bratislava, Slovakia, 2002; p. 344. [Google Scholar]
  35. Meier, U. Phenological growth stages. In Phenology: An Integrative Environmental Science; Tasks for Vegetation Science; Schwartz, M.D., Ed.; Springer: Dordrecht, The Netherlands, 2003; pp. 269–283. [Google Scholar]
  36. Poorter, H.; Bühler, J.; Van Dusschoten, D.; Climent, J.; Postma, J.A. Pot size matters: A meta-analysis of the effects of rooting volume on plant growth. Funct. Plant Biol. 2012, 39, 839–850. [Google Scholar] [CrossRef] [Green Version]
  37. Trautmann, N.; Richard, T. Moisture Content. Cornell Waste Management Institute. 1996. Available online: http://compost.css.cornell.edu/calc/moisture_content.html (accessed on 15 February 2019).
  38. Measures, M.; Weinberger, P.; Baer, H. Variability of plant growth within controlled-environment chambers as related to temperature and light distribution. Can. J. Plant Sci. 1973, 53, 215–220. [Google Scholar] [CrossRef] [Green Version]
  39. Porter, A.S.; Evans-FitzGerald, C.; McElwain, J.C.; Ziotis, C.; Elliott-Kingston, C. How well do you know your growth chambers? Testing for chamber effect using plant traits. Plant Methods 2015, 11, 44. [Google Scholar] [CrossRef] [Green Version]
  40. Evans, G.C. The Quantitative Analysis of Plant Growth; Blackwell Scientific Publications: Oxford, UK, 1972. [Google Scholar]
  41. Barrs, H.D.; Weatherley, P.E. A re-examination of the relative turgidity technique for estimating water deficit in leaves. Aust. J. Biol. Sci. 1962, 15, 413–428. [Google Scholar] [CrossRef] [Green Version]
  42. Zhang, J.; Jiang, H.; Song, X.; Jin, J.; Zhang, X. The responses of plant leaf CO2/H2O exchange and water use efficiency to drought: A meta-analysis. Sustainability 2018, 10, 551. [Google Scholar] [CrossRef] [Green Version]
  43. Buckley, T.N. The control of stomata by water balance. New Phytol. 2005, 168, 275–292. [Google Scholar] [CrossRef]
  44. Caldeira, C.F.; Bossio, M.; Parent, B.; Jeanguenin, L.; Chaumont, F.; Tardieu, F. A hydraulic model is compatible with rapid changes in leaf elongation under fluctuating evaporative demand and soil water status. Plant Physiol. 2014, 164, 1718–1730. [Google Scholar] [CrossRef] [Green Version]
  45. Pyttel, P.; Kunz, J.; Bauhus, J. Growth regeneration and shade tolerance of wild Service trees (Sorbus torminalis L.Cranz.) in aged oak coppice forests. Trees 2013, 27, 1609–1619. [Google Scholar] [CrossRef]
  46. Basso, B.; Ritchie, J.T. Evapotranspiration in high-yielding maize and under increased vapor pressure deficit in the US Midwest. Agric. Environ. Lett. 2018, 3, 170039. [Google Scholar] [CrossRef]
  47. Héroult, A.; Lin, Y.S.; Bourne, A.; Medlyn, B.E.; Ellsworth, D.S. Optimal stomatal conductance in relation to photosynthesis in climatically contrasting Eucalyptus species under drought. Plant Cell Environ. 2013, 36, 262–274. [Google Scholar] [CrossRef] [PubMed]
  48. Brodribb, T.J.; Holbrook, N.M.; Zwieniecki, M.A.; Palma, B. Leaf hydraulic capacity in ferns, conifers and angiosperms: Impacts on photosynthetic maxima. New Phytol. 2005, 165, 839–846. [Google Scholar] [CrossRef]
  49. Franks, P.J. Higher rates of leaf gas exchange are associated with higher leaf hydrodynamic pressure gradients. Plant Cell Environ. 2006, 29, 584–592. [Google Scholar] [CrossRef] [Green Version]
  50. Dias, M.C.; Brüggemann, W. Water-use efficiency in Flaveria species under drought-stress conditions. Photosynthetica 2010, 48, 469–473. [Google Scholar] [CrossRef]
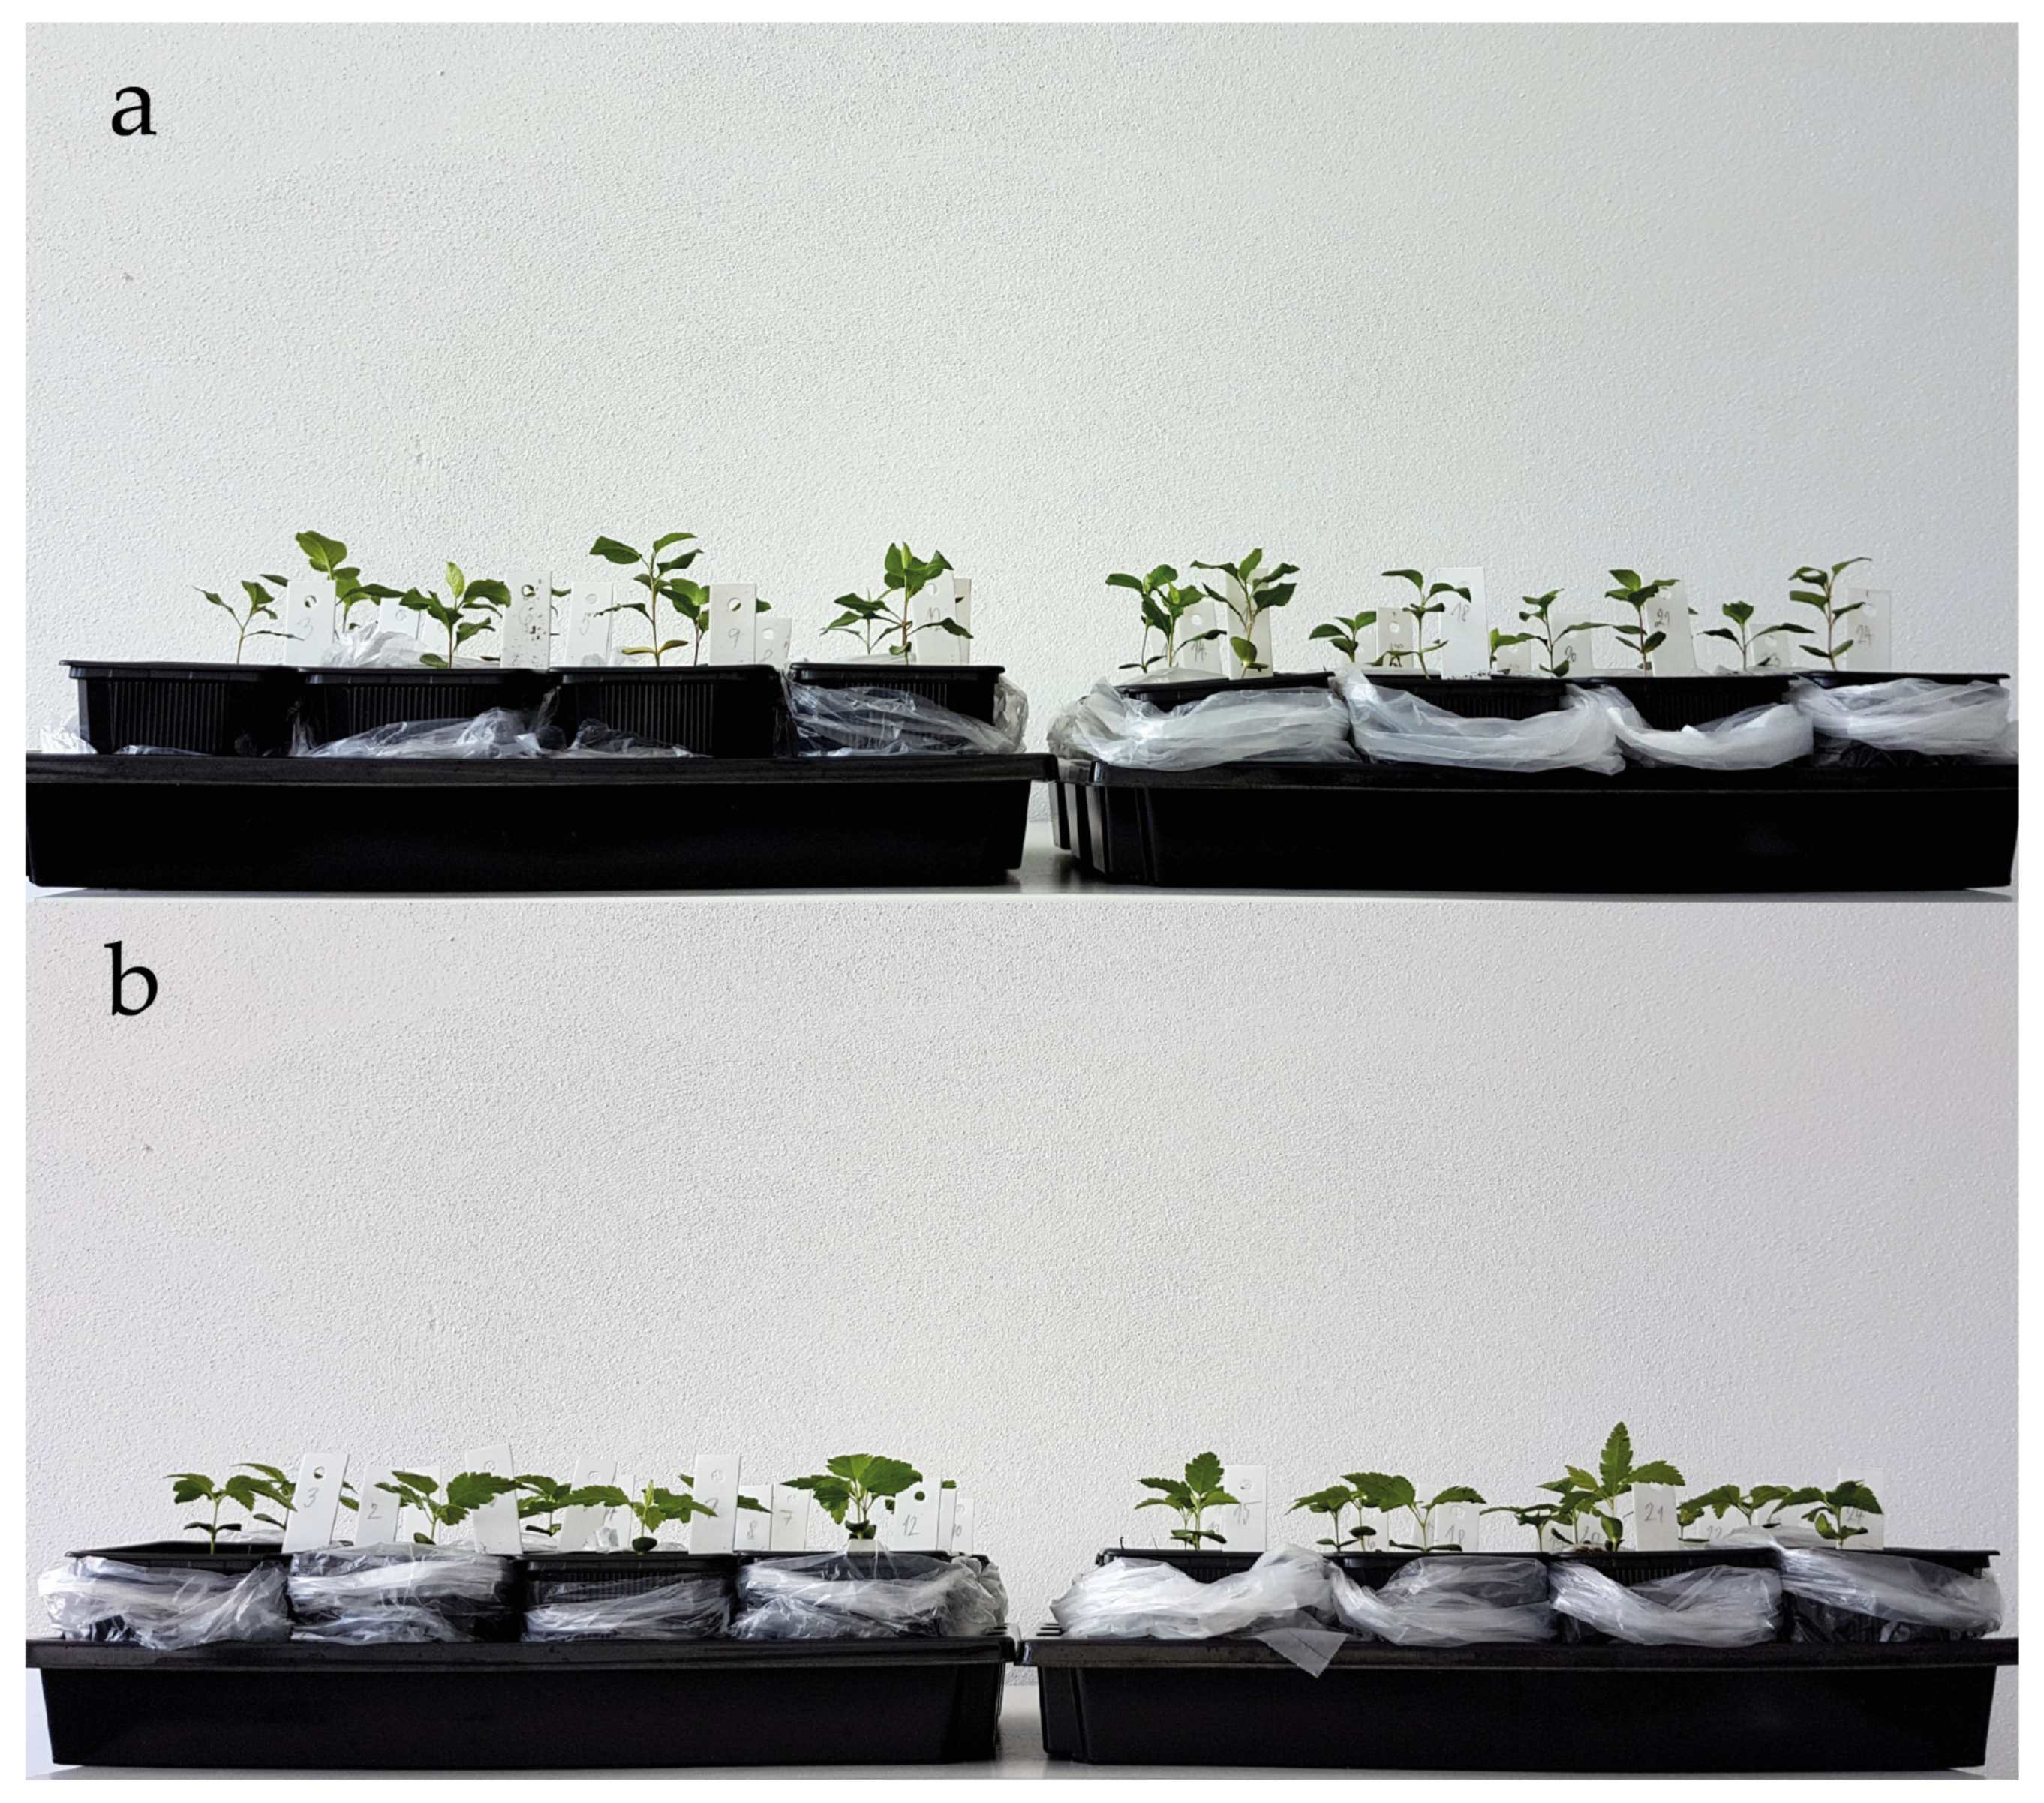
Figure 1. The seedlings of (a) P. pyraster and (b) S. torminalis after acclimatization in the beginning of experiment with different water regime; (left) control plants; (right) plants grown under drought treatment.
Plants 09 01496 g001
Figure 2. The differences in growth and biomass formation of P.pyraster seedlings grown for 50 days in different water regimes; (a) control plants; (b) plants under drought treatment.
Plants 09 01496 g002
Figure 3. The differences in growth and biomass formation of S. torminalis seedlings grown for 50 days in different water regimes for 50 days; (a) control plants; (b) plants under drought treatment.
Plants 09 01496 g003
Figure 4. Box plots for (a) stomatal conductance (gs); (b) net photosynthetic rate (An); (c) transpiration rate (E); and (d) water use efficiency (WUE) for seedlings of P. pyraster and S. torminalis measured after 30 days (white bars), 40 days (light grey bars), and 50 days (dark grey bars) of different water regimes. Drought was considered as 40% water according to the weight of the fully saturated substrate and control as 80% water according to the weight of the fully saturated substrate. The significant differences affected by the duration of drought treatment (p < 0.05) are denoted by different letters.
Plants 09 01496 g004
Figure 5. Relationship between the water use efficiency (WUE) and stomatal conductance (gs) of P. pyraster (a) and S. torminalis (b) seedlings grown for 50 days under different water regimes. The plot shows regression curve (blue line) and 95% confidence intervals (green lines). There were species specific responses to drought—a strong relationship was confirmed between WUE and gs for P. pyraster (5a). During the experiment, S. torminalis maintained quite low and balanced values of gs, while the relationship between WUE and gs was insignificant (5b).
Plants 09 01496 g005
Figure 6. Relationship between the net photosynthetic rate (An) and stomatal conductance (gs) of P. pyraster (a) and S. torminalis (b) seedlings grown for 50 days under different water regimes. The plot shows regression curve (blue line) and 95% confidence intervals (green lines). There was a confirmed moderately strong correlation between studied parameters for both tree species.
Plants 09 01496 g006
Table 1. Climatic-geographic description of the original stands of woody plants [34].
TaxonLocationExposureAltitude (m)TI. (°C)TVII. (°C)Precipitation (mm)Type
P. pyrasterKremnica hills (Tŕnie)S540−318750MW
S. torminalisCentral Moravian Carpathians (Vršava)S500−318500–550W
TI.—the average temperature in January; TVII.—the average temperature in July; S—south exposure; MW—moderately warm region; W6—moderately warm, humid, highland climate; W—warm.
Table 2. A two-way ANOVA analysis comparing the effects of taxon (T), drought treatment (R), and the interaction between them (T*R) on growth and biomass allocation of P. pyraster and S. torminalis seedlings in the pot experiment after 60 days of drought treatment. Significant differences (p < 0.05) are marked in bold. The multiple comparison of means (n = 12) was performed at the significance level of 0.05. The significant differences between species and treatments are denoted by different letters.
p-ValueControlDrought
ParameterTRT*RP. pyrasterS. torminalisP. pyrasterS. torminalis
Stem length (mm)<0.01<0.010.63188.36 (±47.37) a148.50 (±54.25) ac117.62 (±15.11) c88.45 (±20.40) b
Stem increment (mm)<0.01<0.010.57161.54 (±46.09) a122.00 (±53.21) a86.92 (±19.00) c59.64 (±21.48) b
Root length (mm)0.06<0.010.063494.27 (±1013.42) b4765.23 (±1669.71) a2861.40 (±803.77) b2840.07(±983.51) b
Specific root length (mm·mg−1)<0.01<0.010.768.12 (±3.65) a11.04 (±2.92) b10.73 (±3.06) ab14.23 (±3.76) c
Leaf area (mm2)<0.01<0.010.4311,186.40 (±3571.79) a16.515.60 (±8089.85) b4806.37 (±1547.99) c8083.09 (±2364.56) d
Specific leaf area (mm2·mg−1)<0.05<0.05<0.0119.78 (±1.11) a19.35 (±2.22) a16.45 (±2.49) b19.67 (±1.85) a
Dry weight of stem (mg)0.71<0.010.32500.29 (±185.16) a536.92 (±325.40) a287.77 (±97.57) b209.55 (±118.07) b
Dry weight of leaves (mg)<0.05<0.010.18567.07 (±184.30) a886.08 (±484.80) b299.39 (±104.10) c412.88 (±120.87) d
Dry weight of shoot (mg)0.14<0.010.221067.36 (±356.08) a1423.00 (±793.26) a587.16 (±197.83) b622.42 (±214.24) b
Dry weight of root (mg)0.08<0.010.72478.64 (±171.11) a385.75 (±215.24) ac278.69 (±80.95) bc217.64 (±106.81) b
Total biomass (mg)0.48<0.010.391546.00 (±503.63) a1808.75 (±991.87) a865.86 (±245.19) b840.06 (±307.14) b
R:S (root to shoot ratio)<0.010.070.790.45 (±0.10) a0.27 (±0.07) b0.50 (±0.18) a0.35 (±0.09) c
Table 3. The mean values and standard deviations (±SD) for the net assimilation rate (An), transpiration rate (E), stomatal conductance to water vapor (gs), and water use efficiency (WUE) of the P. pyraster and S. torminalis seedlings under different water regimes (n = 5). The significant differences between species and treatments are denoted by different letters.
Duration of Experiment30th Day of Treatment40th Day of Treatment50th Day of Treatment
ParameterTaxonDroughtControlDroughtControlDroughtControl
gs
mmol H2O m−2·s−1
P. pyraster106.00 ± 10.32 a185.20 ± 26.47 b49.80 ± 13.48 a50.60 ± 20.19 a33.60 ± 11.72 a91.00 ± 31.21 b
S. torminalis25.8 ± 4.21 c34.60 ± 11.85 c21.80 ± 15.35 b36.00 ± 11.57 ab31.25 ± 9.74 a26.00 ± 11.92 a
An
μmol CO2 m−2·s−1
P. pyraster6.76 ± 0.88 a7.00 ± 1.49 a6.44 ± 0.61 a6.48 ± 0.94 a4.40 ± 1.14 a7.15 ± 1.12 b
S. torminalis2.20 ± 0.78 b3.72 ± 1.41 b3.88 ± 1.42 b4.80 ± 1.76 ab3.95 ± 1.53 a3.45 ± 1.47 a
E
mmol H2O m−2·s−1
P. pyraster1.47 ± 0.14 b2.44 ± 0.30 a0.52 ± 0.13 a0.55 ± 0.18 a0.41 ± 0.13 a1.03 ± 0.29 b
S. torminalis0.45 ± 0.07 c0.60 ± 0.18 c0.26 ± 0.17 b0.45 ± 0.14 ab0.40 ± 0.18 a0.37 ± 0.15 a
WUE
mmol CO2 mol−1 H2O
P. pyraster4.60 ± 0.48 b2.88 ± 0.57 a13.02 ± 3.32 a12.27 ± 1.75 a11.42 ± 4.46 ac7.73 ± 1.06 a
S. torminalis5.49 ± 0.29 c6.11 ± 0.85 c17.13 ± 5.59 a12.93 ± 2.97 a7.85 ± 2.47 ab10.33 ± 1.60 bc
Table 4. A two-way ANOVA analysis of the measured water potential of leaf tissues (ΨwL) in the pot experiment with P. pyraster and S. torminalis seedlings, comparing the effects of taxon (T), drought treatment (R), and the interaction between them (T*R). Measurements were performed on 40th and 50th day of treatment (DOT). Significant differences (p < 0.05) are marked in bold. The multiple comparison of means was performed at the significance level of 0.05. Data are the mean values ± SD (n = 9). The significant differences between species and treatments are denoted by different letters.
DOTParameterp-ValueControlDrought
TRT*RP. pyrasterS. torminalisP. pyrasterS. torminalis
40thΨwl (MPa)<0.010.04<0.01−0.44 (±0.10) a−0.81 (±0.18) b−1.27 (±0.17) c−1.15 (±0.13) c
RWC (%)0.59<0.010.0593.62 (±3.24) a90.59 (±1.72) ad76.50 (±3.80) b81.52 (±3.02) bc
50thΨwl (MPa)<0.01<0.010.31−0.49 (±0.13) a−0.84 (±0.34) b−1.33 (±0.18) c−1.53 (±0.08) d
RWC (%)0.14<0.010.3094.56 (±0.55) a89.30 (±2.45) bd79.92 (±5.83) bc78.89 (±1.82) c
Publisher’s Note: MDPI stays neutral with regard to jurisdictional claims in published maps and institutional affiliations.