Article

Comparative Analyses of the Chloroplast Genomes of Patchouli Plants and Their Relatives in Pogostemon (Lamiaceae)

1
Guangdong Food and Drug Vocational College, Guangzhou 510520, China
2
Key Laboratory of Plant Resources Conservation and Sustainable Utilization, South China Botanical Garden, Chinese Academy of Sciences, Guangzhou 510650, China
3
Center of Conservation Biology, Core Botanical Gardens, Chinese Academy of Sciences, Guangzhou 510650, China
4
South China Limestone Plants Research Centre, College of Forestry and Landscape Architecture, South China Agricultural University, Guangzhou 510642, China
5
Center of Plant Ecology, Core Botanical Gardens, Chinese Academy of Sciences, Guangzhou 510650, China
*
Author to whom correspondence should be addressed.
These authors contributed equally to this work.
Plants 2020, 9(11), 1497; https://doi.org/10.3390/plants9111497
Submission received: 20 September 2020 / Revised: 30 October 2020 / Accepted: 2 November 2020 / Published: 5 November 2020
(This article belongs to the Special Issue Plant Evolution, Systematics, and Chloroplast Genome)

Abstract

:
Pogostemon Desf., the largest genus of the tribe Pogostemoneae (Lamiaceae), consists of ca. 80 species distributed mainly from South and Southeast Asia to China. The genus contains many patchouli plants, which are of great economic importance but taxonomically difficult. Therefore, it is necessary to characterize more chloroplast (cp) genomes for infrageneric phylogeny analyses and species identification of Pogostemon, especially for patchouli plants. In this study, we newly generated four cp genomes for three patchouli plants (i.e., Pogostemon plectranthoides Desf., P. septentrionalis C. Y. Wu et Y. C. Huang, and two cultivars of P. cablin (Blanoco) Benth.). Comparison of all samples (including online available cp genomes of P. yatabeanus (Makino) Press and P. stellatus (Lour.) Kuntze) suggested that Pogostemon cp genomes are highly conserved in terms of genome size and gene content, with a typical quadripartite circle structure. Interspecific divergence of cp genomes has been maintained at a relatively low level, though seven divergence hotspot regions were identified by stepwise window analysis. The nucleotide diversity (Pi) value was correlated significantly with gap proportion (indels), but significantly negative with GC content. Our phylogenetic analyses based on 80 protein-coding genes yielded high-resolution backbone topologies for the Lamiaceae and Pogostemon. For the overall mean substitution rates, the synonymous (dS) and nonsynonymous (dN) substitution rate values of protein-coding genes varied approximately threefold, while the dN values among different functional gene groups showed a wider variation range. Overall, the cp genomes of Pogostemon will be useful for phylogenetic reconstruction, species delimitation and identification in the future.

1. Introduction

Pogostemon Desf. is the largest genus of the tribe Pogostemoneae (Lamiaceae), consisting of about 80 species distributed mainly from South and Southeast Asia to China [1]. According to the recent infrageneric classifications [2,3], this genus has been separated into three subgenera, which are subg. Pogostemon, subg. Allopogostemon Bhatti & Ingr., and subg. Dysophyllus Bhatti & Ingr. The former two (Pogostemon sensu stricto) consist of terrestrial herb and subshrubs, whereas the latter is made up of aquatic and marshland plants [2]. However, the most recent molecular phylogenetic study showed that none of the three morphologically defined subgenera of Pogostemon were supported as monophyletic, and that Pogostemon should be classified into two subgenera (i.e., subg. Pogostemon and subg. Dysophyllus) [4].
The newly circumscribed subgenus Pogostemon contains 27 aromatic species [2,4], which are of great economic importance as the sources of patchouli oil (an essential oil extracted from the dried tops of aromatic Pogostemon plants) [5]. Pogostemon cablin (Blanoco) Benth. (patchouli) is a well-known aromatic species in the world, since it is one of the top 20 essential oil-yielding plants traded on the world market [5]. Like P. cablin, other Pogostemon taxa in subg. Pogostemon, such as P. plectranthoides Desf., P. heyneanus Benth., and P. benghalensis (Burm.f.) Kuntze, have also been cultivated for their essential oils (also known as patchouli oil) [2]. Nonetheless, these oils are of inferior and often variable quality [6]. Patterns of morphological variation among patchouli plants are complicated, since different methods of cultivation and diverse local climatic conditions (especially when transferred between countries) can result in substantial morphological changes in patchouli species [6]. Patchouli species have therefore been considered to be a taxonomically difficult group [2]. Thus, it is essential to generate new data to solve the species delimitation and identification issues in the group.
Chloroplast (cp) genomes have been considered as “ultra-barcode” for species/cultivar identification [7,8,9] and phylogenomic analyses [10,11,12]. Recently, obtaining hundreds to thousands of organelle loci has become routine because of rapid improvements in high-throughput sequencing (HTS) technology in the past decade [13,14]. The number of whole cp genomes has rocketed in recent years. However, there is still a lack of cp genome data for the genus Pogostemon (especially for patchouli species). So far, only nine cp genome sequences derived from three Pogostemon species are publicly available, of which only the P. cablin cp genomes have been well studied [9]. It is necessary to sequence and characterize more cp genomes for analyzing the infrageneric phylogeny and species identification of Pogostemon, especially for the economically important patchouli plants. In this study, genome-skimming data based on a high-throughput sequencing platform was generated for P. plectranthoides, P. septentrionalis C. Y. Wu & Y. C. Huang, and two cultivars of P. cablin (“Indonesia” and “Vietnam”). We then assembled whole chloroplast genomes for these taxa and comparatively analyzed them (including the sequences of subg. Dysophyllus available in GenBank). Specifically, we aimed to (1) characterize the cp genomes of Pogostemon and identify high-divergence hotspots, (2) characterize nucleotide substitution patterns across Pogostemon cp genomes, and (3) revisit the infrageneric relationships of Pogostemon and the backbone phylogeny of Lamiaceae based on cp genomes.

2. Results

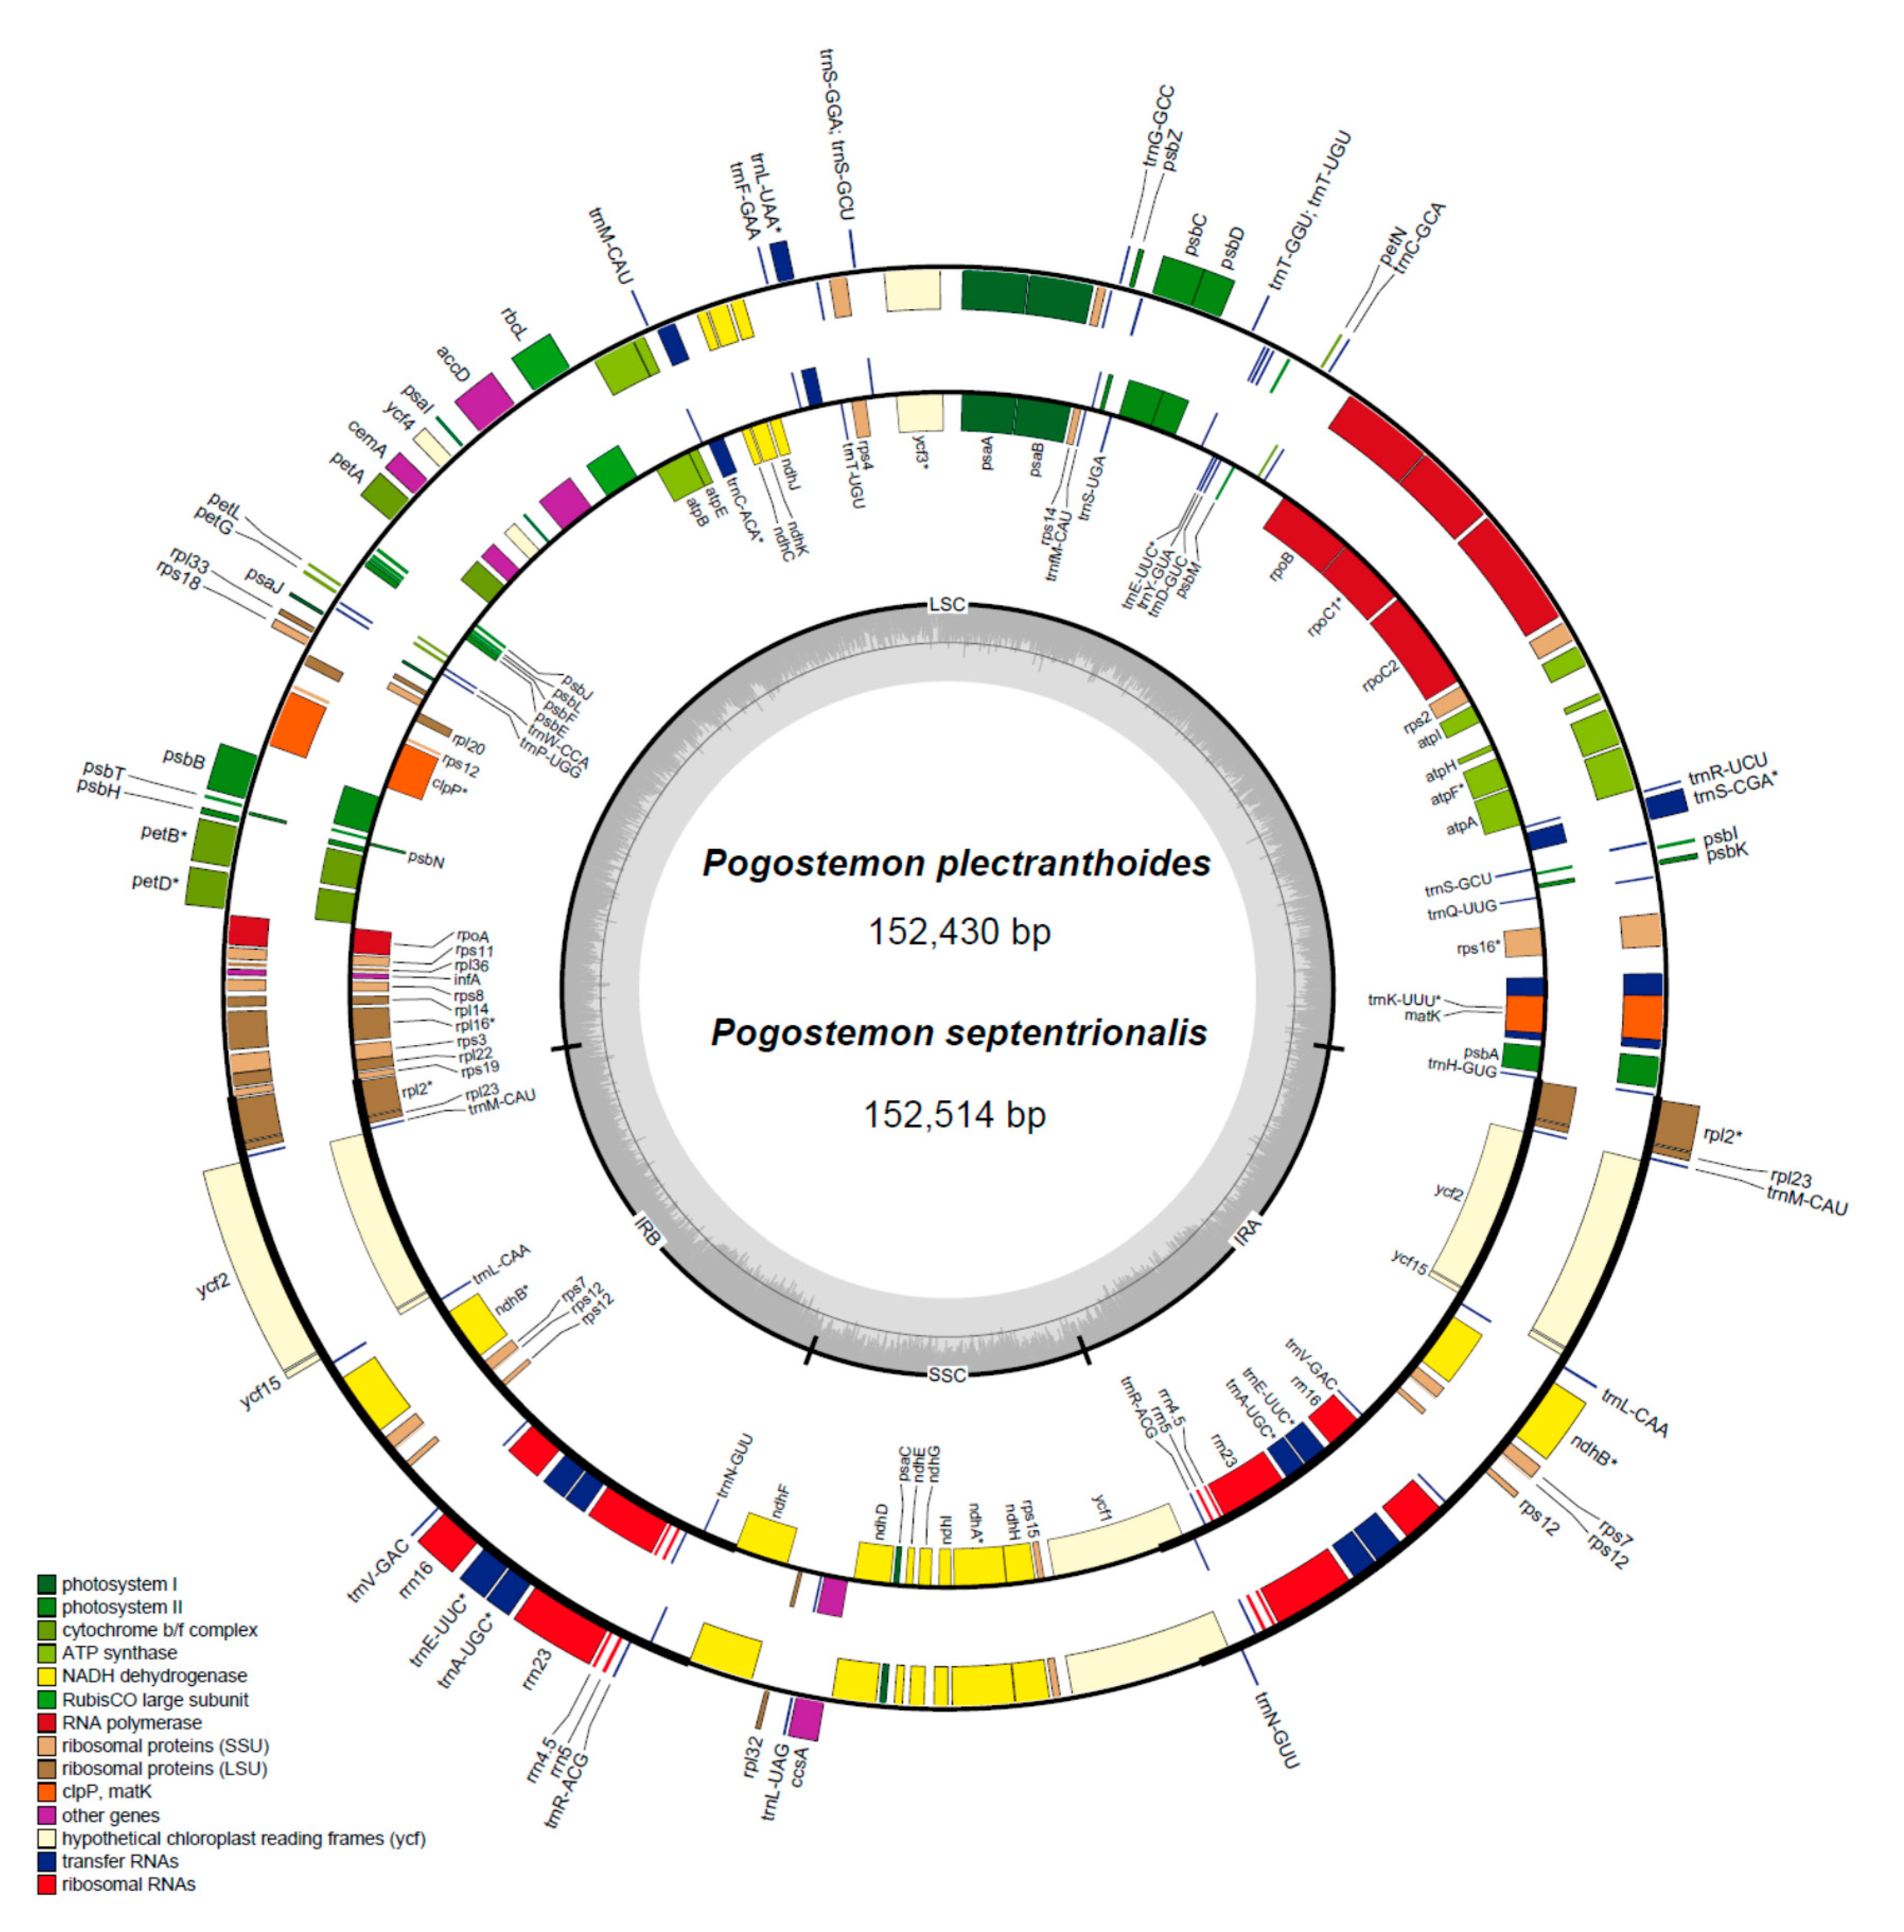
2.1. Characteristics of Chloroplast Genomes

The detailed information of Pogostemon cp genomes (including publicly available data in GenBank) is listed in Table 1. We obtained 10,041,957 and 10,334,686 paired-end reads from genome skimming sequencing for P. plectranthoides and P. septentrionalis, respectively. The average sequencing depth of the cp genome was 550.4× for P. plectranthoides and 844.6× for P. septentrionalis. The length of the cp genome is 152,430 bp for P. plectranthoides and 152,514 bp for P. septentrionalis. These two cp genomes have the typical quadripartite structure, consisting of a pair of identical inverted repeats regions (IRs; 25,666–25,665 bp), separated by a large single-copy region (LSC; 83,614–83,514 bp) and a small single-copy region (SSC; 17,584–17,570 bp). The overall GC content of the cp genome is 38.3% for P. plectranthoides and 38.2% for P. septentrionalis. The newly generated cp genomes of the two P. cablin cultivars (“Indonesia” and “Vietnam”) were effectively identical to those of other P. cablin cultivars, with only one base difference [9]. We therefore arbitrarily chose the cp genome of the cultivar “Gaoyao” (GenBank no. MF445415) as a representative of P. cablin for further comparative analyses.
We identified a total of 114 unique genes in the P. plectranthoides and P. septentrionalis cp genomes, including 80 protein-coding genes (PCGs), 30 tRNA genes, and four rRNA genes, consistent with the numbers identified in three other Pogostemon species. The gene content was conserved in these genomes, each of which has seven coding genes, seven tRNA genes, and four rRNA genes duplicated in IR regions. Besides, twelve PCGs and six tRNA genes were interrupted by introns; sixteen of these genes contained a single intron each and two genes (clpP and ycf3) possessed two introns (Figure 1).
In addition, P. yatabeanus (Makino) Press has the largest cp genome (152,707 bp), followed by P. septentrionalis (152,514 bp) (Table 1). The cp genome structures of Pogostemon are highly conserved, since no large genome rearrangement was detected among the five cp genomes (Figure S1). A limited variation occurred in the junction between IRs and the SSC (Figure S2). We found that the largest difference in genome size was mainly due to the indels in intergenic spacers (e.g., trnC–petN has 431 bp, and trnF–ndhJ contains 258 bp).

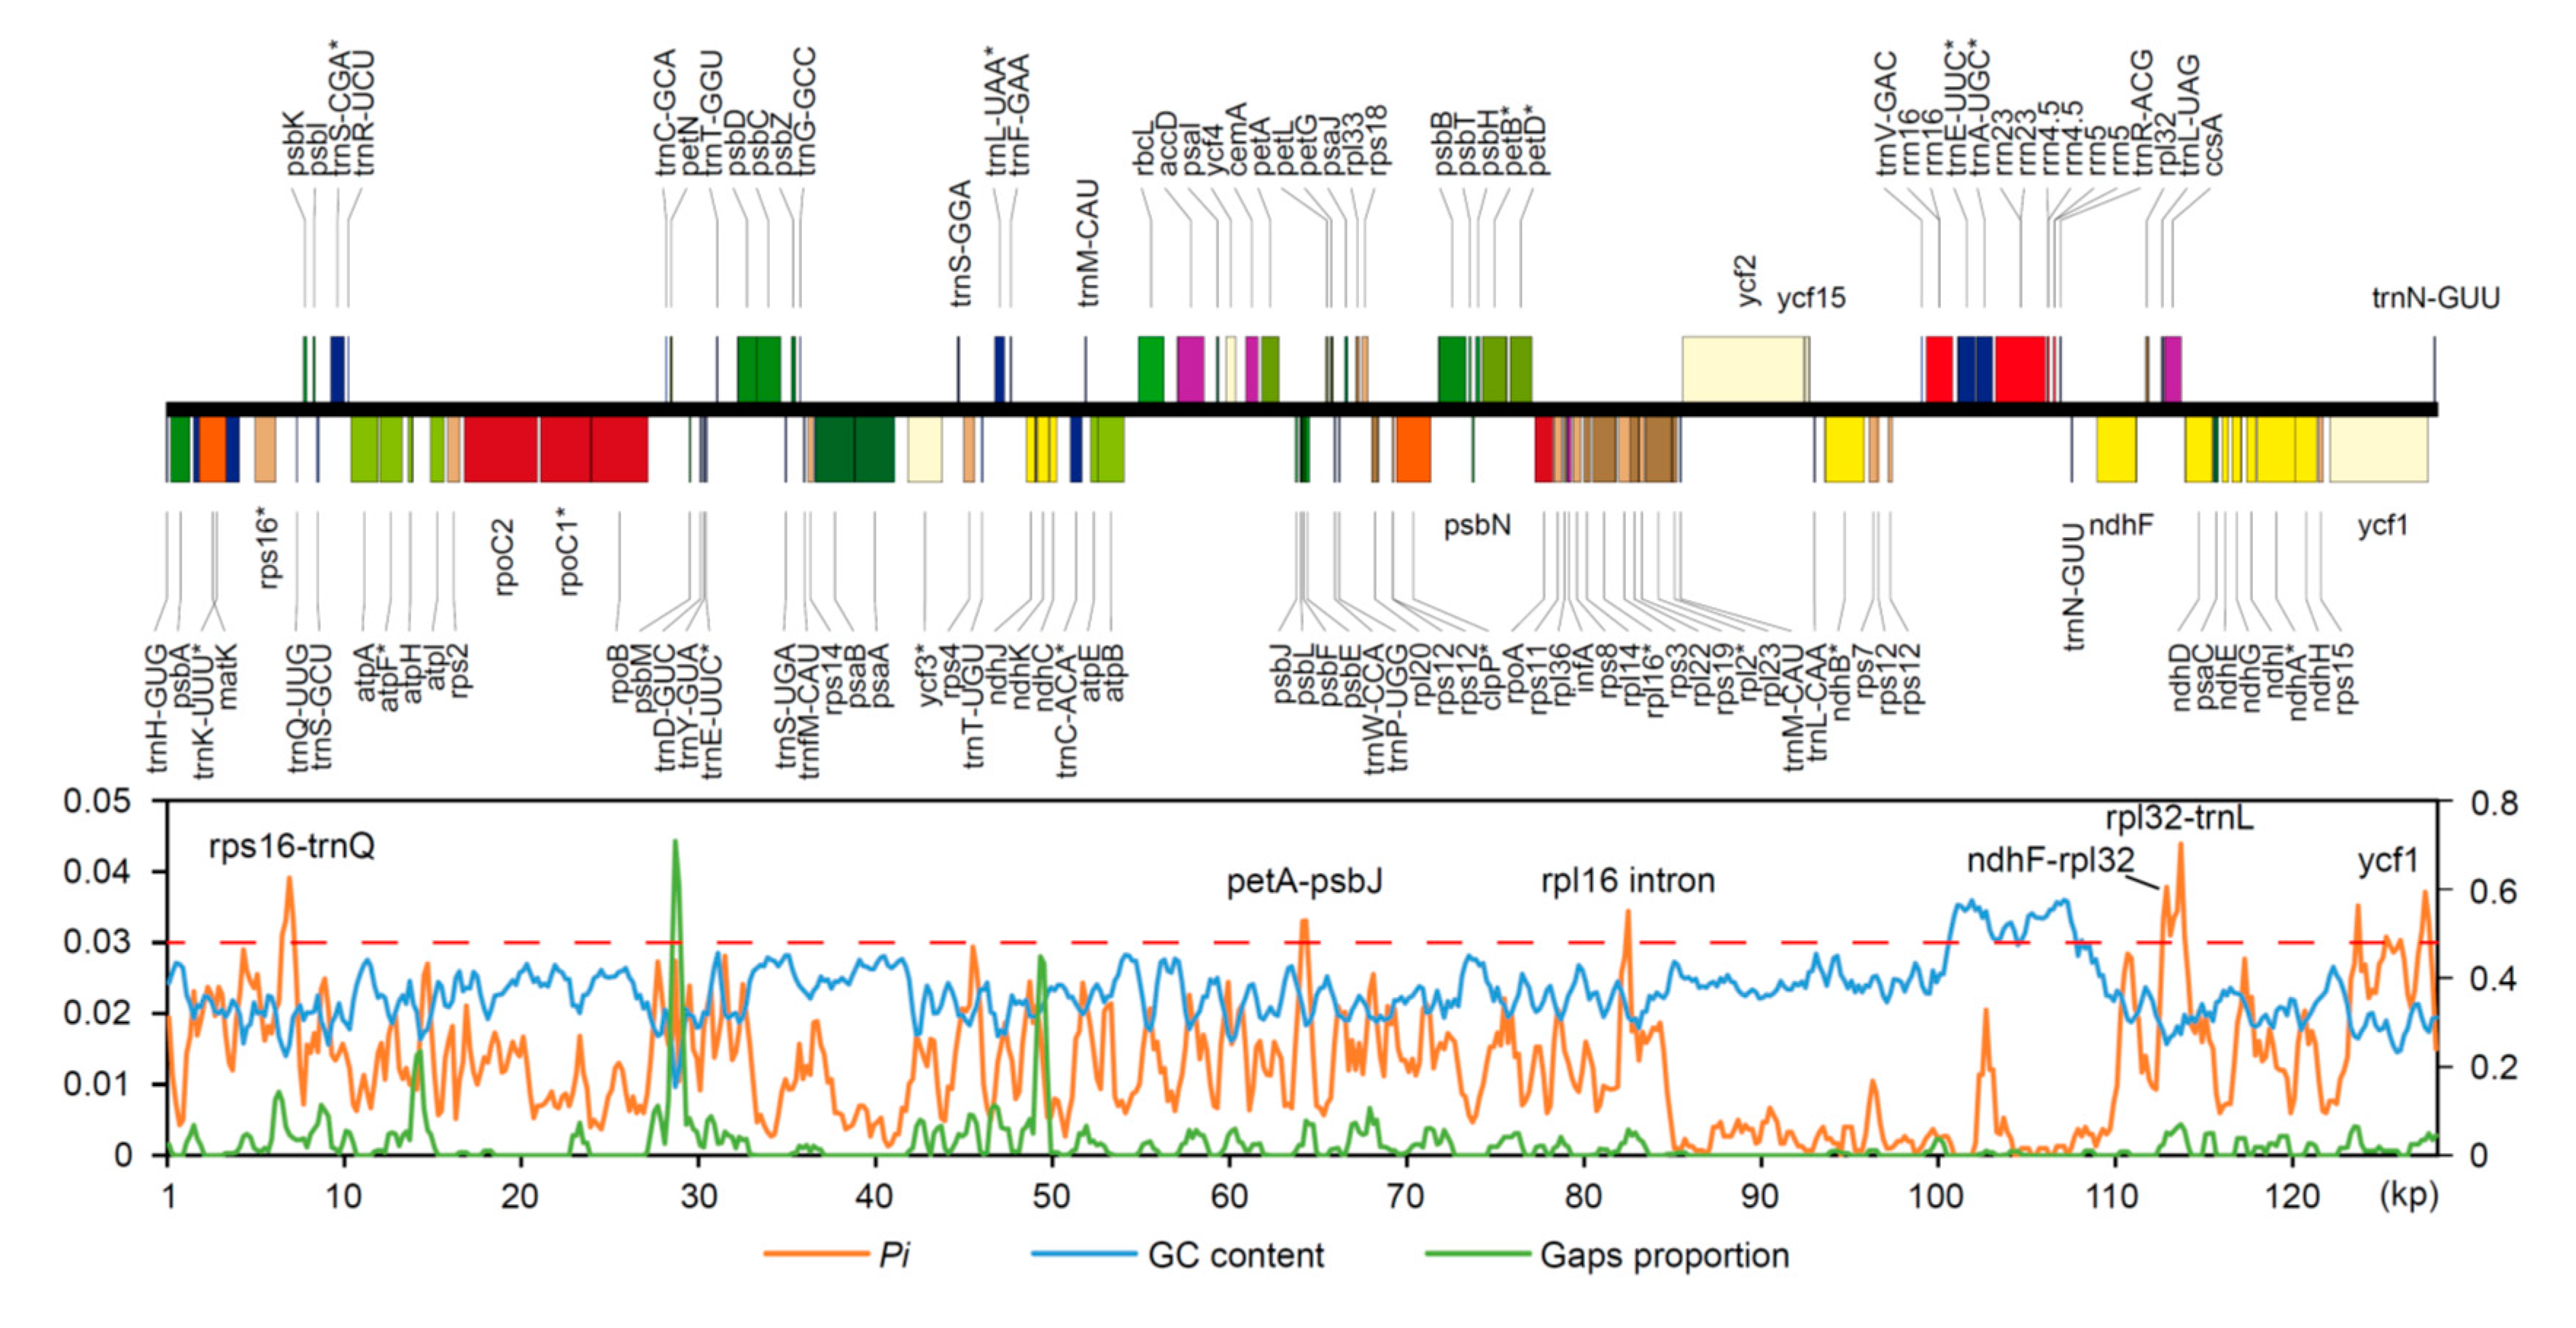
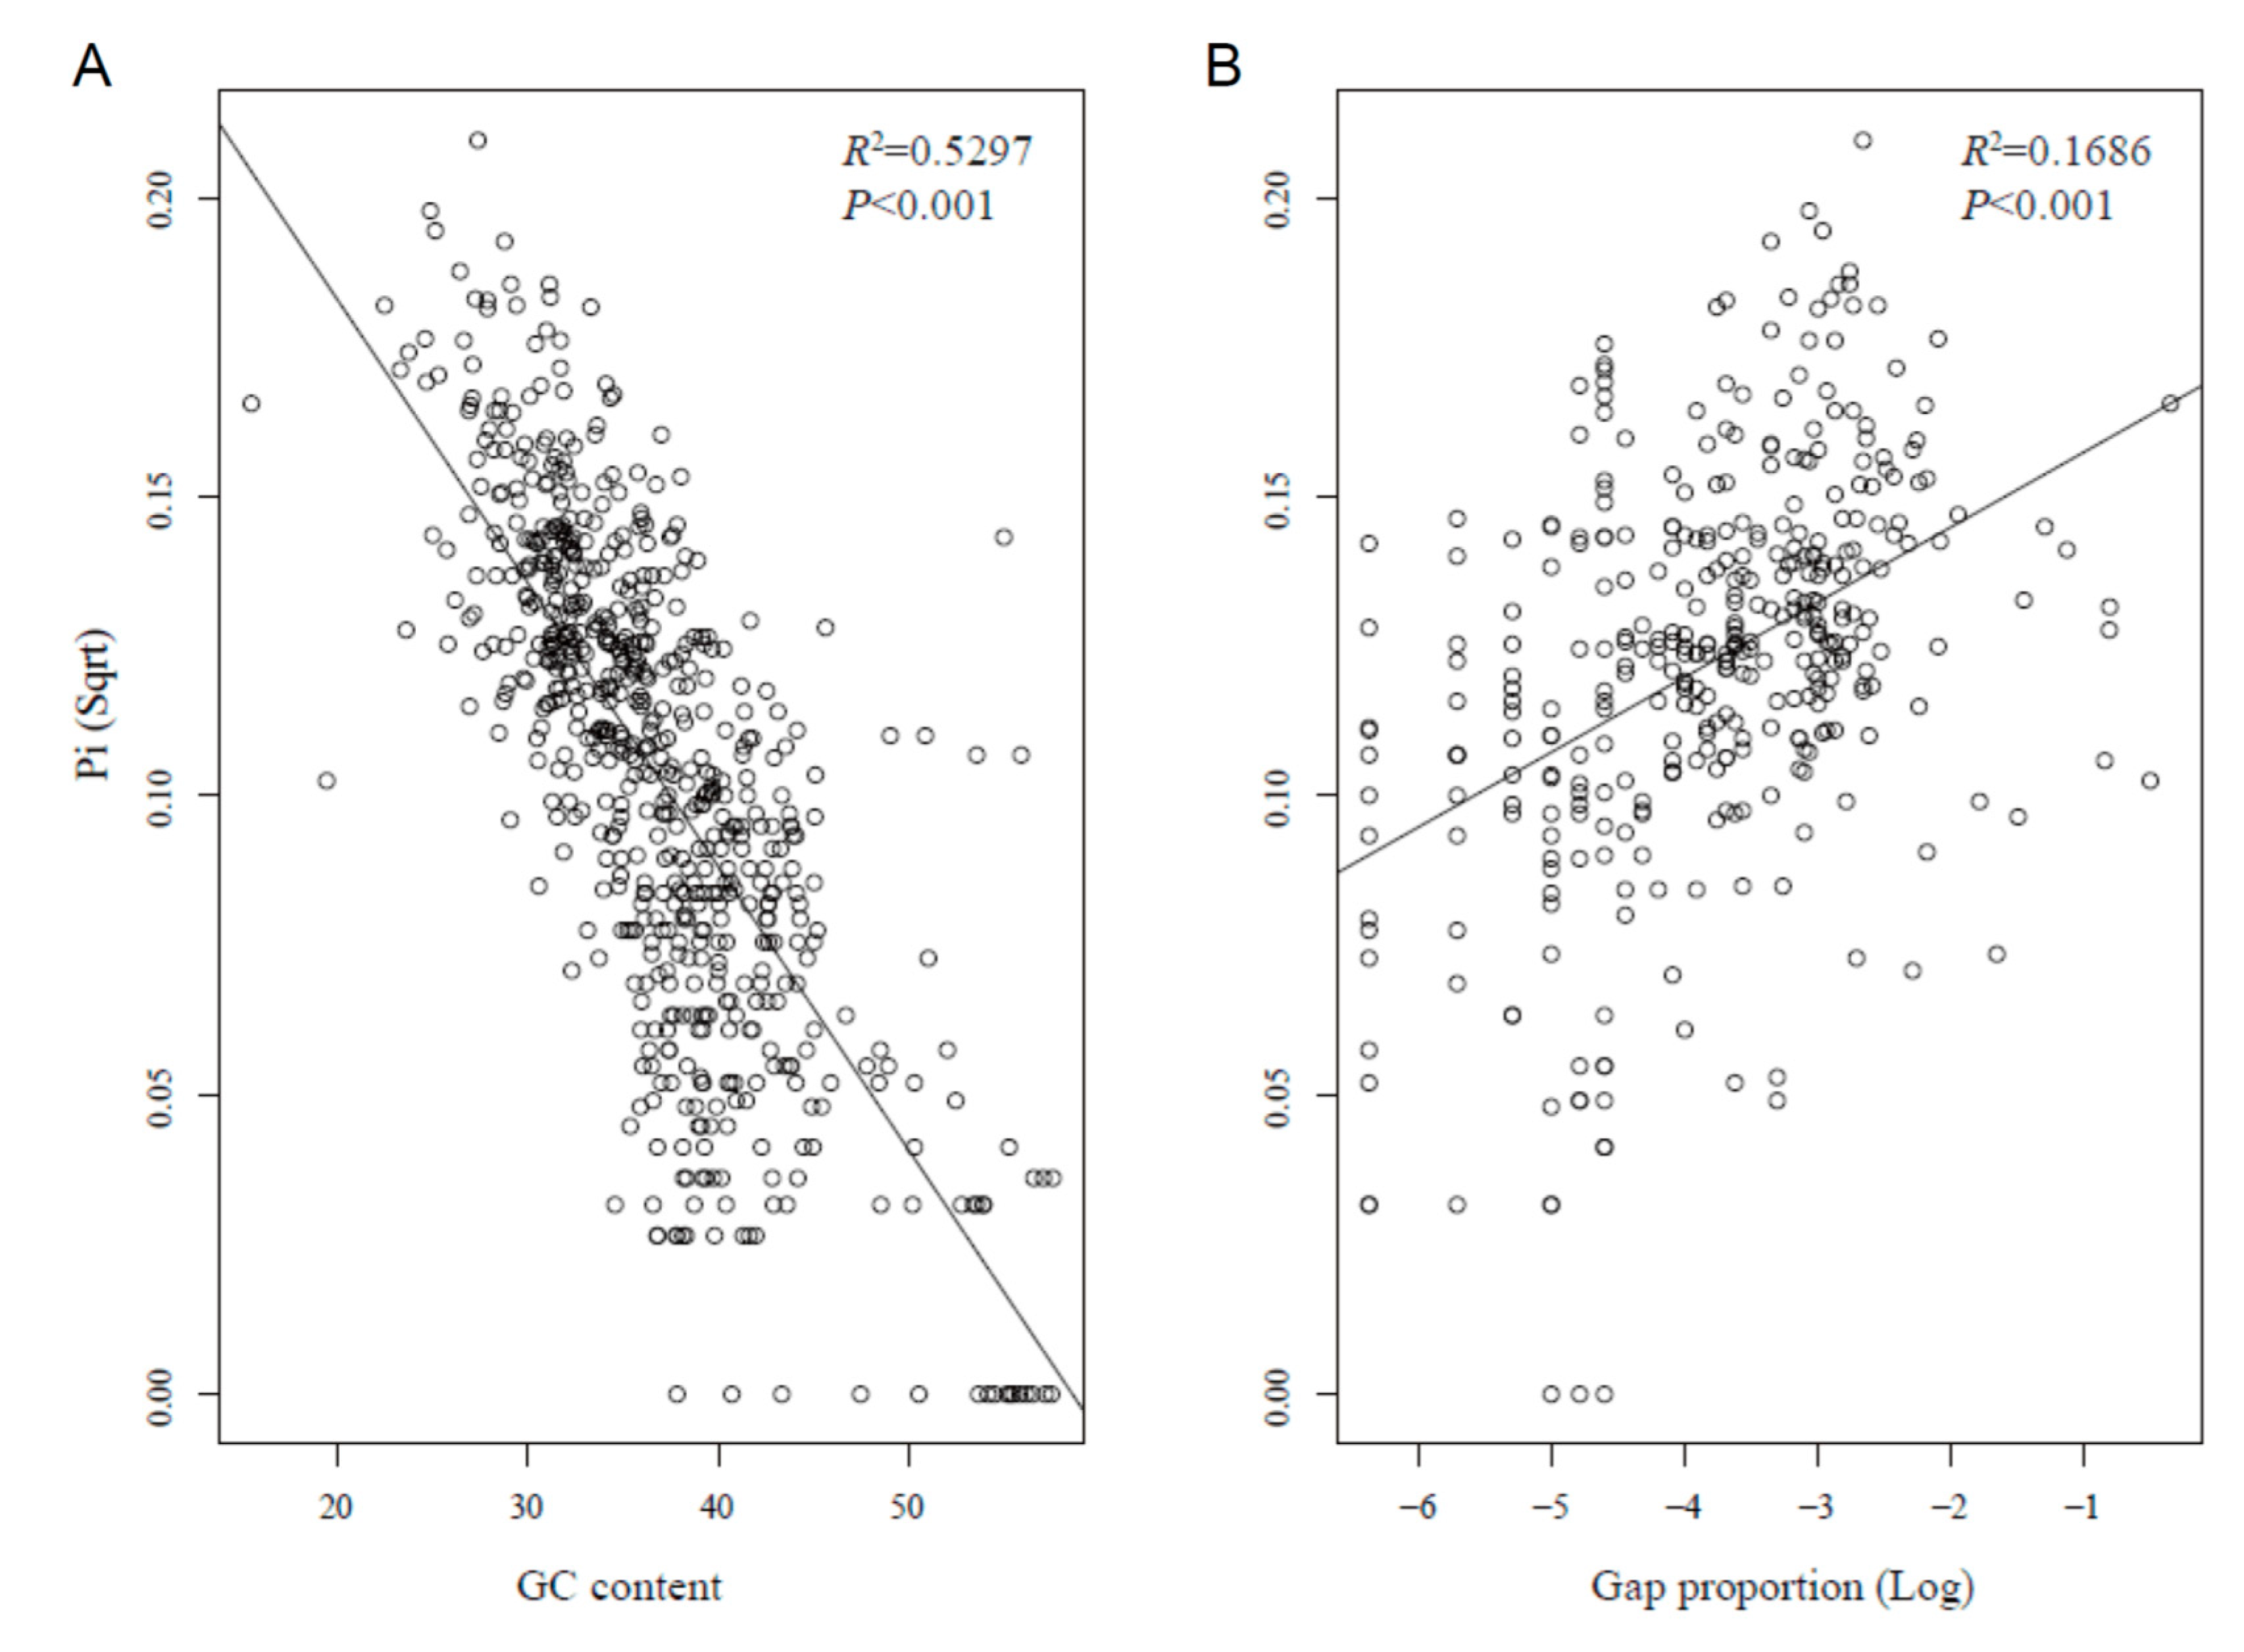
2.2. Divergence Hotspots in Chloroplast Genomes

Intergenic spacers (IGS) were the most highly variable regions, followed by introns, while coding regions were the most conserved regions (Figure 2). Specifically, the five most variable non-coding loci (Pi ˃ 0.03) identified in this study were rps16–trnQ, petA–psbJ, the rpl16 intron, ndhF–rpl32, and rpl32–trnL (Figure 2). Ycf1 was the only coding region with high sequence divergence (Pi > 0.03, Figure 2). In a comparison of PCGs using phylogenetically informative characters (PICs), ycf1 was still the most variable region, contributing 146 PICs from an alignment length of 5583 bp (2.6%) (Figure 3A, Table S1). The other coding genes with high PICs were rpoC2, ndhF, matK, and rpoB, having 58 (1.39%), 47 (2.10%), 44 (2.86%), and 30 (0.93%) PICs, respectively (Table S1). In addition, these divergence hotspots (coding and non-coding regions) were all located in the single-copy regions (LSC and SSC).
We identified a significant negative correlation between Pi and GC content (Figure 4A), while the relationship between Pi and gap (indel) ratio was a positive correlation (Figure 4B), suggesting a close association between sequence variation and nucleotide composition. Our results seem to indicate that indels have a potential impact on sequence divergence in the Pogostemon chloroplast genome. Furthermore, large indels (see above) resulted in length polymorphism in these chloroplast genomes.

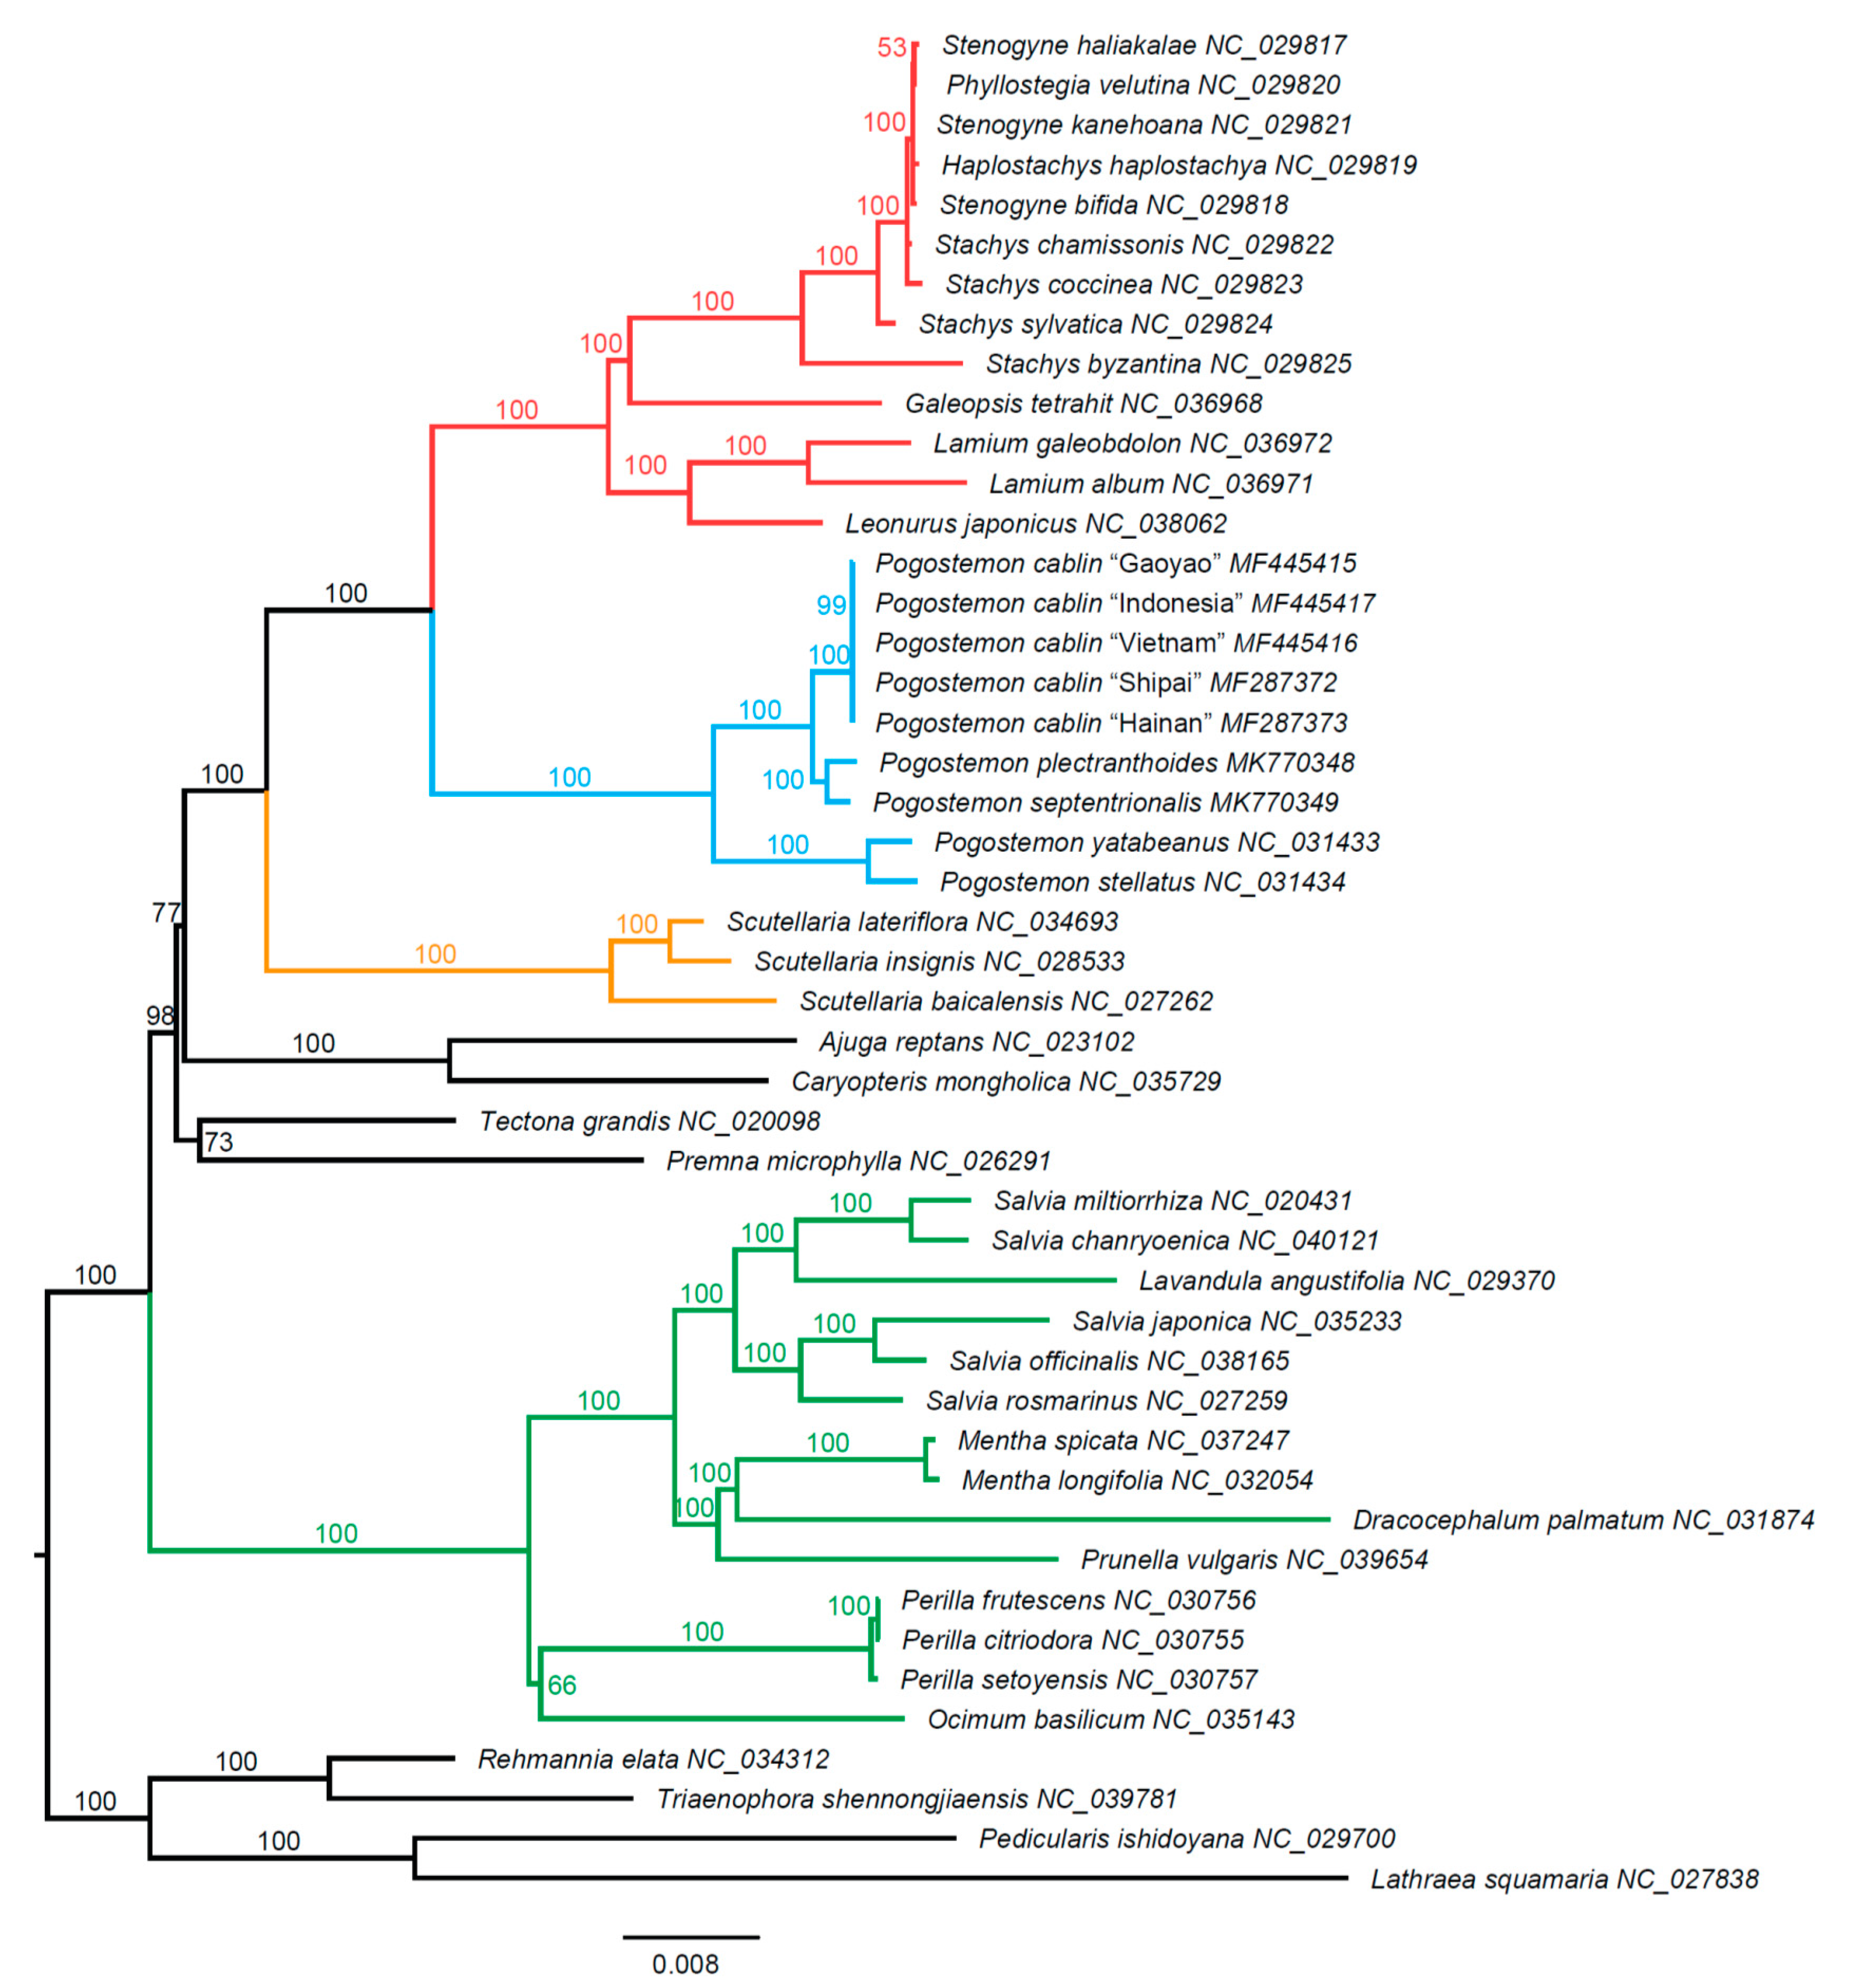
2.3. Phylogenetic Findings

The chloroplast dataset comprised 80 concatenated PCGs with a total aligned length of 68,514 bp, after stripping out the sites containing more than 20% gaps. For large matrices of this type, the best practice for accommodating rate heterogeneity is grouping genes and codon positions that fitted the same best models into different partitions. Using three partitioning strategies (the best inferred gene–codon partitions, all-gene partitions, and no partitions), maximum likelihood trees were constructed and are shown in Figure 5 and Figures S3 and S4.
The topologies of the three trees were identical (Figure 5, Figures S3 and S4). We, therefore, mainly showed the ML tree based on concatenated codon matrix of 80 PCGs with a best partition scheme (Figure 5). The tree strongly supported the monophyly of the family Lamiaceae with high bootstrap support (BS) value (100; Figure 5). Ajugoideae was sister to the clade comprised of Lamioideae and Scutellarioideae with moderate support (BS = 77) in the present study. Furthermore, we recovered Premna and Tectona as a sister group with moderate support (BS = 73). In the Lamioideae, two well-supported clades were identified (Figure 5). All Pogostemon species formed one clade, which was subsequently divided into two subclades (i.e., subg. Pogostemon and subg. Dysophyllus), each with strong support (BS = 100). The sister group to Pogostemon included Stachydeae, Galeopsis, Lamieae, and Leonureae (Figure 5). In addition, all taxa of Nepetoideae formed a monophyletic clade (BS = 100).

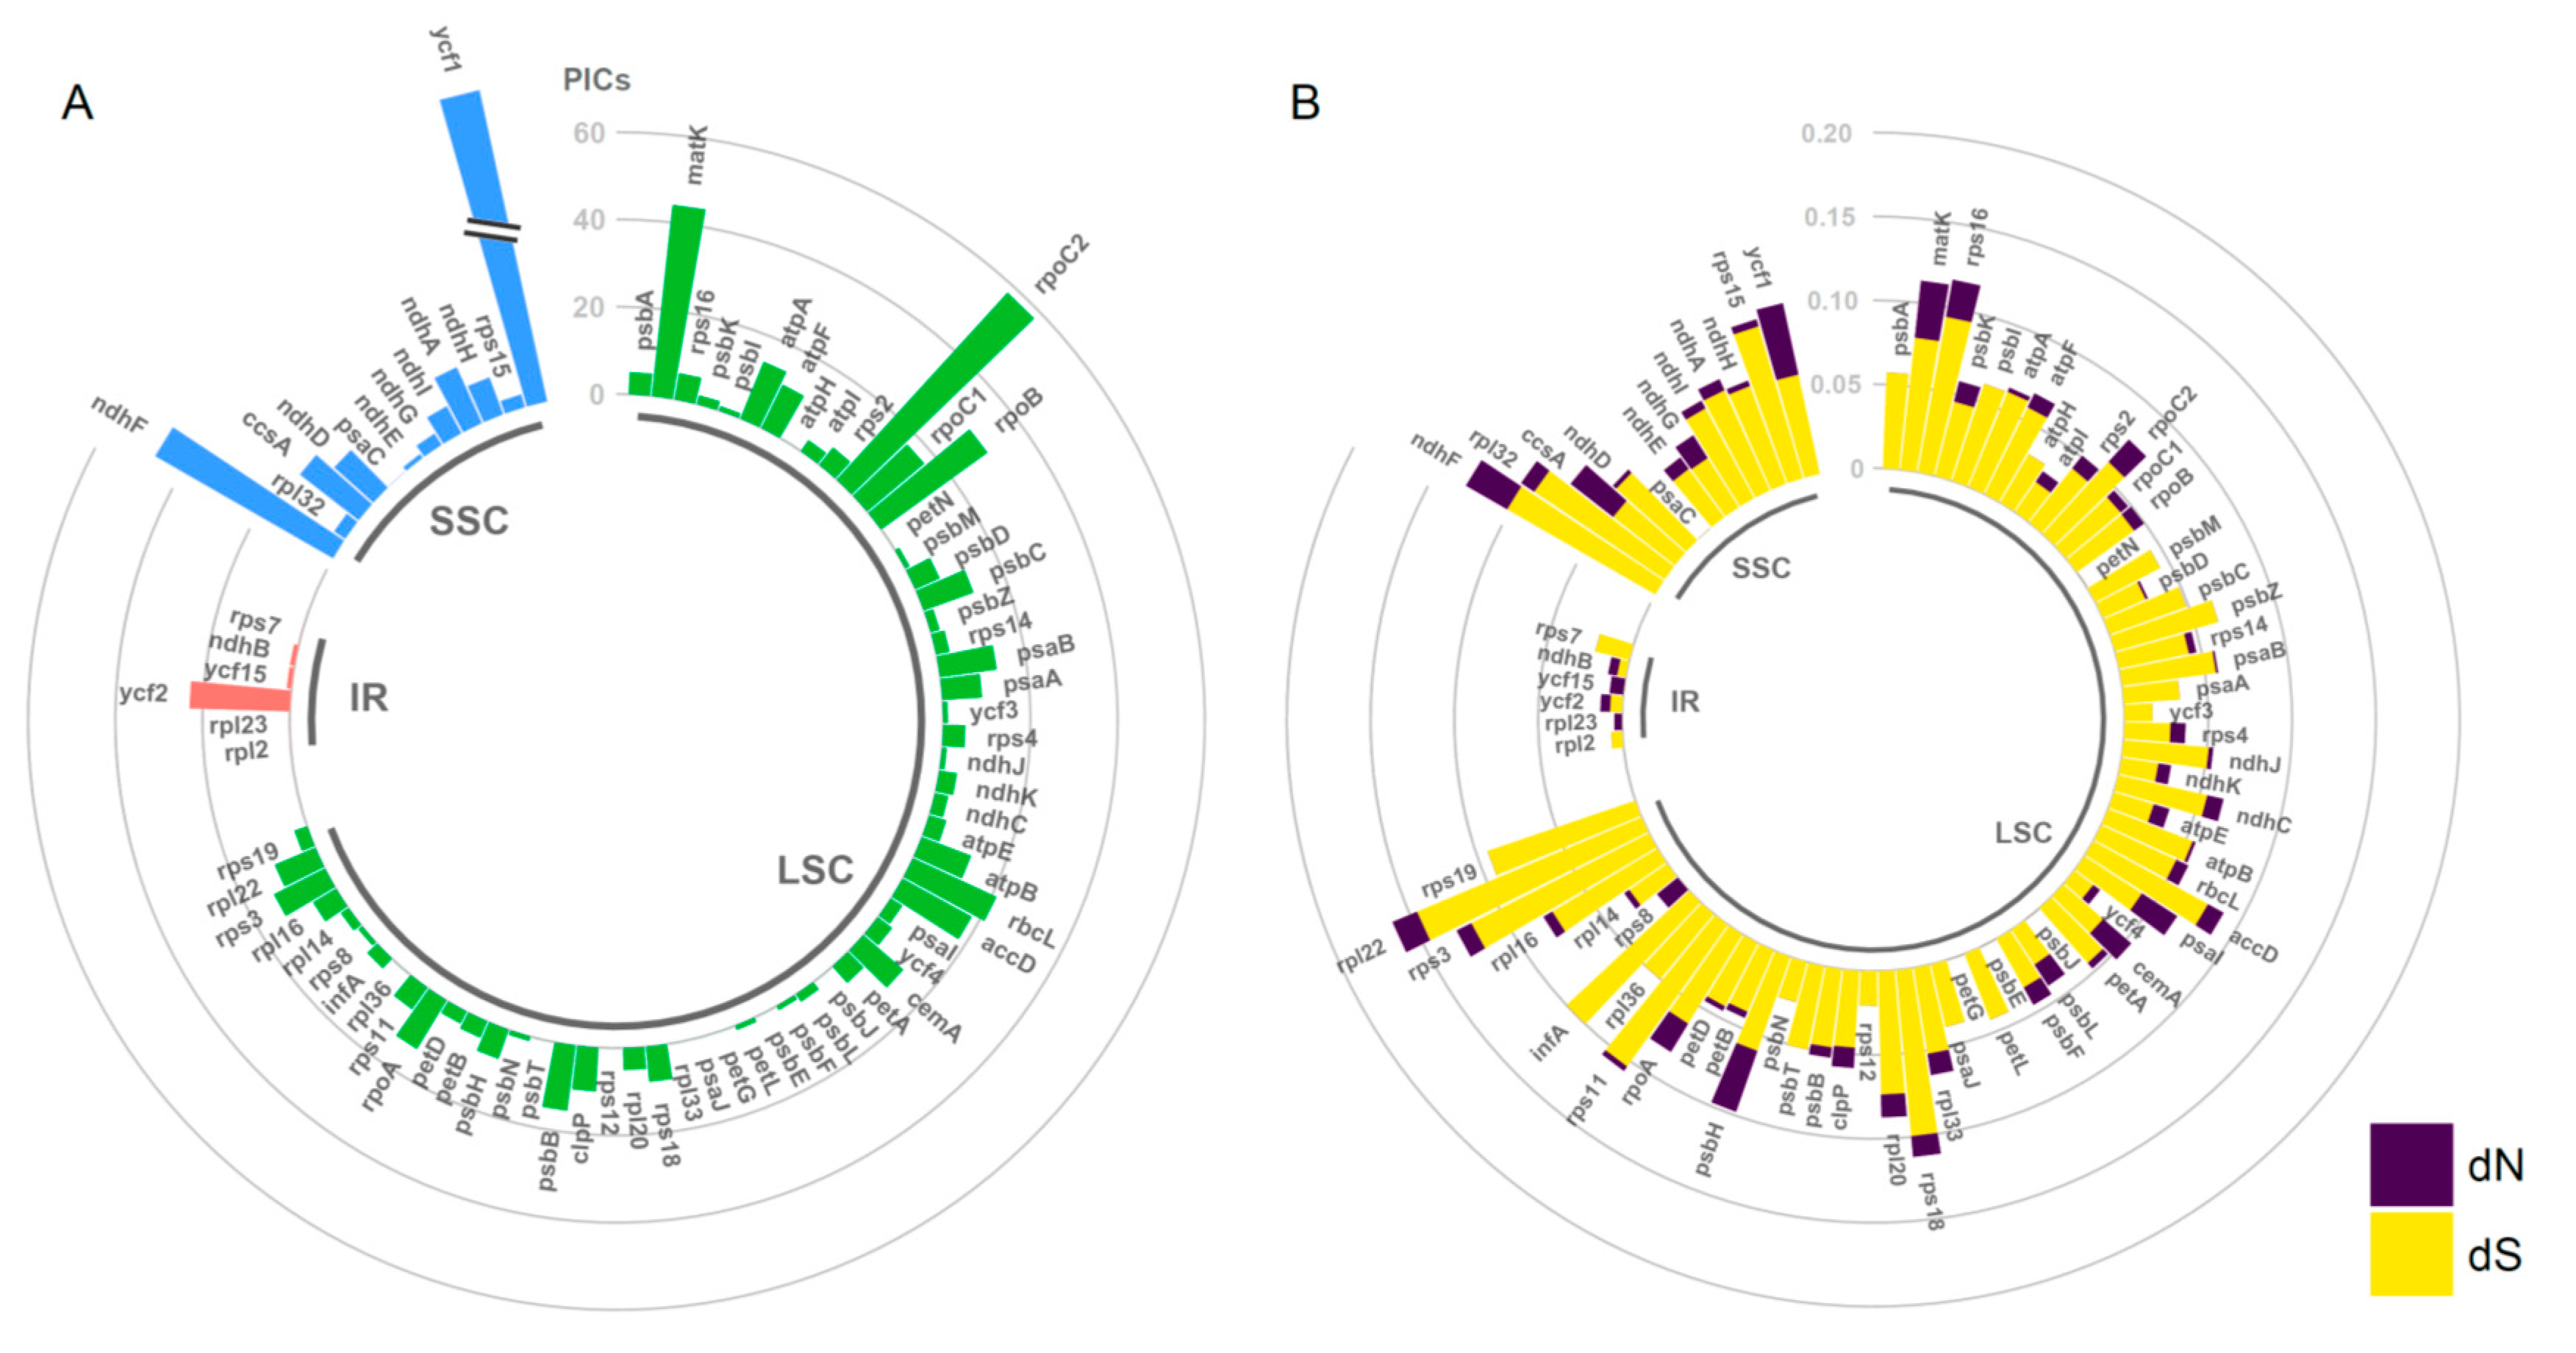
2.4. Estimation of Evolutionary Rates among Protein-Coding Genes

Substitution rates varied considerably among the chloroplast genes across the five Pogostemon species (Figure 3B). For example, eighteen genes had only synonymous substitutions, whereas three contained solely nonsynonymous substitutions (Table S1). In addition, five genes had no variation representing either type of substitution event (Table S1). The mean substitution rate for all chloroplast genes was 0.008 ± 0.0095 for nonsynonymous substitution rates (dN) and 0.0467 ± 0.0303 for synonymous substitution rates (dS) (Table S1).
Among gene groups, rpo genes had the highest mean nonsynonymous substitution rate (0.0127 ± 0.0072), followed by ycf genes (0.0125 ± 0.0176), whereas the lowest nonsynonymous substitution rate occurred in pet genes (0.0018 ± 0.0020) (Table S2). In contrast, mean synonymous substitution rates (dS) among gene groups ranged from 0.0197 to 0.0630 (Table S2).

3. Discussion

3.1. Divergence Hotspots in Cp Genomes

Genome-wide comparisons have examined sequence divergence to decide which genes or regions to utilize for phylogenetic studies within angiosperms [15,16,17] and chloroplast biotechnology [18]. The poor phylogenetic relationships within Pogostemon revealed in previous studies partly resulted from the sequences without specific highly variable chloroplast regions and adequately phylogenetically informative sites [4].
In this study, we detected six highly variable loci in Pogostemon cp genomes, all of which are located within the eight top-ranking regions identified in 25 angiosperm lineages by Shaw et al. [17], consistent with previous findings in Pogostemon [9]. The phylogenetic utility of protein-coding sequences in Pogostemon was also evaluated by a comparison of the number of PICs. Among the protein-coding genes, ycf1 has the highest PICs, followed by rpoC2, ndhF, and matK. This result is similar to the findings of Walker et al. [19]. Of the most commonly used DNA barcodes, Walker et al. [19] found that gene rpoC2 is the top-performing gene and matK greatly outperformed rbcL. They excluded ycf1 because of its long alignment length. However, the region ycf1 has been recommended as a powerful barcode for use within angiosperms [20]. In this study, at least three hotspots were identified in the ycf1 region (Figure 2), which will facilitate primer design and sequencing by the Sanger method as suggested by Dong et al. [20].
Identifying divergence hotspots has long been a central issue in chloroplast genome comparisons. In general, sequence divergence in chloroplast genomes results from several common types of variation, including substitution, insertion/deletion, duplication, and rearrangement [21]. However, few studies have taken indels or inversions into consideration when comparing sequences along chloroplast genomes [22], since a high level of indels and inversions may complicate the choice of phylogenetic markers in highly variable genomes. Given the conserved structure of cp genomes in Pogostemon, nucleotide diversity per site (Pi), gap proportion, and GC content were calculated separately in each 600 bp window. A positive relationship between nucleotide substitutions and genomic rearrangements (including indels) has been detected in previous studies of angiosperms [23]. In this study, nucleotide diversity showed a significant positive correlation with gap proportion (p < 0.001, Figure 4B), confirming the above finding by Jansen et al. [23]. One hypothesis to explain this is that aberrant DNA repair mechanisms accelerate substitution rates [24,25]. Moreover, we found that nucleotide diversity was negatively associated with GC content (Figure 4A). Previous studies indicated that base composition often plays an important role in chloroplast DNA sequence evolution, resulting in mutations that are spatially biased across the genome [23,26].

3.2. Phylogenetic Positions of Pogostemon and Its Related Taxa

In recent years, complete or nearly complete organelle genomes have become increasingly accessible, providing a powerful tool for phylogenetic studies. Our molecular phylogenetic analyses based on 80 PCGs produced a high-resolution backbone topology for the Lamiaceae. All three trees strongly supported the monophyly of the family Lamiaceae (BS = 100; Figure 5, Figures S3 and S4). Our results recognized several subfamilies as presented by Li et al. [27], i.e., the Lamioideae, Scutellarioideae, and Nepetoideae, which were fully supported by bootstrap analysis. In the Lamioideae, we confirmed the robust sister relationship between Pogostemon and the remaining taxa within the subfamily, a finding which supports the phylogeny of Bendiksby et al. [28] based on four chloroplast molecular markers. All Pogostemon species formed one group, which could be subsequently divided into two subclades with strong support (BS = 100), in agreement with the result of Yao et al. [4]. The contentious relationships among the subfamilies Ajugoideae, Viticoideae, and the genus Tectona were still not fully resolved, but we considerably improved the resolution of these relationships using chloroplast phylogenomics. For example, our result moderately supported the Ajugoideae as sister to the clade comprising the Lamioideae and Scutellarioideae (BS = 77). We also recovered Premna and Tectona as a sister group with moderate support (BS = 73), which agreed with the phylogenetic results of Bendiksby et al. [28] but differed from those in a recent study by Li et al. [27].

3.3. Substitution Rate Variation in Cp Genomes

Substitution rate heterogeneity has been observed in chloroplast genomes across different lineages of plants and among different classes of chloroplast genes [29,30]. This lineage-specific or locus-specific variation in nucleotide substitution may have played a major role in adaptive evolution in different kinds of plants. In particular, the acceleration of substitution rates for specific gene classes has been found repeatedly among many plant groups [24,31]. Drouin et al. [32] showed that the dN and dS rates for different genes within the cp genome are very similar, not varying by more than two- to four-fold. However, their viewpoint was based on only a few cp genes (i.e., atpB, matK, psaA, psbB, and rbcL), which probably resulted in an underestimation of the variation in cp genes. In the present study, the mean dS values for different cp genes varied by about threefold (0.0197 to 0.0630), in agreement with the results of Drouin et al. [32]. However, the dN values among different functional gene groups showed greater variation than dS values. For example, the dN values for rpo (RNA polymerase genes) and ycf (unknown function) genes had elevated nonsynonymous substitution rates compared with other genes, to the extent that they were seven times higher than the lowest dN value (pet genes) (Table S2). The pattern of genes with accelerated dN has been found in Pelargonium and Sileneae [33,34] and has also been reported in a comparative study on cp genomes of flowering plants [24].
The molecular mechanism underlying extremely high variation in nonsynonymous substitution rates in most plants is still elusive. It is often inferred that the variation in nonsynonymous substitution rates was more likely to result from strong coevolution with synonymous substitutions, instead of consequence from the relaxation of purifying selection [35]. However, our data did not significantly support this hypothesis, since several genes (i.e., ycf1, psbH, and matK) showed high nonsynonymous rates but low synonymous substitutions rates, which led to relatively higher dN/dS (ω) values (0.7186 for ycf1, 0.6482 for psbH, and 0.4317 for matK) (Table S1). We inferred that positive diversifying selection acting on the above genes would be expected to result in higher nonsynonymous substitution rates.

4. Materials and Methods

In this study, we newly sequenced two patchouli species (P. plectranthoides and P. septentrionalis) and two cultivars of P. cablin (“Indonesia” and “Vietnam”) using genome-skimming technology. These species were cultivated and collected in a greenhouse at South China Botanical Garden. No specific permissions were required for the relevant locations/activities. Voucher specimens were deposited in the Herbarium of South China Botanical Garden. In order to carry out a comprehensive analysis of Pogostemon, publicly available chloroplast genomes sequences (P. cablin, P. yatabeanus, and P. stellatus (Lour.) Kuntze) from Pogostemon in GenBank were used in this study (Table S3).

4.1. DNA Extraction and Sequencing

Total genomic DNA was isolated from fresh healthy leaves using a modified cetyltrimethylammonium bromide (CTAB) method [36]. The DNA concentration was estimated using a Qubit Fluorometer with a Qubit dsDNA HS Assay Kit (ThermoFisher, Waltham, MA, USA). Short-insert (ca. 500 bp) paired-end libraries were prepared using a TruePrepTM DNA Library Prep Kit V2 for Illumina (Vazyme Biotech Co., Ltd., Nanjing, China), following the manufacturer’s protocol. Genome skimming sequencing with a 2 × 150 bp chemistry reaction system was performed on an Illumina HiSeq X Ten platform at the Beijing Genomics Institute (Shenzhen, China).

4.2. Assembly and Annotation

The raw reads generated from Illumina paired-end sequencing were assessed by FastQC 0.11.5 [37] and quality control was carried out using Trimmomatic 0.35 [38] to remove adapters and low-quality nucleotide bases.
Here, we used two strategies to assemble the chloroplast genome. The first was the “seed-and-extend” approach in NOVOPlasty 2.5.9 [39], which assembles adapter-free reads into rough scaffolds. The whole chloroplast genome and rbcL protein-coding sequence of P. cablin “Shipai” (GenBank no. MF287372) were used separately as seed to trigger the assembly. To assess the quality and to correct errors that occurred in the initial assembly, we mapped cleaned reads back to the resulting scaffolds in Bowtie2 v.2.3.4 [40]. After checking and refining the reads mapping graph, a consensus sequence was generated with a 90% matching threshold. The circular and ungapped consensus sequence was considered to represent the complete chloroplast genome.
In the other approach, a “de novo assembly” strategy was employed using SPAdes assembler 3.13.0 [41], with parameters “-k 21,33,55,77 --careful --cov-cutoff 10”. We used Bandage 0.8.1 [42] to visualize and manipulate the assembly graph. Each node (or contig) in the graph was used to blast against the reference cp genome (P. cablin “Shipai”, MF287372). Nodes without blast hits were filtered out. For unresolved loops (two or more alternative nodes with the same blast hit) in the assembly graph, we dropped the nodes with lower read coverage and retained the most reliable one. For each shared node on two intersectional paths with different blast hits, we duplicated this node as repeat sequences and placed it in two distinct paths. Finally, complete chloroplast genomes were obtained from the refined graphs.
The chloroplast genomes were annotated using Dual Organellar Genome Annotator [43]. We checked and adjusted the annotations of protein-coding genes by comparison with homologous genes from the above well-annotated reference cp genomes (P. cablin “Shipai”, MF287372, and P. yatabeanus, KP718618). The tRNA genes were annotated using ARAGORN v1.2.38 [44]. Circular genome maps were drawn on the OrganellarGenomeDRAW (OGDRAW) online service following by manual modification [45]. Finally, well-annotated cp genomes were submitted to GenBank (Table S3). Raw sequencing data in this study are archived at the National Center for Biotechnology Information under BioProject PRJNA671793.

4.3. Sequence and Structure Divergence

The gene order and structures were analyzed in the pairwise comparisons across the five Pogostemon cp genomes using Geneious R11.1.5 [46]. Three single-copy (SC) and inverted repeat (IR) region (SC–IR) junctions of all Pogostemon cp genomes were manually examined to investigate expansion and contraction in the IR. Multiple sequence alignments of all five Pogostemon cp genomes were performed in MAFFT v7 [47] under default parameters and manually adjusted in Geneious. The mVISTA program in Shuffle-LAGAN mode [48] was used to visualize the overall similarities among different cp genomes in Pogostemon.
To identify divergence hotspots in chloroplast genomes, sliding window analysis (the window length was 600 bp with a 200 bp step size) was employed to calculate nucleotide diversity (Pi), GC content, and gap proportion for each window in a Pogostemon cp genome alignment, with the DendroPy library and a custom Python script [49]. Pi indicates the average number of nucleotide differences per site between two sequences from all possible pairs in an alignment. Gap proportion shows the level of missing data caused by indels. GC content gives fundamental information about the stability of nucleotide sequences, which usually corresponds to highly conserved regions constrained by mRNA secondary structures [50]. The correlation between Pi and GC content or gap proportion was tested in R 3.6.1 [51]. Before fitting to a linear regression model, Pi and gap proportion were transformed to fit the normal distribution.

4.4. Phylogenetic Analyses

In order to determine the phylogenetic position of Pogostemon and relationships among the major groups of Lamiaceae, we collected 47 chloroplast genomes, including nine accessions from the genus Pogostemon, 34 other accessions in the Lamiaceae, and four outgroup accessions from the Orobanchaceae (Table S3).
Nucleotide sequences of protein-coding genes (PCGs) were extracted from the 47 annotated chloroplast genomes from the Lamiaceae. Protein-coding sequences were first translated into amino acid sequences and aligned using MAFFT v7 under the L-INS-I method. These protein alignments were then back-translated to codon alignments in PAL2NAL [52]. A matrix was generated by concatenating the codon alignments of 80 PCGs and removing sites with >20% of gaps. Given the gene and codon position partitions, the best-fitting model of nucleotide substitution for the entire dataset was determined by the corrected Akaike information criterion (AICc) in PartitionFinder 2.1.1 [53]. Maximum likelihood (ML) analyses were performed in RAxML-HPC v8.2.12 [54] based on three partitioning strategies (one partition, gene-partitioning, and best-fit partitioning schemes). All three ML analyses were evaluated with 1000 rapid bootstrap replicates.

4.5. Estimation of Evolutionary Rates

The nucleotide sequences of 80 protein-coding genes were extracted from five Pogostemon cp genomes. Each gene was codon-aligned using the L-INS-I method in MAFFT v7. Phylogenetically informative characters (PICs) were counted for each gene using a Python script. Given both codon and related protein alignments of each gene, average nonsynonymous (dN) and synonymous (dS) substitution rates were estimated using the maximum likelihood method [55] with the F3 × 4 model implemented in the codeml program in PAML v4.9 [56]. In addition, protein-coding genes were assigned to nine functional groups according to the conventional classification. The genes within a functional group were concatenated for the above tests as well. The best ML tree based on PCGs was used as a constraint tree.

Supplementary Materials

The following are available online at https://www.mdpi.com/2223-7747/9/11/1497/s1, Figure S1: mVISTA plot showing the percent identity of plastid genomes between each of four Pogostemon species and the reference Pogostemon cablin based on pairwise global sequence alignments, Figure S2: IRa-SSC and SSC-IRb boundaries in five Pogostemon chloroplast genomes, Figure S3: Maximum likelihood tree of 43 Lamiaceae accessions and four outgroups inferred from a concatenated codon matrix of 80 plastid protein-coding genes with gene partitions, Figure S4: Maximum likelihood tree of 43 Lamiaceae accessions and four outgroups inferred from a concatenated codon supermatrix of 80 plastid protein-coding genes without partitions, Table S1: Number of phylogenetically informative characters (PICs), and dN, dS, and ω values for each protein-coding gene, Table S2: Mean dN, dS, and ω values for each group of protein-coding genes, Table S3: Samples used for chloroplast phylogenomic analyses in this study.

Author Contributions

Conceptualization, T.-J.L., C.-Y.Z., and H.F.Y.; methodology, T.-J.L.; formal analysis, C.-Y.Z. and T.-J.L.; investigation, T.-J.L. and C.-Y.Z.; resources, X.-L.M., J.-R.L., and X.-J.G; data curation, T.-J.L., C.-Y.Z., and H.-F.Y.; writing—original draft preparation, T.-J.L. and C.-Y.Z.; writing—review and editing, T.-J.L., C.-Y.Z., H.-R.H., G.Y., X.-J.G., and H.F.Y.; visualization, T.-J.L. and C.-Y.Z.; supervision, X.-J.G. All authors have read and agreed to the published version of the manuscript.

Funding

This research was funded by the Natural Science Foundation of Guangdong Food and Drug Vocational College, Guangdong, China, through Grant no. 2018ZR014 to C.-Y.Z., and the Department of Science and Technology of Guangdong Province (Grant no. 2019B030316019) and the Provincial Key R&D Program of Guangdong (Grant no. 2020B020221002) through grants to X.L.M.

Acknowledgments

We thank the technician Yu-Ying Zhou from the Molecular Ecology lab in South China Botanical Garden for preparing DNA samples.

Conflicts of Interest

The authors declare no conflict of interest.

References

  1. Harley, R.M.; Atkins, S.; Budantsev, A.L.; Cantino, P.D.; Conn, B.J.; Grayer, R.; Harley, M.M.; de Kok, R.; Krestovskaja, T.; Morales, R.; et al. Labiatae. In Flowering Plants Dicotyledons: Lamiales (Except Acanthaceae Including Avicenniaceae); Kadereit, J.W., Ed.; Springer: Berlin/Heidelberg, Germany, 2004; pp. 167–275. [Google Scholar]
  2. Bhatti, G.R.; Ingrouille, M. Systematics of Pogostemon (Labiatae). Bull. Nat. Hist. Mus. 1997, 27, 77–147. [Google Scholar]
  3. Yao, G.; Deng, Y.F.; Ge, X.J. A taxonomic revision of Pogostemon (Lamiaceae) from China. Phytotaxa 2015, 200, 1–67. [Google Scholar] [CrossRef] [Green Version]
  4. Yao, G.; Drew, B.T.; Yi, T.S.; Yan, H.F.; Yuan, Y.M.; Ge, X.J. Phylogenetic relationships, character evolution and biogeographic diversification of Pogostemon s.l. (Lamiaceae). Mol. Phylogen. Evol. 2016, 98, 184–200. [Google Scholar] [CrossRef] [PubMed]
  5. Swamy, M.K.; Sinniah, U.R. Patchouli (Pogostemon cablin Benth.): Botany, agrotechnology and biotechnological aspects. Ind. Crops Prod. 2016, 87, 161–176. [Google Scholar] [CrossRef]
  6. Weiss, E.A. Essential Oil Crops; CAB International: Wallingford, UK, 1997. [Google Scholar]
  7. Kane, N.; Sveinsson, S.; Dempewolf, H.; Yang, J.Y.; Zhang, D.; Engels, J.M.M.; Cronk, Q. Ultra-barcoding in cacao (Theobroma spp.; Malvaceae) using whole chloroplast genomes and nuclear ribosomal DNA. Am. J. Bot. 2012, 99, 320–329. [Google Scholar] [CrossRef] [Green Version]
  8. Nock, C.J.; Waters, D.L.E.; Edwards, M.A.; Bowen, S.G.; Rice, N.; Cordeiro, G.M.; Henry, R.J. Chloroplast genome sequences from total DNA for plant identification. Plant Biotechnol. J. 2011, 9, 328–333. [Google Scholar] [CrossRef] [PubMed]
  9. Zhang, C.Y.; Liu, T.J.; Yuan, X.; Huang, H.R.; Yao, G.; Mo, X.L.; Xue, X.; Yan, H.F. The plastid genome and its implications in barcoding specific-chemotypes of the medicinal herb Pogostemon cablin in China. PLoS ONE 2019, 14, e0215512. [Google Scholar] [CrossRef] [PubMed] [Green Version]
  10. Bock, D.G.; Kane, N.C.; Ebert, D.P.; Rieseberg, L.H. Genome skimming reveals the origin of the Jerusalem Artichoke tuber crop species: Neither from Jerusalem nor an artichoke. New Phytol. 2014, 201, 1021–1030. [Google Scholar] [CrossRef] [PubMed]
  11. Gitzendanner, M.A.; Soltis, P.S.; Yi, T.S.; Li, D.Z.; Soltis, D.E. Plastome phylogenetics: 30 years of inferences into plant evolution. Adv. Bot. Res. 2018, 85, 293–313. [Google Scholar]
  12. Zhang, M.Y.; Fritsch, P.W.; Ma, P.F.; Wang, H.; Lu, L.; Li, D.Z. Plastid phylogenomics and adaptive evolution of Gaultheria series Trichophyllae (Ericaceae), a clade from sky islands of the Himalaya-Hengduan Mountains. Mol. Phylogen. Evol. 2017, 110, 7–18. [Google Scholar] [CrossRef] [Green Version]
  13. Zimmer, E.A.; Wen, J. Using nuclear gene data for plant phylogenetics: Progress and prospects II. Next-gen approaches. J. Syst. Evol. 2015, 53, 371–379. [Google Scholar] [CrossRef]
  14. McKain, M.R.; Johnson, M.G.; Uribe-Convers, S.; Eaton, D.; Yang, Y. Practical considerations for plant phylogenomics. Appl. Plant Sci. 2018, 6, e1038. [Google Scholar] [CrossRef]
  15. Shaw, J.; Lickey, E.B.; Beck, J.T.; Farmer, S.B.; Liu, W.; Miller, J.; Siripun, K.C.; Winder, C.T.; Schilling, E.E.; Small, R.L. The tortoise and the hare II: Relative utility of 21 noncoding chloroplast DNA sequences for phylogenetic analysis. Am. J. Bot. 2005, 92, 142–166. [Google Scholar] [CrossRef] [PubMed] [Green Version]
  16. Shaw, J.; Lickey, E.B.; Schilling, E.E.; Small, R.L. Comparison of whole chloroplast genome sequences to choose noncoding regions for phylogenetic studies in angiosperms: The tortoise and the hare III. Am. J. Bot. 2007, 94, 275–288. [Google Scholar] [CrossRef] [Green Version]
  17. Shaw, J.; Shafer, H.L.; Leonard, O.R.; Kovach, M.J.; Schorr, M.; Morris, A.B. Chloroplast DNA sequence utility for the lowest phylogenetic and phylogeographic inferences in angiosperms: The tortoise and the hare IV. Am. J. Bot. 2014, 101, 1987–2004. [Google Scholar] [CrossRef] [PubMed] [Green Version]
  18. Ruhlman, T.; Verma, D.; Samson, N.; Daniell, H. The role of heterologous chloroplast sequence elements in transgene integration and expression. Plant Physiol. 2010, 152, 2088–2104. [Google Scholar] [CrossRef] [PubMed]
  19. Walker, J.F.; Stull, G.W.; Walker-Hale, N.; Vargas, O.M.; Larson, D.A. Characterizing gene tree conflict in plastome-inferred phylogenies. bioRxiv 2019. [Google Scholar] [CrossRef] [Green Version]
  20. Dong, W.P.; Xu, C.; Li, C.H.; Sun, J.H.; Zuo, Y.J.; Shi, S.; Cheng, T.; Guo, J.J.; Zhou, S.L. ycf1, the most promising plastid DNA barcode of land plants. Sci. Rep. 2015, 5, 8348. [Google Scholar] [CrossRef] [Green Version]
  21. Jansen, R.K.; Ruhlman, T.A. Plastid genomes of seed plants. In Genomics of Chloroplasts and Mitochondria; Bock, R., Knoop, V., Eds.; Springer: Dordrecht, The Netherlands, 2012; pp. 103–126. [Google Scholar]
  22. Dong, W.P.; Liu, J.; Yu, J.; Wang, L.; Zhou, S.L. Highly variable chloroplast markers for evaluating plant phylogeny at low taxonomic levels and for DNA barcoding. PLoS ONE 2012, 7. [Google Scholar] [CrossRef] [PubMed]
  23. Jansen, R.K.; Cai, Z.; Raubeson, L.A.; Daniell, H.; Depamphilis, C.W.; Leebens-Mack, J.; Muller, K.F.; Guisinger-Bellian, M.; Haberle, R.C.; Hansen, A.K.; et al. Analysis of 81 genes from 64 plastid genomes resolves relationships in angiosperms and identifies genome-scale evolutionary patterns. Proc. Natl. Acad. Sci. USA 2007, 104, 19369–19374. [Google Scholar] [CrossRef] [Green Version]
  24. Guisinger, M.M.; Kuehl, J.N.V.; Boore, J.L.; Jansen, R.K. Genome-wide analyses of Geraniaceae plastid DNA reveal unprecedented patterns of increased nucleotide substitutions. Proc. Natl. Acad. Sci. USA 2008, 105, 18424–18429. [Google Scholar] [CrossRef] [Green Version]
  25. Guisinger, M.M.; Kuehl, J.V.; Boore, J.L.; Jansen, R.K. Extreme reconfiguration of plastid genomes in the angiosperm family Geraniaceae: Rearrangements, repeats, and codon usage. Mol. Biol. Evol. 2011, 28, 583–600. [Google Scholar] [CrossRef] [Green Version]
  26. Decker-Walters, D.S.; Chung, S.M.; Staub, J.E. Plastid sequence evolution: A new pattern of nucleotide substitutions in the Cucurbitaceae. J. Mol. Evol. 2004, 58, 606–614. [Google Scholar] [CrossRef]
  27. Li, B.; Cantino, P.D.; Olmstead, R.G.; Bramley, G.L.C.; Xiang, C.L.; Ma, Z.H.; Tan, Y.H.; Zhang, D.X. A large-scale chloroplast phylogeny of the Lamiaceae sheds new light on its subfamilial classification. Sci. Rep. 2016, 6, 34343. [Google Scholar] [CrossRef] [Green Version]
  28. Bendiksby, M.; Thorbek, L.; Scheen, A.C.; Lindqvist, C.; Ryding, O. An updated phylogeny and classification of Lamiaceae subfamily Lamioideae. Taxon 2011, 60, 471–484. [Google Scholar] [CrossRef]
  29. Gaut, B.; Yang, L.; Takuno, S.; Eguiarte, L.E. The patterns and causes of variation in plant nucleotide substitution rates. Annu. Rev. Ecol. Evol. Syst. 2011, 42, 245–266. [Google Scholar] [CrossRef] [Green Version]
  30. Wicke, S.; Schneeweiss, G. Next-generation organellar genomics: Potentials and pitfalls of high-throughput technologies for molecular evolutionary studies and plant systematics. In Next Generation Sequencing in Plant Systematics; Hörandl, E., Appelhans, M., Eds.; Koeltz Scientific Books: Konigstein, Germany, 2015. [Google Scholar]
  31. Bock, D.G.; Andrew, R.L.; Rieseberg, L.H. On the adaptive value of cytoplasmic genomes in plants. Mol. Ecol. 2014, 23, 4899–4911. [Google Scholar] [CrossRef]
  32. Drouin, G.; Daoud, H.; Xia, J. Relative rates of synonymous substitutions in the mitochondrial, chloroplast and nuclear genomes of seed plants. Mol. Phylogen. Evol. 2008, 49, 827–831. [Google Scholar] [CrossRef]
  33. Park, S.; Ruhlman, T.A.; Weng, M.L.; Hajrah, N.H.; Sabir, J.S.M.; Jansen, R.K. Contrasting patterns of nucleotide substitution rates provide insight into dynamic evolution of plastid and mitochondrial genomes of Geranium. Genome Biol. Evol. 2017, 9, 1766–1780. [Google Scholar] [CrossRef]
  34. Sloan, D.B.; Triant, D.A.; Forrester, N.J.; Bergner, L.M.; Wu, M.; Taylor, D.R. A recurring syndrome of accelerated plastid genome evolution in the angiosperm tribe Sileneae (Caryophyllaceae). Mol. Phylogen. Evol. 2014, 72, 82–89. [Google Scholar] [CrossRef]
  35. Wicke, S.; Naumann, J. Molecular evolution of plastid genomes in parasitic flowering plants. In Advances in Botanical Research; Chaw, S.-M., Jansen, R.K., Eds.; Academic Press: London, UK, 2018; Volume 85, pp. 315–347. [Google Scholar]
  36. Porebski, S.; Bailey, L.G.; Baum, B.R. Modification of a CTAB DNA extraction protocol for plants containing high polysaccharide and polyphenol components. Plant Mol. Biol. Rep. 1997, 15, 8–15. [Google Scholar] [CrossRef]
  37. Andrews, S.; FASTQC. A Quality Control Tool for High Throughput Sequence Data. Available online: http://www.bioinformatics.babraham.ac.uk/projects/fastqc/ (accessed on 20 September 2019).
  38. Bolger, A.M.; Lohse, M.; Usadel, B. Trimmomatic: A flexible trimmer for Illumina sequence data. Bioinformatics 2014, 30, 2114–2120. [Google Scholar] [CrossRef] [Green Version]
  39. Dierckxsens, N.; Mardulyn, P.; Smits, G. NOVOPlasty: De novo assembly of organelle genomes from whole genome data. Nucleic Acids Res. 2017, 45, e18. [Google Scholar]
  40. Langmead, B.; Salzberg, S.L. Fast gapped-read alignment with Bowtie 2. Nat. Methods 2012, 9, 357–359. [Google Scholar] [CrossRef] [Green Version]
  41. Bankevich, A.; Nurk, S.; Antipov, D.; Gurevich, A.A.; Dvorkin, M.; Kulikov, A.S.; Lesin, V.M.; Nikolenko, S.I.; Pham, S.; Prjibelski, A.D.; et al. SPAdes: A new genome assembly algorithm and its applications to single-cell sequencing. J. Comput. Biol. 2012, 19, 455–477. [Google Scholar] [CrossRef] [PubMed] [Green Version]
  42. Wick, R.R.; Schultz, M.B.; Zobel, J.; Holt, K.E. Bandage: Interactive visualization of de novo genome assemblies. Bioinformatics 2015, 31, 3350–3352. [Google Scholar] [CrossRef] [Green Version]
  43. Wyman, S.K.; Jansen, R.K.; Boore, J.L. Automatic annotation of organellar genomes with DOGMA. Bioinformatics 2004, 20, 3252–3255. [Google Scholar] [CrossRef] [PubMed] [Green Version]
  44. Laslett, D.; Canback, B. ARAGORN, a program to detect tRNA genes and tmRNA genes in nucleotide sequences. Nucleic Acids Res. 2004, 32, 11–16. [Google Scholar] [CrossRef]
  45. Lohse, M.; Drechsel, O.; Kahlau, S.; Bock, R. OrganellarGenomeDRAW-a suite of tools for generating physical maps of plastid and mitochondrial genomes and visualizing expression data sets. Nucleic Acids Res. 2013, 41, W575–W581. [Google Scholar] [CrossRef]
  46. Kearse, M.; Moir, R.; Wilson, A.; Stones-Havas, S.; Cheung, M.; Sturrock, S.; Buxton, S.; Cooper, A.; Markowitz, S.; Duran, C.; et al. Geneious Basic: An integrated and extendable desktop software platform for the organization and analysis of sequence data. Bioinformatics 2012, 28, 1647–1649. [Google Scholar] [CrossRef]
  47. Nakamura, T.; Yamada, K.D.; Tomii, K.; Katoh, K. Parallelization of MAFFT for large-scale multiple sequence alignments. Bioinformatics 2018, 34, 2490–2492. [Google Scholar] [CrossRef] [PubMed] [Green Version]
  48. Brudno, M.; Malde, S.; Poliakov, A.; Do, C.B.; Couronne, O.; Dubchak, I.; Batzoglou, S. Glocal alignment: Finding rearrangements during alignment. Bioinformatics 2003, 19, i54–i62. [Google Scholar] [CrossRef] [Green Version]
  49. Sukumaran, J.; Holder, M.T. DendroPy: A python library for phylogenetic computing. Bioinformatics 2010, 26, 1569–1571. [Google Scholar] [CrossRef] [Green Version]
  50. Šmarda, P.; Bureš, P. The Variation of Base Composition in Plant Genomes. In Plant Genomes, Their Residents, and Their Evolutionary Dynamics; Wendel, J.F., Greilhuber, J., Dolezel, J., Leitch, I.J., Eds.; Springer: Vienna, Austria, 2012; pp. 209–235. [Google Scholar] [CrossRef]
  51. Team, R.D.C. R: A Language and Environment for Statistical Computing; R Foundation for Statistical Computing: Vienna, Austria, 2019. [Google Scholar]
  52. Suyama, M.; Torrents, D.; Bork, P. PAL2NAL: Robust conversion of protein sequence alignments into the corresponding codon alignments. Nucleic Acids Res. 2006, 34, W609–W612. [Google Scholar] [CrossRef] [Green Version]
  53. Lanfear, R.; Frandsen, P.B.; Wright, A.M.; Senfeld, T.; Calcott, B. PartitionFinder 2: New methods for selecting partitioned models of evolution for molecular and morphological phylogenetic analyses. Mol. Biol. Evol. 2017, 34, 772–773. [Google Scholar] [CrossRef] [Green Version]
  54. Stamatakis, A. RAxML version 8: A tool for phylogenetic analysis and post-analysis of large phylogenies. Bioinformatics 2014, 30, 1312–1313. [Google Scholar] [CrossRef]
  55. Goldman, N.; Yang, Z. A codon-based model of nucleotide substitution for protein-coding DNA sequences. Mol. Biol. Evol. 1994, 11, 725–736. [Google Scholar] [CrossRef] [Green Version]
  56. Yang, Z.H. PAML 4: Phylogenetic analysis by maximum likelihood. Mol. Biol. Evol. 2007, 24, 1586–1591. [Google Scholar] [CrossRef] [PubMed] [Green Version]
Figure 1. Physical map of two chloroplast genomes from Pogostemon plectranthoides (outer circle) and Pogostemon septentrionalis (inner circle). Genes inside the circle are transcribed clockwise and those outside are transcribed counterclockwise. The light gray inner circle corresponds to the AT content and the dark gray circle to the GC content. Genes belonging to different functional groups are shown in different colors. Asterisks indicate intron-containing genes.
Plants 09 01497 g001
Figure 2. Sliding window analysis showing the nucleotide diversity (Pi), GC content, and gap proportion in the five Pogostemon chloroplast genome sequences, using 600 bp windows and a 200 bp step size.
Plants 09 01497 g002
Figure 3. Summary of variation in phylogenetically informative characters (PICs) and substitution rates in Pogostemon. (A) Phylogenetically informative character variation in protein-coding genes in the five Pogostemon chloroplast genomes indicated by PICs. (B) Nonsynonymous (dN) and synonymous (dS) substitution rate for each protein-coding gene in the five Pogostemon chloroplast genomes.
Plants 09 01497 g003
Figure 4. GC content and gap proportion are correlated with Pi. (A) Scatter plot showing a significant negative correlation (p < 0.001) between GC content and Pi (Sqrt). (B) Scatter plot showing a significant positive correlation (p < 0.001) between gap (indels) proportion and Pi (Sqrt) in the five Pogostemon chloroplast genomes. All three features were measured using 600 bp windows and a 200 bp step size.
Plants 09 01497 g004
Figure 5. Maximum likelihood tree of 43 Lamiaceae accessions and four outgroups inferred from a concatenated codon supermatrix of 80 chloroplast protein-coding genes with a best partition scheme. Red clade: Stachydeae + Galeopsis + Lamieae + Leonureae, blue clade: Pogostemon, yellow clade: Scutellarioideae, and green clade: Nepetoideae. The group including red and blue colors is the Lamioideae. Numbers on the branches are bootstrap support values.
Plants 09 01497 g005
Table 1. Characteristics of chloroplast genomes from five species in the genus Pogostemon.
Genome FeatureP. plectranthoidesP. septentrionalisP. yatabeanusP. stellatusP. cablin “Gaoyao”
Genome size152,430152,514152,707151,824152,461
LSC length83,51483,61483,79183,01283,553
IR length25,66625,66525,67425,64425,662
SSC length17,58417,57017,56817,52417,584
Total coding length91,42491,44591,13291,13591,442
Protein-coding length79,50079,52179,27579,27879,518
rRNA-coding length90649064906490649064
tRNA-coding length28602860279327932860
Total GC content (%)38.338.238.238.238.2
LSC GC content (%)36.436.436.236.336.4
IR GC content (%)43.443.443.443.443.4
SSC GC content (%)32.132.13232.132.1
Total number of genes (total/different)132/114132/114132/114132/114132/114
Number of duplicated genes in IR1818181818
Number of genes with introns (with 3 exons)18(2)18(2)18(2)18(2)18(2)
Number of protein-coding genes (total/in IR)80/780/780/780/780/7
Number of tRNA genes (total/in IR)30/730/730/730/730/7
Number of rRNA genes (total/in IR)4/44/44/44/44/4
LSC—large single-copy region; SSC—small single-copy region; IR—inverted repeats region.
Publisher’s Note: MDPI stays neutral with regard to jurisdictional claims in published maps and institutional affiliations.

