Article

How Do Novel M-Rootstock (Vitis Spp.) Genotypes Cope with Drought?

Dipartimento di Scienze Agrarie ed Ambientali, Università degli Studi di Milano, via Giovanni Celoria 2, 20133 Milano, Italy
*
Authors to whom correspondence should be addressed.
Plants 2020, 9(10), 1385; https://doi.org/10.3390/plants9101385
Submission received: 3 September 2020 / Revised: 9 October 2020 / Accepted: 14 October 2020 / Published: 17 October 2020

Abstract

:
Most of the vineyards around the world are in areas characterized by seasonal drought, where water deficits and high temperatures represent severe constraints on the regular grapevine growth cycle. Although grapevines are well adapted to arid and semi-arid environments, water stress can cause physiological changes, from mild to irreversible. Screening of available Vitis spp. genetic diversity for new rootstock breeding programs has been proposed as a way for which new viticulture challenges may be faced. In 2014, novel genotypes (M-rootstocks) were released from the University of Milan. In this work, the behavior of M1, M3 and M4 in response to decreasing water availabilities (80%, 50% and 20% soil water content, SWC) was investigated at the physiological and gene expression levels, evaluating gas exchange, stem water potential and transcript abundances of key genes related to ABA (abscisic acid) biosynthesis (VvZEP, VvNCED1 and VvNCED2) and signaling (VvPP2C4, VvSnRK2.6 and VvABF2), and comparing them to those of cuttings of nine commercial rootstocks widely used in viticulture. M-rootstocks showed a change at physiological levels in severe water-stressed conditions (20% soil water content, SWC), reducing the stomatal conductance and stem water potential, but maintaining high photosynthetic activity. Water use efficiency was high in water-limiting conditions. The transcriptional changes were observed at 50% SWC, with an increment of transcripts of VvNCED1 and VvNCED2 genes. M-rootstocks showed similar behavior to 1103P and 110R rootstocks, two highly tolerant commercial genotypes. These rootstocks adopted a tolerant strategy to face water-stressed conditions.

1. Introduction

Grapevine (Vitis vinifera L.) is one of the most widely cultivated and prized fruit crops around the world. In arid and semi-arid environments, the vines undergo a slow decrease in water availability during the growing season [1]. Traditionally, grapevine is a non-irrigated crop due to the adaptation to water limited conditions, though severe water stress causes minor to irreversible physiological and biochemical changes [2,3].
World viticulture is characterized by the use of V. vinifera varieties grafted onto a rootstock (Vitis spp.) due to the arrival of phylloxera (Daktulosphaira vitifoliae (Fitch)), a severe threat for grapevine survival, which was accidentally imported into Europe from North America [4]. North American Vitis species are able to resist to phylloxera due to having co-evolved with the pathogen, therefore they are utilized as rootstocks, as single or inter-specific hybrids. Rootstocks also contribute to the control of other soil-borne pests such as nematodes, as well as various abiotic constraints, such as drought, salinity, lime-rich soils and deficient mineral nutrition [5,6,7,8]. They also modify whole plant development, biomass accumulation and phenology [9].
The Mediterranean basin is considered one of the most vulnerable regions of the world to climate change and will potentially have to deal with water scarcity and soil erosion in the next few years [10,11]. Its climate is characterized by infrequent rainfall (less than 100 days per year) that is unevenly distributed over time (long periods of summer drought) and sometimes quite sparse (about 300 to 500 mm per year in some semi-arid regions). Most climate change scenarios for this area predict a decrease in rainfall and higher temperatures. IPCC (Intergovernmental Panel on Climate Change) forecasts indicate a yearly temperature increase between 2 °C and 4 °C and a decrease in rainfall between 4% and 30% by 2050 [12]. Due to their perennial status, grapevines will be highly vulnerable to environmental changes, representing a substantial risk for viticulture [13].
Water flows into the plant in a soil–plant–atmosphere continuum [14]. The whole water transport system in the plant is influenced by the anatomical structure of xylem vessels [15], hydraulic constraints [16] and chemical signals [17,18]. When soil water availability decreases, one of the earliest responses is stomatal closure, in order to maintain a favorable water balance, buffering the drop in xylem water potential and avoiding embolisms [19,20]. The closure of guard cells leads to a reduction of CO2 assimilation and H2O transpiration from leaves and, consequently, the photosynthetic activity decreases sharply [21].
One of the factors inducing stomatal closure is abscisic acid (ABA), a hormone produced by roots and leaves [22,23,24,25,26,27,28,29,30]. ABA accumulates in the plant when soil dries out and water potential drops [22], the synthesis of which is entrusted to a minor branch of the carotenoid pathway. The early steps of ABA biosynthesis are catalyzed by zeaxanthin epoxidase (ZEP) and 9-cis-epoxycarotenoid dioxygenase (NCED) enzymes [31]. VvZEP and VvNCED gene expression is strongly induced by water stress [32,33,34] and salt stress [35]. This hormone, through the xylem sap, reaches guard cells, enhancing the content of reactive oxygen species (ROS, especially H2O2). Stopping the influx and promoting the efflux of potassium ions (K+) results in a rise in calcium ions (Ca2+) in the cytosol and, consequently, cells lose their turgor. The ABA signaling pathway is mediated by three main components: (i) pyrabactin resistance1/pyr1-like/regulatory components of ABA receptors (PYR/PYL/RCAR family of ABA receptors); (ii) ABA-regulated protein phosphatase 2Cs (PP2CAs); (iii) ABA-regulated SNRK2 protein kinase (SnPK2) [36,37]. Without stimuli, the ABA receptor is an unliganded form and the protein kinase is bound to the protein phosphatase. Specific receptors (PYR/PYL/RCARs) bind to ABA when its concentration increases and the hormone–receptor complex becomes an active site for the protein PP2C. The activated receptor binds to PP2C and frees SnPK2, which in turn is phosphorylated by another protein kinase. Multiple step phosphorylation of SnRK2 activates ABRE-binding protein (ABRB)/ABRE-binding factor (ABF) which induces many ABA-responsive gene expression [38].
In grapevine, the expression of VvNCED1, VvNCED2 and VvZEP genes has been directly correlated with ABA accumulation in response to water stress [33,34,39] and their expression was suggested as marker of ABA biosynthesis [40]. The expression of genes involved in the ABA signaling pathway revealed that the genes coding for RCAR, SnRK and ABF are downregulated in drought conditions, while VvPP2C genes are generally upregulated [40,41].
In the context of global warming, the exploitation of grapevine genetic diversity and the better understanding of plant responses to environmental stresses represent the way in which new viticultural challenges may be faced [42,43,44]. Although a significant number of efforts in grapevine rootstock selection have been carried out to date, fewer than 10 rootstocks are widely used in viticulture, with a negative impact on the grapevine response to biotic and abiotic stresses [9,45]. Since 1985, the Department of Agricultural and Environmental Sciences (DiSAA) research group operating at the University of Milan has been working on the selection of new rootstocks able to cope with abiotic stresses [5]. Some genotypes (series “M”: M1, M2, M3 and M4) were selected and released in 2014 and registered in the National Register of Vine Varieties (RNVV). M1 and M3 exhibit tolerance to iron-limited conditions (M1 > M3) [8,46], M2 and M4 display moderate resistance to salinity (Porro et al., 2013; Meggio et al., 2014) and M4 shows high tolerance to drought (Porro et al., 2013; Meggio et al., 2014; Corso et al., 2015).
To assess the drought tolerance of M-rootstocks in comparison to other commercial genotypes largely used in viticulture, physiological (gas exchange and stem water potential) and transcriptomic performances (genes involved in ABA synthesis and ABA-mediated responses to drought) were evaluated under well-watered and water-stressed conditions.

2. Results

2.1. The Physiological Response of Grapevine Rootstocks to Drought

The physiological parameters of photosynthesis (Pn), stomatal conductance (Gs), transpiration (E) and stem water potential (ΨS) were evaluated in 12 own-rooted grapevine rootstocks under decreasing water availability (from 80 to 20% soil water content, SWC) (Table 1, Table S1).
The physiological activity reported in well-watered conditions (80% SWC) was maintained at 50% SWC and decreased at 20% SWC (Figure S1). The water condition showing the most significant differences (20% SWC) was used to investigate the behavior of each grapevine rootstock under water deficit conditions, in terms of photosynthetic activity and intrinsic water use efficiency (iWUE) (Figure 1). The V. berlandieri × V. rupestris hybrids (1103P, 110R and 140Ru rootstocks), 41B, M4 and M3 rootstocks carried out high photosynthetic activity under both water conditions, exceeding average levels. The V. riparia × V. berlandieri hybrids (161-49C, 420A, K5BB) showed Pn values lower than average values at both water availabilities. The M1 rootstock showed similar Pn values in both conditions, exceeding the average value at 20% SWC (Figure 1a). Differences between genotypes also occurred when iWUE, calculated as the ratio between Pn and stomatal conductance values, was taken into account: 110R, 140Ru and M1 rootstocks maintained high efficiency when SWC decreased; iWUE values of 161-49C were reduced at 20% SWC; the 41B, K5BB and SO4 rootstocks reported iWUE values under average levels at 80% SWC, maintaining the same efficiency at 20%; 1103P, M3 and M4 rootstocks increased their efficiency under the water-stressed condition (Figure 1b).
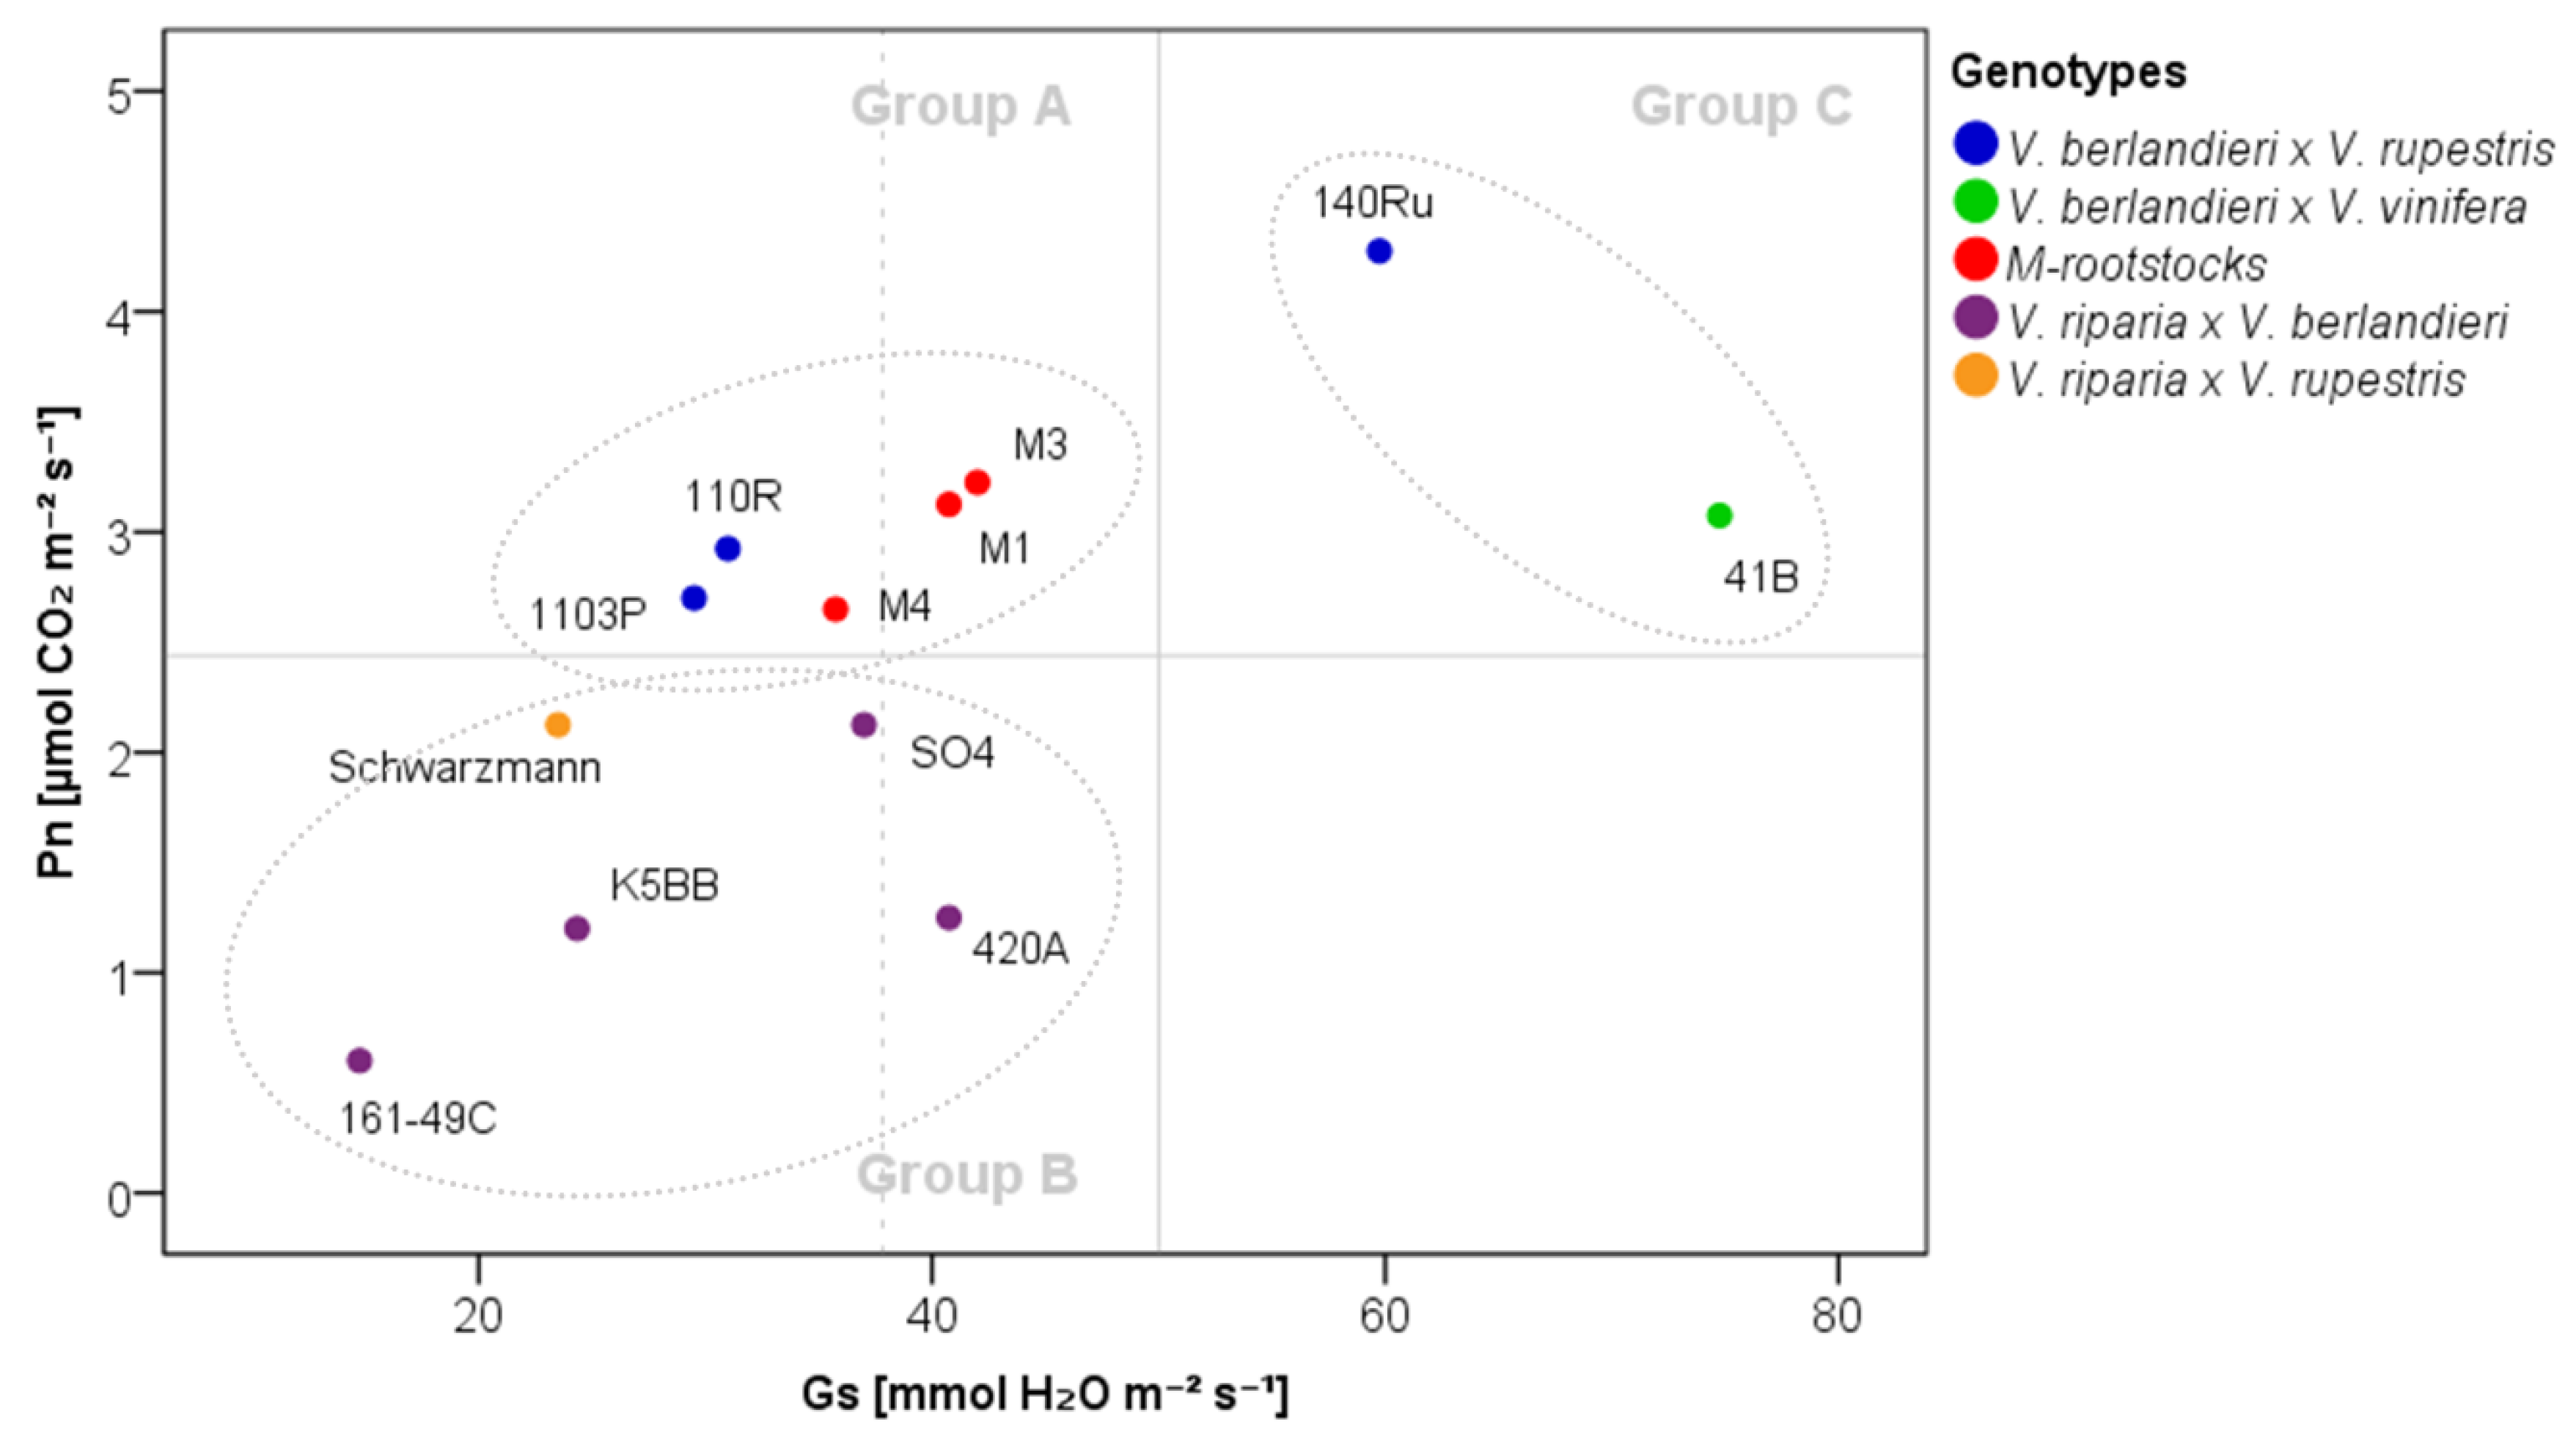
To investigate rootstock WUE in depth, Pn was analyzed as a function of Gs under the water-stressed condition (20% SWC). Clear differences emerged in the behavior of the 12 genotypes, resulting in three different groups (Figure 2): (i) Group A, genotypes reporting Gs values lower than the water-stressed threshold (50 mmol H2O m−2 s−1, based on Cifre et al. [47]) and Pn values higher than the general average value (2.5 µmol CO2 m−2 s−1) (1103P, 110R, M1, M3 and M4 rootstocks); (ii) Group B, genotypes reporting Gs values lower than the water-stressed threshold and Pn values lower than the general average value (161-49C, 420A, K5BB, Schwarzmann and SO4 rootstocks); (iii) Group C, genotypes reporting Gs values higher than the water-stressed threshold and Pn values higher than the general average value (140Ru and 41B rootstocks).
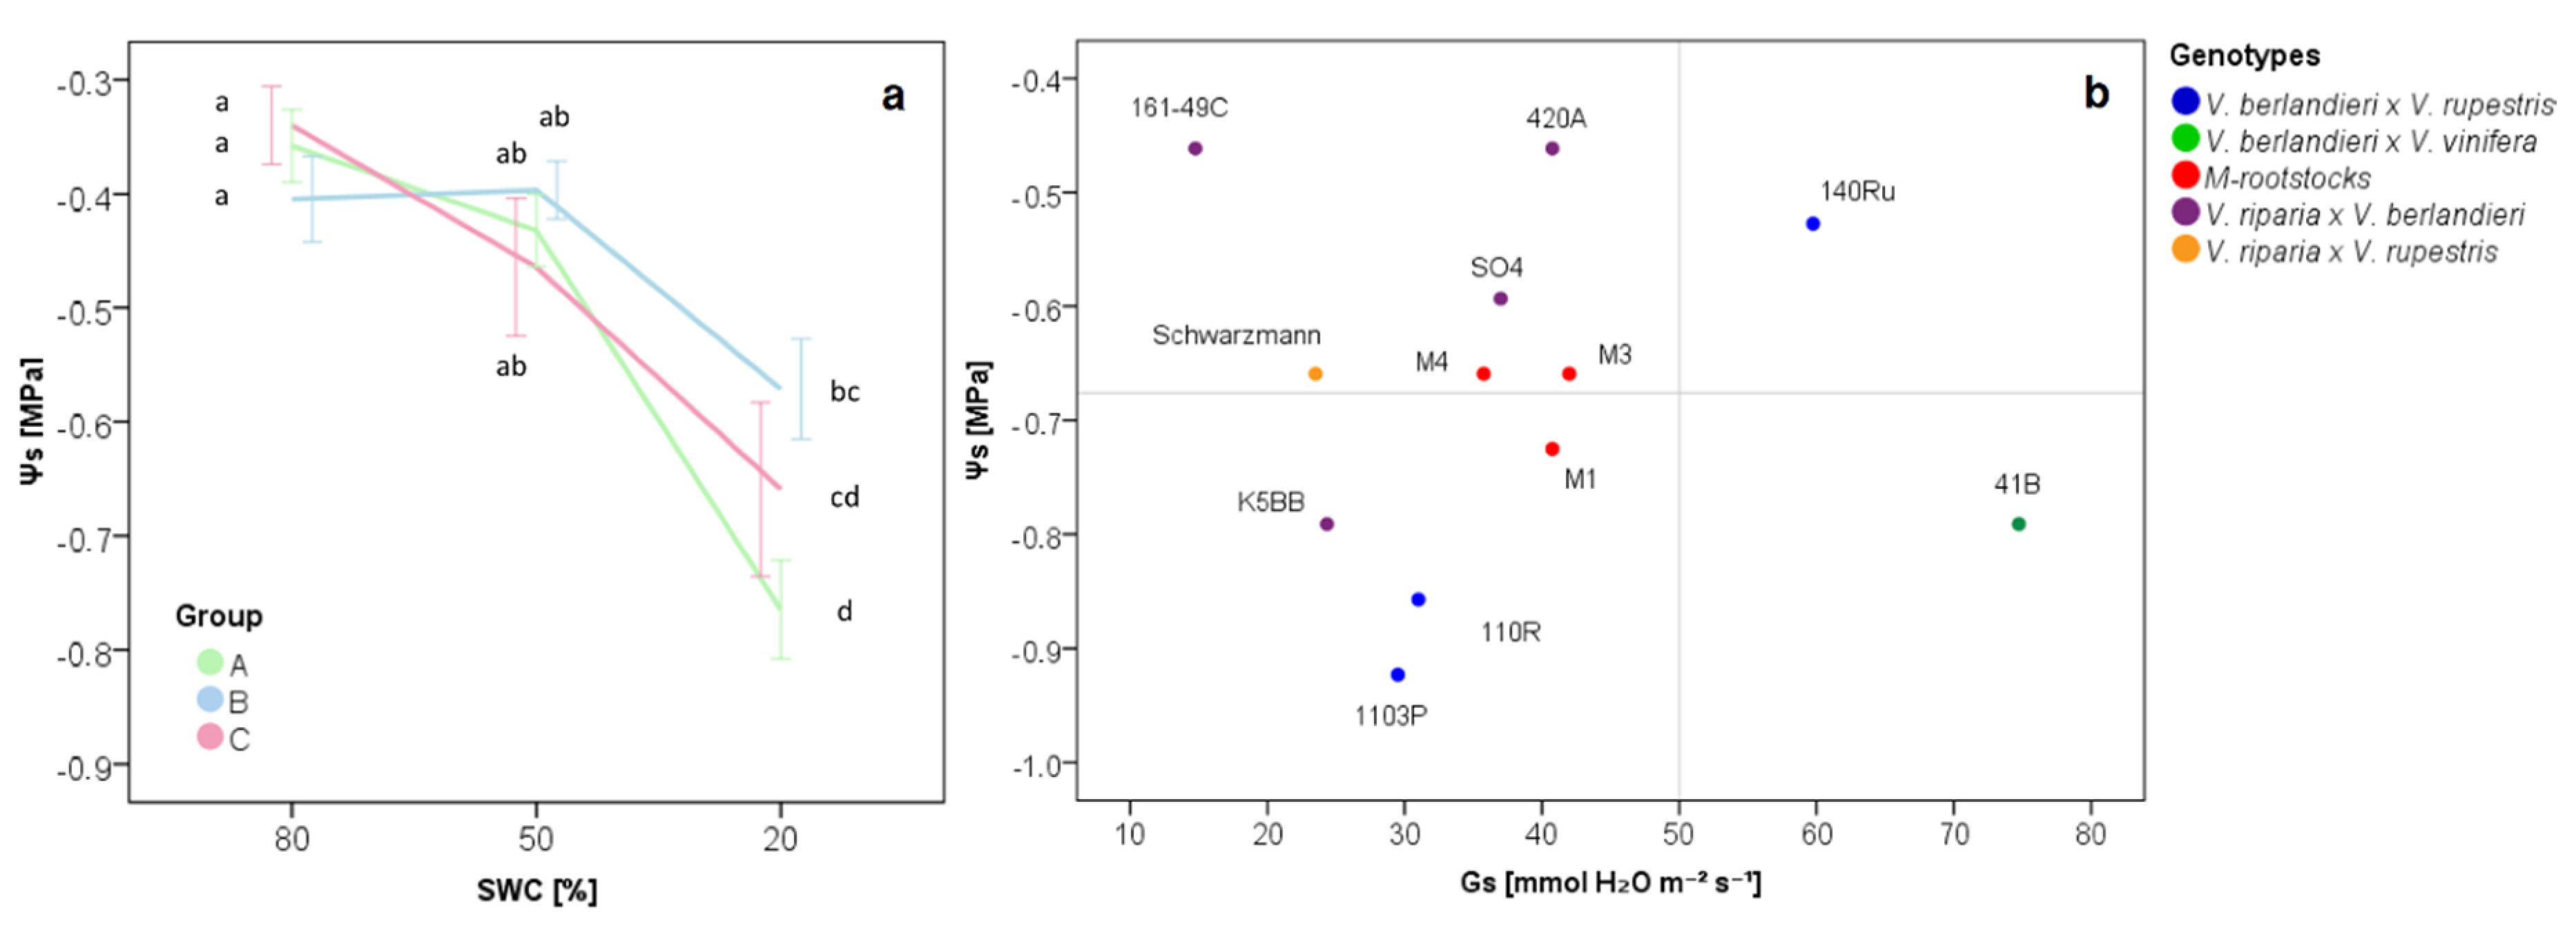
The three rootstock groups (A, B and C) were compared in term of ΨS with the decreasing levels of SWC (80%, 50% and 20%). Stem water potential settled at −0.4 MPa at 80% and 50% SWC without showing statistically significant differences among groups. At 20% SWC, Group A and C rootstocks decreased in ΨS value, whereas Group B rootstocks maintained higher ΨS values, without a significant reduction of ΨS values with respect to 50% SWC. At 20% SWC, Group A rootstocks reported ΨS values lower than Group B rootstocks (Figure 3a). Moreover, the ΨS was analyzed as a function of stomatal conductance and differences among groups were identified as well (Figure 3b): Group A rootstocks showed, mainly, Gs and ΨS levels below the stress threshold (50 mmol H2O m−2 s−1, based on Cifre et al. [47]) and average value, respectively; Group B rootstocks showed Gs values below the threshold and, mainly, ΨS values above the average value (except for K5BB rootstocks); Group C rootstocks showed Gs values exceeding the stress threshold, whereas the ΨS value was higher than the average for 140Ru rootstock and lower than the average for 41B rootstock.
At 20% SWC, groups were compared for all physiological parameters and the results are summarized in Table 2. Group B rootstocks significantly differed from Group A and C rootstocks for Pn and ΨS values, while Group C rootstocks significantly differed from Group A and B rootstocks for Gs and E values.

2.2. The Transcriptional Response of Grapevine Rootstocks to Drought

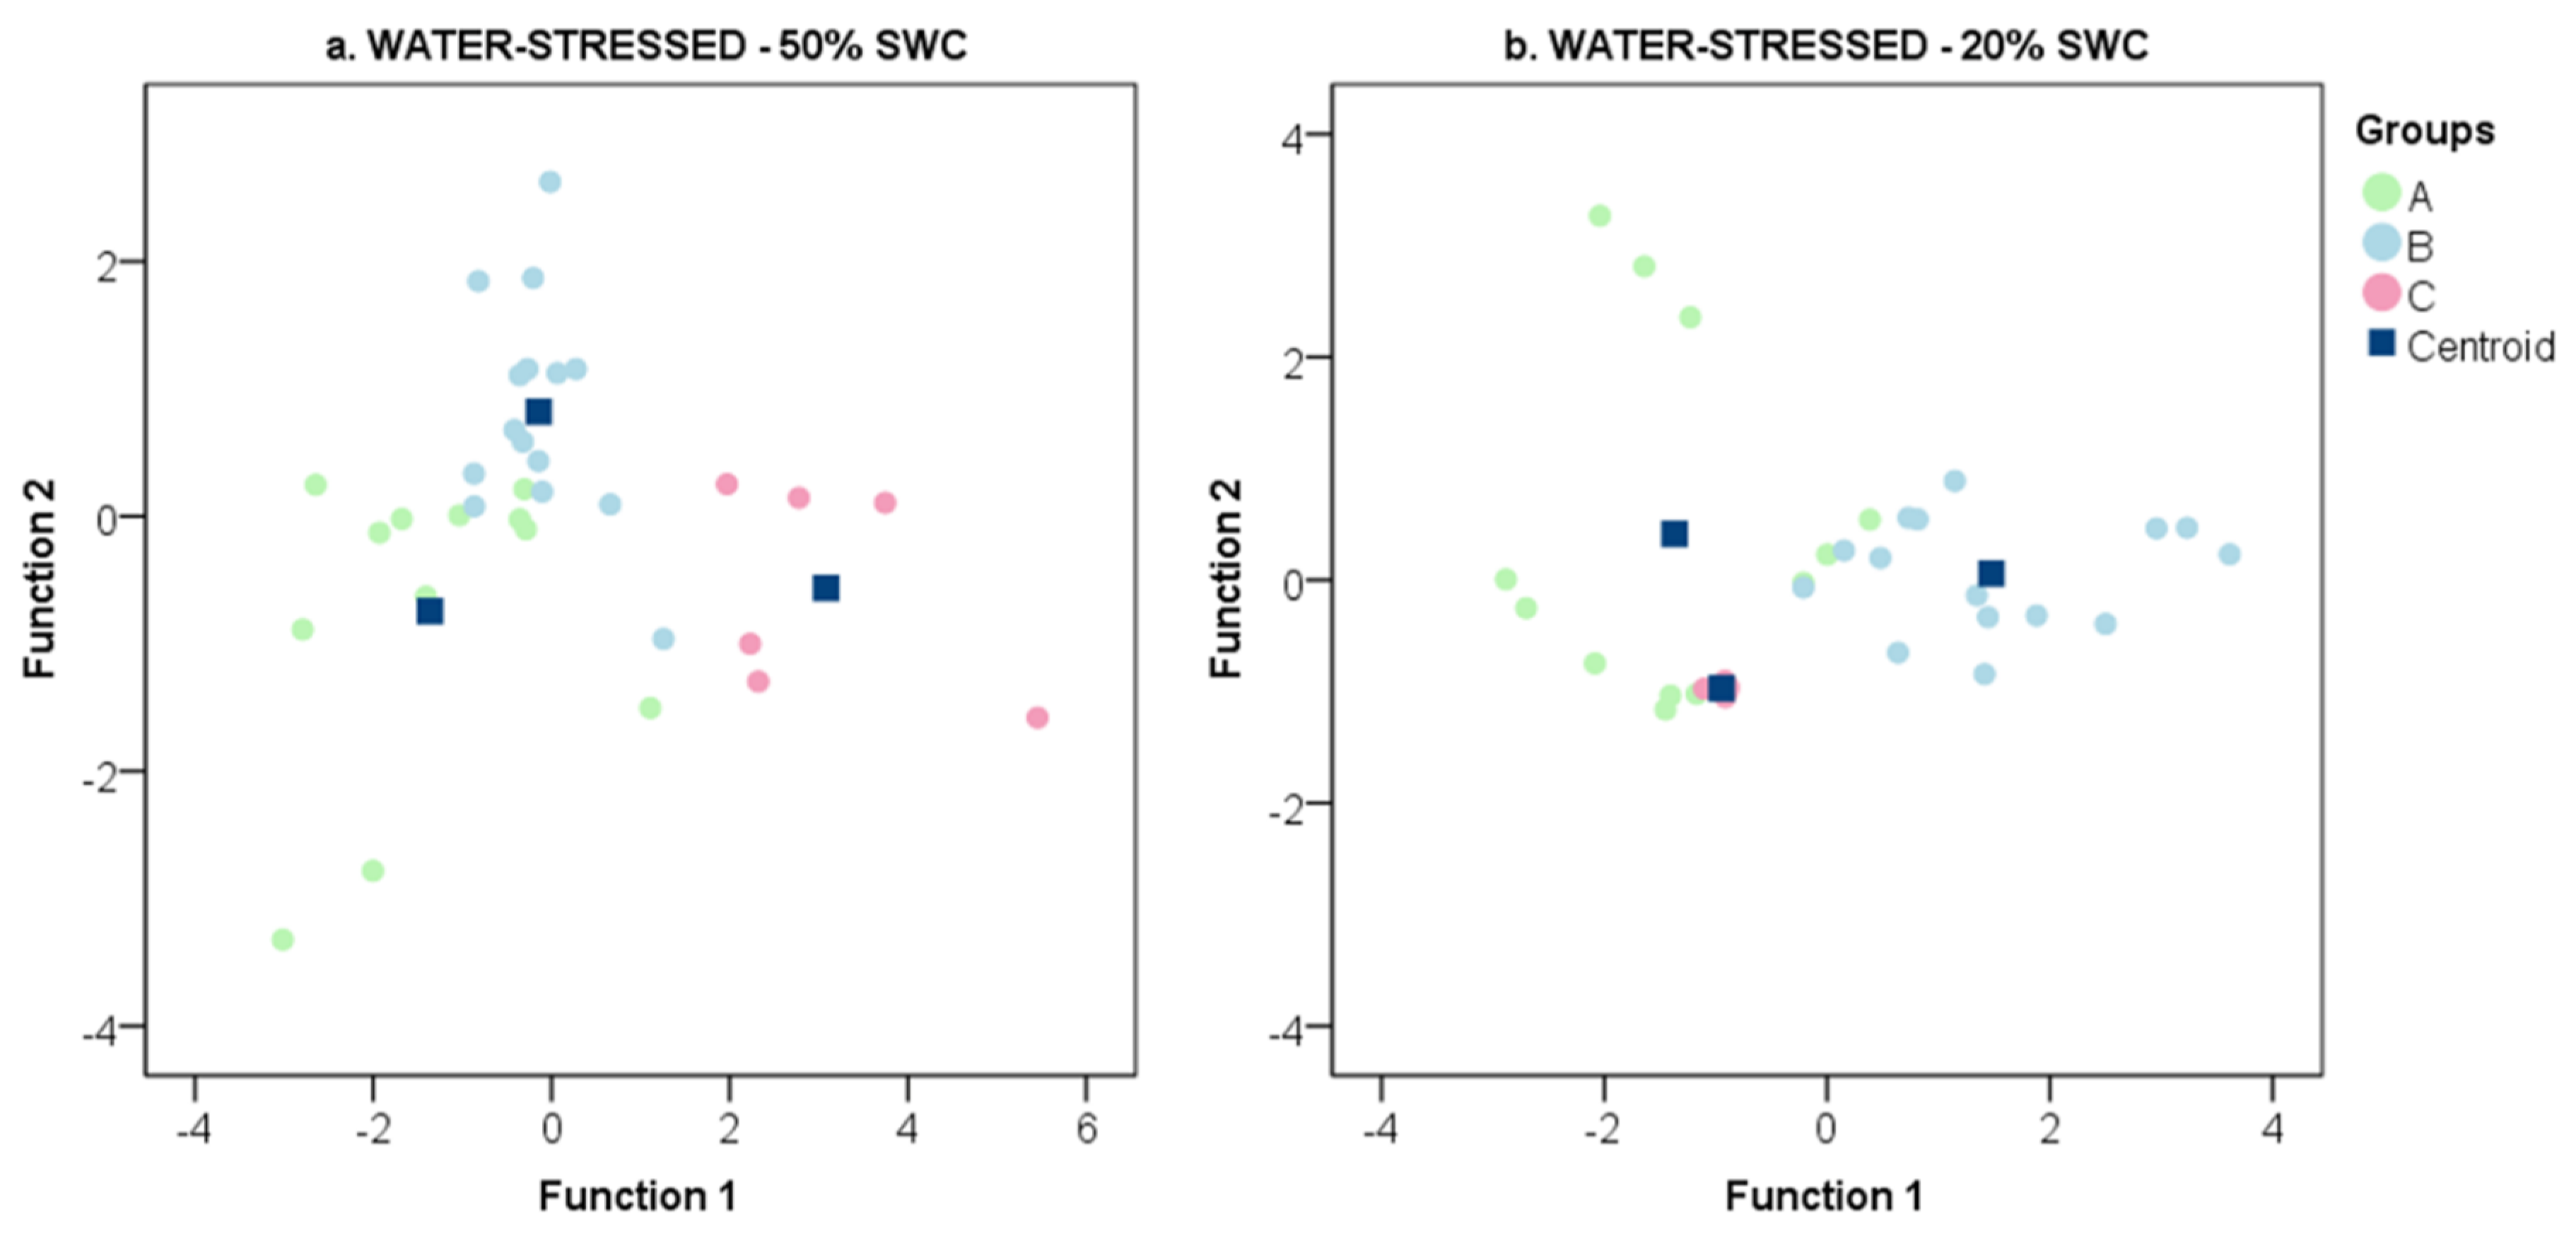
Based on the physiological behavior presented in Figure 2, the gene expression values (VvNCED1, VvNCED2, VvZEP in roots and VvPP2C4, VvSnRK2.6, VvABF2 in leaves) were compared among the three groups (A, B and C) by discriminant analysis (Figure 4). Average values and standard error of gene expression for six genes analyzed are reported in Table S2. At 50% SWC, the three groups showed a different transcriptional behavior: Group A and C rootstocks were discriminated along the first function (p = 0.000), while Group A and B rootstocks were discriminated along both the first (p = 0.034) and the second (p = 0.000) functions (Figure 4a). Functions 1 and 2 accounted for 81.0% and 19.0% of total variability, respectively. The most discriminating variables among the groups were the VvABF2 gene for function 1 and VvNCED1 and VvNCED2 genes for function 2. Function 1 was significantly correlated to VvABF2 (0.350) and VvNCED2 (−0.105) gene expression values and function 2 to VvZEP (−0.346), VvNCED1 (−0.644), VvSnRK2.6 (0.443) and VvPP2C4 (0.314) gene expression values. At 20% SWC, Group A and C rootstocks showed a similar behavior for the first function (0.881), different from the one shown by Group B rootstocks. Group B rootstocks were discriminated along the first function from Group A (p = 0.000) and C (p = 0.000) rootstocks (Figure 4b). The second function discriminated Groups A and C (0.021). Functions 1 and 2 accounted for 88.6% and 11.4% of total variability, respectively. The most discriminating variables among groups were VvNCED1 and VvNCED2 genes for function 1 and VvSnRK2.6 and VvZEP genes for function 2. Function 1 reported significant and positive correlations to VvPP2C4 (0.394) and VvABF (0.234) gene expression values, whereas function 2 reported significant and positive correlations to VvZEP (0.801), VvNCED1 (0.872), VvNCED2 (0.499) and VvSnRK2.6 (0.156) gene expression values.
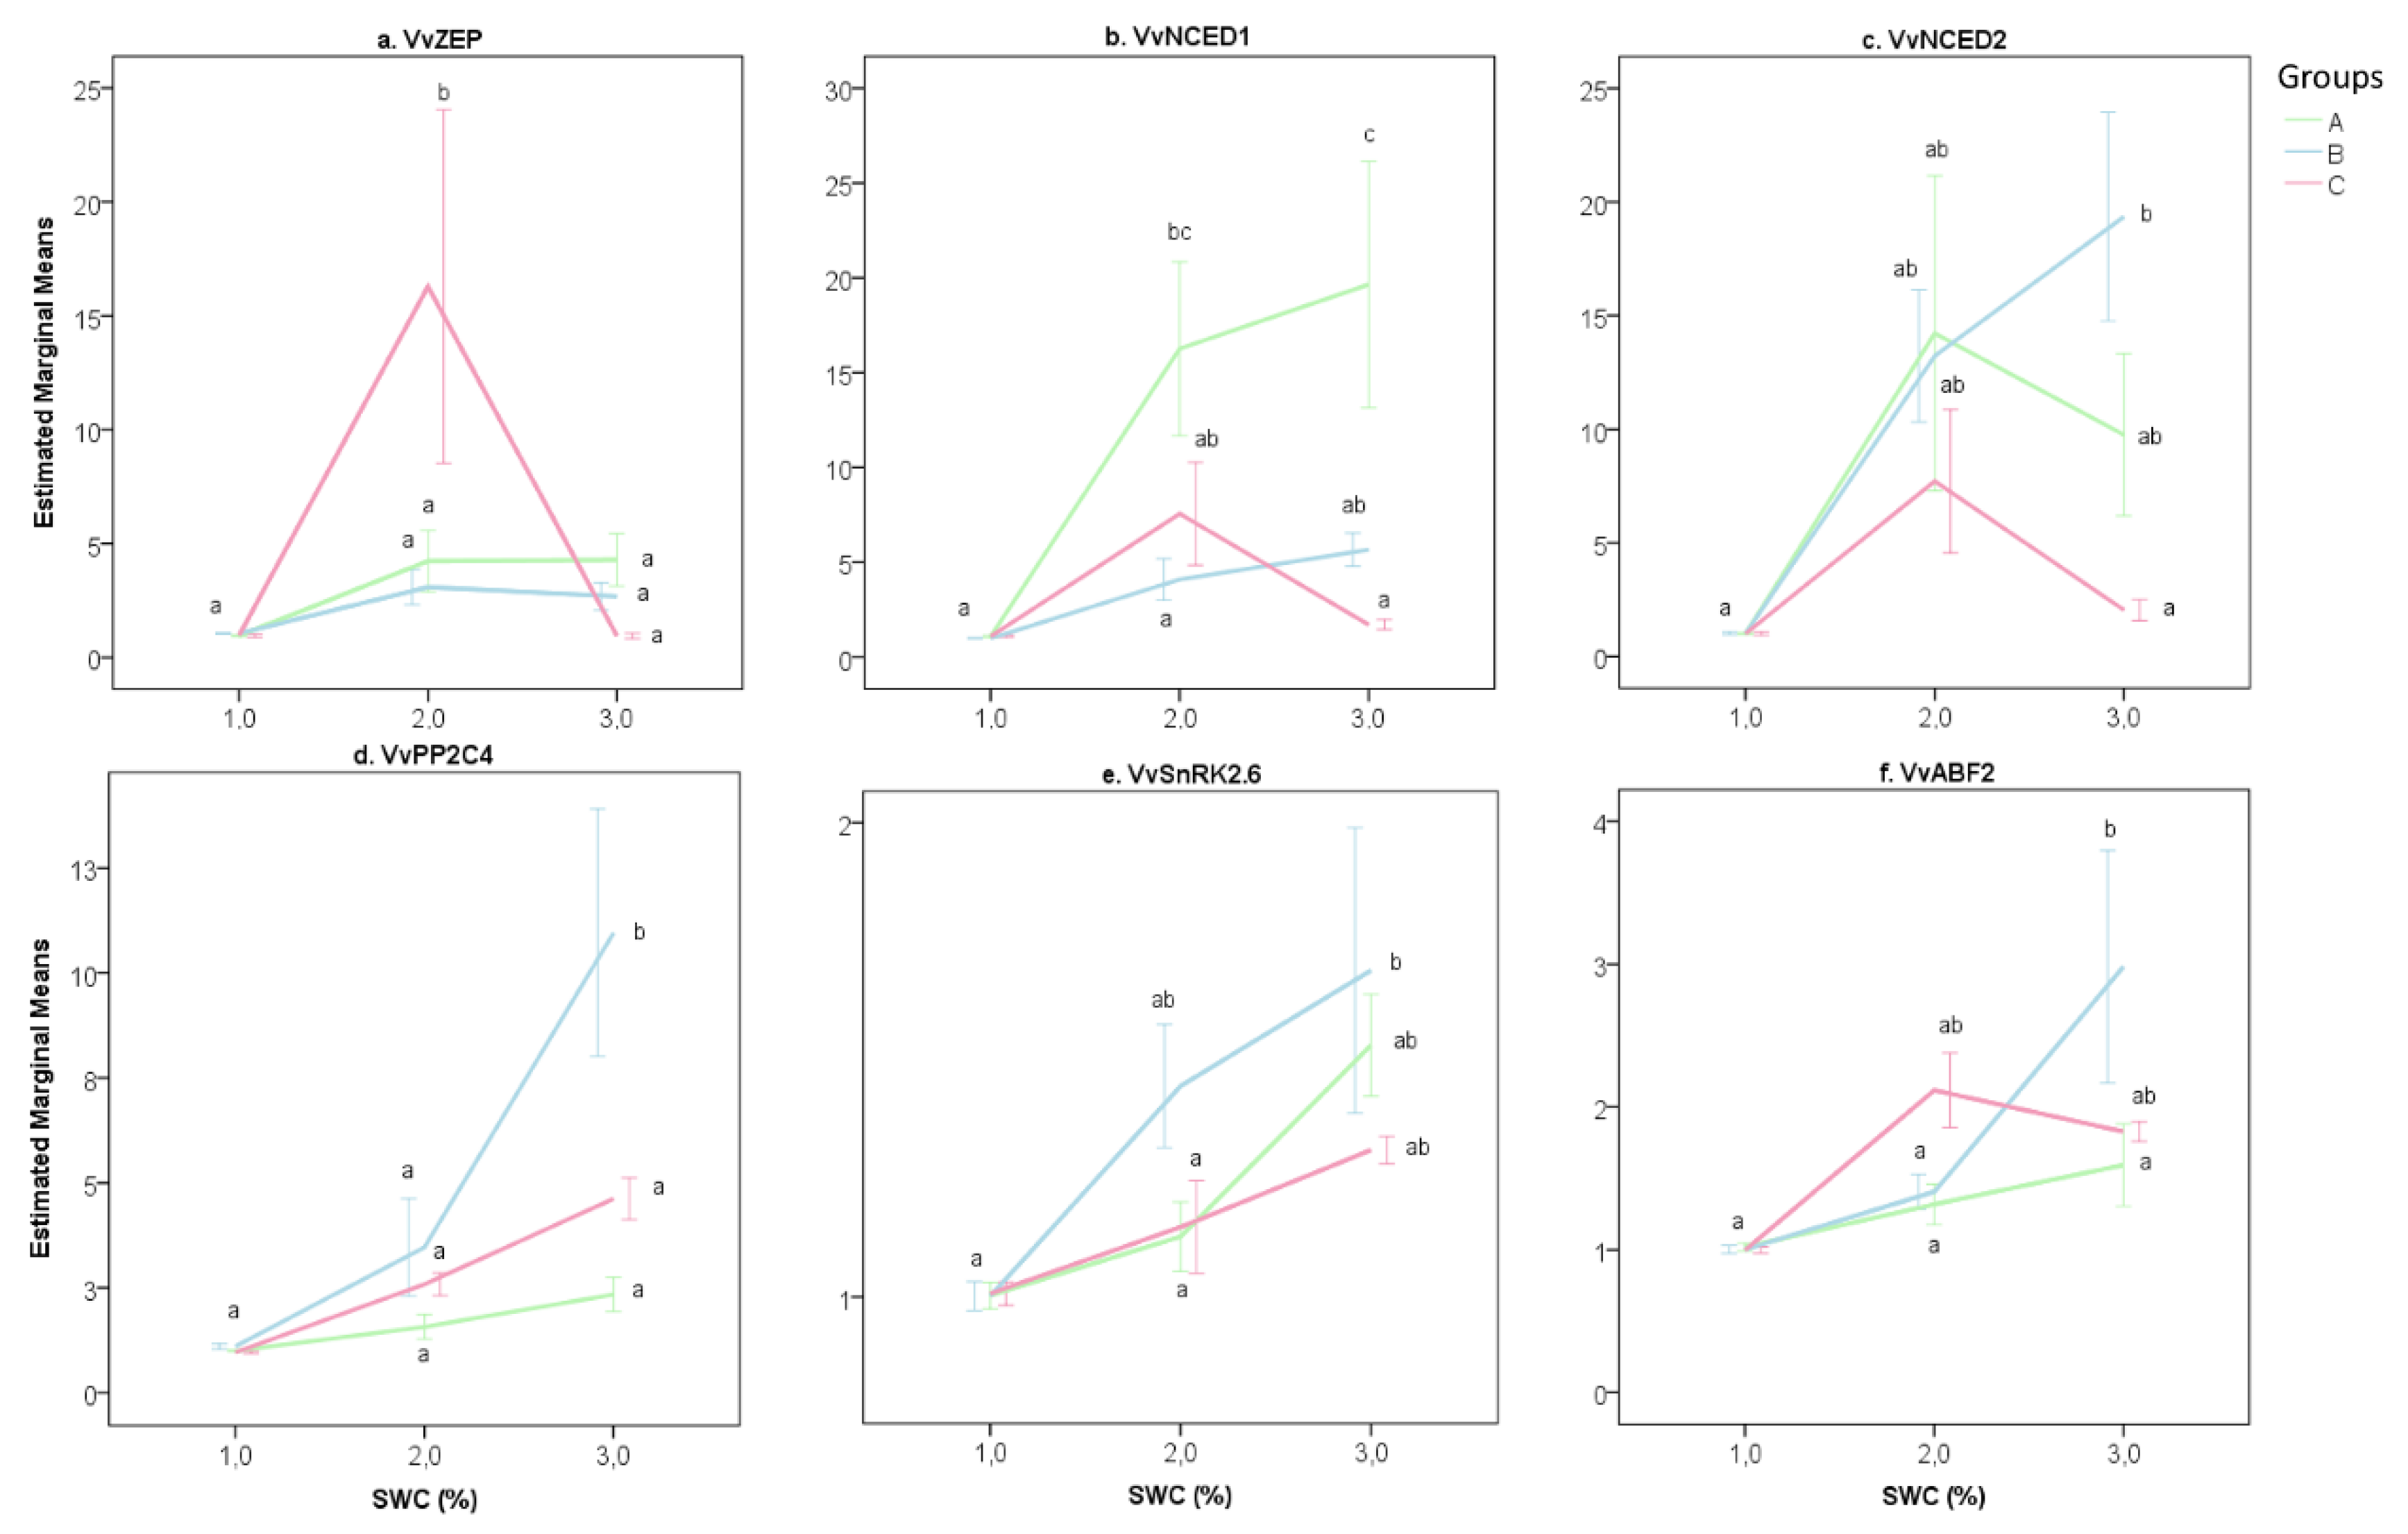
In Figure 5, the gene expression trend of each gene for each group is shown. The VvZEP gene showed a significant increment of transcripts only for Group C rootstocks (Figure 5a). For the VvNCED1 gene, the gene expression levels increased significantly at 50% SWC and reached the highest value at 20% SWC for Group A rootstocks (Figure 5b). For VvPP2C4, VvSnK2.6 and VvABF2 genes, Group B rootstocks showed a significant increment of transcripts at 20% SWC (Figure 5d–f).
In Figure 6, gas exchange (Pn, Gs, E) detected at 20% SWC showed a significant negative correlation to the expression of the gene VvNCED1 obtained at 20% and 50% SWC. Transpiration and stomatal conductance also showed a negative correlation to VvZEP at 50% SWC. Vpd at 20% SWC correlated to VvNCED1 and VvZEP expressed at 50% SWC and to VvNCED1 expressed at 20% SWC. Ψs detected at 20% SWC showed a positive correlation to VvZEP at 80% SWC, but a negative correlation to VvPP2C4 and VvSnRK2.6 at both 80% and 50% SWC.

3. Discussion

3.1. Water-Limiting Conditions for Grapevine Rootstocks

Grapevines can easily face conditions of mild water stress without their physiological activity being affected, allowing these plants to grow in many marginal areas, usually characterized by limited soil water availability. Roots are the major interface between plants and soil and the first organ to perceive water availability. They are involved in activating key steps for triggering a drought reaction to water stress: signal perception, signal transduction to shoots and leaves and water stress-inducible gene expression (Lovisolo et al., 2016). Therefore, rootstocks play an essential role in the water stress response in grapevines.
In this study, the short-term response to drought of three new-generation (M1, M3 and M4) and nine commercial rootstocks was evaluated. At the physiological level, soil water capacity at 50% was not a limiting condition for M-rootstocks and the nine commercial rootstocks analyzed, with no statistically significant changes occurring in terms of Pn, Gs, E or ΨS in comparison with the well-watered condition (80% SWC). Photosynthetic activity reached by all plants under well-watered conditions was lower than regular field activity due to the adaptation of leaves to moderate light [∼PPFD (Photosynthetically active Photon Flux Density) of 600 μmol of photons/(m2 × s)], with values between high and low light conditions obtained by Schubert et al. [48] under field conditions.

3.2. The Effect of Water Stress on Grapevine Rootstock Genotypes

Under water deficit conditions (20% SWC), the V. berlandieri × V. rupestris hybrids (140Ru, 1103P and 110R) and the M-rootstocks and 41B rootstocks maintained high photosynthetic activity in comparison with the V. riparia × V. berlandieri hybrids and Schwarzmann rootstocks (Figure 1a). Besides photosynthesis, M-rootstocks and V. berlandieri × V. rupestris hybrids were more efficient in the use of water under limited conditions, showing higher iWUE values than V. riparia × V. berlandieri hybrids and 41B rootstocks (Figure 1b). On reducing the water availability, M3 and M4 rootstocks and most of the commercial rootstocks closed stomata, showing significant differences in Gs values compared to the well-watered condition. M4 and other rootstocks (110R, 161-49C, and SO4) significantly reduced both Gs and Pn values in response to water-stressed conditions (Figure 1). These genotypes are considered “plastic”, due to their ability to modify their performances under different environmental conditions [5,49,50]. However, M1 and 140Ru showed an “elastic” behavior, as they maintained unchanged Pn and iWUE levels under both well-watered and water-stressed conditions.
The genetic background of M-rootstocks and nine commercial grapevine rootstocks became discernible in their performances under water-deficit conditions (Figure 1 and Figure 2). In agreement with the literature [23,51,52], the V. riparia × V. berlandieri hybrids (161-49C, 420A, K5BB and SO4 rootstocks) showed lower tolerance to water stress than V. berlandieri × V. rupestris hybrids (1103P, 110R and 140Ru rootstocks), with lower Pn values. In Padgett-Johnson et al. [53], V. rupestris showed higher drought tolerance than V. riparia and V. berlandieri. Schwarzmann (V. riparia × V. rupestris) showed a performance similar to V. riparia × V. berlandieri hybrids, whereas 41B rootstock (V. berlandieri × V. vinifera), typically classified as a tolerant genotype, showed a behavior similar to V. berlandieri × V. rupestris hybrids.
In our study, the performances of M-rootstocks (M1, M3 and M4), characterized by different genetic backgrounds, were similar to those shown by the V. berlandieri × V. rupestris hybrids 1103P and 110R. M4 (unknown × 1103 P) and 1103P rootstocks, both considered highly tolerant to water stress [23,54,55], showed similar performances (Figure 2).
A recent study compared M4 to 1103P in grafting combination with Grechetto Gentile. The two combinations maintained similar water potential under water stress, though M4 showed higher photosynthesis and water use efficiency [56]. Galbignani et al. [57] found higher Pn values and higher instantaneous WUE values in Sangiovese grafted on M4 than grafted on SO4 under moderately water-stressed conditions.
Vitis species possess the ability to show different strategic behaviors in response to drought [53]. In this study, three different strategies based on gas exchange and iWUE were identified in response to severe water-deficit conditions: (i) M-rootstocks (M1, M3 and M4) and 1103P and 110R rootstocks showed high Pn at limiting Gs values (Group A); (ii) Schwarzmann rootstock and V. riparia × V. berlandieri hybrids showed low Pn values at low Gs values (Group B); (iii) 140Ru and 41B rootstocks showed high Pn values without a reduction of Gs values (Group C) (Figure 2).
The three groups reported differences in stem water potential under low SWC (Figure 3a), as well as in the expression of genes related to ABA biosynthesis and signaling (Figure 4).

3.3. Delineation of Group Strategies to Face Drought

Based on physiological performance under water-limiting conditions, the rootstocks were classified into three groups (A, B and C) (Figure 2). The same three clusters were clearly discriminated according to the expression of six genes related to the ABA pathway in both mild (50% SWC) and limiting (20% SWC) water-stressed conditions (Figure 4). ABA mediates many physiological responses of plants to drought, including avoidance as well as tolerance responses. It is synthesized in both roots and leaves [24]. In both organs, its levels increase upon exposure to drought and they are accompanied by major changes in gene expression and physiological responses, such as stomatal closure [17]. Differences among groups in physiological activity were only detected under water-limiting conditions (20% SWC), nevertheless, the three groups were clearly discriminated at mildly water stress (50% SWC) according to their gene expression (Figure 4). At 20% SWC, the discriminant function 1 correlated with VvPP2C4 and VvABF2 gene expression in leaves, involved in the ABA signal transduction [40,58,59]. Discriminant function 2 was mainly correlated with VvZEP, VvNCED1 and VvNCED2 gene expression in roots, involved in ABA biosynthesis [34,59].
Vines can use several strategies for drought adaptation, including avoidance, tolerance and resistance [60,61]. The expression of genes related to the ABA biosynthetic pathway helped to investigate the strategies adopted by groups to deal with the water deficiency. Group A rootstocks (M1, M3, M4, 1103P and 110R) experienced stress at 20% SWC (Figure 2), increasing the transcription of genes related to ABA biosynthesis, especially VvNCED1 and VvNCED2 (Figure 5b–c). However, they showed a low expression of genes linked to ABA signal transduction, showing negative values of discriminant function 1 (Figure 4b). The evidence that genes related to ABA signal transduction (VvPP2C4, VvSnRK2.6, VvABF2) showed low levels of gene expression at low Gs levels allows us to suppose that the stomatal closure in response to ABA increase might be associated with a different mechanism. An alternative way to achieve a fast increase in ABA content is via hydrolysis of the ABA-glucosyl ester (ABA-GE), an inactive glucose-conjugated form of ABA [59]. Nevertheless, Group A rootstocks reduced the stomatal conductance, despite which they retained high Pn activity, proving high water use efficiency (Figure 1b, Figure 2). Photosynthetic activity and stomatal closure involved reductions of both sub-stomatal CO2 concentration (Ci) and vapor pressure deficit (Vpd). This performance could be ensured by an efficient ROS detoxification system, for which gene expression was noticed for the M4 rootstock under water-stressed conditions by Corso et al. [48]. (Figure 3) The rootstocks clustered in Group A, including the M-rootstocks (M1, M3 and M4), adopted a tolerant strategy [61], preserving their physiological activity under water stress.
Rootstocks belonging to Group B (161-49C, 420A, K5BB, Schwarzmann and SO4) also reduced the physiological activity at 20% SWC (Figure 1b). Among genes related to ABA biosynthesis, they mainly increased transcripts of VvAPF2, VvNCED2 and VvPP2C4 genes (Figure 5c–d). According to the literature, the enhanced activity of VvPP2C genes during drought stress suggests that its primary role is in regulating ABA response [40,41,58]. As reported by Boneh et al. [40] and Rattanakon et al. [59], transcripts of PP2C genes increase to slow down the activation of the ABA signaling pathway that occurs from a rapid rise in the hormone itself. For Group B rootstocks, stomatal conductance decreased, as well as photosynthetic activity, showing low efficiency in water use (Figure 1b, Figure 2). For this group, low stomatal conductance seemed to buffer the drop in ΨS values at decreasing SWC levels (Figure 3a–b). (Figure 6) The strategy adopted by Group B genotypes under water-stressed conditions can be defined as avoidance [61], preserving ΨS by reducing the physiological activity through stomatal closure. The high water potential indicates that this could be adopted in long-term drought conditions.
Unlike other rootstocks, Group C rootstocks (140Ru and 41B) maintained the stomatal conductance under 20% SWC, allowing leaves to continue high photosynthetic activity (Figure 2), regardless of ΨS (Figure 3b). The physiological activity performed at 20% SWC could be related to the adaptation of genotype architecture to drought conditions, such as the vessel size [5,62,63]. (Figure 6) However, the expression of genes linked to ABA biosynthesis, especially VvZEP, rose at 50% SWC before decreasing at lower water availability (Figure 5a). Group C rootstocks showed a resistant strategy to water stress under water-limited conditions.

4. Material and Methods

4.1. Plant Material and Growth Conditions

The experiment was conducted in June 2017, under environmentally controlled conditions in a greenhouse at DiSAA (University of Milan). The greenhouse was equipped with supplementary light and a cooling system, with a 16 hr light [∼PPFD of 600 μmol of photons/(m2 × s)] and 8 hr dark photoperiod and a range of temperatures from 23 to 28 °C. A total of twelve grapevine rootstocks were analyzed: 1103P, 110R, 114Ru, 161-49C, 41B, 420A, K5BB, Schwarzmann, SO4, used worldwide, and the newly released M1, M3, M4. Nine biological repetitions per genotype were monitored. Two-year-old cuttings were used. The vines were grown in 4 L plastic pots, trained on 1 m stakes and placed in a randomized complete block design. The growth substrate was composed of 70% sand and 30% peat, supplemented with a layer of expanded clay aggregate on the bottom of the pot to avoid water flooding. During the phenological phase of budding, the plants were maintained in well-watered conditions in order to develop a well-expanded canopy.

4.2. Irrigation Management and Treatments

Three treatments were performed: 80%, 50% and 20% soil water content (SWC). Per treatment, three plants were collected, which were considered as biological replications. The SWC was calculated using the gravimetric method, according to the formula suggested by Gardner et al. [64]:
S W C = ( fresh   weight     dry   weight ) dry   weight   100
where fresh weight refers to the soil weight at field capacity and dry weight to the soil dried in an oven at 105 °C for 48 h.
Each pot containing one plant was weighed daily for a period of 10 days. When SWC reached the values of 80%, 50% and 20%, plants were selected for measurement of physiological parameters and gene expression analysis.

4.3. Plant Phenotyping

At each time point (80%, 50% and 20% SWC), gas exchange parameters and stem water potential (ΨS) were evaluated in three different plants (replications) per rootstock. Both measurements were carried out between 11:00 a.m. and 2:00 p.m. solar time.
Two fully expanded leaves (8th and 9th leaf) per plant were selected to measure gas exchange indicators: photosynthetic activity (Pn; μmol CO2 m−2 s−1), stomatal conductance (Gs; mmol H2O m−2 s−1) and transpiration (E; mmol H2O m−2 s−1). Gas exchange was measured with a leaf portable photosynthesis system (CIRAS-2, PP Systems, Amesbury, MA, USA) equipped with PLC6 (U) cuvette 18 mm circular (2.5 cm2 head plate), under constant saturating PPFD of 1500 µmol photons m−2 s−1, CO2 concentration of 300 μmol mol−1, block temperature of 25 °C and relative humidity between 60% and 70% allowing ~1.5 kPa of Vpd inside the leaf chamber. Intrinsic water use efficiency (iWUE) was calculated as the Pn/Gs ratio and expressed as μmol CO2 mol−1 H2O.
As suggested by Scholander et al. [65], ΨS (MPa) was calculated using the Scholander pressure chamber (Soil Moisture Equipment Corporation, Santa Barbara, CA, USA). The same leaves used to evaluate gas exchange were placed in a plastic bag wrapped in aluminum foil for 1 hr. Subsequently, they were excised with a razor blade and put in the Scholander chamber for the analysis. The ΨS value was recorded within 30 s from the cutting of the leaf by slowly pressurizing the chamber until sap came out from the cut end of the petiole.

4.4. Gene Expression Analysis

After the in vivo measurements of physiological parameters at 80%, 50% and 20% SWC, the whole root system and fully expanded leaves (i.e., from the fifth to the eighth node of the primary shoot) of the same plants per rootstock were immediately sampled, frozen in liquid nitrogen and stored at −80 °C until RNA extraction. The total RNA was extracted from 100 mg of liquid nitrogen-ground tissue with a Spectrum™ Plant Total RNA (Sigma-Aldrich, Germany) commercial kit, according to the manufacturer’s instructions. To evaluate RNA quality, 260/230 and 260/280 ratios were checked via a NanoDrop Spectrophotometer (Thermo Scientific, MA, USA). For those samples showing a 260/230 absorbance ratio lower than 1.8, a lithium chloride treatment was carried out (as reported in De Lorenzis et al. [66]). RNA integrity was checked by electrophoresis on 1.5% agarose gel. RNA quantification was performed using a Qubit® RNA HS Assay Kit by Qubit® 3.0 Fluorometer (Life Technologies, Carlsbad, CA, USA).
Total RNA (200 ng) was used to synthetize cDNA using 200 U of SuperScript® III Reverse Transcriptase (Thermo Fisher) and 50 µM oligo(dT)20 primers in accordance with the manufacturer’s instructions. Six genes (Table 3) involved in the response to drought were evaluated via real-time RT-PCR. VvZEP, VvNCED1 and VVNCED2 genes were evaluated in roots and VvPP2C4, VVSnRK2.6 and VvABF2 genes were evaluated in leaves, based on previous evidence reporting that genes related to ABA biosynthesis are mainly associated with ABA increases in water-stressed roots [33,34], while genes related to the ABA signal transduction better discriminate the genotypes at leaf level [34]. Ubiquitin (UBI; [67]) and actin (ACT; [68]) were used as reference genes. RT-PCR was carried out in a 7300 Real-Time PCR System (Applied Biosystems, Foster City, CA, USA). For each reaction (20 µL), 200 nM of each primer, 2 µL of cDNA (1:100 dilution of the synthesis reaction), 1X SYBR Green Real-Time PCR Master Mix (Thermo Fisher) and water up to 20 µL were added. Thermal cycling involved pre-incubation at 95 °C for 3 min, followed by 40 cycles of 94 °C for 15 s, 58 °C for 20 s and 72 °C for 30 s. For detecting non-specific amplifications in cDNA samples, a melting cycle with temperatures ranging from 65 to 95 °C was performed. Each real-time RT-PCR reaction was completed in triplicate. After testing the suitability of ubiquitin and actin as reference genes, ubiquitin was selected to normalize the cycle threshold (Ct) values of all analyzed samples, due to a PCR efficiency value more similar to the ones observed for target genes (ranging from 93 to 97%). The expression of each gene in different genotypes and water conditions was calculated by comparing their 2−ΔΔCt values [69].

4.5. Statistical Analysis

Data were analyzed using Microsoft Office Excel and SPSS statistical software (IBM SPSS Statistics 24). A univariate ANOVA model was performed on phenotypical parameters (Pn, Gs, E and ΨS) at p ≤ 0.05 after checking for the assumption of normality and homogeneity of variance. Post hoc comparisons were performed on phenotypical parameters (Pn, Gs, E and ΨS) with Tukey’s post hoc test at p ≤ 0.05. Gene expression data were used to perform a discriminant analysis, using the values as independent variables and with equal prior probabilities. Groups were identified by a bi-plot of Pn and Gs using the available water-stressed threshold for Gs (50 mmol H2O m−2 s−1, based on Cifre et al. [49]) and the mean value for Pn. Differences among groups in terms of discriminant function scores and gene expression were detected by a univariate ANOVA model and Tukey’s post-hoc test at p ≤ 0.05. Correlation among phenotypical parameters and gene expression was determined by Pearson’s index at p = 0.05 (*) and p = 0.01 (**) and viewed as a heatmap.

5. Conclusions

In this study, the new M-rootstocks showed a reaction to water-stressed conditions similar to that of the 1103P and 110R rootstocks, two commercial genotypes typically classified as being highly tolerant. They adopted a tolerant strategy, increasing the transcripts of genes related to ABA biosynthesis, especially VvNCED1 and VvNCED2, maintaining high water use efficiency under water-stressed conditions and preserving physiological activity even with low levels of stomatal conductance. Further studies will be necessary to confirm the performance of M-rootstocks under water stress in field conditions, evaluating rootstock/scion interactions. Nevertheless, a few new grapevine rootstock genotypes are not enough to face the challenges that modern viticulture will have to cope with in the future, therefore, new breeding programs have to be planned.

Supplementary Materials

The following are available online at https://www.mdpi.com/2223-7747/9/10/1385/s1, Figure S1. Effect of water availability decreasing (50 and 20% SWC; soil water content) in 12 own-rooted grapevine rootstocks on (a) net photosynthesis (Pn), (b) stomatal conductance (Gs), (c) transpiration (E) and (d) stem water potential (ΨS) in respect to the well-watered condition (80% SWC). ΨS values were normalized on well-watered condition values. Statistical differences among different water conditions for each parameter are defined according to Tukey post-hoc test at p-value 0.05. Well-watered plants were maintained at 80% SWC and compared to water-stressed plants at 50 and 20% SWC. At 50% SWC, Pn activity amounted to 3.90 μmol CO2 m-2 s-1, Gs to 124 mmol H2O m-2 s-1, E to 1.61 mmol H2O m-2 s-1 and ΨS to -0.42 MPa (about 113% in comparison to well-watered condition) (Figure 1). Average values of all physiological parameters were not significantly different in comparison with those of the well-watered condition. At 20% SWC, water availability significantly affected all the investigated physiological parameters (Figure 1). Plants reduced all the physiological parameters, showing significant differences in comparison to the well-watered plants: Pn was 2.47 μmol CO2 m-2 s-1 (about 37% less than 80% SWC); Gs was 38 mmol H2O m-2 s-1 (about 69% less than well-watered condition); E was 0.83 mmol H2O m-2 s-1 (about 48% less in comparison to well-watered condition); ΨS dropped to -0.67 MPa, Table S1: Average values and standard error of physiological parameters measured for 12 own-rooted grapevine rootstocks under both well-watered (80% soil water content, SWC) and water-stressed (20% SWC) conditions, Table S2: Average values and standard error of gene expression for six genes detected for 12 own-rooted grapevine rootstocks under both well-watered (80% soil water content, SWC) and water-stressed (20% SWC) conditions, Table S3: Standardized canonical discriminant function coefficients for function 1 and function 2 at 50 and 20% soil water content (SWC) for gene expression values of six genes detected in 12 own-rooted grapevine rootstocks.

Author Contributions

Conceptualization, L.B. and G.D.L.; methodology, D.B., L.C. and D.G.; data curation, D.B. and G.D.L.; writing—original draft preparation, D.B. and G.D.L.; writing—review and editing, L.B. and G.D.L. All authors have read and agreed to the published version of the manuscript.

Funding

This research received no external funding.

Acknowledgments

The authors thanks Vivai Cooperativi Rauscedo (Rauscedo, Italy) and WineGraft srl (Lodi, Italy) for providing plants.

Conflicts of Interest

The authors declare no conflict of interest.

References

  1. Chaves, M.M.; Maroco, J.P.; Pereira, J.S. Understanding plant responses to drought—From genes to the whole plant. Funct. Plant Biol. 2003, 30, 239. [Google Scholar] [CrossRef] [PubMed]
  2. Pellegrino, A.; Lebon, E.; Simonneau, T.; Wery, J. Towards a simple indicator of water stress in grapevine (Vitis vinifera L.) based on the differential sensitivities. Aust. J. Grape Wine Res. 2005, 11, 306–315. [Google Scholar] [CrossRef]
  3. Jackson, D.I.; Lombard, P.B. Environmental and Management Practices Affecting Grape Composition and Wine Quality—A Review. Am. J. Enol. Vitic. 1993, 44, 409–430. [Google Scholar]
  4. Gale, G. Saving the vine from Phylloxera: A never-ending battle. In Wine: A Scientifc Exploration; Sandler, M., Pindler, R., Eds.; Taylor and Francis: London, UK, 2002; pp. 70–91. ISBN 9780203361382. [Google Scholar]
  5. Bianchi, D.; Grossi, D.; Tincani, D.T.G.; Simone Di Lorenzo, G.; Brancadoro, L.; Rustioni, L. Multi-parameter characterization of water stress tolerance in Vitis hybrids for new rootstock selection. Plant Physiol. Biochem. 2018, 132, 333–340. [Google Scholar] [CrossRef]
  6. Bianchi, D.; Grossi, D.; Simone Di Lorenzo, G.; Zi Ying, Y.; Rustioni, L.; Brancadoro, L. Phenotyping of the “G series” Vitis hybrids: First screening of the mineral composition. Sci. Hortic. 2020, 264. [Google Scholar] [CrossRef]
  7. Cochetel, N.; Escudié, F.; Cookson, S.J.; Dai, Z.; Vivin, P.; Bert, P.; Muñoz, M.S.; Delrot, S.; Klopp, C.; Ollat, N.; et al. Root transcriptomic responses of grafted grapevines to heterogeneous nitrogen availability depend on rootstock genotype. J. Exp. Bot. 2017, 68, 4339–4355. [Google Scholar] [CrossRef] [Green Version]
  8. Vannozzi, A.; Donnini, S.; Vigani, G.; Corso, M.; Valle, G.; Vitulo, N.; Bonghi, C.; Zocchi, G.; Lucchin, M. Transcriptional Characterization of a Widely-Used Grapevine Rootstock Genotype under Different Iron-Limited Conditions. Front. Plant Sci. 2017, 7, 1–17. [Google Scholar] [CrossRef] [PubMed] [Green Version]
  9. Ollat, N.; Peccoux, A.; Papura, D.; Esmenjaud, D.; Marguerit, E.; Tandonnet, J.P.; Bordenave, L.; Cookson, S.J.; Barrieu, F.; Rossdeutsch, L.; et al. Rootstocks as a Component of Adaptation to Environment; Wiley: Hoboken, NJ, USA, 2016; ISBN 9781118735985. [Google Scholar]
  10. IPCC. Global warming of 1.5 °C. In Summary for Policymarkerskers; World Meteorological Organization: Geneva, Switzerland, 2018; pp. 1–26. ISBN 9789291691517. [Google Scholar]
  11. Giorgi, F.; Lionello, P. Climate change projections for the Mediterranean region. Glob. Planet. Chang. 2008, 63, 90–104. [Google Scholar] [CrossRef]
  12. IPCC. Climate Change 2013: The Physical Science Basis—Summary for Policymakers; Cambridge University Press: Cambridge, UK, 2013. [Google Scholar]
  13. Schultz, H.R. Climate change and viticulture: A European perspective on climatology, carbon dioxide and UV-B effects. Aust. J. Grape Wine Res. 2000, 6, 2–12. [Google Scholar] [CrossRef]
  14. Taiz, L.; Zeiger, E. Plant physiology. 3rd edn. Ann. Bot. 2003, 91, 750–751. [Google Scholar] [CrossRef] [Green Version]
  15. Shao, H.B.; Chu, L.Y.; Shao, M.A.; Abdul Jaleel, C.; Hong-Mei, M. Higher plant antioxidants and redox signaling under environmental stresses. Comp. Rend. Biol. 2008, 331, 433–441. [Google Scholar] [CrossRef]
  16. Steudle, E. Water uptake by roots: Effects of water deficit. J. Exp. Bot. 2000, 51, 1531–1542. [Google Scholar] [CrossRef] [PubMed] [Green Version]
  17. Tombesi, S.; Nardini, A.; Frioni, T.; Soccolini, M.; Zadra, C.; Farinelli, D.; Poni, S.; Palliotti, A. Stomatal closure is induced by hydraulic signals and maintained by ABA in drought-stressed grapevine. Sci. Rep. 2015, 5, 1–12. [Google Scholar] [CrossRef]
  18. Schachtman, D.P.; Goodger, J.Q.D. Chemical root to shoot signaling under drought. Trends Plant Sci. 2008, 13, 281–287. [Google Scholar] [CrossRef] [PubMed]
  19. Jones, H.; Sutherland, R. Stomatal control of xylem embolism. Plant Cell Environ. 1991, 14, 607–612. [Google Scholar] [CrossRef]
  20. Hochberg, U.; Herrera, J.C.; Cochard, H.; Badel, E. Short-time xylem relaxation results in reliable quantification of embolism in grapevine petioles and sheds new light on their hydraulic strategy. Tree Physiol. 2016, 36, 748–755. [Google Scholar] [CrossRef] [PubMed] [Green Version]
  21. Medrano, H.; Tomás, M.; Martorell, S.; Flexas, J.; Hernández, E.; Rosselló, J.; Pou, A.; Escalona, J.M.; Bota, J. From leaf to whole-plant water use efficiency (WUE) in complex canopies: Limitations of leaf WUE as a selection target. Crop J. 2015, 3, 220–228. [Google Scholar] [CrossRef] [Green Version]
  22. Farquhar, G.D.; Sharkey, T.D. Stomatal conductance and photosynthesis. Ann. Rev. Plant Biol. 1982, 61, 561–591. [Google Scholar] [CrossRef]
  23. Lovisolo, C.; Lavoie-lamoureux, A.; Tramontini, S.; Ferrandino, A. Grapevine adaptations to water stress: New perspectives about soil/plant interactions. Theor. Exp. Plant Physiol. 2016, 28, 53–66. [Google Scholar] [CrossRef]
  24. De Smet, I.; Zhang, H. Abscisic acid in root growth and development. In Plant Roots: The Hidden Half; Eshel, A., Beeckman, T., Eds.; CRC Press: Baton Rouge, FL, USA, 2013; pp. 16.1–16.13. [Google Scholar]
  25. Audran, C.; Borel, C.; Frey, A.; Sotta, B.; Meyer, C.; Simonneau, T.; Marion-Poll, A. Expression studies of the zeaxanthin epoxidase gene in Nicotiana plumbaginifolia. Plant Physiol. 1998, 118, 1021–1028. [Google Scholar] [CrossRef] [Green Version]
  26. Ikegami, K.; Okamoto, M.; Seo, M.; Koshiba, T. Activation of abscisic acid biosynthesis in the leaves of Arabidopsis thaliana in response to water deficit. J. Plant Res. 2009, 122, 235–243. [Google Scholar] [CrossRef] [PubMed]
  27. Manzi, M.; Lado, J.; Rodrigo, M.J.; Zacariás, L.; Arbona, V.; Gómez-Cadenas, A. Root ABA Accumulation in Long-Term Water-Stressed Plants is Sustained by Hormone Transport from Aerial Organs. Plant Cell Physiol. 2015, 56, 2457–2466. [Google Scholar] [CrossRef] [PubMed]
  28. Manzi, M.; Lado, J.; Rodrigo, M.J.; Arbona, V.; Gómez-Cadenas, A. ABA accumulation in water-stressed Citrus roots does not rely on carotenoid content in this organ. Plant Sci. 2016, 252, 151–161. [Google Scholar] [CrossRef] [PubMed]
  29. McAdam, S.A.M.; Brodribb, T.J.; Ross, J.J. Shoot-derived abscisic acid promotes root growth. Plant Cell Environ. 2016, 39, 652–659. [Google Scholar] [CrossRef] [PubMed]
  30. Ren, H.; Gao, Z.; Chen, L.; Wei, K.; Liu, J.; Fan, Y.; Davies, W.J.; Jia, W.; Zhang, J. Dynamic analysis of ABA accumulation in relation to the rate of ABA catabolism in maize tissues under water deficit. J. Exp. Bot. 2007, 58, 211–219. [Google Scholar] [CrossRef] [PubMed]
  31. Rock, C.D.; Heath, T.G.; Gage, D.A.; Zeevaart, J.A. Abscisic alcohol is an intermediate in abscisic Acid biosynthesis in a shunt pathway from abscisic aldehyde. Plant Physiol. 1991, 97, 670–676. [Google Scholar] [CrossRef] [PubMed] [Green Version]
  32. Qin, X.; Zeevaart, J.A. The 9-cis-epoxycarotenoid cleavage reaction is the key regulatory step of abscisic acid biosynthesis in water-stressed bean. Proc. Natl. Acad. Sci. USA 1999, 96, 15354–15361. [Google Scholar] [CrossRef] [Green Version]
  33. Speirs, J.; Binney, A.; Collins, M.; Edwards, E.; Loveys, B. Expression of ABA synthesis and metabolism genes under different irrigation strategies and atmospheric VPDs is associated with stomatal conductance in grapevine (Vitis vinifera L. cv Cabernet Sauvignon). J. Exp. Bot. 2013, 64, 1907–1916. [Google Scholar] [CrossRef] [Green Version]
  34. Rossdeutsch, L.; Edwards, E.; Cookson, S.J.; Barrieu, F.; Gambetta, G.A.; Delrot, S.; Ollat, N. ABA-mediated responses to water deficit separate grapevine genotypes by their genetic background. BMC Plant Biol. 2016, 16, 91. [Google Scholar] [CrossRef] [Green Version]
  35. Iuchi, S.; Kobayashi, M.; Taji, T.; Naramoto, M.; Seki, M.; Kato, T. Regulation of drought tolerance by gene manipulation of 9- cis -epoxycarotenoid dioxygenase, a key enzyme in abscisic acid biosynthesis in Arabidopsis. Plant J. 2001, 27, 325–333. [Google Scholar] [CrossRef] [Green Version]
  36. Santiago, J.; Rodrigues, A.; Saez, A.; Rubio, S.; Antoni, R.; Dupeux, F.; Park, S.; Marquez, J.; Cutler, S.; Rodriguez, P. Modulation of drought resistance by the abscisic acid receptor PYL5 through inhibition of clade A PP2Cs. Plant J. 2009, 60, 575–588. [Google Scholar] [CrossRef] [PubMed]
  37. Yoshida, R.; Hobo, T.; Ichimura, K.; Mizoguchi, T.; Takahashi, F.; Aronso, J.; Ecker, J.R.; Shinozaki, K. ABA-Activated SnRK2 Protein Kinase is Required for Dehydration Stress Signaling in Arabidopsis. Plant Cell Physiol. 2002, 43, 1473–1483. [Google Scholar] [CrossRef]
  38. Raghavendra, A.S.; Gonugunta, V.K.; Christmann, A.; Grill, E. ABA perception and signalling. Trends Plant Sci. 2010, 15, 395–401. [Google Scholar] [CrossRef]
  39. Soar, C.J.; Speirs, J.; Maffei, S.M.; Penrose, A.B.; Mc Carthy, M.G. Grape vine varieties Shiraz and Grenache differ in their stomatal response to VPD: Apparent links with ABA physiology and gene expression in leaf tissue. Aust. J. Grape Wine Res. 2006, 12, 2–12. [Google Scholar] [CrossRef]
  40. Boneh, U.; Biton, I.; Zheng, C.; Schwartz, A.; Ben-Ari, G. Characterization of potential ABA receptors in Vitis vinifera. Plant Cell Rep. 2012, 31, 311–321. [Google Scholar] [CrossRef]
  41. Haider, M.S.; Zhang, C.; Kurjogi, M.M.; Pervaiz, T.; Zheng, T.; Zhang, C.; Lide, C.; Shangguan, L.; Fang, J. Insights into grapevine defense response against drought as revealed by biochemical, physiological and RNA-Seq analysis. Sci. Rep. 2017, 7, 13134. [Google Scholar] [CrossRef] [PubMed] [Green Version]
  42. Vivier, M.A.; Pretorius, I.S. Genetically tailored grapevines for the wine industry. Trends Biotechnol. 2002, 20, 472–478. [Google Scholar] [CrossRef]
  43. Migliaro, D.; De Lorenzis, G.; Di Lorenzo, G.S.; Nardi, B.D.; Gardiman, M.; Failla, O.; Brancadoro, L.; Crespan, M. Grapevine non-vinifera genetic diversity assessed by simple sequence repeat markers as a starting point for new rootstock breeding programs. Am. J. Enol. Vitic. 2019, 70, 390–397. [Google Scholar] [CrossRef]
  44. Bianchi, D.; Brancadoro, L.; De Lorenzis, G. Genetic Diversity and Population Structure in a Vitis spp. Core Collection Investigated by SNP Markers. Diversity 2020, 12, 103. [Google Scholar] [CrossRef] [Green Version]
  45. Keller, M. The Science of Grapevines. Anatomy and Physiology; Elsevier: Amsterdam, The Netherlands, 2015; ISBN 9780124199873. [Google Scholar]
  46. Porro, D.; Pedò, S.; Bertoldi, D.; Bortolotti, L.; Failla, O.; Zamboni, M. Evaluation of New Rootstocks for Grapevine: Nutritional Aspects. Acta Hortic. 2013, 984, 109–115. [Google Scholar] [CrossRef]
  47. Cifre, J.; Bota, J.; Escalona, J.M.; Medrano, H.; Flexas, J. Physiological tools for irrigation scheduling in grapevine (Vitis vinifera L.) An open gate to improve water-use efficiency? Agric. Ecosyst. Environ. 2005, 106, 159–170. [Google Scholar] [CrossRef]
  48. Schubert, A.; Restagno, M.; Lovisolo, C. Photosynthesis of grapevine leaves of different age at high and low light intensity. Strateg. Optim. Wine Grape Qual. 1996. [Google Scholar] [CrossRef]
  49. Dal Santo, S.; Zenoni, S.; Sandri, M.; De Lorenzis, G.; Magris, G.; De Paoli, E.; Di Gaspero, G.; Del Fabbro, C.; Morgante, M.; Brancadoro, L.; et al. Grapevine field experiments reveal the contribution of genotype, the influence of environment and the effect of their interaction (G × E) on the berry transcriptome. Plant J. 2018, 93, 1143–1159. [Google Scholar] [CrossRef] [PubMed]
  50. Pinto, D.L.P.; Brancadoro, L.; Dal Santo, S.; De Lorenzis, G.; Pezzotti, M.; Meyers, B.C.; Pè, M.E.; Mica, E. The influence of genotype and environment on small RNA profiles in grapevine berry. Front. Plant Sci. 2016, 7. [Google Scholar] [CrossRef] [PubMed] [Green Version]
  51. Serra, I.; Strever, A.; Myburgh, P.A.; Deloire, A. Review: The interaction between rootstocks and cultivars (Vitis vinifera L.) to enhance drought tolerance in grapevine. Aust. J. Grape Wine Res. 2014, 20, 1–14. [Google Scholar] [CrossRef]
  52. Carbonneau, A. The Early Selection of Grapevine Rootstocks for Resistance to Drought Conditions. Am. J. Enol. Vitic. 1985, 36, 195–198. [Google Scholar]
  53. Padgett-Johnson, M.; Williams, L.E.; Walker, M.A. Vine water relations, gas exchange, and vegetative growth of seventeen Vitis species grown under irrigated and nonirrigated conditions in California. J. Am. Soc. Hortic. Sci. 2003, 128, 269–276. [Google Scholar] [CrossRef] [Green Version]
  54. Meggio, F.; Prinsi, B.; Negri, A.S.; Simone Di Lorenzo, G.; Lucchini, G.; Pitacco, A.; Failla, O.; Scienza, A.; Cocucci, M.; Espen, L. Biochemical and physiological responses of two grapevine rootstock genotypes to drought and salt treatments. Aust. J. Grape Wine Res. 2014, 20, 310–323. [Google Scholar] [CrossRef]
  55. Corso, M.; Vannozzi, A.; Maza, E.; Vitulo, N.; Meggio, F.; Pitacco, A.; Telatin, A.; D’Angelo, M.; Feltrin, E.; Negri, A.S.; et al. Comprehensive transcript profiling of two grapevine rootstock genotypes contrasting in drought susceptibility links the phenylpropanoid pathway to enhanced tolerance. J. Exp. Bot. 2015, 66, 5739–5752. [Google Scholar] [CrossRef]
  56. Frioni, T.; Biagioni, A.; Squeri, C.; Tombesi, S.; Gatti, M.; Poni, S. Grafting cv. grechetto gentile vines to new m4 rootstock improves leaf gas exchange and water status as compared to commercial 1103p rootstock. Agronomy 2020, 10, 708. [Google Scholar] [CrossRef]
  57. Galbignani, M.; Merli, M.; Magnanini, E.; Bernizzoni, F.; Talaverano, I.; Gatti, M.; Tombesi, S.; Palliotti, A.; Poni, S. Gas exchange and water—Use efficiency of cv. Sangiovese grafted to rootstocks of varying water—Deficit tolerance. Irrig. Sci. 2016, 34, 105–116. [Google Scholar] [CrossRef]
  58. Chan, Z. Expression profiling of ABA pathway transcripts indicates crosstalk between abiotic and biotic stress responses in Arabidopsis. Genomics 2012, 100, 110–115. [Google Scholar] [CrossRef] [Green Version]
  59. Rattanakon, S.; Ghan, R.; Gambetta, G.A.; Deluc, L.G.; Schlauch, K.A.; Cramer, G.R. Abscisic acid transcriptomic signaling varies with grapevine organ. BMC Plant Biol. 2016, 16, 1–16. [Google Scholar] [CrossRef] [PubMed] [Green Version]
  60. Ollat, N.; Cookson, S.J.; Destrac-Irvine, A.; Lauvergeat, V.; Ouaked-Lecourieux, F.; Marguerit, E.; Barrieu, F.; Dai, Z.; Duchêne, E.; Gambetta, G.A.; et al. Grapevine adaptation to abiotic stress: An overview. Acta Hortic. 2019, 1248, 497–512. [Google Scholar] [CrossRef]
  61. Delzon, S. New insight into leaf drought tolerance. Funct. Ecol. 2015, 29, 1247–1249. [Google Scholar] [CrossRef]
  62. Lovisolo, C.; Schubert, A. Effects of water stress on vessel size and xylem hydraulic conductivity in Vitis vinifera L. J. Exp. Bot. 2018, 49, 693–700. [Google Scholar]
  63. Tyree, M.T.; Ewers, F.W. The hydraulic architecture of trees and other woody plants. New Phytol. 1991, 119, 345–360. [Google Scholar] [CrossRef]
  64. Gardner, C.M.K.; Robinson, D.; Blyth, K.; Cooper, J.D. Soil Water Content. In Soil and Environmental Analysis: Physical Methods; Smith, K.A., Mullins, C.E., Eds.; Marcel Dekker Inc.: New York, NY, USA, 2001; pp. 13–20. [Google Scholar]
  65. Scholander, P.F.; Bradstreet, E.D.; Hemmingsen, E.A.; Hammel, H.T. Sap Pressure in Vascular Plants: Negative hydrostatic pressure can be measured in plants. Science 1965, 148, 339–346. [Google Scholar] [CrossRef]
  66. De Lorenzis, G.; Rustioni, L.; Parisi, S.G.; Zoli, F.; Brancadoro, L. Anthocyanin biosynthesis during berry development in corvina grape. Sci. Hortic. 2016, 212, 74–80. [Google Scholar] [CrossRef]
  67. Fujita, A.; Soma, N.; Goto-yamamoto, N.; Mizuno, A.; Kiso, K.; Hashizume, K. Effect of Shading on Proanthocyanidin Biosynthesis in the Grape Berry. J. Jpn. Soc. Hortic. Sci. 2007, 76, 112–119. [Google Scholar] [CrossRef] [Green Version]
  68. Reid, K.E.; Olsson, N.; Schlosser, J.; Peng, F.; Lund, S.T. An optimized grapevine RNA isolation procedure and statistical determination of reference genes for real-time RT-PCR during berry development. BMC Plant Biol. 2006, 6, 27. [Google Scholar] [CrossRef] [Green Version]
  69. Livak, K.J.; Schmittgen, T.D. Analysis of Relative Gene Expression Data Using Real-Time Quantitative PCR and the 2−ΔΔCT Method. Methods 2001, 25, 402–408. [Google Scholar] [CrossRef]
  70. Hayes, M.A.; Feechan, A.; Dry, I.B. Involvement of Abscisic Acid in the Coordinated Regulation of a Stress-Inducible Hexose Transporter (VvHT5) and a Cell Wall Invertase in Grapevine in Response to Biotrophic Fungal Infection. Plant Physiol. 2010, 153, 211–221. [Google Scholar] [CrossRef] [PubMed] [Green Version]
  71. Lund, S.T.; Peng, F.Y.; Nayar, T.; Reid, K.E.; Schlosser, J. Gene expression analyses in individual grape (Vitis vinifera L.) berries during ripening initiation reveal that pigmentation intensity is a valid indicator of developmental staging within the cluster. Plant Mol. Biol. 2008, 68, 301–315. [Google Scholar] [CrossRef] [PubMed]
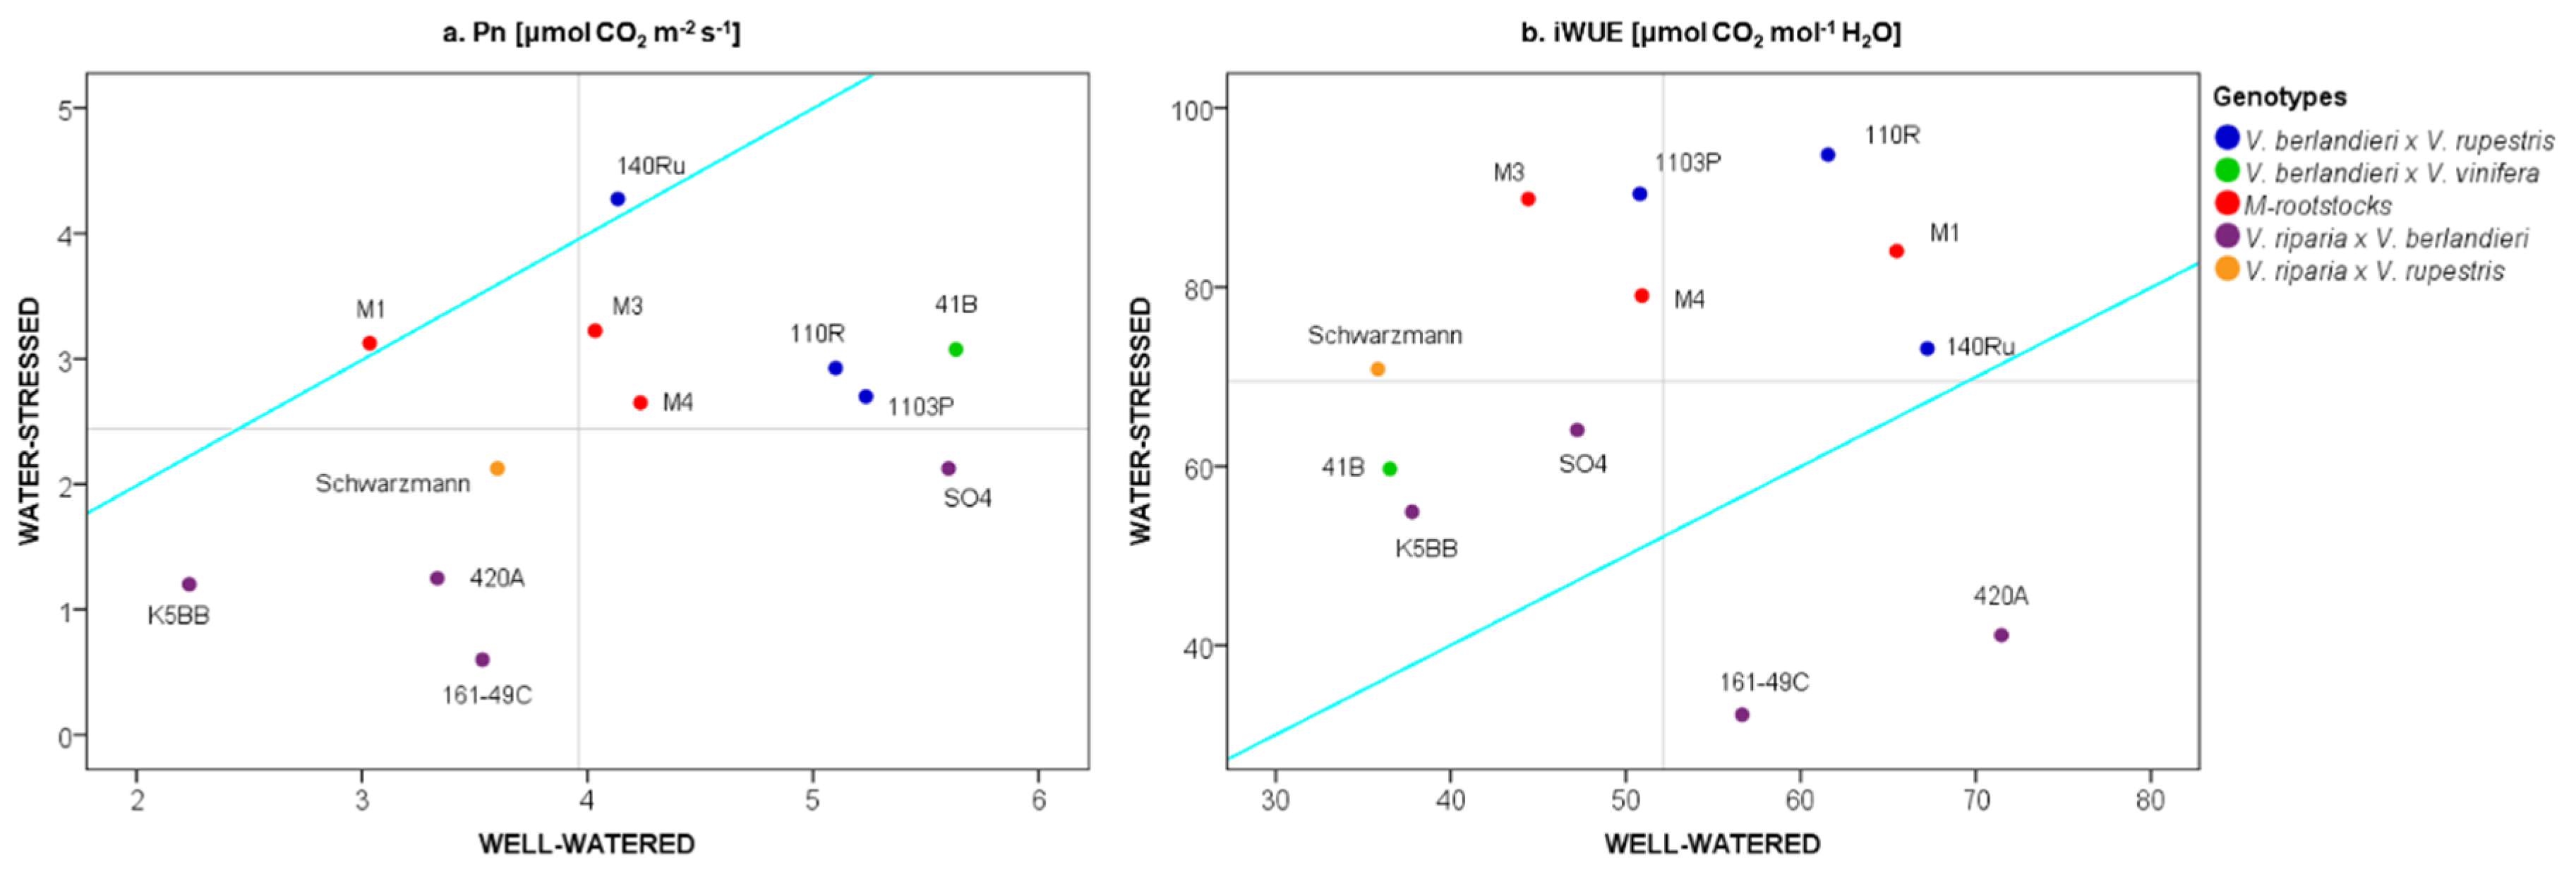
Figure 1. Comparison of performances in 12 own-rooted grapevine rootstocks under both well-watered (80% soil water content, SWC) and water-stressed (20% SWC) conditions in terms of net photosynthesis (Pn) (a) and intrinsic water use efficiency (iWUE) (b). Colors are attributed according to the breeding materials (Table 1). M-rootstock pedigree: M1—K5BB × Teleki 5C; M3—K5BB × Teleki 5C; M4—unknown × 1103P. Lines are set to the mean values of Pn (a) and iWUE (b) for each water condition. Lines 1:1 are reported in cyan.
Plants 09 01385 g001
Figure 2. Stomatal conductance (Gs) as function of net photosynthesis (Pn) in 12 own-rooted grapevine rootstocks at and 20% soil water content (SWC). Colors are attributed according to the breeding materials (Table 1). M-rootstock pedigree: M1—K5BB × Teleki 5C; M3—K5BB × Teleki 5C; M4—unknown × 1103P. Thresholds for group identification were set to 50 mmol H2O m−2 s−1 [47] for Gs and to the average for Pn at 20% SWC. The dotted line shows the average Gs value at 20% SWC.
Plants 09 01385 g002
Figure 3. Stem water potential (ΨS) as a function of decreasing soil water content (SWC) (a) and stomatal conductance (b). Groups are defined in Figure 2, according to the gas exchange values. Group A: 1103P, 110R, M1, M3 and M4 rootstocks; Group B: 161-49C, 420A, K5BB, Schwarzmann and SO4 rootstocks; Group C: 140Ru and 41B rootstocks. Letters show the statistical differences defined according to Tukey’s post hoc test at a p-value of 0.05. In plot (b), thresholds were set to 50 mmol H2O m−2 s−1 [47] for Gs and to the average for ΨS at 20% SWC.
Plants 09 01385 g003
Figure 4. Discriminant analysis of transcript (VvZEP, VvNCED1, VvNCED2, VvPP2C4, VvSnRK2.6 and VvABF2 genes) abundance data detected for 12 own-rooted grapevine rootstocks grown under limited water conditions. (a) Data collected at 50% soil water content (SWC). (b) Data collected at 20% SWC. The genotypes are classified into three groups (A, B and C), as defined in Figure 2, according to the intrinsic water use efficiency. Group A: 1103P, 110R, M1, M3 and M4 rootstocks; Group B: 161-49C, 420A, K5BB, Schwarzmann and SO4 rootstocks; Group C: 140Ru and 41B rootstocks. Discriminant function coefficients are reported in Table S3.
Plants 09 01385 g004
Figure 5. Graphical representation of gene expression data of six genes related to the ABA metabolism in roots (ac: VvZEP, VvNCED1 and VvNCED2) and leaves (df: VvPP2C4, VvSnRK2.6 and VvABF2) of 12 own-rooted grapevine rootstocks grown under limited water conditions (from 80 to 20% of soil water content, SWC). The genotypes are classified into three groups (A, B and C), as defined in Figure 2, according to the intrinsic water use efficiency. Average values and standard error are shown. Statistical differences are defined according to Tukey’s post hoc test at a p-value of 0.05. Group A: 1103P, 110R, M1, M3 and M4; Group B: 161-49C, 420A, K5BB, Schwarzmann and SO4; Group C: 140Ru and 41B.
Plants 09 01385 g005
Figure 6. Heatmap of correlation matrix (Pearson index) among physiological (E, Gs, Pn and ΨS) and transcriptional (VvZEP, VvNCED1, VvNCED2, VvPP2C4, VvSnRK2.6 and VvABF2 genes) data detected for 12 own-rooted grapevine rootstocks grown under limited water conditions (from 80 to 20% soil water content). E: Transpiration; Gs: Stomatal conductance; Pn: Photosynthetic activity; ΨS: Stem water potential. Statistically significant differences are reported at 0.05 (*) and 0.01 (**) levels.
Plants 09 01385 g006
Table 1. List of 12 grapevine rootstocks subjected to water limitation and information about their pedigree (based on Migliaro et al. [43]).
RootstockPedigree
1103PV. berlandieri cv. Resseguier nr. 2 × V. rupestris cv. Du Lot
110RV. berlandieri cv. Boutin × V. rupestris cv. Du Lot
140RuV. berlandieri cv. Boutin × V. rupestris cv. Du Lot
161-49CV. berlandieri × V. riparia
41BV. vinifera cv. Chasselas × V. berlandieri cv. Planchon
420AV. berlandieri × V. riparia
K5BBV. berlandieri Resseguier nr. 2 × V. riparia cv. Gloire de Montpellier
M1Kober 5BB × Teleki 5C (V. berlandieri cv. Planchon × V. riparia)
M3Kober 5BB × Teleki 5C
M4unknown × 1103 P
SchwarzmannV. riparia × V. rupestris
SO4V. berlandieri cv. Resseguier nr. 2 × V. riparia cv. Gloire de Montpellier
Table 2. Average value and standard deviation of physiological parameters for grapevine rootstock genotypes of Group A (1103P, 110R, M1, M3 and M4), Group B (161-49C, 420A, K5BB, Schwarzmann and SO4) and Group C (140Ru and 41B) at 20% soil water content (SWC). Groups are defined in Figure 2, according to the intrinsic water use efficiency. Pn = net photosynthesis (μmol CO2 m−2 s−1); Gs = stomatal conductance (mmol H2O m−2 s−1); E = transpiration (mmol H2O m−2 s−1); ΨS = stem water potential (MPa). Statistical differences among groups for each parameter are defined according to Tukey’s post hoc test at a p-value of 0.05.
ParameterGroup AGroup BGroup C
Pn2.93±0.66a1.47±1.15b3.68±1.62a
Gs35.80±13.40a28.26±16.16a67.25±36.23b
E0.77±0.26a0.66±0.36a1.38±0.67b
ΨS−0.76±0.13a−0.59±0.14b−0.66±0.14ab
Table 3. List of genes evaluated via real-time RT-PCR in roots and leaves of 12 own-rooted grapevine rootstocks grown under water deprivation.
GenesPrimer Sequence (5′ → 3′)ReferenceTissue
VvZEPF: GGTAAGAAGGAAAGGTTGC
R: CAATAGGAGTCCCTGATTTGATGC
Hayes et al. [70]roots
VvNCED1F: TGCAGAGGACGAGAGTGTAA
R: AGCTACACCAAAAGCTACGA
Hayes et al. [70]
VvNCED2F: ATGCTCAAACCGCCTCTGAT
R: TCCCAAGCATTCCAGAGGTG
Lund et al. [71]
VvPP2C4F: TGGGCTTTGGGATGTTATGT
R: TGTGCAGGAGTCTCATCAGC
Boneh et al. [40]leaves
VvSnRK2.6F: CACCAACCCACCTTGCTATT
R: AAACGTGCCTCATCCTCACT
Boneh et al. [40]
VvABF2F: GGCACCCAGGCTAGTTAA
R: GCAGAGTACACGCTAGATTG
Rossdeutsch et al. [34]
Publisher’s Note: MDPI stays neutral with regard to jurisdictional claims in published maps and institutional affiliations.