Copy Number Variation of Transposable Elements in Thinopyrum intermedium and Its Diploid Relative Species


Abstract
1. Introduction
2. Results
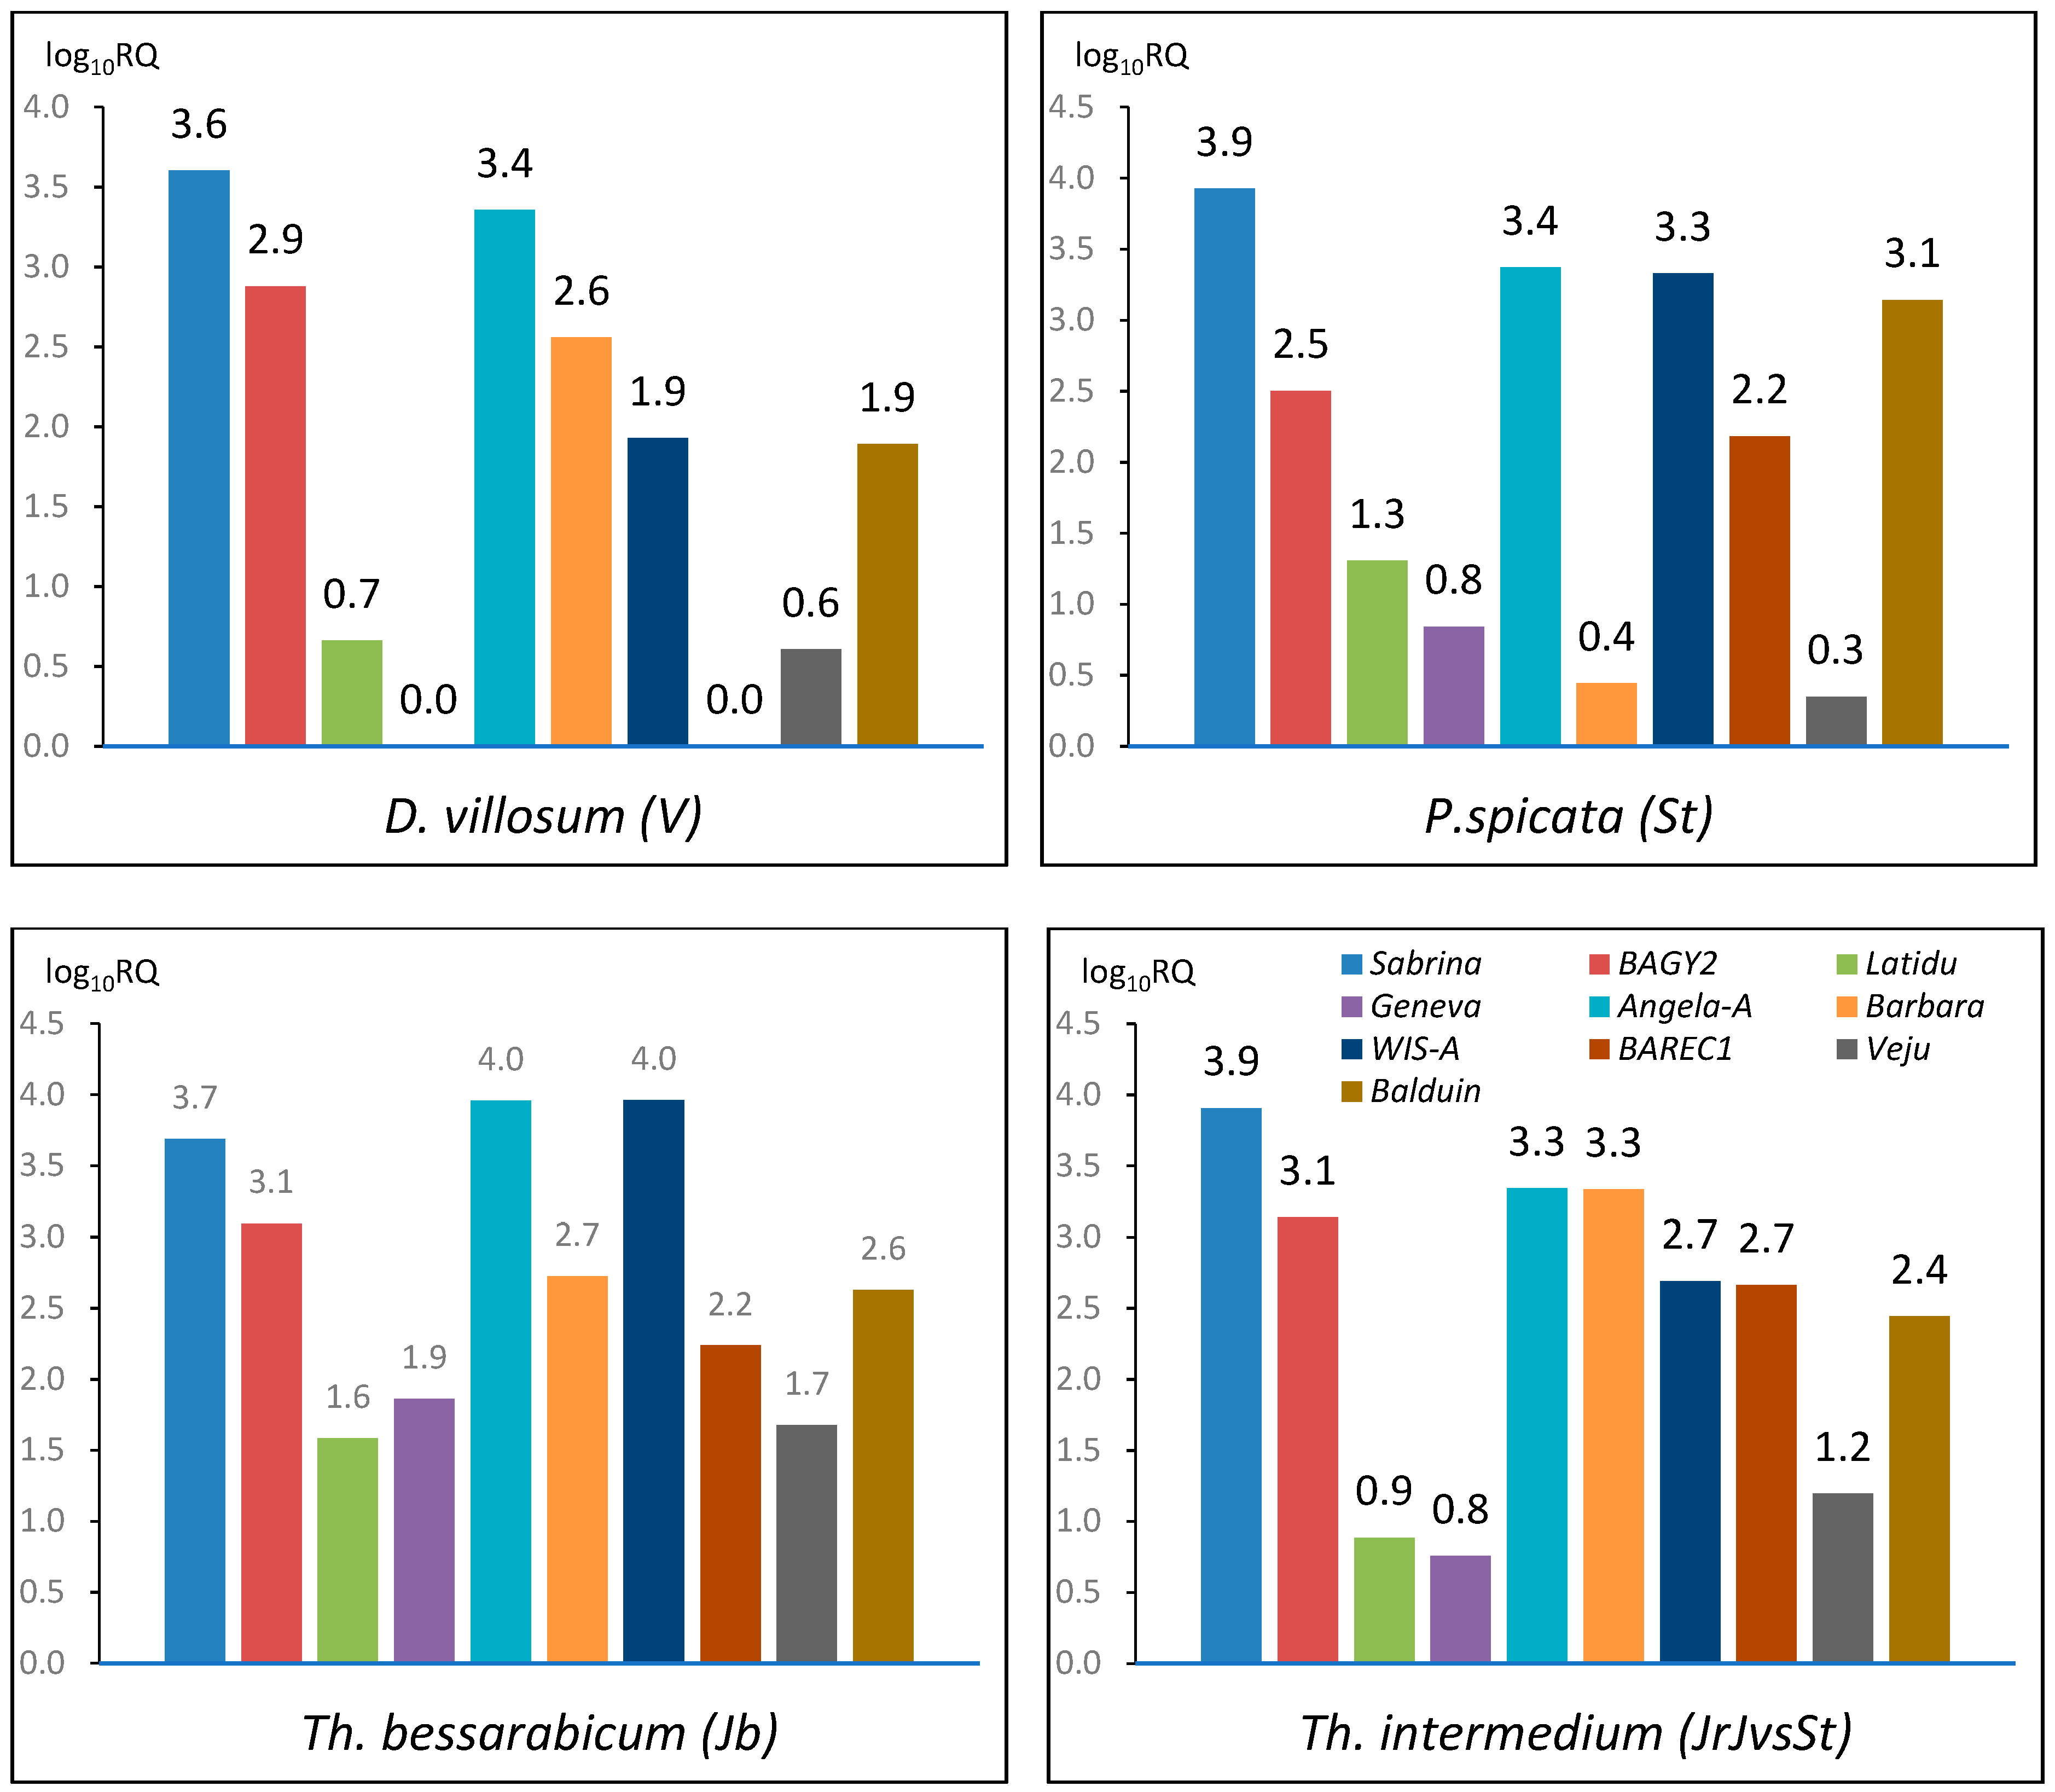
2.1. TE Copy Number Variation within Genomes
2.2. TE Copy Number Variation between Genomes
2.2.1. Sabrina
2.2.2. BAGY2
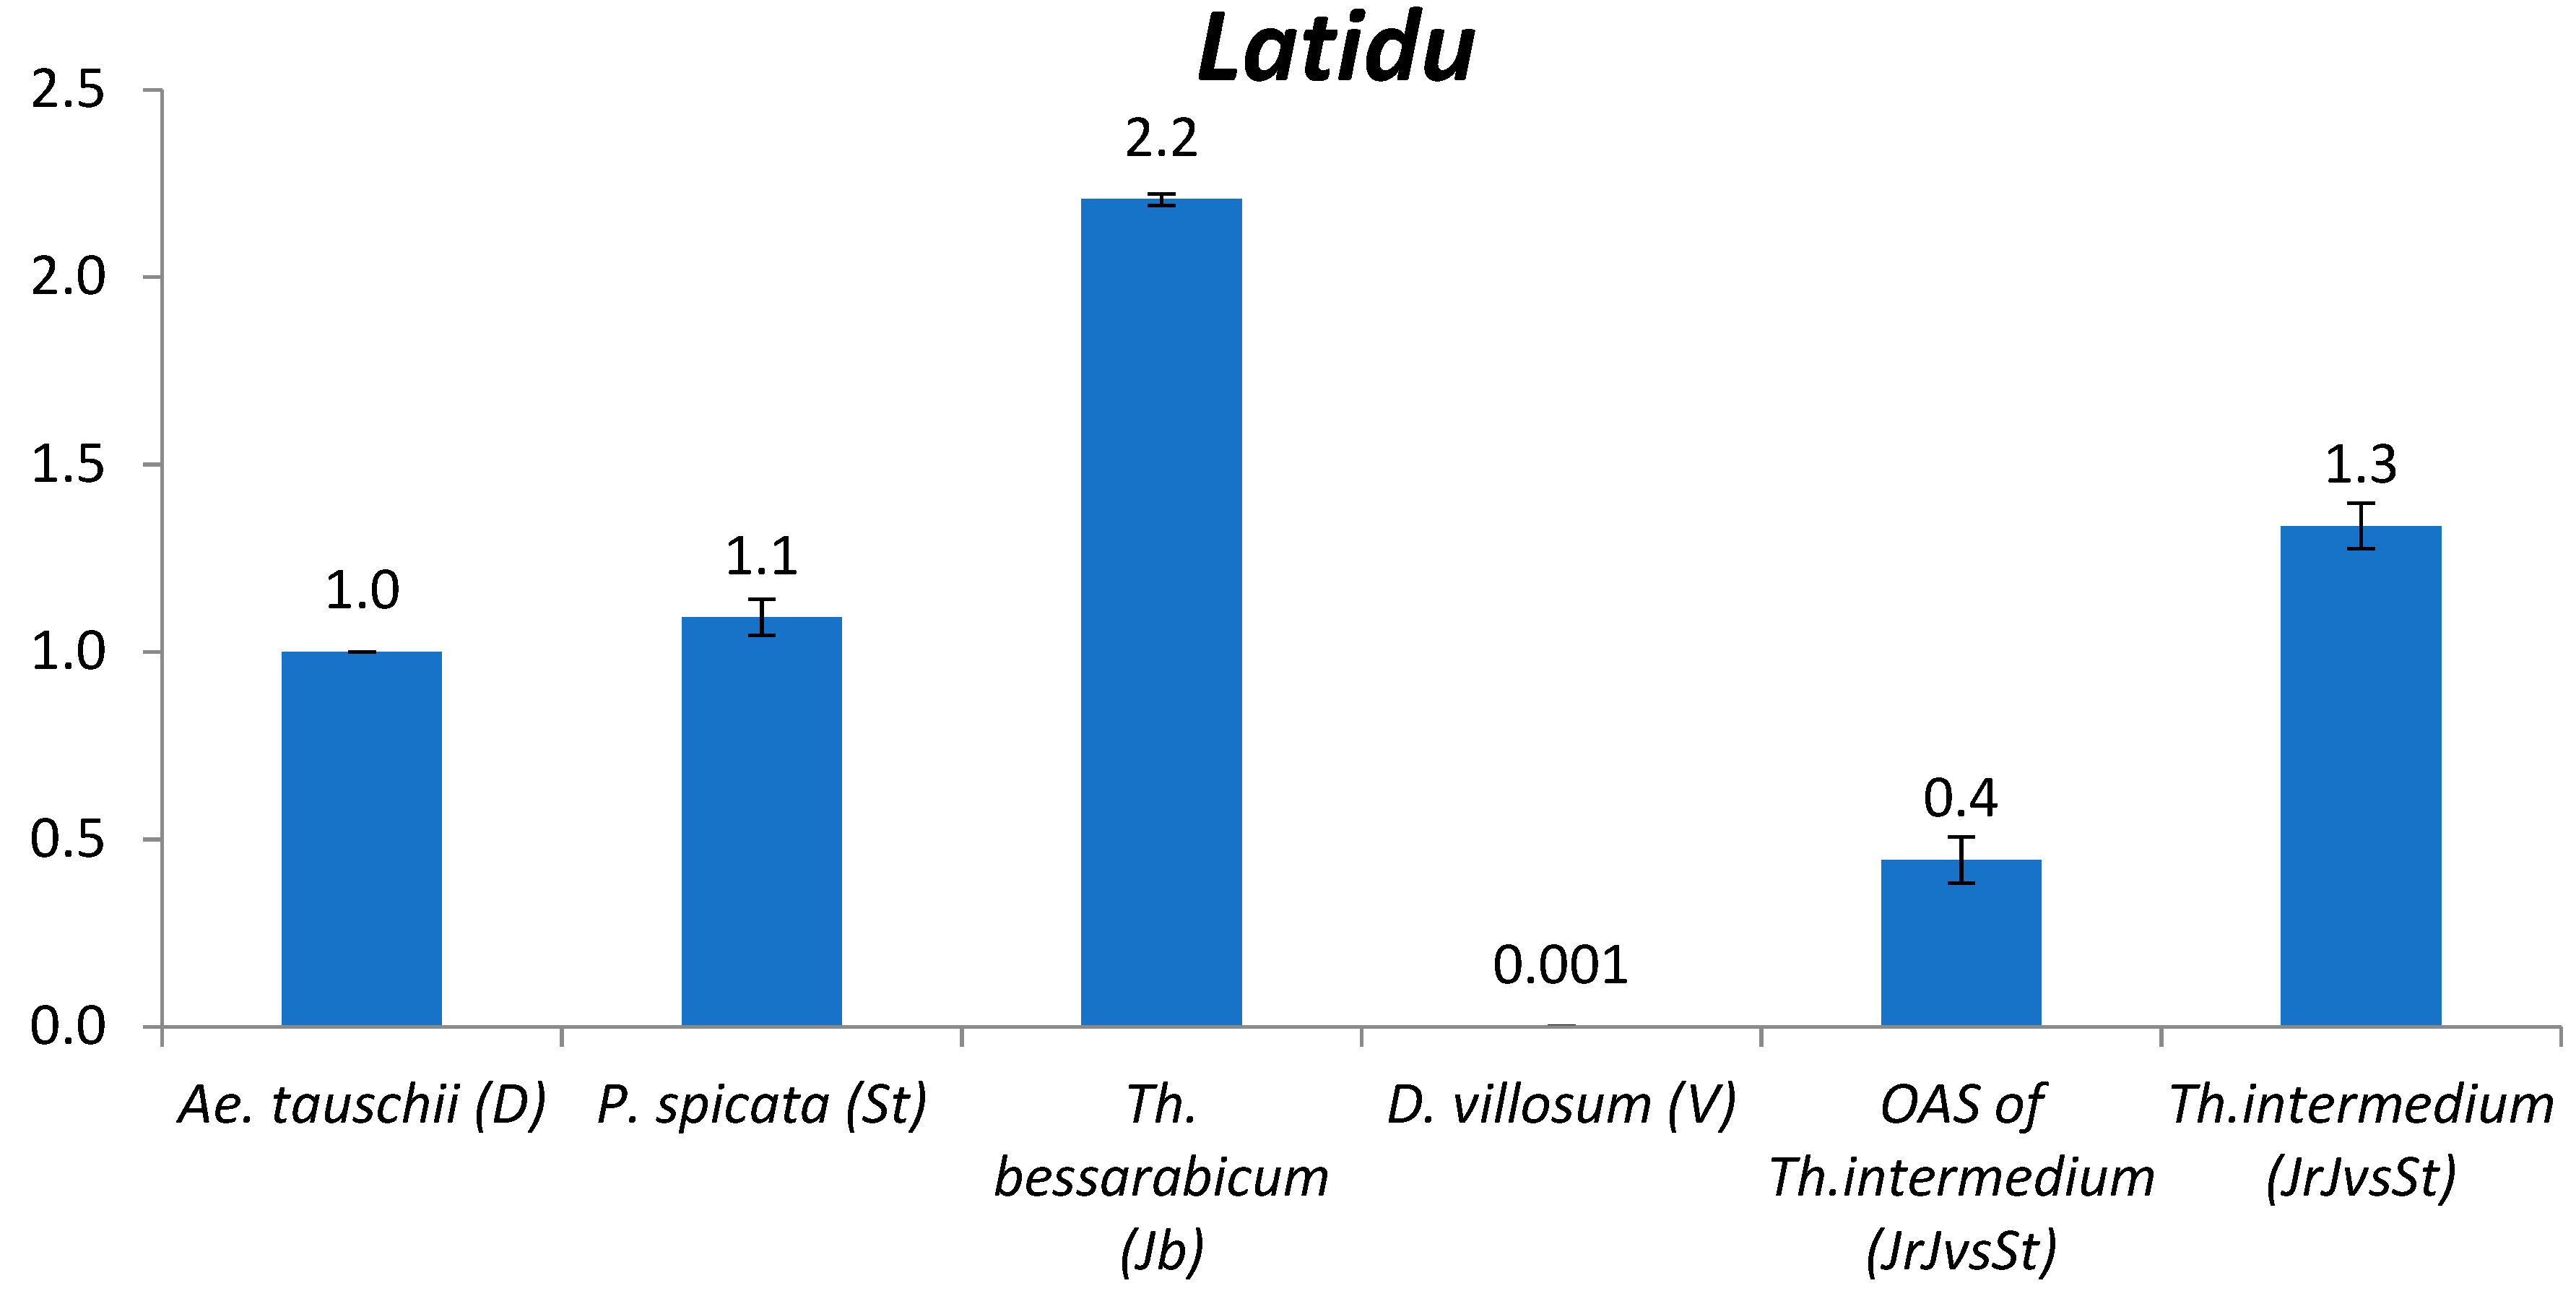
2.2.3. Latidu
2.2.4. Geneva
2.2.5. Angela-A
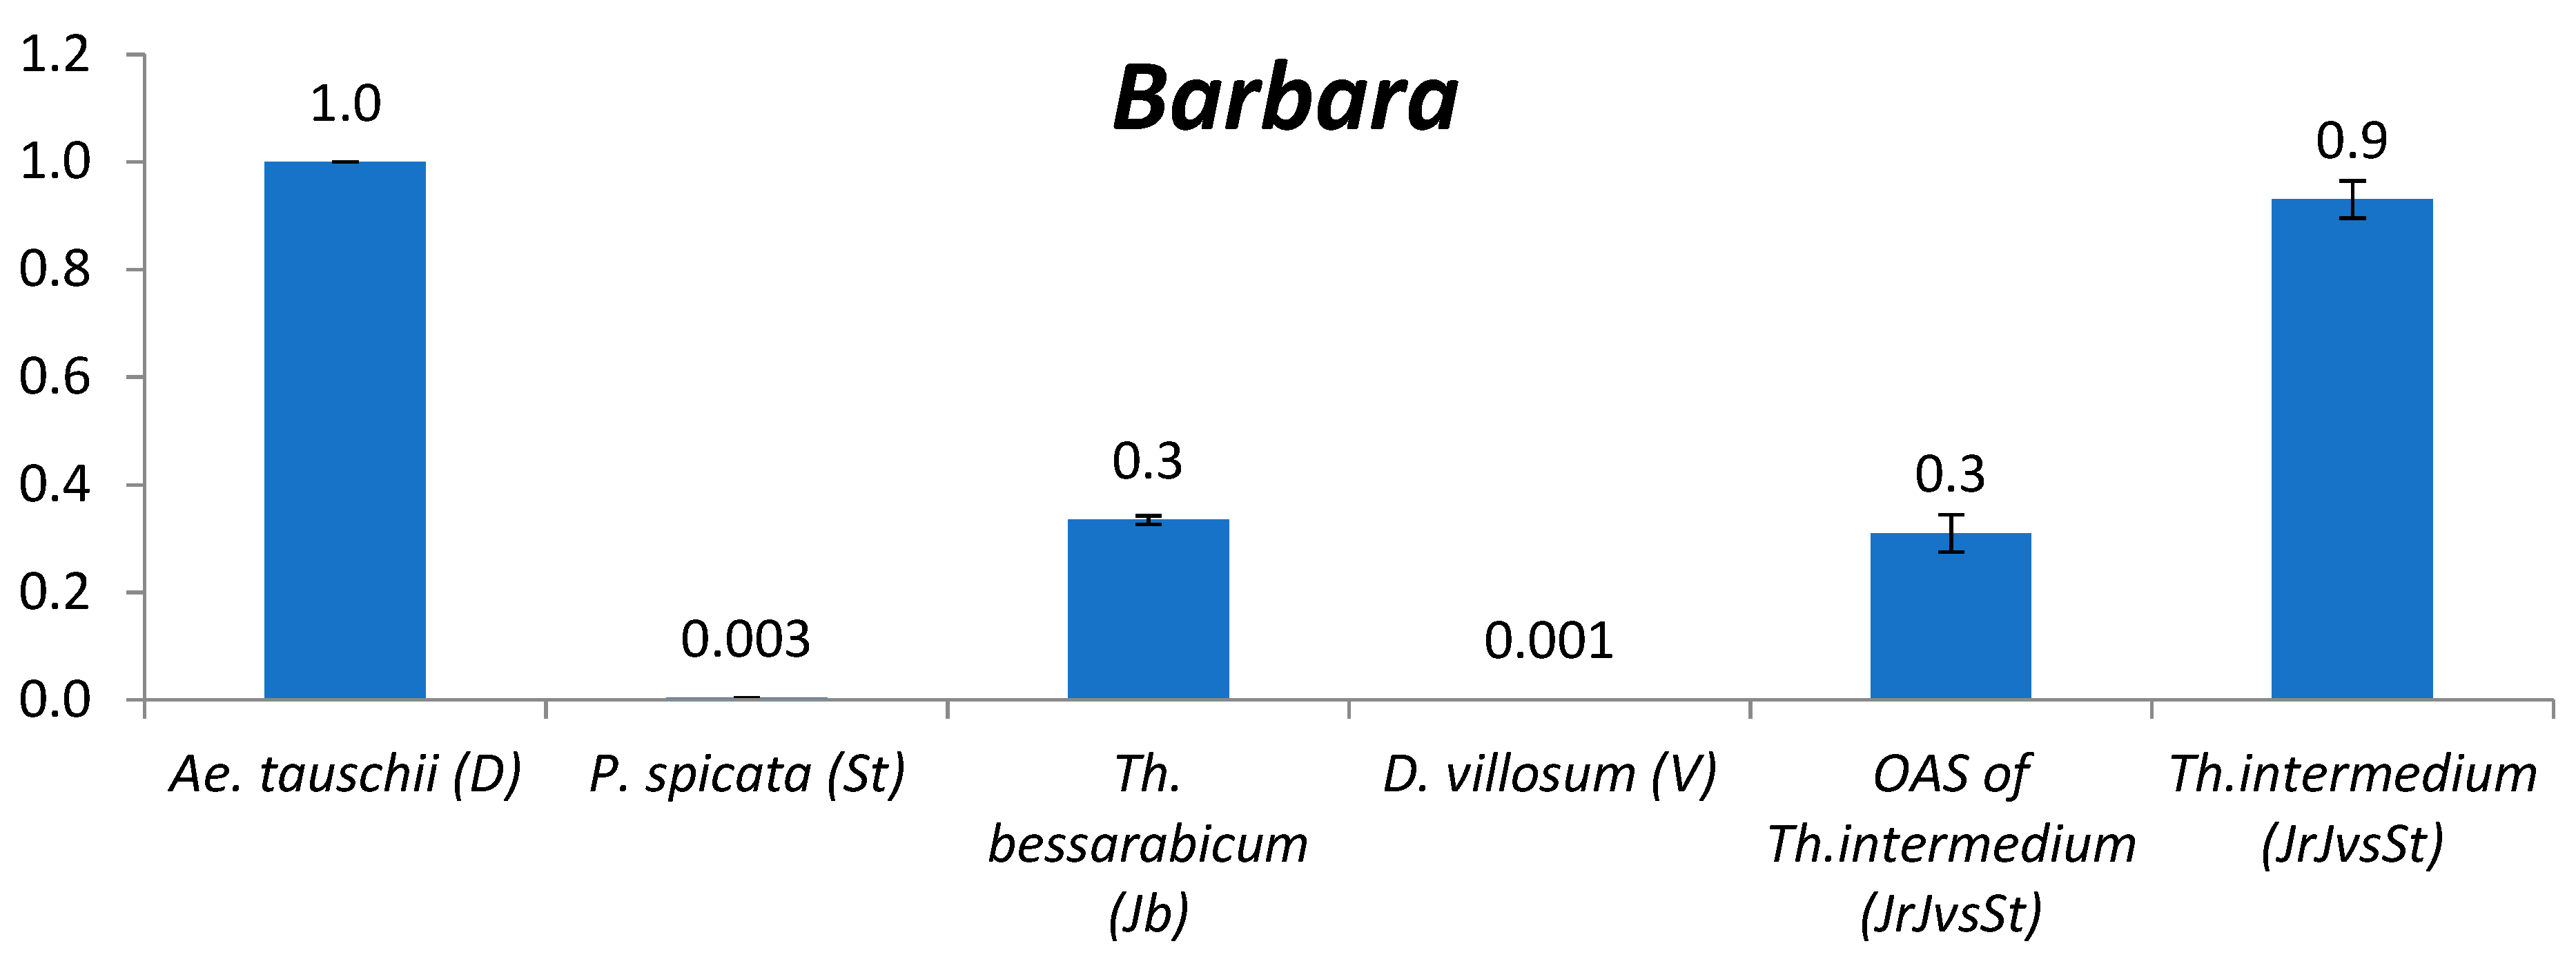
2.2.6. Barbara
2.2.7. WIS-A
2.2.8. BARE1C
2.2.9. Veju
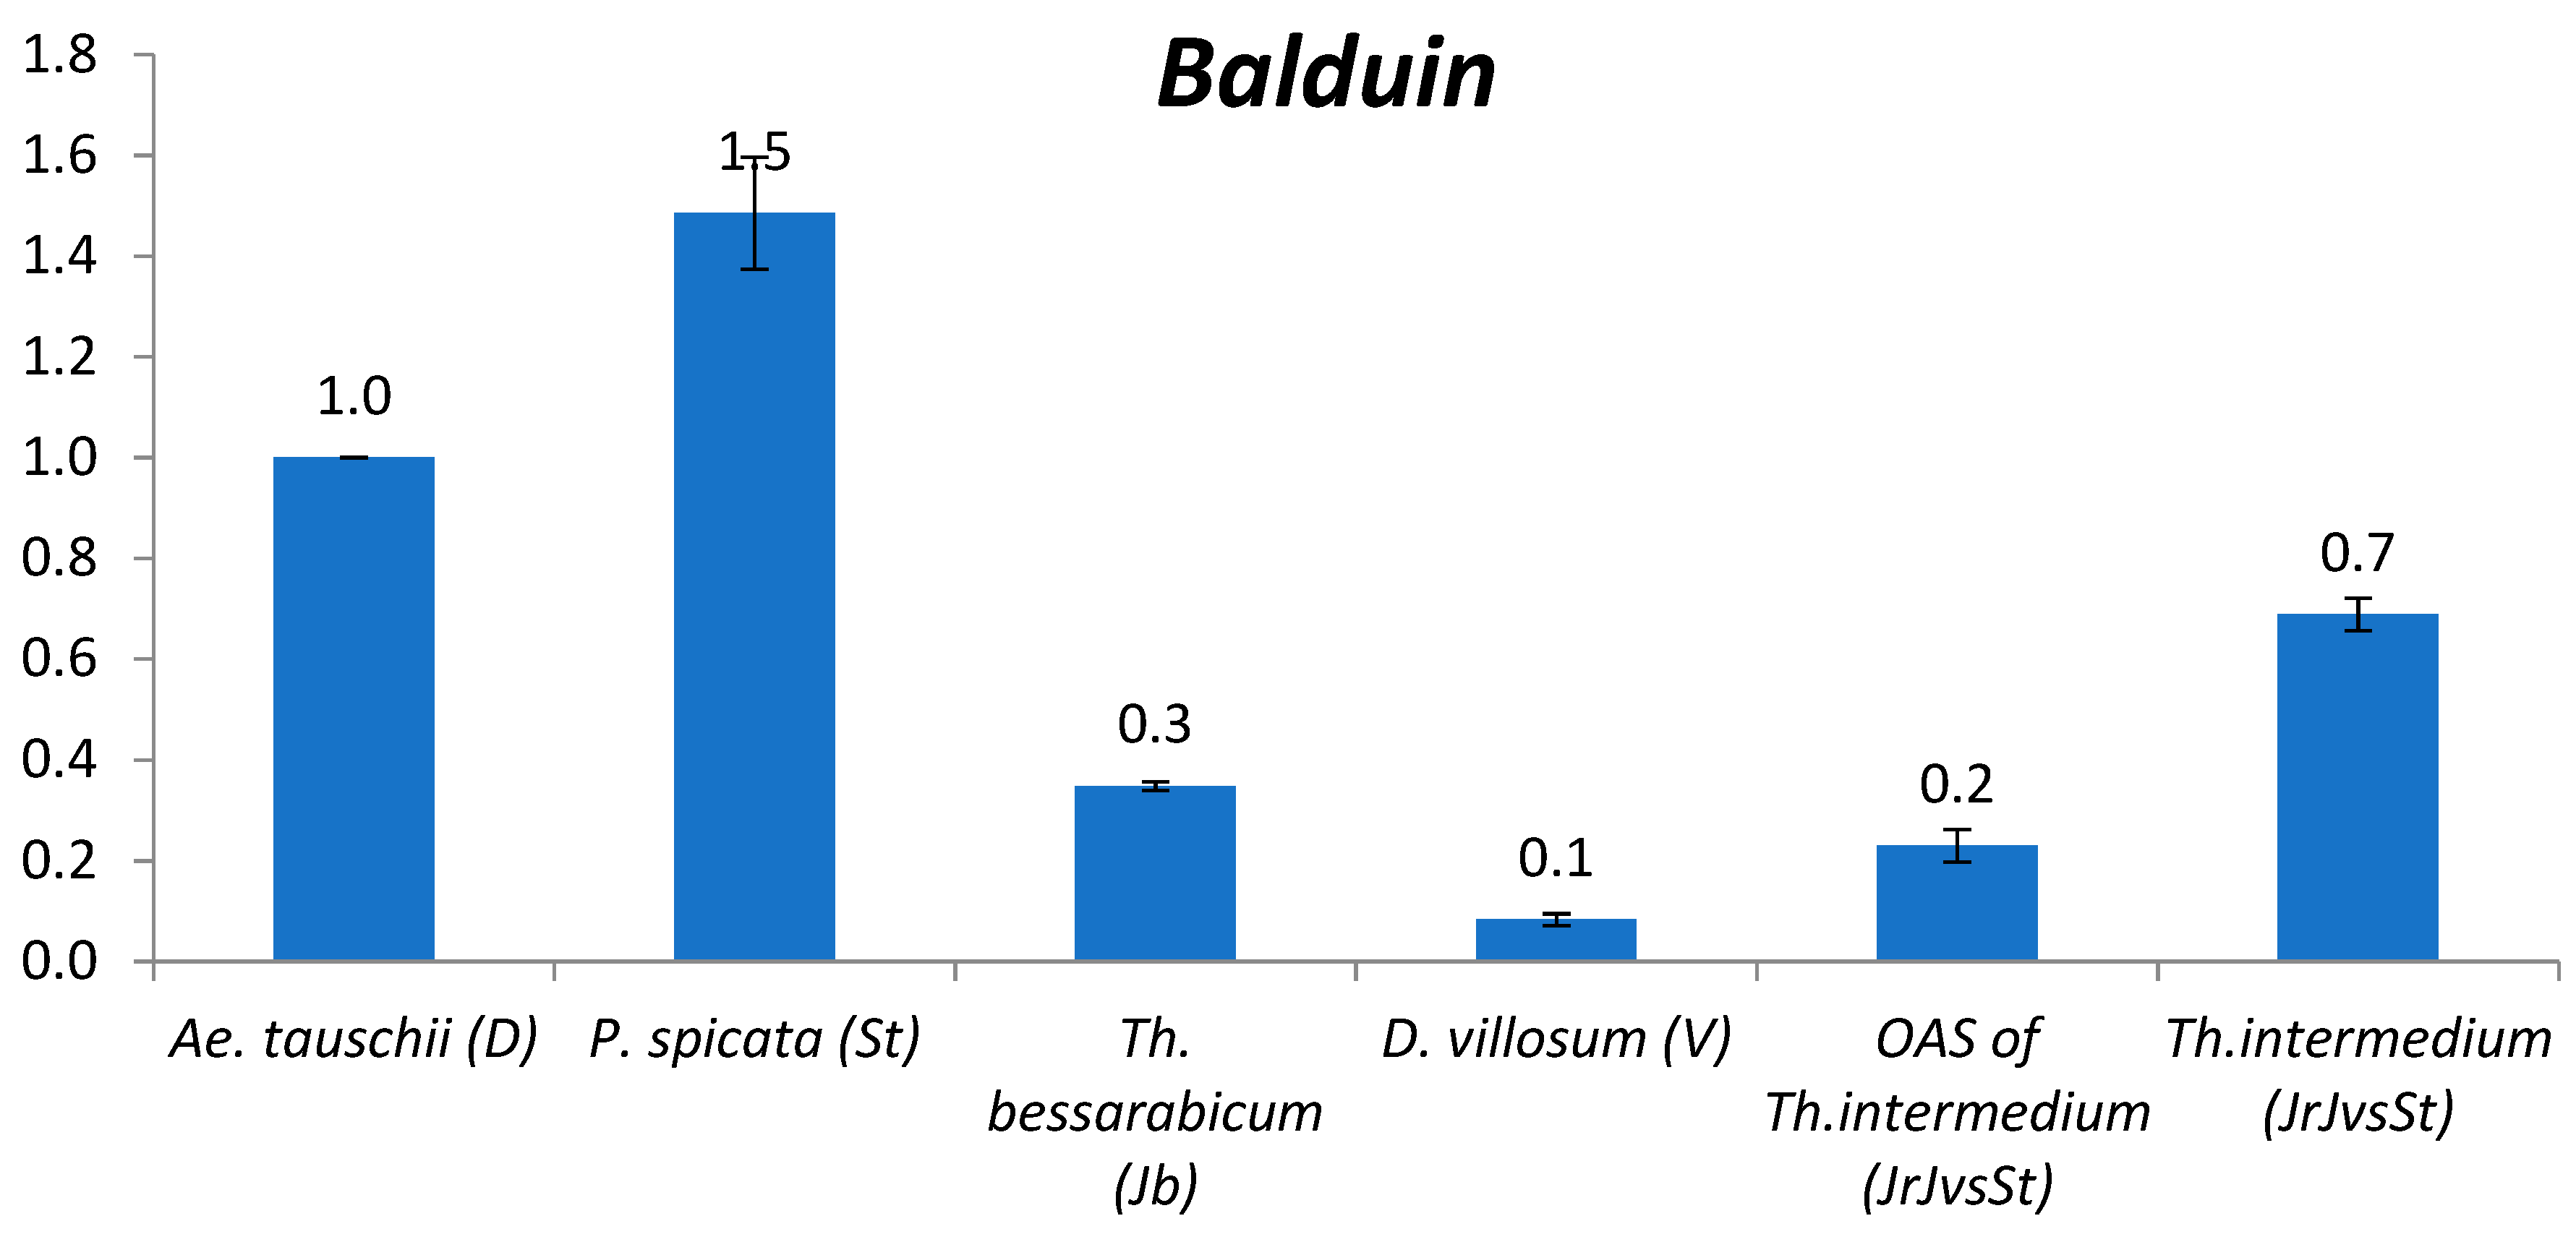
2.2.10. Balduin
3. Discussion
3.1. The Comparison of TE Content within Genomes
3.2. The Comparison of TE Content between Genomes
4. Conclusions
5. Materials and Methods
5.1. Plant Material
5.2. Quantitative PCR
5.3. TE’s Copy Number Calculation
Supplementary Materials
Author Contributions
Funding
Conflicts of Interest
References
- Arabidopsis Genome Initiative. Analysis of the genome sequence of the flowering plant Arabidopsis thaliana. Nature 2000, 408, 796–815. [Google Scholar] [CrossRef] [PubMed]
- Meyers, B. Abundance, distribution, and transcriptional activity of repetitive elements in the maize genome. Genome Res. 2001, 11, 1660–1676. [Google Scholar] [CrossRef] [PubMed]
- Li, W.; Zhang, P.; Fellers, J.; Friebe, B.; Gill, B. Sequence composition, organization, and evolution of the core Triticeae genome. Plant J. 2004, 40, 500–511. [Google Scholar] [CrossRef] [PubMed]
- Paux, E.; Roger, D.; Badaeva, E.; Gay, G.; Bernard, M.; Sourdille, P.; Feuillet, C. Characterizing the composition and evolution of homoeologous genomes in hexaploid wheat through BAC-end sequencing on chromosome 3B. Plant J. 2006, 48, 463–474. [Google Scholar] [CrossRef]
- Charles, M.; Belcram, H.; Just, J.; Huneau, C.; Viollet, A.; Couloux, A.; Segurens, B.; Carter, M.; Huteau, V.; Coriton, O.; et al. Dynamics and differential proliferation of transposable elements during the evolution of the B and A genomes of wheat. Genetics 2008, 180, 1071–1086. [Google Scholar] [CrossRef]
- Wicker, T.; Taudien, S.; Houben, A.; Keller, B.; Graner, A.; Platzer, M.; Stein, N. A whole-genome snapshot of 454 sequences exposes the composition of the barley genome and provides evidence for parallel evolution of genome size in wheat and barley. Plant J. 2009, 59, 712–722. [Google Scholar] [CrossRef]
- Mayer, K.; Martis, M.; Hedley, P.; Šimková, H.; Liu, H.; Morris, J.; Steuernagel, B.; Taudien, S.; Roessner, S.; Gundlach, H.; et al. Unlocking the barley genome by chromosomal and comparative genomics. Plant Cell 2011, 23, 1249–1263. [Google Scholar] [CrossRef]
- Kejnovsky, E.; Hawkins, J.; Feschotte, C. Plant transposable elements: Biology and evolution. In Plant Genome Diversity; Wendel, J., Greilhuber, J., Doležel, J., Leitch, I., Eds.; Springer: Wien, Austria, 2012; Volume 1, pp. 17–34. [Google Scholar]
- Bennetzen, J. The contributions of retroelements to plant genome organization, function and evolution. Trends Microbiol. 1996, 4, 347–353. [Google Scholar] [CrossRef]
- Feschotte, C.; Jiang, N.; Wessler, S. Plant transposable elements: Where genetics meets genomics. Nat. Rev. Genet. 2002, 3, 329–341. [Google Scholar] [CrossRef]
- Neumann, P.; Koblížková, A.; Navrátilová, A.; Macas, J. Significant expansion of Vicia pannonica genome size mediated by amplification of a single type of giant retroelement. Genetics 2006, 173, 1047–1056. [Google Scholar] [CrossRef]
- Vitte, C.; Bennetzen, J. Analysis of retrotransposon structural diversity uncovers properties and propensities in angiosperm genome evolution. Proc. Natl. Acad. Sci. USA 2006, 103, 17638–17643. [Google Scholar] [CrossRef] [PubMed]
- Paterson, A.; Bowers, J.; Bruggmann, R.; Dubchak, I.; Grimwood, J.; Gundlach, H.; Haberer, G.; Hellsten, U.; Mitros, T.; Poliakov, A.; et al. The Sorghum bicolor genome and the diversification of grasses. Nature 2009, 457, 551–556. [Google Scholar] [CrossRef] [PubMed]
- Schnable, P.; Ware, D.; Fulton, R.; Stein, J.; Wei, F.; Pasternak, S.; Liang, C.; Zhang, J.; Fulton, L.; Graves, T.; et al. The B73 maize genome: Complexity, diversity, and dynamics. Science 2009, 326, 1112–1115. [Google Scholar] [CrossRef] [PubMed]
- International Brachypodium Initiative. Genome sequencing and analysis of the model grass Brachypodium distachyon. Nature 2010, 463, 763–768. [Google Scholar] [CrossRef]
- Tenaillon, M.; Hollister, J.; Gaut, B. A triptych of the evolution of plant transposable elements. Trends Plant Sci. 2010, 15, 471–478. [Google Scholar] [CrossRef]
- Mascher, M.; Gundlach, H.; Himmelbach, A.; Beier, S.; Twardziok, S.; Wicker, T.; Radchuk, V.; Dockter, C.; Hedley, P.; Russell, J.; et al. A chromosome conformation capture ordered sequence of the barley genome. Nature 2017, 544, 427–433. [Google Scholar] [CrossRef]
- Feschotte, C.; Pritham, E. DNA transposons and the evolution of eukaryotic genomes. Annu. Rev. Genet. 2007, 41, 331–368. [Google Scholar] [CrossRef]
- Yuan, Y.; Wessler, S. The catalytic domain of all eukaryotic cut-and-paste transposase superfamilies. Proc. Natl. Acad. Sci. USA 2011, 108, 7884–7889. [Google Scholar] [CrossRef]
- Fujimoto, R.; Takuno, S.; Sasaki, T.; Nishio, T. The pattern of amplification and differentiation of Ty1/Copia and Ty3/Gypsy retrotransposons in Brassicaceae species. Genes Genet. Syst. 2008, 83, 13–22. [Google Scholar] [CrossRef][Green Version]
- Belyayev, A.; Kalendar, R.; Brodsky, L.; Nevo, E.; Schulman, A.; Raskina, O. Transposable elements in a marginal plant population: Temporal fluctuations provide new insights into genome evolution of wild diploid wheat. Mobile DNA 2010, 1, 6. [Google Scholar] [CrossRef]
- Petit, M.; Guidat, C.; Daniel, J.; Denis, E.; Montoriol, E.; Bui, Q.; Lim, K.; Kovarik, A.; Leitch, A.; Grandbastien, M.; et al. Mobilization of retrotransposons in synthetic allotetraploid tobacco. New Phytol. 2010, 186, 135–147. [Google Scholar] [CrossRef] [PubMed]
- Vicient, C.; Casacuberta, J. Impact of transposable elements on polyploid plant genomes. Ann. Bot. 2017, 120, 195–207. [Google Scholar] [CrossRef] [PubMed]
- Kashkush, K.; Feldman, M.; Levy, A. Transcriptional activation of retrotransposons alters the expression of adjacent genes in wheat. Nat. Genet. 2002, 33, 102–106. [Google Scholar] [CrossRef] [PubMed]
- Wicker, T.; Buchmann, J.; Keller, B. Patching gaps in plant genomes results in gene movement and erosion of colinearity. Genome Res. 2010, 20, 1229–1237. [Google Scholar] [CrossRef] [PubMed]
- Lisch, D.; Bennetzen, J. Transposable element origins of epigenetic gene regulation. Curr. Opin. Plant Biol. 2011, 14, 156–161. [Google Scholar] [CrossRef]
- Middleton, C.; Stein, N.; Keller, B.; Kilian, B.; Wicker, T. Comparative analysis of genome composition in Triticeae reveals strong variation in transposable element dynamics and nucleotide diversity. Plant J. 2012, 73, 347–356. [Google Scholar] [CrossRef]
- Yaakov, B.; Meyer, K.; Ben-David, S.; Kashkush, K. Copy number variation of transposable elements in Triticum–Aegilops genus suggests evolutionary and revolutionary dynamics following allopolyploidization. Plant Cell Rep. 2013, 32, 1615–1624. [Google Scholar] [CrossRef]
- Belyayev, A. Bursts of transposable elements as an evolutionary driving force. J. Evol. Biol. 2014, 27, 2573–2584. [Google Scholar] [CrossRef]
- Keidar, D.; Doron, C.; Kashkush, K. Genome-wide analysis of a recently active retrotransposon, Au SINE, in wheat: Content, distribution within subgenomes and chromosomes, and gene associations. Plant Cell Rep. 2017, 37, 193–208. [Google Scholar] [CrossRef]
- Keidar-Friedman, D.; Bariah, I.; Kashkush, K. Genome-wide analyses of miniature inverted-repeat transposable elements reveals new insights into the evolution of the Triticum-Aegilops group. PLoS ONE 2018, 13, e0204972. [Google Scholar] [CrossRef]
- McClintock, B. The significance of responses of the genome to challenge. Science 1984, 226, 792–801. [Google Scholar] [CrossRef] [PubMed]
- Piegu, B.; Guyot, R.; Picault, N.; Roulin, A.; Saniyal, A.; Kim, H.; Collura, K.; Brar, D.; Jackson, S.; Wing, R.; et al. Doubling genome size without polyploidization: Dynamics of retrotransposition-driven genomic expansions in Oryza australiensis, a wild relative of rice. Genome Res. 2006, 16, 1262–1269. [Google Scholar] [CrossRef] [PubMed]
- Hawkins, J.; Proulx, S.; Rapp, R.; Wendel, J. Rapid DNA loss as a counterbalance to genome expansion through retrotransposon proliferation in plants. Proc. Natl. Acad. Sci. USA 2009, 106, 17811–17816. [Google Scholar] [CrossRef] [PubMed]
- Lysak, M.; Koch, M.; Beaulieu, J.; Meister, A.; Leitch, I. The dynamic ups and downs of genome size evolution in Brassicaceae. Mol. Biol. Evol. 2008, 26, 85–98. [Google Scholar] [CrossRef]
- Mascagni, F.; Barghini, E.; Giordani, T.; Rieseberg, L.; Cavallini, A.; Natali, L. Repetitive DNA and plant domestication: Variation in copy number and proximity to genes of LTR-Retrotransposons among wild and cultivated sunflower (Helianthus annuus) Genotypes. Genome Biol. Evol. 2015, 7, 3368–3382. [Google Scholar] [CrossRef]
- Tetreault, H.; Ungerer, M. Long terminal repeat retrotransposon content in eight diploid sunflower species inferred from next-generation sequence data. G3 (Bethesda) 2016, 6, 2299–2308. [Google Scholar] [CrossRef]
- Domb, K.; Keidar, D.; Yaakov, B.; Khasdan, V.; Kashkush, K. Transposable elements generate population-specific insertional patterns and allelic variation in genes of wild emmer wheat (Triticum turgidum ssp. dicoccoides). BMC Plant Biol. 2017, 17. [Google Scholar] [CrossRef]
- Shams, I.; Raskina, O. Intraspecific and intraorganismal copy number dynamics of retrotransposons and tandem repeat in Aegilops speltoides Tausch (Poaceae, Triticeae). Protoplasma 2018, 255, 1023–1038. [Google Scholar] [CrossRef]
- Raskina, O. Transposable elements in the organization and diversification of the genome of Aegilops speltoides Tausch (Poaceae, Triticeae). Int. J. Genom. 2018, 2018, 1–9. [Google Scholar] [CrossRef]
- Kawakami, T.; Strakosh, S.; Zhen, Y.; Ungerer, M. Different scales of Ty1/Copia-like retrotransposon proliferation in the genomes of three diploid hybrid sunflower species. Heredity 2010, 104, 341–350. [Google Scholar] [CrossRef]
- Yaakov, B.; Kashkush, K. Mobilization of Stowaway-like MITEs in newly formed allohexaploid wheat species. Plant Mol. Biol. 2012, 80, 419–427. [Google Scholar] [CrossRef] [PubMed]
- Ben-David, S.; Yaakov, B.; Kashkush, K. Genome-wide analysis of short interspersed nuclear elements SINES revealed high sequence conservation, gene association and retrotranspositional activity in wheat. Plant J. 2013, 76, 201–210. [Google Scholar] [CrossRef] [PubMed]
- Casacuberta, J.; Jackson, S.; Panaud, O.; Purugganan, M.; Wendel, J. Evolution of plant phenotypes, from genomes to traits. G3 (Bethesda) 2016, 6, 775–778. [Google Scholar] [CrossRef] [PubMed]
- Wendel, J.; Jackson, S.; Meyers, B.; Wing, R. Evolution of plant genome architecture. Genome Biol. 2016, 17. [Google Scholar] [CrossRef]
- Pagnotta, M.; Mondini, L.; Porceddu, E. Quantification and organization of WIS2-1A and BARE-1 retrotransposons in different genomes of Triticum and Aegilops species. Mol. Genet. Genom. 2009, 282, 245–255. [Google Scholar] [CrossRef]
- Sarilar, V.; Palacios, P.; Rousselet, A.; Ridel, C.; Falque, M.; Eber, F.; Chèvre, A.; Joets, J.; Brabant, P.; Alix, K. Allopolyploidy has a moderate impact on restructuring at three contrasting transposable element insertion sites in resynthesized Brassica napus allotetraploids. New Phytol. 2013, 198, 593–604. [Google Scholar] [CrossRef]
- Senerchia, N.; Felber, F.; Parisod, C. Contrasting evolutionary trajectories of multiple retrotransposons following independent allopolyploidy in wild wheats. New Phytol. 2014, 202, 975–985. [Google Scholar] [CrossRef]
- Parisod, C.; Senerchia, N. Responses Of Transposable Elements To Polyploidy. Plant Transposable Elements 2012, 147–168. [Google Scholar]
- Zhang, J.; Liu, Y.; Xia, E.; Yao, Q.; Liu, X.; Gao, L. Autotetraploid rice methylome analysis reveals methylation variation of transposable elements and their effects on gene expression. Proc. Natl. Acad. Sci. USA 2015, 112, E7022–E7029. [Google Scholar] [CrossRef]
- Parisod, C.; Alix, K.; Just, J.; Petit, M.; Sarilar, V.; Mhiri, C.; Ainouche, M.; Chalhoub, B.; Grandbastien, M. Impact Of Transposable Elements On The Organization And Function Of Allopolyploid Genomes. New Phytol. 2009, 186, 37–45. [Google Scholar] [CrossRef]
- Kraitshtein, Z.; Yaakov, B.; Khasdan, V.; Kashkush, K. Genetic and epigenetic dynamics of a retrotransposon after allopolyploidization of wheat. Genetics 2010, 186, 801–812. [Google Scholar] [CrossRef] [PubMed]
- Yaakov, B.; Kashkush, K. Methylation, transcription, and rearrangements of transposable elements in synthetic allopolyploids. Int. J. Plant Genom. 2011, 569826, 1–7. [Google Scholar] [CrossRef] [PubMed]
- Yaakov, B.; Kashkush, K. Massive alterations of the methylation patterns around DNA transposons in the first four generations of a newly formed wheat allohexaploid. Genome 2011, 54, 42–49. [Google Scholar] [CrossRef] [PubMed]
- Choulet, F.; Wicker, T.; Rustenholz, C.; Paux, E.; Salse, J.; Leroy, P.; Schlub, S.; Le Paslier, M.; Magdelenat, G.; Gonthier, C.; et al. Megabase level sequencing reveals contrasted organization and evolution patterns of the wheat gene and transposable element spaces. Plant Cell 2010, 22, 1686–1701. [Google Scholar] [CrossRef] [PubMed]
- Bauer, E.; Schmutzer, T.; Barilar, I.; Mascher, M.; Gundlach, H.; Martis, M.; Twardziok, S.; Hackauf, B.; Gordillo, A.; Wilde, P.; et al. Towards a whole-genome sequence for rye (Secale cereale). Plant J. 2017, 89, 853–869. [Google Scholar] [CrossRef] [PubMed]
- Liu, Q.; Li, X.; Zhou, X.; Li, M.; Zhang, F.; Schwarzacher, T.; Heslop-Harrison, J. The Repetitive DNA Landscape In Avena (Poaceae): Chromosome And Genome Evolution Defined By Major Repeat Classes In Whole-Genome Sequence Reads. BMC Plant Biology 2019, 19. [Google Scholar] [CrossRef]
- Chen, Q.; Conner, R.; Laroche, A.; Thomas, J. Genome analysis of Thinopyrum intermedium and Thinopyrum ponticum using genomic in situ hybridization. Genome 1998, 41, 580–586. [Google Scholar] [CrossRef]
- Kishii, M.; Wang, R.; Tsujimoto, H. GISH analysis revealed new aspect of genomic constitution of Thinopyrum intermedium. Czech J. Genet. Plant Breed. 2012, 41, 92–95. [Google Scholar] [CrossRef]
- Liu, C.; Yang, Z.; Jia, J.; Li, G.; Zhou, J.; Ren, Z. Genomic distribution of a long terminal repeat (LTR) Sabrina-like retrotransposon in Triticeae species. Cereal Res. Commun. 2009, 37, 363–372. [Google Scholar] [CrossRef]
- Deng, C.; Bai, L.; Fu, S.; Yin, W.; Zhang, Y.; Chen, Y.; Wang, R.; Zhang, X.; Han, F.; Hu, Z. Microdissection and chromosome painting of the alien chromosome in an addition line of wheat—Thinopyrum intermedium. PLoS ONE 2013, 8, e72564. [Google Scholar] [CrossRef]
- Mahelka, V.; Kopecký, D.; Baum, B. Contrasting patterns of evolution of 45S and 5S rDNA families uncover new aspects in the genome constitution of the agronomically important grass Thinopyrum intermedium (Triticeae). Mol. Biol. Evol. 2013, 30, 2065–2086. [Google Scholar] [CrossRef] [PubMed]
- Wang, R.; Larson, S.; Jensen, K.; Bushman, B.; DeHaan, L.; Wang, S.; Yan, X. Genome evolution of intermediate wheatgrass as revealed by EST-SSR markers developed from its three progenitor diploid species. Genome 2015, 58, 63–70. [Google Scholar] [CrossRef] [PubMed]
- Hu, L.; Li, G.; Zeng, Z.; Chang, Z.; Liu, C.; Zhou, J.; Yang, Z. Molecular cytogenetic identification of a new wheat-Thinopyrum substitution line with stripe rust resistance. Euphytica 2010, 177, 169–177. [Google Scholar] [CrossRef]
- Bao, Y.; Wu, X.; Zhang, C.; Li, X.; He, F.; Qi, X.; Wang, H. Chromosomal constitutions and reactions to powdery mildew and stripe rust of four novel wheat–Thinopyrum intermedium partial amphiploids. J. Genet. Genom. 2014, 41, 663–666. [Google Scholar] [CrossRef]
- Grewal, S.; Yang, C.; Edwards, S.; Scholefield, D.; Ashling, S.; Burridge, A.; King, I.; King, J. Characterization of Thinopyrum bessarabicum chromosomes through genome-wide introgressions into wheat. Theor. Appl. Genet. 2017, 131, 389–406. [Google Scholar] [CrossRef]
- Lang, T.; La, S.; Li, B.; Yu, Z.; Chen, Q.; Li, J.; Yang, E.; Li, G.; Yang, Z. Precise identification of wheat—Thinopyrum intermedium translocation chromosomes carrying resistance to wheat stripe rust in line Z4 and its derived progenies. Genome 2018, 61, 177–185. [Google Scholar] [CrossRef]
- Petersen, G.; Seberg, O. Phylogenetic evidence for excision of Stowaway miniature inverted-repeat transposable elements in Triticeae (Poaceae). Mol. Biol. Evol. 2000, 17, 1589–1596. [Google Scholar] [CrossRef]
- Markova, D.; Mason-Gamer, R. Diversity, abundance, and evolutionary dynamics of Pong-like transposable elements in Triticeae. Mol. Phylogenet. Evol. 2015, 93, 318–330. [Google Scholar] [CrossRef]
- Markova, D.; Mason-Gamer, R. The role of vertical and horizontal transfer in the evolutionary dynamics of PIF-like transposable elements in Triticeae. PLoS ONE 2015, 10, e0137648. [Google Scholar] [CrossRef]
- El Baidouri, M.; Panaud, O. Comparative genomic paleontology across plant kingdom reveals the dynamics of TE-driven genome evolution. Genome Biol. Evol. 2013, 5, 954–965. [Google Scholar] [CrossRef]
- Kalendar, R.; Amenov, A.; Daniyarov, A. Use of retrotransposon-derived genetic markers to analyse genomic variability in plants. Funct. Plant Biol. 2019, 46, 15. [Google Scholar] [CrossRef] [PubMed]
- Divashuk, M.; Khuat, T.; Kroupin, P.; Kirov, I.; Romanov, D.; Kiseleva, A.; Khrustaleva, L.; Alexeev, D.; Zelenin, A.; Klimushina, M.; et al. Variation in copy number of Ty3/Gypsy centromeric retrotransposons in the genomes of Thinopyrum intermedium and its diploid progenitors. PLoS ONE 2016, 11, e0154241. [Google Scholar] [CrossRef] [PubMed]
- Tang, Z.; Yang, Z.; Fu, S.; Yang, M.; Li, G.; Zhang, H.; Tan, F.; Ren, Z. A new long terminal repeat (LTR) sequence allows to identify J genome from JS and St genomes of Thinopyrum intermedium. J. Appl. Genet. 2010, 52, 31–33. [Google Scholar] [CrossRef] [PubMed]
- Zhang, Y.; Fan, C.; Li, S.; Chen, Y.; Wang, R.; Zhang, X.; Han, F.; Hu, Z. The diversity of sequence and chromosomal distribution of new transposable element-related segments in the rye genome revealed by FISH and lineage annotation. Front. Plant Sci. 2017, 8. [Google Scholar] [CrossRef] [PubMed]
- Xie, J.; Huo, N.; Zhou, S.; Wang, Y.; Guo, G.; Deal, K.; Ouyang, S.; Liang, Y.; Wang, Z.; Xiao, L.; et al. Sequencing and comparative analyses of Aegilops tauschii chromosome arm 3DS reveal rapid evolution of Triticeae genomes. J. Genet. Genom. 2017, 44, 51–61. [Google Scholar] [CrossRef] [PubMed]
- Bergman, C.; Quesneville, H.; Anxolabéhère, D.; Ashburner, M. Recurrent insertion and duplication generate networks of transposable element sequences in the Drosophila melanogaster genome. Genome Biol. 2006, 7, 112. [Google Scholar] [CrossRef]
- Wicker, T.; Guyot, R.; Yahiaoui, N.; Keller, B. CACTA Transposons in Triticeae. A diverse family of high-copy repetitive elements. Plant Physiol. 2003, 132, 52–63. [Google Scholar] [CrossRef]
- Han, H.; Liu, W.; Lu, Y.; Zhang, J.; Yang, X.; Li, X.; Hu, Z.; Li, L. Isolation and application of P genome-specific DNA sequences of Agropyron Gaertn. in Triticeae. Planta 2016, 245, 425–437. [Google Scholar] [CrossRef]
- Li, G.; Liu, C.; Wei, P.; Song, X.; Yang, Z. Chromosomal distribution of a new centromeric Ty3/Gypsy retrotransposon sequence in Dasypyrum and related Triticeae species. J. Genet. 2012, 91, 343–348. [Google Scholar] [CrossRef]
- Baruch, O.; Kashkush, K. Analysis of copy-number variation, insertional polymorphism, and methylation status of the tiniest class I (TRIM) and class II (MITE) transposable element families in various rice strains. Plant Cell Rep. 2011, 31, 885–893. [Google Scholar] [CrossRef]
- Wicker, T.; Gundlach, H.; Spannagl, M.; Uauy, C.; Borrill, P.; Ramírez-González, R.; De Oliveira, R.; Mayer, K.; Paux, E.; Choulet, F. Impact of transposable elements on genome structure and evolution in bread wheat. Genome Biol. 2018, 19, 103. [Google Scholar] [CrossRef] [PubMed]
- Vicient, C.; Suoniemi, A.; Anamthawat-Jónsson, K.; Tanskanen, J.; Beharav, A.; Nevo, E.; Schulman, A. Retrotransposon BARE-1 and its role in genome evolution in the genus Hordeum. Plant Cell 1999, 11, 1769–1784. [Google Scholar] [CrossRef] [PubMed]
- Kalendar, R.; Tanskanen, J.; Immonen, S.; Nevo, E.; Schulman, A. Genome evolution of wild barley (Hordeum spontaneum) by BARE-1 retrotransposon dynamics in response to sharp microclimatic divergence. Proc. Natl. Acad. 2000, 97, 6603–6607. [Google Scholar] [CrossRef] [PubMed]
- Soleimani, V.; Baum, B.; Johnson, D. Quantification of the retrotransposon BARE-1 reveals the dynamic nature of the barley genome. Genome 2006, 49, 389–396. [Google Scholar] [CrossRef]
- Wicker, T.; Keller, B. Genome-wide comparative analysis of Copia retrotransposons in Triticeae, rice, and Arabidopsis reveals conserved ancient evolutionary lineages and distinct dynamics of individual Copia families. Genome Res. 2007, 17, 1072–1081. [Google Scholar] [CrossRef]
- Smýkal, P.; Kalendar, R.; Ford, R.; Macas, J.; Griga, M. Evolutionary conserved lineage of Angela-family retrotransposons as a genome-wide microsatellite repeat dispersal agent. Heredity 2009, 103, 157–167. [Google Scholar] [CrossRef]
- Mahelka, V.; Kopecký, D.; Paštová, L. On the genome constitution and evolution of intermediate wheatgrass (Thinopyrum intermedium: Poaceae, Triticeae). BMC Evol. Biol. 2011, 11. [Google Scholar] [CrossRef]
- SanMiguel, P.; Ramakrishna, W.; Bennetzen, J.; Busso, C.; Dubcovsky, J. Transposable Elements, Genes and Recombination in A 215-Kb Contig From Wheat Chromosome 5Am. Func. Integr. Genom. 2002, 2, 70–80. [Google Scholar] [CrossRef]
- Kawaura, K.; Wu, J.; Matsumoto, T.; Kanamori, H.; Kagiri, S.; Ogihara, Y. Genomic analysis of the expressed α/β-gliadin gene region in hexaploid wheat. In Proceedings of the 11th International Gluten Workshop, Beijing, China, 12–15 August 2012; pp. 21–26. [Google Scholar]
- Yang, Z.; Liu, C.; Feng, J.; Li, G.; Zhou, J.; Deng, K.; Ren, Z. Studies on genome relationship and species-specific PCR marker for Dasypyrum breviaristatum in Triticeae. Hereditas 2006, 143, 47–54. [Google Scholar] [CrossRef]
- Li, X.; Lee, B.; Mammadov, A.; Koo, B.; Mott, I.; Wang, R. CAPS markers specific to Eb, Ee, and R Genomes in the tribe Triticeae. Genome 2007, 50, 400–411. [Google Scholar] [CrossRef]
- Monte, J.; Flavell, R.; Gustafson, J. WIS 2-1A: An Ancient Retrotransposon in The Triticeae Tribe. Theor. Appl. Genet. 1995, 91, 367–373. [Google Scholar] [CrossRef] [PubMed]
- Liu, Z.; Li, D.; Zhang, X. Genetic Relationships Among Five Basic Genomes St, E, A, B And D In Triticeae Revealed By Genomic Southern Andin Situhybridization. J. Integrat. Plant Biol. 2007, 49, 1080–1086. [Google Scholar] [CrossRef]
- Wang, R.; Lu, B. Biosystematics and evolutionary relationships of perennial Triticeae species revealed by genomic analyses. J. Syst. Evol. 2014, 52, 697–705. [Google Scholar] [CrossRef]
- He, R.; Chang, Z.; Yang, Z.; Yuan, Z.; Zhan, H.; Zhan, X.; Liu, J. Inheritance and mapping of powdery mildew resistance gene Pm43 introgressed from Thinopyrum intermedium into wheat. Theor. Appl. Genet. 2009, 118, 1173–1180. [Google Scholar] [CrossRef] [PubMed]
- Bento, M.; Pereira, H.; Rocheta, M.; Gustafson, P.; Viegas, W.; Silva, M. Polyploidization As A Retraction Force in Plant Genome Evolution: Sequence Rearrangements in Triticale. PLoS ONE 2008, 3, e1402. [Google Scholar] [CrossRef] [PubMed]
- Parisod, C.; Salmon, A.; Zerjal, T.; Tenaillon, M.; Grandbastien, M.; Ainouche, M. Rapid structural and epigenetic reorganization near transposable elements in hybrid and allopolyploid genomes in Spartina. New Phytol. 2009, 184, 1003–1015. [Google Scholar] [CrossRef]
- Kroupin, P.Y.; Divashuk, M.G.; Karlov, G.I. Gene resources of perennial wild cereals involved in breeding to improve wheat crop (review). Sel’skokhozyaistvennaya Biol. 2019, 54, 409–425. [Google Scholar] [CrossRef]
- Bernatzky, R.; Tanksley, S. Toward a saturated linkage map in tomato based on isozyme and random cDNA sequences. Genetics 1986, 112, 887–898. [Google Scholar]
- LightCycler. Relative Quantification. Roche Applied Science Technical Note No. LC 13/2001. Available online: https://www.gene-quantification.de/roche-rel-quant.pdf (accessed on 18 December 2019).
- Pfaffl, M. A new mathematical model for relative quantification in real-time RT-PCR. Nucleic Acids Res. 2001, 29. [Google Scholar] [CrossRef]
- qPCR Hand Calculations. University of Puget Sound. Available online: https://studylib.net/doc/18190297/qpcr-hand-calculations---university-of-puget-sound (accessed on 10 March 2019).


© 2019 by the authors. Licensee MDPI, Basel, Switzerland. This article is an open access article distributed under the terms and conditions of the Creative Commons Attribution (CC BY) license (http://creativecommons.org/licenses/by/4.0/).
Share and Cite
Divashuk, M.G.; Karlov, G.I.; Kroupin, P.Y. Copy Number Variation of Transposable Elements in Thinopyrum intermedium and Its Diploid Relative Species. Plants 2020, 9, 15. https://doi.org/10.3390/plants9010015
Divashuk MG, Karlov GI, Kroupin PY. Copy Number Variation of Transposable Elements in Thinopyrum intermedium and Its Diploid Relative Species. Plants. 2020; 9(1):15. https://doi.org/10.3390/plants9010015
Chicago/Turabian StyleDivashuk, Mikhail G., Gennady I. Karlov, and Pavel Yu. Kroupin. 2020. "Copy Number Variation of Transposable Elements in Thinopyrum intermedium and Its Diploid Relative Species" Plants 9, no. 1: 15. https://doi.org/10.3390/plants9010015
APA StyleDivashuk, M. G., Karlov, G. I., & Kroupin, P. Y. (2020). Copy Number Variation of Transposable Elements in Thinopyrum intermedium and Its Diploid Relative Species. Plants, 9(1), 15. https://doi.org/10.3390/plants9010015