Article

Strigolactone Signaling Genes Showing Differential Expression Patterns in Arabidopsis max Mutants

1
Department of Bioindustry and Bioresource Engineering, Plant Engineering Research Institute, Sejong University, Seoul 05006, Korea
2
Department of Biosciences and Bioinformatics, Myongji University, Yongin 17058, Korea
3
Department of Molecular Genetic Biotechnology, Dong-A University, Busan 49315, Korea
4
Department of Life Sciences, Sogang University, Seoul 04107, Korea
*
Author to whom correspondence should be addressed.
Plants 2019, 8(9), 352; https://doi.org/10.3390/plants8090352
Submission received: 22 July 2019 / Revised: 9 September 2019 / Accepted: 16 September 2019 / Published: 19 September 2019

Abstract

:
Strigolactone (SL) is a recently discovered class of phytohormone that inhibits shoot branching. The molecular mechanism underlying SL biosynthesis, perception, and signal transduction is vital to the plant branching phenotype. Some aspects of their biosynthesis, perception, and signaling include the role of four MORE AXILLARY GROWTH genes, MAX3, MAX4, MAX1, and MAX2. It is important to identify downstream genes that are involved in SL signaling. To achieve this, we studied the genomic aspects of the strigolactone biosynthesis pathway using microarray analysis of four max mutants. We identified SL signaling candidate genes that showed differential expression patterns in max mutants. More specifically, 1-AMINOCYCLOPROPANE-1-CARBOXYLATE SYNTHASE 4 (ACC4) and PROTEIN KINASE 3 (PKS3) displayed contrasting expression patterns, indicating a regulatory mechanism in SL signaling pathway to control different phenotypes apart from branching phenotype.

Graphical Abstract

1. Introduction

Strigolactones (SLs) are known for stimulating seed germination in species of the genera Orobanche, Phelipanche, and Striga [1,2,3]. Thus, the release of SLs from roots into the rhizosphere under nutrient-deprived conditions is the first response for the symbiotic association with host arbuscular mycorrhizal fungi to boost its capacity to uptake sugars, minerals, and water [1,4]. This process validates the importance of SLs in root exudates as a chemical signal that initiates germination and induces branching to promote the pre-symbiotic growth of these fungi for access to phosphorus, water, and other minerals, and in return provides photosynthetic products [1,5,6,7]. During phosphate starvation, plants release a large amount of SLs [8,9].
Recently, the discovery of several high branching mutants in Arabidopsis, rice, and pea revealed SL’s role as a carotenoid-derived plant hormone that predominantly regulates axillary shoot branching in an auxin-dependent manner [10,11]. In Arabidopsis thaliana, pea, tomato, and petunia, SLs are reportedly involved in other developmental processes, such as lateral root formation, primary root growth, root hair elongation, secondary growth in the stem, senescence, adventitious root formation, and determining root architecture by inhibiting the growth of primary roots [12,13,14,15,16,17,18,19,20]. According to recently published reports, SLs are also involved in the plant response to abiotic stress [21,22,23,24,25,26].
SLs as derivatives of carotenoids and can be divided into two groups: oxygen-free carotene (for example, β-carotene) and oxygen-containing xanthophyll (for example, lutein) [27,28,29]. Carotenoids differ in their isomeric states by their double bond; be they cis- or trans-configured carotenoids. The plant can synthesize and accumulate both forms as an intermediate of the precursor of a pathway (for example, SLs) [25,28,30]. Oxidative cleavage of a double bond in the isomeric form of carotenoids initiates the synthesis of SLs [31].
Genes involved in the SL signaling pathway were identified once it was known that a deficiency of SLs leads to more a branching phenotype in pea, Arabidopsis and, rice mutant [22,25]. In Arabidopsis thaliana, carotenoid dioxygenases MORE AXILLARY GROWTH3 (MAX3; AtCCD7), MAX4 (AtCCD8), and cytochrome P450 MAX1 (AtCyp711A1) are reported to be involved in the biosynthesis of branch inhibiting signal [16,19,32,33,34,35,36,37], whereas the F-box and Leu-rich repeats containing MAX2 protein probably act either in signal transduction or perception [35,37,38]. All max mutants display increased numbers of shoot branches, and this mutant phenotype can be rescued in a MAX2-dependent manner by the external application of the synthetic strigolactone analog GR24 [10,11,19].
In this study, we investigated downstream genes that responded or regulated the strigolactone pathway using a microarray in four Arabidopsis max mutants; max3, max4, max1, and max2. We found that 34.1% of the total genes were differentially expressed; among them, 18.7% were up-regulated, and 15.4% were down-regulated. Most of the genes are involved in different development processes, such as epidermal cell differentiation, xyloglucan metabolic process, dormancy process, response to stimulus, and nucleobase transport. Expression analysis of max mutants also revealed plant development-related downstream genes (ACC4, PKS3, LRX1, and LAX1) in SL signaling.

2. Results and Discussion

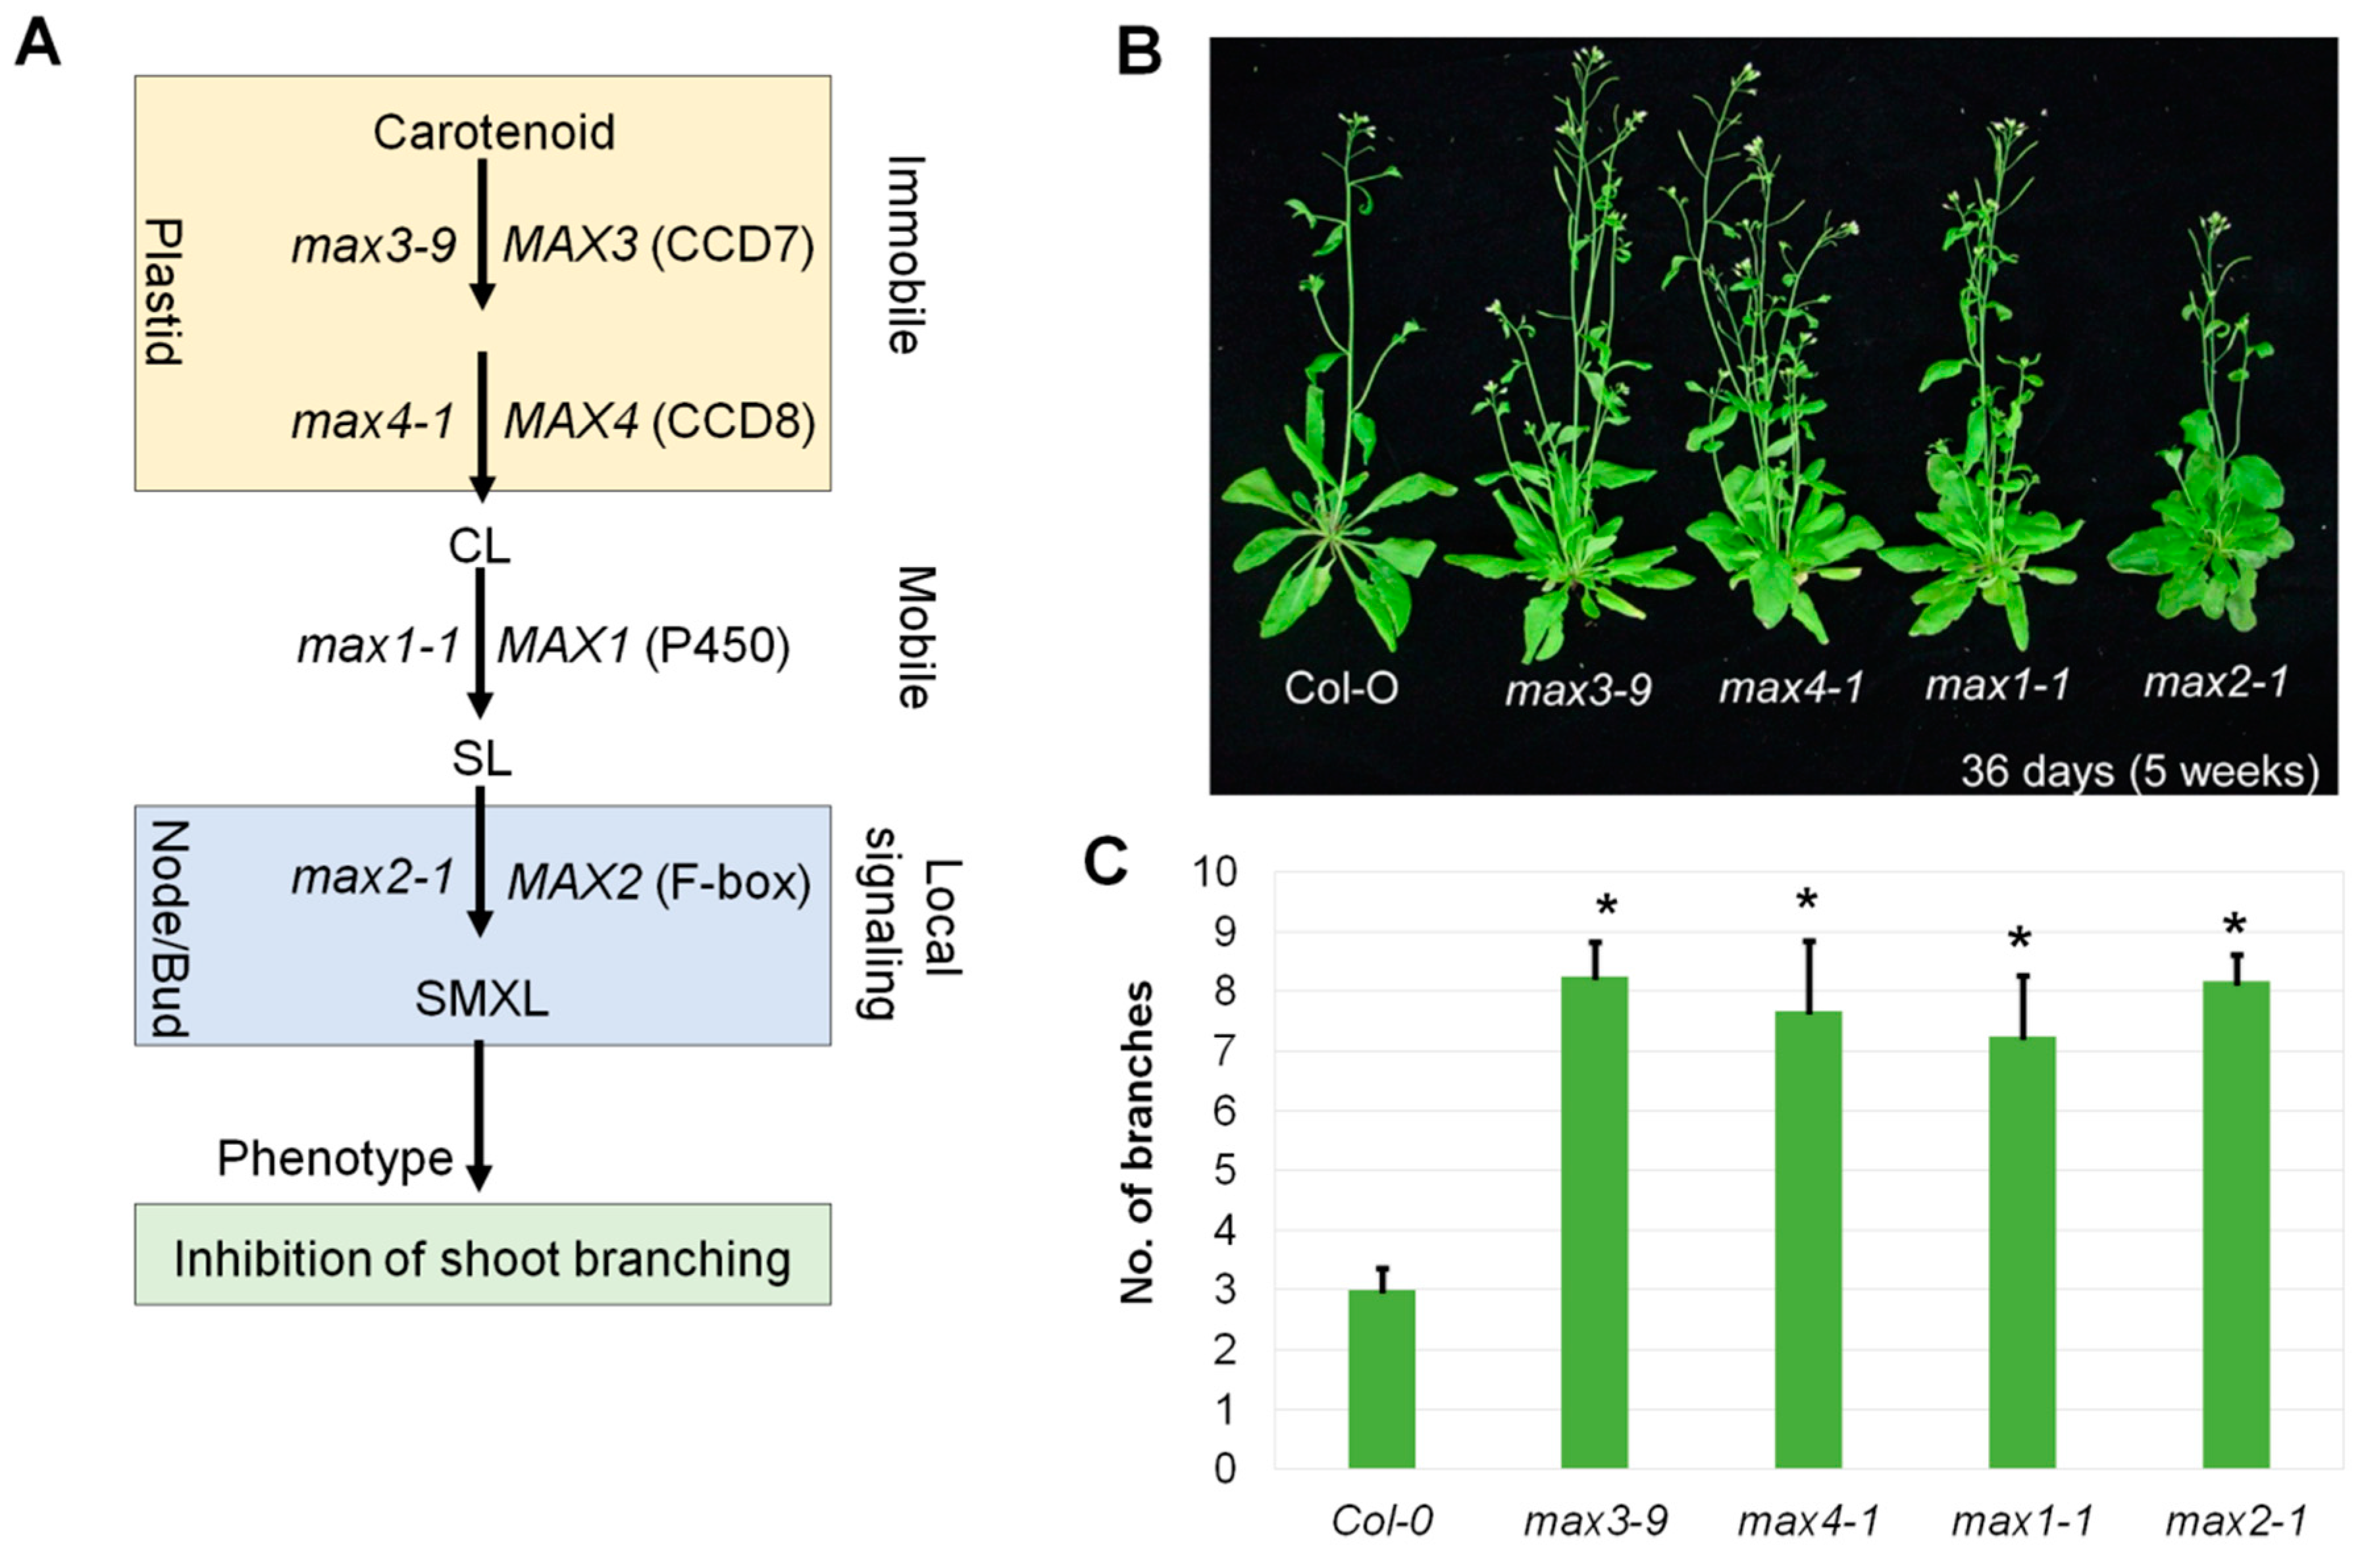
2.1. The Branched Phenotype of max Mutants and Strigolactone Signaling

The SL signaling pathway is one of the important pathways that determine branch phenotype along with other phenotypes in plants (Figure 1A). Genes involved in SL signaling were identified based on more branching phenotypes in Arabidopsis, pea, and rice mutant [22,25]. In Arabidopsis, four MAX genes are involved in the SL pathway. These genes translate into functional protein enzymes, such as CCD7 (MAX3), CCD8 (MAX4), P450 (MAX1), and F-box (MAX2) [16,34,35,39]. Their mutants (max3-9, max4-1, max1-1, and max2-1) have more branch phenotypes (Figure 1B,C), as shown in previous studies [16,34,37,39]. The high branched phenotype of the max mutant can be rescued by application of an extremal analogue of SL (synthetic strigolactone), GR24, except for the max2 phenotype [10,11]. DWARF27 is an iron-containing protein that is required for the biosynthesis of SLs, and it regulates rice tiller bud outgrowth [40]. It also catalyzes all trans/9-cis to isomerization of β-carotene [31,41]. CCD7 cleaves 9-cis-β-carotene into the volatile compounds β-ionone and 9-cis-β-apo-10′-carotenal [31,42]. CCD8 converts 9-cis-β-apo-10′-carotenal into carlactone that resembles SLs in the number of C-atoms [31]. The Arabidopsis MAX1 enzyme, P450 converts carlactone into intermediate methylated carlactonoic acid that binds to the SL receptor α/β-hydrolase D14 [43]. Methylated carlactonoic acid is hydroxylated by lateral branching oxidoreductase (LBO) into a yet unidentified compound [44]. F-box protein MAX2 interacts with α/β-hydrolase D14 and mediates SL signaling by directing its targeted proteins, such as SUPPRESSOR OF MORE AXILLARY GROWTH2-LIKE6 (SMXL6), SMXL7, and SMXL8 to proteasomal degradation [13,45]. It would be interesting to see the common differentially expressed genes in max mutants to understand the downstream genes of the SL signaling pathway.

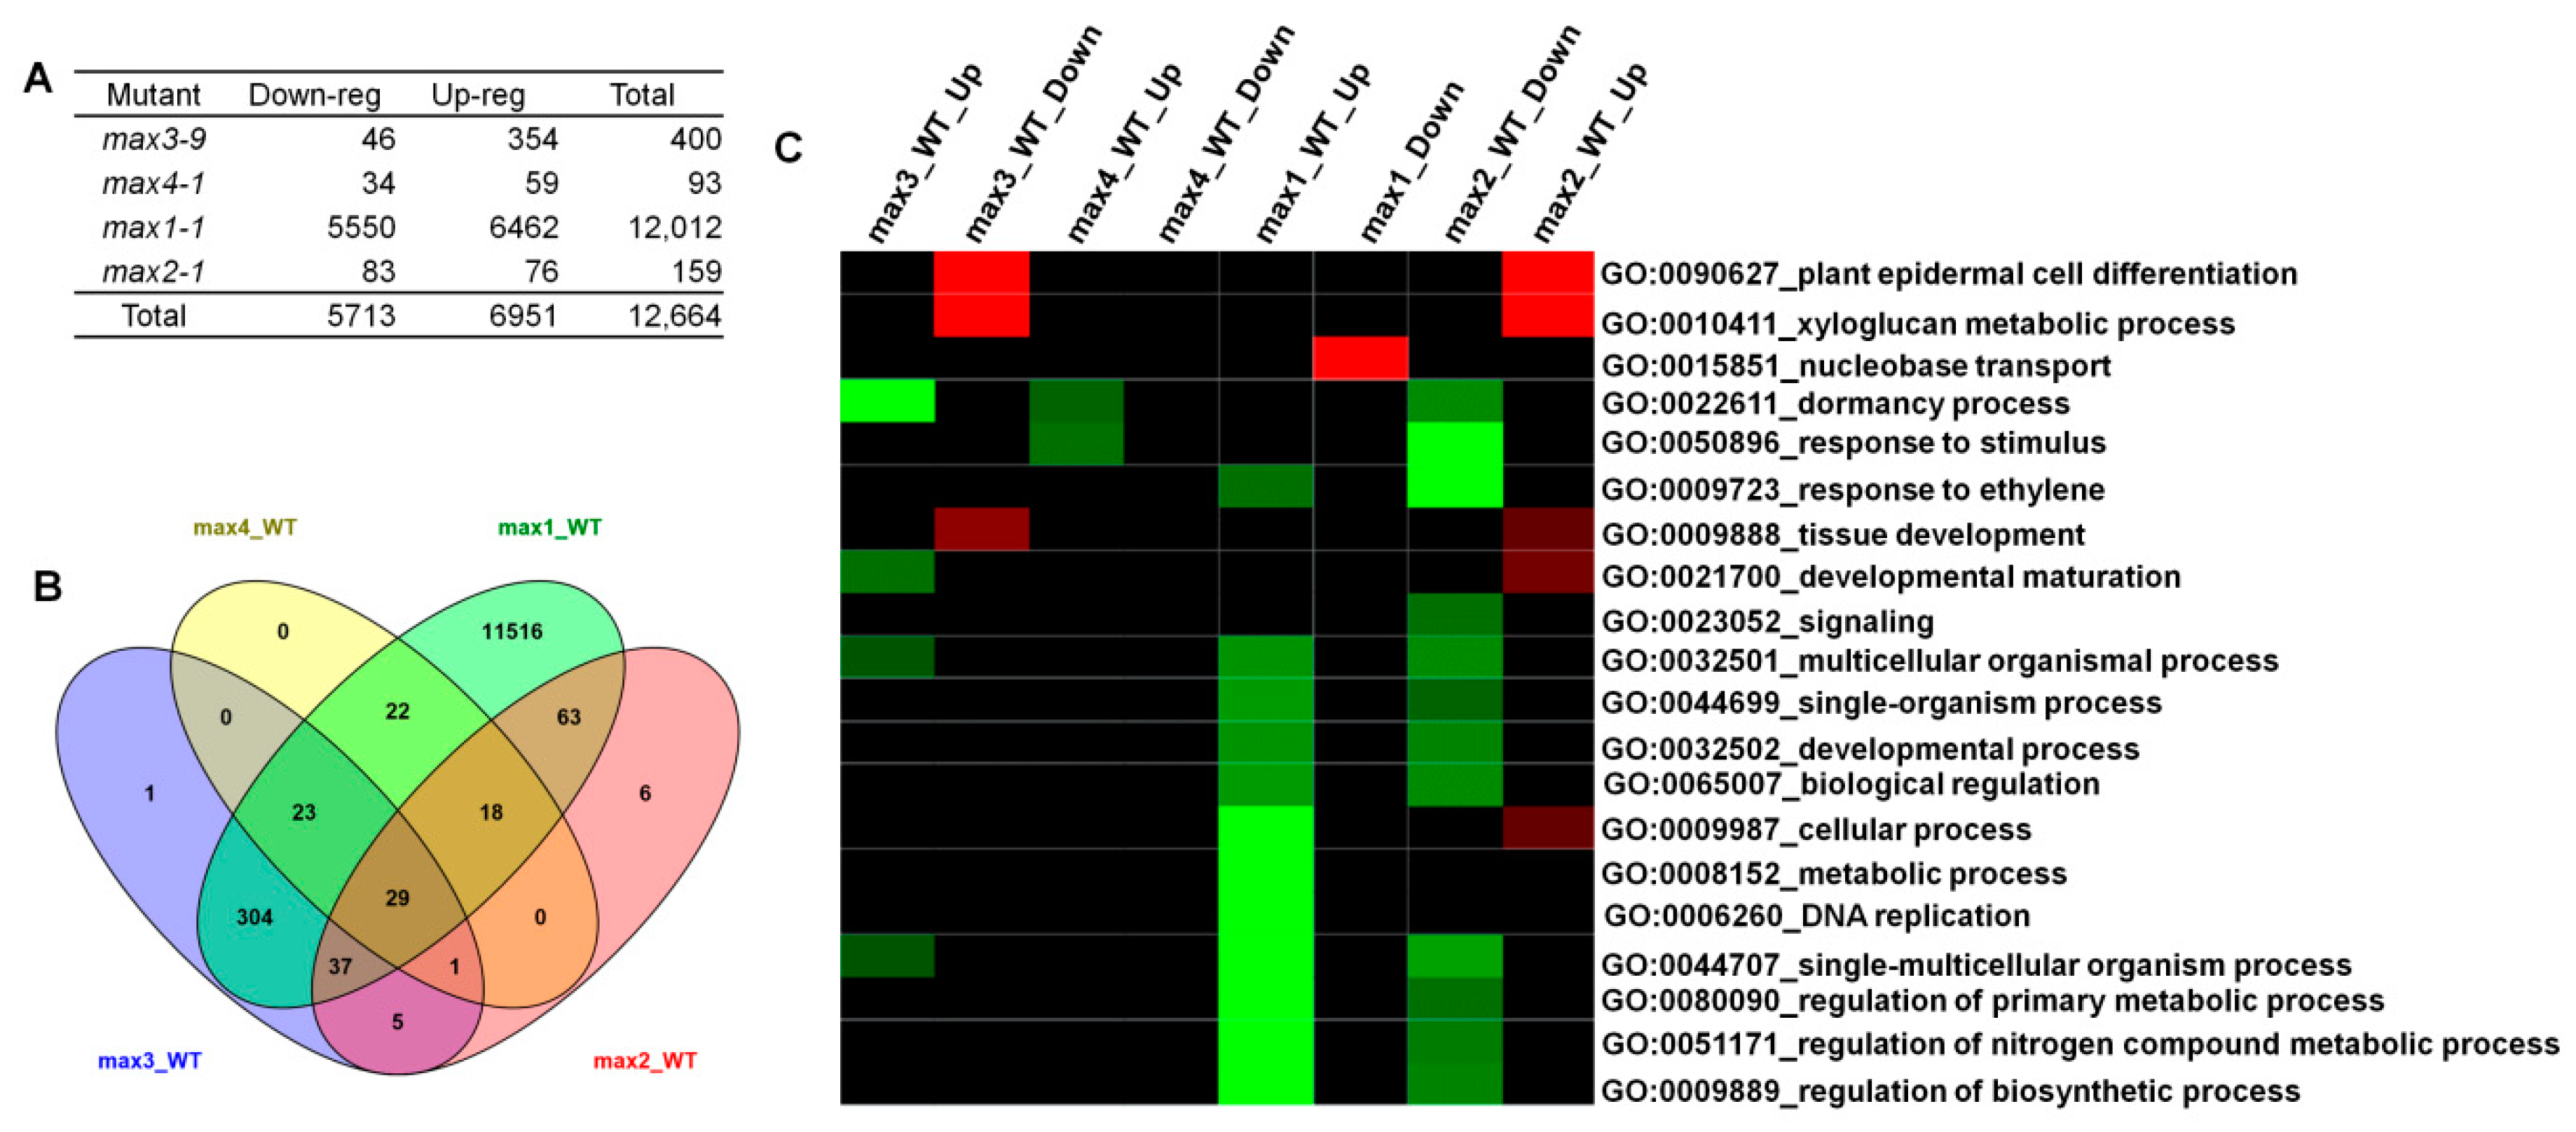
2.2. Microarray Analysis Revealed Differentially Expressed Genes (DEGs) in max Mutants and the Role of Those Genes in the Biological Process

Transcriptomic analysis was performed on four max mutant plants and compared with wild-type plants, using the Roche NimbleGen microarray system [46]. The experiment was performed on each independent biological sample. Preprocessed data were exported to the Limma package in R language [47]. An adjusted P-value was estimated using empirical Bayesian statistics implemented using eBayes. Significant DEGs were identified as those with log2 FC (fold-change) > 1 for up-regulation and log2 FC (fold-change) < –1 for down-regulation with an adjusted p-value < 0.05. Five comparisons were performed with: wild type-control versus wild type-control to normalize the expression within the control group; max1, max2, max3, and max4 mutants versus wild-type to determine differentially expressed transcripts in the max mutants (Figure S1). Among the 39,042 genes identified in the NimbleGen array, 12,664 genes were differentially expressed (with p-value < 0.05) in the max mutants versus wild-type control comparison, corresponding to 34.1% of the total genes (Figure S1; Table S2). It is comprised of 6951 (18.7%) up-regulated genes and 5713 (15.4%) down-regulated genes (Figure 2A). In the max3-9 mutant, a total of 400 genes were differentially expressed, and among those genes, 46 were down-regulated, and 354 were up-regulated. In the max4-1 mutant, a total of 93 genes were differentially expressed, and among those genes, 34 were down-regulated, and 59 were up-regulated. Surprisingly in the max1-1 mutant, total 12,012 genes were differentially expressed, and among those genes 5550 were down-regulated, and 6462 were up-regulated (Figure 2A). The reason for a large number of genes differentially expressed in max1 mutant might be due to the accumulation of a large amount of carlactone (CL) [48]. Since CL acts as a signal molecule, it might invoke the expression of many genes [43]. Finally, in the max2-1 mutant, a total of 159 genes were differentially expressed, and among those genes, 83 were down-regulated, and 76 were up-regulated (Figure 2A). Venn diagram explains commonly expressed genes between mutant lines (Figure 2B). Twenty-nine genes were commonly expressed in all four mutants (Table S3). Sixty-three genes were commonly expressed between max1 and max2 mutants (Table S4). Five genes were commonly expressed in the max3 and max2 mutants (Table S5). Three-hundred-and-four genes were commonly expressed in the max3 and max1 mutants (Table S6). Twenty-two genes were commonly expressed in the max4 and max1 mutants (Table S7). In max3, max1, and max2 mutants, the number of genes differentially expressed were 1, 11, 516, and 5, respectively (Tables S8–S10). The max4 mutant did not show any max4-specific differentially expressed genes (Figure 2B).
Differentially down- or up-regulated genes enriched in GO terms were functionally classified in the max mutants (Figure 2C). Terms containing up-regulated genes in max3 were GO:0090627 (plant epidermal cell differentiation) and GO:0010411 (xyloglucan metabolic process). GO:0022611 (dormancy process) displayed significantly down-regulated genes. Marginally down-regulated genes were found in max4 and are associated with GO:0022611 (dormancy process) and GO:0050896 (response to stimulus). In max1, GO:0015851 (nucleobase transport) was significantly enriched while many genes were significantly down-regulated in GO terms. In max2, enrichment was the same as max3, and many biological terms were down-regulated, but the degree of extent was less than those of max1.

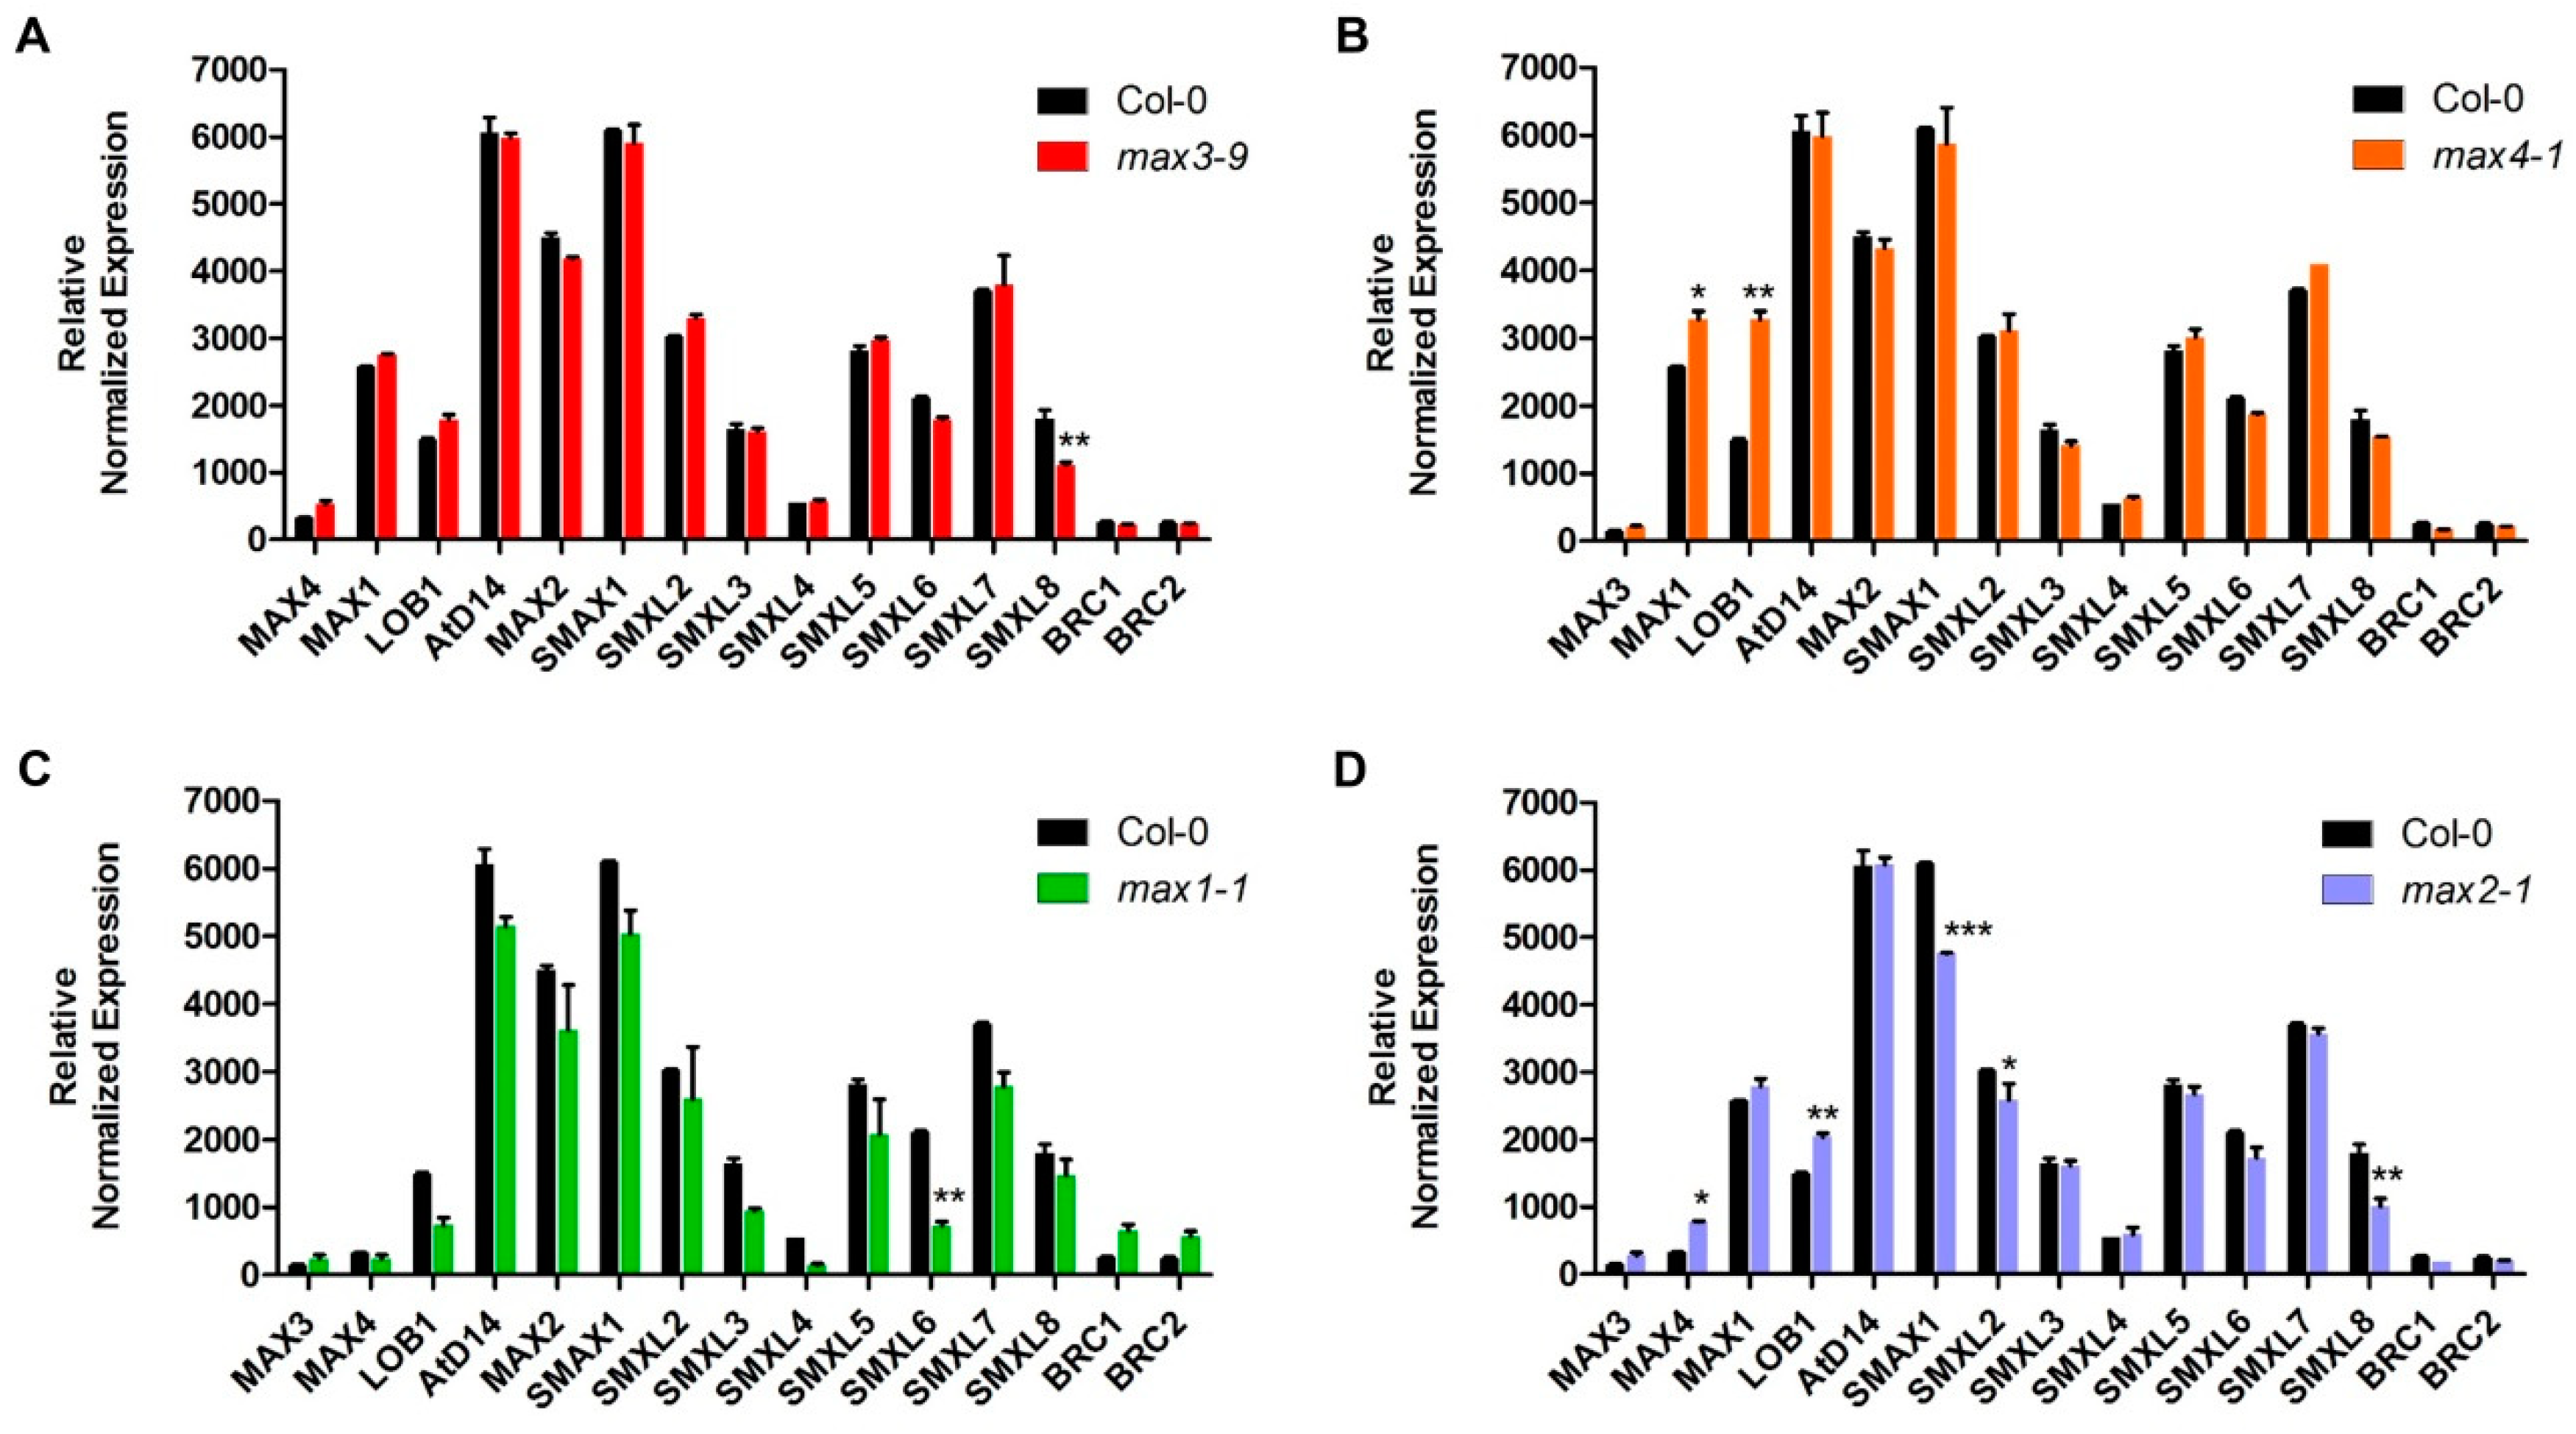
2.3. Strigolactone Metabolism-Related Genes Showed Differential Expression Pattern in the max Mutant

A close look at the expression levels of known SLs biosynthesis and signaling related genes in max mutant plants revealed a more significant role of MAX2 (Figure 3). The expression of most of the SLs signaling related genes were induced or repressed in the max2 mutant (Figure 3D). There was some exception in other max mutants where few SL signaling-related genes showed differential expression patterns, such as repression of SUPPRESSOR OF MAX2 LIKE 8 (SMXL8) in the max3 mutant, increased expression of MAX1 and LOB1 in the max4 mutant, and repression of SUPPRESSOR OF MAX2 LIKE 6 (SMXL6) in the max1 mutant. However, it was the max2 mutant that showed significant differential expression of the SLs signaling related genes. LATERAL ORGAN BOUNDARIES (LOB1) negatively regulates brassinosteroid accumulation to limit growth in organ boundaries [49]. LOB1 expression was up-regulated in all max mutants except max1. It might be due to the absence of MAX genes; there is no controlled regulation of LOB1 for the growth limit. In our analysis, SUPPRESSOR OF MAX2 1 (SMAX1), SMAX-LIKE2 (SMXL2) and SMAX-LIKE8 (SMXL8) expressions were significantly down-regulated in the max2 mutant, which makes sense since there is no MAX2 in the mutant and SMAXLs may not be able to be regulated by MAX2. This result is in correlation with the previously published result where increased branching phenotype of max2 rescued in the line where SMAX1, SMXL2, and SMXL8 were constitutively targeted by artificial microRNAs [50].

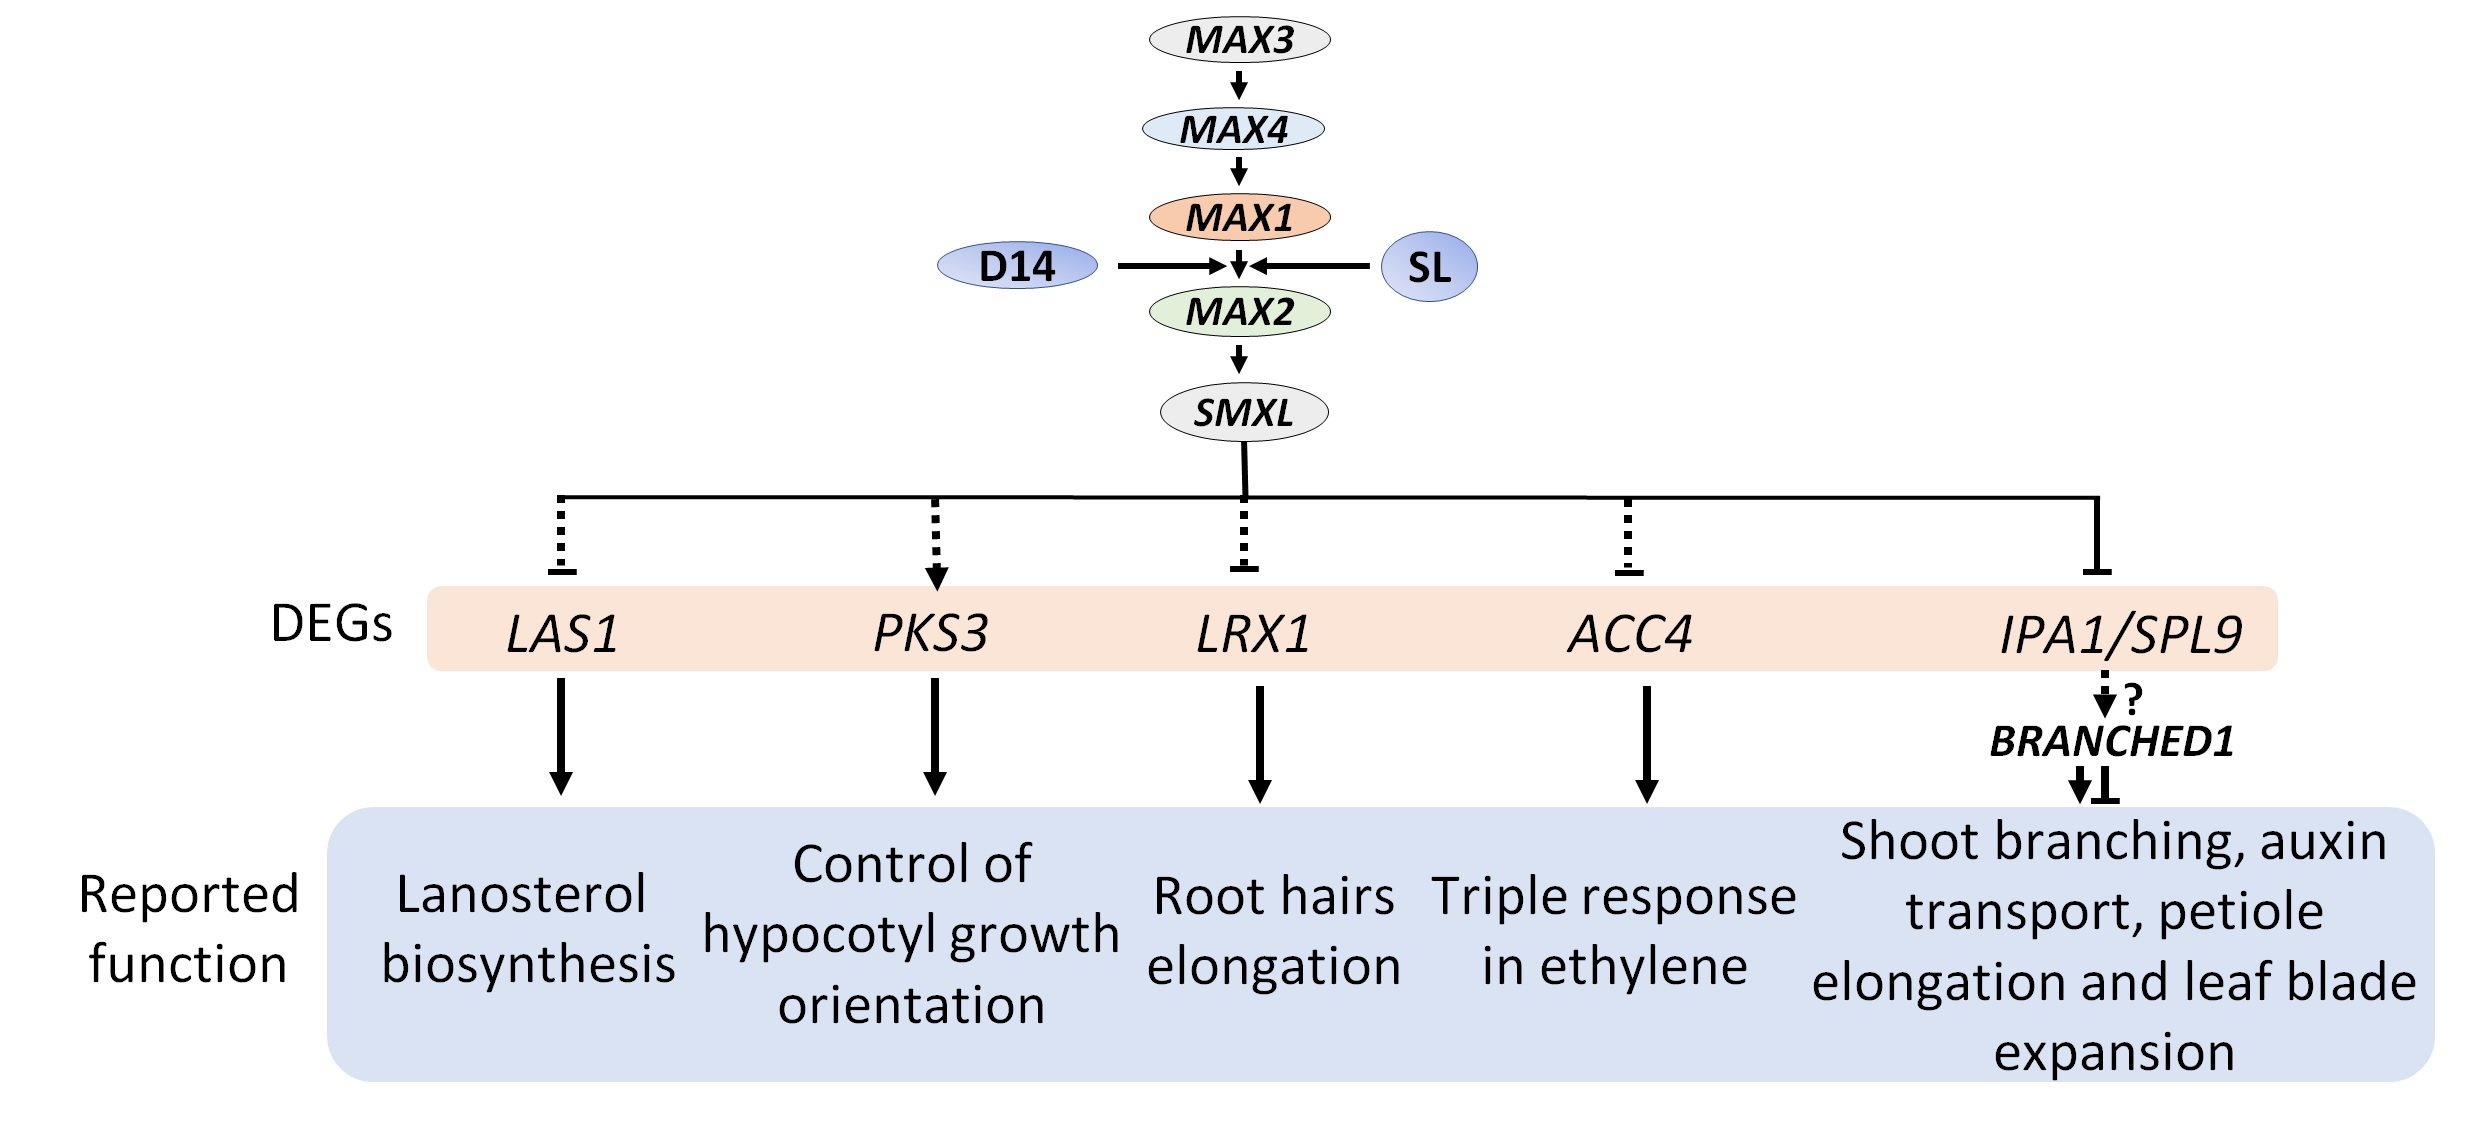
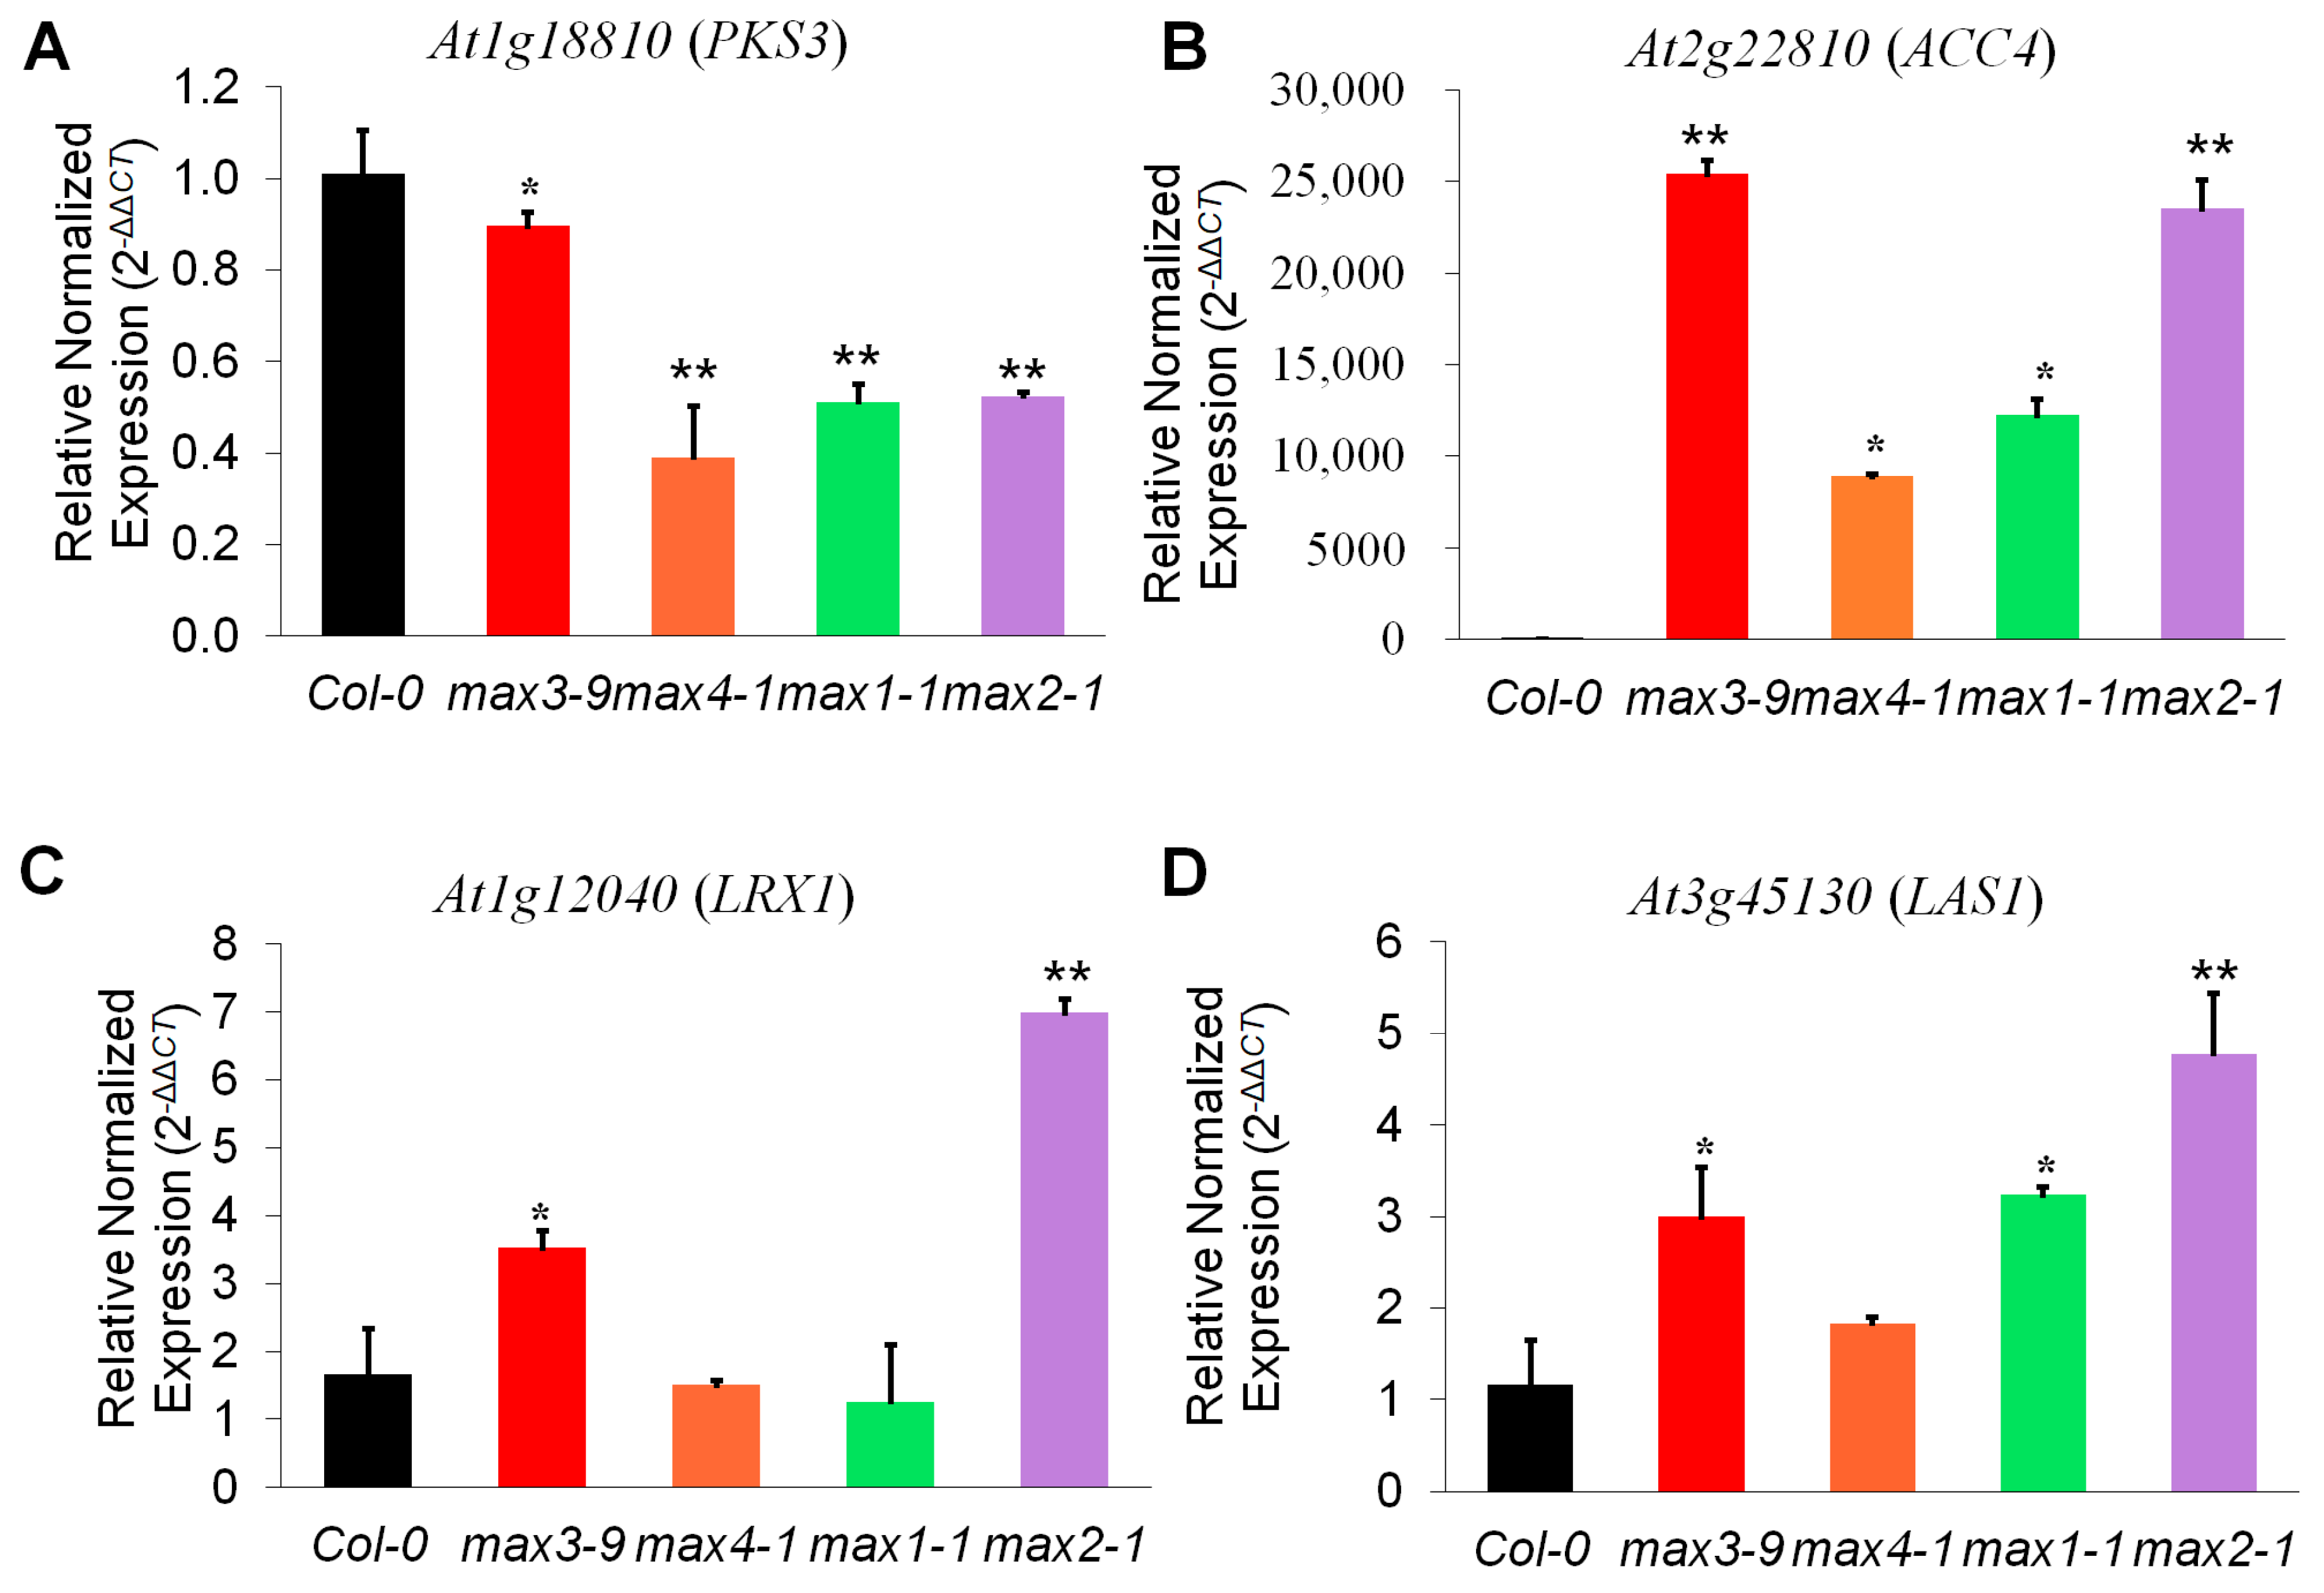
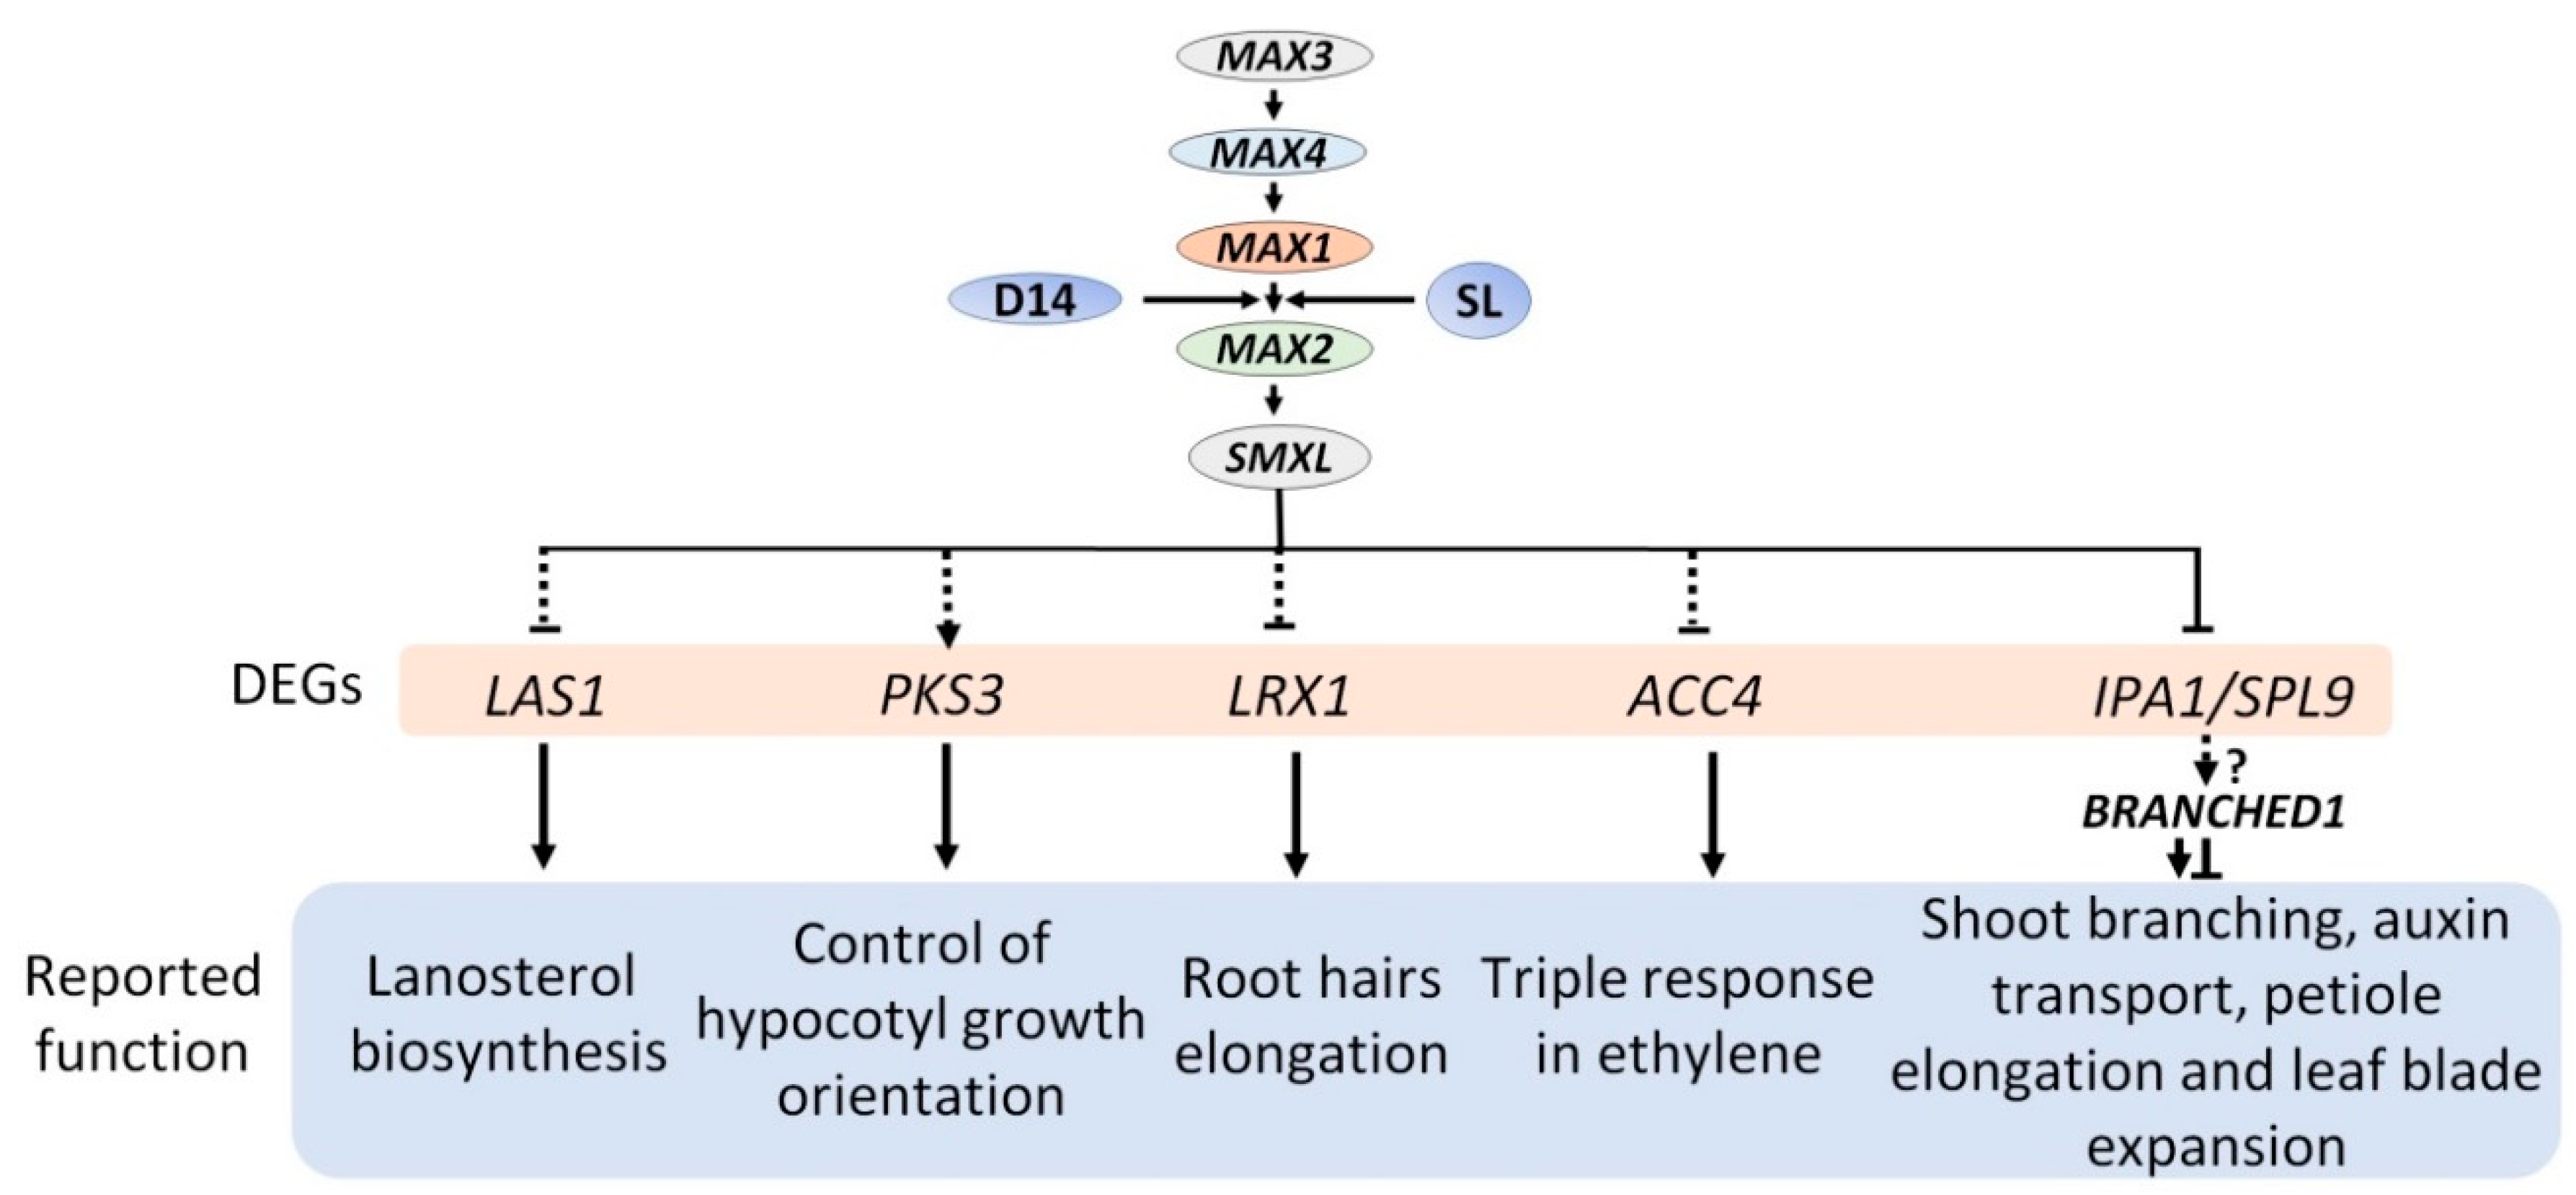
2.4. Expression Analysis Revealed Candidate Genes Involved in Downstream SL Pathway

We focused on the highly differentially regulated genes in the max mutant, and we narrowed down to four genes. For the validation of microarray data, real-time PCR analysis was performed, and specific primers were designed for it (Table S1). Three genes, namely, 1-AMINOCYCLOPROPANE-1-CARBOXYLATE SYNTHASE 4 (ACC4), LEUCINE-RICH REPEAT/EXTENSIN 1 (LRX1), and LANOSTEROL SYNTHASE 1 (LAS1) gene, showed induced expression, whereas one gene, PROTEIN KINASE 3 (PKS3) expression was down-regulated in the max mutant (Figure 4). These genes reportedly played a different set of role such as the expression of the ACC4, a key regulatory enzyme in the biosynthesis of the plant hormone ethylene repressed by ABA INSENSITIVE4 (ABI4) by directly binding to their promoters [51]. Additionally, atacc4 showed reduced branching, increased plant height, and hypocotyl length, which is precisely antagonistic to the phenotype of max mutant [52,53,54]. It also explains the cooperation between strigolactone signaling and ACC4. For root hair elongation in Arabidopsis, it is also reported that ethylene interacts with strigolactone [15]. PKS3 is a phytochrome kinase substrate-like protein related to control of hypocotyl growth orientation [55], and max2 hypocotyls were also more elongated compared with wild-type [56]. It indicated that to control hypocotyl growth, and there is some working mechanism going on between SL signaling and PKS3. Similarly, lrx1 have short root hair and might be regulated by MAX2 since its expression is high in max2 [57]. LAS1 is involved in the lanosterol biosynthesis, but las1 mutant did not display any phenotype [58,59]. There is no report of any relation between LAS1 and MAX. It is the first time we have reported that expression of LAS1 increase in max mutant and further study needed to confirm if LAS1 is functionally involved in SL signaling. Based on our findings, we proposed a MAX dependent model (Figure 5).

3. Materials and Methods

3.1. Plant Materials and Growth Conditions

Arabidopsis thaliana used in this study included the wild-type Columbia (Col-0) ecotype and mutants: max3-9 [34], max4-1 [16], max1-1 and max2-1 [37]. Arabidopsis seeds were sterilized and vernalized at 4 °C for 3 d in the dark. It is germinated on 1/2 Murashige and Skoog (MS) medium containing 0.7% (w/v) agar and 1.0% (w/v) sucrose. For phenotypical observations, 12-d-old seedlings transferred to soil in small pots. Arabidopsis plants were grown for five weeks under a 16-h-light/8-h-dark cycle with a light intensity of 60 to 80 µE m–2 s–1 at ~21 °C [60].

3.2. Microarray Hybridization and Data Analysis

The 135k microarray was prepared from 39,042 genes (TAIR v.9). Four, sixty-nt long probes per gene were outlined. NimbleGen Inc. (Madison, WI, USA) manufactured the microarray (http://www.nimblegen.com/). Random 40,000 GC probes were included to assist with overlaying the grid on the image for the monitoring of the hybridization efficiency and four corner fiducial controls (225). We repeated the experiment 3 times and independently prepared total RNA from the leaf of the mature plant for the reproducibility of microarray analysis [61]. Ten micrograms of Cy3-labeled target DNA fragments were used for microarray hybridization. For hybridization, an MAUI chamber (Biomicro, Salt Lake, UT, USA) was used at 42 °C for 16–18 h. The data were processed and normalized by cubic spline normalization using quantiles to adjust signal variations between chips [62]. For producing call files, a probe-level summarization by Robust Multi-Chip Analysis (RMA) using a median polish algorithm was implemented in NimbleScan. Limma package in the R computing environment was used for multiple analysis [47]. Genes having p-value below 0.05 or false discovery were collected. Multivariate statistical tests such as clustering, multidimensional scaling, and principal component analysis were performed by Acuity 3.1 (Axon Instruments, Union City, CA, USA) [63].
Biological term enrichment was assessed using GoMinerTM [64], as described previously [65]. The microarray contained 39,042 genes; these genes were used as the total gene set in GoMiner. Among the 39,042 genes, 545 were associated with biological processes, 96 with molecular functions, and 68 with cellular components. Top terms in each clad were selected to reduce redundancy, and hierarchical clustering was performed with the Bioconductor R package 3.9 (http://master.bioconductor.org/). GO terms with FDR values less than 0.05 were considered as significant. For color presentation, up-regulated terms were scaled 0.5 to 5 and indicated as red code in Figure 2C. Similarly, down-regulated terms were scaled –0.5 to –5 and indicated as blue code [66]. Other non-significant FDR values were transformed to 0 with Perl scripting language [65].

3.3. Quantitative Real-Time RT-PCR Analysis

Total RNA from plant leaf was isolated using the RNAeasy Mini Kit—Qiagen (Hilden, Germany). Isolated RNA was treated with DNAse I (Takara Bio, Shiga, Japan) to avoid contamination with genomic DNA. RNA was reverse transcribed using a Reverse Transcription kit (Takara Bio, Shiga, Japan). Two micrograms of RNA were used for cDNA synthesis according to manual instructions. Ten-fold diluted cDNA was used as a template for real-time quantitative PCR using SYBR Mix (Roche Diagnostics). Gene-specific forward and reverse primers were used, five µM of each. Gene-specific qRT-PCR primers were designed using NCBI primer blast tool and synthesized (Bioneer, Daejeon, Korea). The primers are listed in Supplementary Table S1. The genes were amplified using a StepOnePlus Real-Time PCR System (Applied Biosystems, Foster City, CA, USA). For normalizing expression levels of a constitutively expressed gene, EIF4A1 was used as a reference gene. The thermal profile used consisted of an initial denaturation step at 95 °C for 5 min, followed by 40 cycles of 95 °C for 10 s, annealing for 15 s, and 72 °C for 15 s followed by one cycle of 95 °C for 10 s.

4. Conclusions

SL signaling-related knowledge has been rapidly increasing. Recently, a study indicated that a transcription factor, IDEAL PLANT ARCHITECTURE1 (IPA1), is directly involved to SL signaling and regulates shoot branching [67] (Figure 5). However, this pathway still lacks basic answer, particularly, the molecular mechanism which identifies its downstream genes, and those genes are the direct or indirect target. Our study identifies DEGs that may act downstream of the SL signaling network for various functions.

Supplementary Materials

The following are available online at https://www.mdpi.com/2223-7747/8/9/352/s1, Figure S1: Comparison of signal distribution between biological repeats of samples, Figure S2: Hierarchical clustering of significantly changed genes of expression max mutants compared with wild-type and the log2 ratio used for normalizing the expression difference, Table S1: List of primers used in this study for qRT-PCR analysis, Table S2: The list of the genes that significantly increased or decreased in max mutants compared to wild-type, Table S3: Commonly expresses genes in max3, max4, max1, and max2, Table S4: Commonly expressed genes in max1 and max2, Table S5: Commonly expressed genes in max3 and max2, Table S6: Commonly expressed genes in max3 and max1, Table S7: Commonly expressed genes in max4 and max1, Table S8: A list of max3-specific changed gene, Table S9: A list of max1-specific changed genes, Table S10: A list of max2-specific changed genes.

Author Contributions

M.K., I.K., J.B.H., M.C.S., and H.U.K. conducted the experiment; M.K., Y.-Y.K., and H.U.K. analyzed the data; M.K. and H.U.K. wrote the manuscript.

Acknowledgments

This work was supported by the Next Generation BioGreen 21 Program of the Rural Development Administration, Korea (SSAC, grant number PJ013185); the Korea Institute of Planning and Evaluation for Technology in Food, Agriculture, Forestry, and Fisheries (IPET) [grant numbers 316087-4]; and the Mid-Career Researcher Program of the National Research Foundation of Korea [grant number NRF-2017R1A2B4007096].

Conflicts of Interest

The authors declare no conflict of interest.

Abbreviations

CCD7CAROTENOID CLEAVAGE DIOXYGENASE 7
CCD8CAROTENOID CLEAVAGE DIOXYGENASE 8
SLSTRIGOLACTONE
IPA1IDEAL PLANT ARCHITECTURE 1
ABI4ABA INSENSITIVE 4
ACC4AMINOCYCLOPROPANE-1-CARBOXYLATE SYNTHASE 4
LRX1LEUCINE-RICH REPEAT/EXTENSIN 1
LAS1LANOSTEROL SYNTHASE 1
PKS3PROTEIN KINASE 3
GOGENE ONTOLOGY

References

  1. Xie, X.; Yoneyama, K.; Yoneyama, K. The strigolactone story. Annu. Rev. Phytopathol. 2010, 48, 93–117. [Google Scholar] [CrossRef] [PubMed]
  2. Cook, C.E.; Whichard, L.P.; Turner, B.; Wall, M.E.; Egley, G.H. Germination of Witchweed (Striga lutea Lour.): Isolation and Properties of a Potent Stimulant. Science 1966, 154, 1189–1190. [Google Scholar] [CrossRef] [PubMed]
  3. Bouwmeester, H.J.; Matusova, R.; Zhongkui, S.; Beale, M.H. Secondary metabolite signalling in host-parasitic plant interactions. Curr. Opin. Plant Biol. 2003, 6, 358–364. [Google Scholar] [CrossRef]
  4. Cheng, X.; Ruyter-Spira, C.; Bouwmeester, H. The interaction between strigolactones and other plant hormones in the regulation of plant development. Front. Plant Sci. 2013, 4. [Google Scholar] [CrossRef] [PubMed]
  5. Gutjahr, C.; Parniske, M. Cell and developmental biology of arbuscular mycorrhiza symbiosis. Annu. Rev. Cell Dev. Biol. 2013, 29, 593–617. [Google Scholar] [CrossRef] [PubMed]
  6. Akiyama, K.; Matsuzaki, K.; Hayashi, H. Plant sesquiterpenes induce hyphal branching in arbuscular mycorrhizal fungi. Nature 2005, 435, 824–827. [Google Scholar] [CrossRef]
  7. Besserer, A.; Becard, G.; Jauneau, A.; Roux, C.; Sejalon-Delmas, N. GR24, a synthetic analog of strigolactones, stimulates the mitosis and growth of the arbuscular mycorrhizal fungus Gigaspora rosea by boosting its energy metabolism. Plant Physiol. 2008, 148, 402–413. [Google Scholar] [CrossRef]
  8. Kumar, M.; Pandya-Kumar, N.; Kapulnik, Y.; Koltai, H. Strigolactone signaling in root development and phosphate starvation. Plant Signal. Behav. 2015, 10, e1045174. [Google Scholar] [CrossRef]
  9. Yoneyama, K.; Xie, X.N.; Kim, H.I.; Kisugi, T.; Nomura, T.; Sekimoto, H.; Yokota, T.; Yoneyama, K. How do nitrogen and phosphorus deficiencies affect strigolactone production and exudation? Planta 2012, 235, 1197–1207. [Google Scholar] [CrossRef]
  10. Gomez-Roldan, V.; Fermas, S.; Brewer, P.B.; Puech-Pages, V.; Dun, E.A.; Pillot, J.P.; Letisse, F.; Matusova, R.; Danoun, S.; Portais, J.C.; et al. Strigolactone inhibition of shoot branching. Nature 2008, 455, 189–194. [Google Scholar] [CrossRef]
  11. Umehara, M.; Hanada, A.; Yoshida, S.; Akiyama, K.; Arite, T.; Takeda-Kamiya, N.; Magome, H.; Kamiya, Y.; Shirasu, K.; Yoneyama, K.; et al. Inhibition of shoot branching by new terpenoid plant hormones. Nature 2008, 455, 195–200. [Google Scholar] [CrossRef] [PubMed]
  12. Agusti, J.; Herold, S.; Schwarz, M.; Sanchez, P.; Ljung, K.; Dun, E.A.; Brewer, P.B.; Beveridge, C.A.; Sieberer, T.; Sehr, E.M.; et al. Strigolactone signaling is required for auxin-dependent stimulation of secondary growth in plants. Proc. Natl. Acad. Sci. USA 2011, 108, 20242–20247. [Google Scholar] [CrossRef] [PubMed] [Green Version]
  13. Hamiaux, C.; Drummond, R.S.M.; Janssen, B.J.; Ledger, S.E.; Cooney, J.M.; Newcomb, R.D.; Snowden, K.C. DAD2 Is an alpha/beta Hydrolase Likely to Be Involved in the Perception of the Plant Branching Hormone, Strigolactone. Curr. Biol. 2012, 22, 2032–2036. [Google Scholar] [CrossRef] [PubMed]
  14. Kapulnik, Y.; Delaux, P.M.; Resnick, N.; Mayzlish-Gati, E.; Wininger, S.; Bhattacharya, C.; Sejalon-Delmas, N.; Combier, J.P.; Becard, G.; Belausov, E.; et al. Strigolactones affect lateral root formation and root-hair elongation in Arabidopsis. Planta 2011, 233, 209–216. [Google Scholar] [CrossRef] [PubMed]
  15. Kapulnik, Y.; Resnick, N.; Mayzlish-Gati, E.; Kaplan, Y.; Wininger, S.; Hershenhorn, J.; Koltai, H. Strigolactones interact with ethylene and auxin in regulating root-hair elongation in Arabidopsis. J. Exp. Bot. 2011, 62, 2915–2924. [Google Scholar] [CrossRef] [PubMed]
  16. Sorefan, K.; Booker, J.; Haurogne, K.; Goussot, M.; Bainbridge, K.; Foo, E.; Chatfield, S.; Ward, S.; Beveridge, C.; Rameau, C.; et al. MAX4 and RMS1 are orthologous dioxygenase-like genes that regulate shoot branching in Arabidopsis and pea. Genes Dev. 2003, 17, 1469–1474. [Google Scholar] [CrossRef]
  17. Li, S.W.; Xue, L.G.; Xu, S.J.; Feng, H.Y.; An, L.Z. Mediators, Genes and Signaling in Adventitious Rooting. Bot. Rev. 2009, 75, 230–247. [Google Scholar] [CrossRef]
  18. Rasmussen, A.; Mason, M.G.; De Cuyper, C.; Brewer, P.B.; Herold, S.; Agusti, J.; Geelen, D.; Greb, T.; Goormachtig, S.; Beeckman, T.; et al. Strigolactones Suppress Adventitious Rooting in Arabidopsis and Pea. Plant Physiol. 2012, 158, 1976–1987. [Google Scholar] [CrossRef] [Green Version]
  19. Ruyter-Spira, C.; Kohlen, W.; Charnikhova, T.; van Zeijl, A.; van Bezouwen, L.; de Ruijter, N.; Cardoso, C.; Lopez-Raez, J.A.; Matusova, R.; Bours, R.; et al. Physiological Effects of the Synthetic Strigolactone Analog GR24 on Root System Architecture in Arabidopsis: Another Belowground Role for Strigolactones? Plant Physiol. 2011, 155, 721–734. [Google Scholar] [CrossRef]
  20. Snowden, K.C.; Simkin, A.J.; Janssen, B.J.; Templeton, K.R.; Loucas, H.M.; Simons, J.L.; Karunairetnam, S.; Gleave, A.P.; Clark, D.G.; Klee, H.J. The Decreased apical dominance1/Petunia hybrida CAROTENOID CLEAVAGE DIOXYGENASE8 gene affects branch production and plays a role in leaf senescence, root growth, and flower development. Plant Cell 2005, 17, 746–759. [Google Scholar] [CrossRef]
  21. Brewer, P.B.; Koltai, H.; Beveridge, C.A. Diverse Roles of Strigolactones in Plant Development. Mol. Plant 2013, 6, 18–28. [Google Scholar] [CrossRef] [PubMed] [Green Version]
  22. Seto, Y.; Yamaguchi, S. Strigolactone biosynthesis and perception. Curr. Opin. Plant Biol. 2014, 21, 6. [Google Scholar] [CrossRef] [PubMed]
  23. Kapulnik, Y.; Koltai, H. Strigolactone Involvement in Root Development, Response to Abiotic Stress, and Interactions with the Biotic Soil Environment. Plant Physiol. 2014, 166, 560–569. [Google Scholar] [CrossRef] [PubMed] [Green Version]
  24. Waldie, T.; McCulloch, H.; Leyser, O. Strigolactones and the control of plant development: Lessons from shoot branching. Plant J. 2014, 79, 607–622. [Google Scholar] [CrossRef] [PubMed]
  25. Al-Babili, S.; Bouwmeester, H.J. Strigolactones, a Novel Carotenoid-Derived Plant Hormone. Annu. Rev. Plant Biol. 2015, 66, 161–186. [Google Scholar] [CrossRef] [PubMed]
  26. Decker, E.L.; Alder, A.; Hunn, S.; Ferguson, J.; Lehtonen, M.T.; Scheler, B.; Kerres, K.L.; Wiedemann, G.; Safavi-Rizi, V.; Nordzieke, S.; et al. Strigolactone biosynthesis is evolutionarily conserved, regulated by phosphate starvation and contributes to resistance against phytopathogenic fungi in a moss, Physcomitrella patens. New Phytol. 2017, 216, 455–468. [Google Scholar] [CrossRef] [PubMed]
  27. Fraser, P.D.; Bramley, P.M. The biosynthesis and nutritional uses of carotenoids. Prog. Lipid Res. 2004, 43, 228–265. [Google Scholar] [CrossRef] [PubMed]
  28. Moise, A.R.; Al-Babili, S.; Wurtzel, E.T. Mechanistic Aspects of Carotenoid Biosynthesis. Chem. Rev. 2014, 114, 164–193. [Google Scholar] [CrossRef] [PubMed]
  29. Nisar, N.; Li, L.; Lu, S.; Khin, N.C.; Pogson, B.J. Carotenoid Metabolism in Plants. Mol. Plant 2015, 8, 68–82. [Google Scholar] [CrossRef]
  30. Walter, M.H.; Strack, D. Carotenoids and their cleavage products: Biosynthesis and functions. Nat. Prod. Rep. 2011, 28, 663–692. [Google Scholar] [CrossRef]
  31. Alder, A.; Jamil, M.; Marzorati, M.; Bruno, M.; Vermathen, M.; Bigler, P.; Ghisla, S.; Bouwmeester, H.; Beyer, P.; Al-Babili, S. The Path from beta-Carotene to Carlactone, a Strigolactone-Like Plant Hormone. Science 2012, 335, 1348–1351. [Google Scholar] [CrossRef] [PubMed]
  32. Braun, N.; de Saint Germain, A.; Pillot, J.P.; Boutet-Mercey, S.; Dalmais, M.; Antoniadi, I.; Li, X.; Maia-Grondard, A.; Le Signor, C.; Bouteiller, N.; et al. The Pea TCP Transcription Factor PsBRC1 Acts Downstream of Strigolactones to Control Shoot Branching. Plant Physiol. 2012, 158, 225–238. [Google Scholar] [CrossRef] [PubMed]
  33. Turnbull, C.G.N.; Booker, J.P.; Leyser, H.M.O. Micrografting techniques for testing long-distance signalling in Arabidopsis. Plant J. 2002, 32, 255–262. [Google Scholar] [CrossRef]
  34. Booker, J.; Auldridge, M.; Wills, S.; McCarty, D.; Klee, H.; Leyser, O. MAX3/CCD7 is a carotenoid cleavage dioxygenase required for the synthesis of a novel plant signaling molecule. Curr. Biol. 2004, 14, 1232–1238. [Google Scholar] [CrossRef] [PubMed]
  35. Booker, J.; Sieberer, T.; Wright, W.; Williamson, L.; Willett, B.; Stirnberg, P.; Turnbull, C.; Srinivasan, M.; Goddard, P.; Leyser, O. MAX1 encodes a cytochrome P450 family member that acts downstream of MAX3/4 to produce a carotenoid-derived branch-inhibiting hormone. Dev. Cell 2005, 8, 443–449. [Google Scholar] [CrossRef] [PubMed]
  36. Auldridge, M.E.; Block, A.; Vogel, J.T.; Dabney-Smith, C.; Mila, I.; Bouzayen, M.; Magallanes-Lundback, M.; DellaPenna, D.; McCarty, D.R.; Klee, H.J. Characterization of three members of the Arabidopsis carotenoid cleavage dioxygenase family demonstrates the divergent roles of this multifunctional enzyme family. Plant J. 2006, 45, 982–993. [Google Scholar] [CrossRef] [PubMed]
  37. Stirnberg, P.; van de Sande, K.; Leyser, H.M.O. MAX1 and MAX2 control shoot lateral branching in Arabidopsis. Development 2002, 129, 1131–1141. [Google Scholar]
  38. Stirnberg, P.; Furner, I.J.; Leyser, H.M.O. MAX2 participates in an SCF complex which acts locally at the node to suppress shoot branching. Plant J. 2007, 50, 80–94. [Google Scholar] [CrossRef]
  39. Ul Haq, B.; Ahmad, M.Z.; Rehman, N.U.; Wang, J.J.; Li, P.H.; Li, D.Q.; Zhao, J. Functional characterization of soybean strigolactone biosynthesis and signaling genes in Arabidopsis MAX mutants and GmMAX3 in soybean nodulation. BMC Plant Biol. 2017, 17. [Google Scholar] [CrossRef]
  40. Lin, H.; Wang, R.X.; Qian, Q.; Yan, M.X.; Meng, X.B.; Fu, Z.M.; Yan, C.Y.; Jiang, B.; Su, Z.; Li, J.Y.; et al. DWARF27, an Iron-Containing Protein Required for the Biosynthesis of Strigolactones, Regulates Rice Tiller Bud Outgrowth. Plant Cell 2009, 21, 1512–1525. [Google Scholar] [CrossRef] [Green Version]
  41. Bruno, M.; Al-Babili, S. On the substrate specificity of the rice strigolactone biosynthesis enzyme DWARF27. Planta 2016, 243, 1429–1440. [Google Scholar] [CrossRef] [PubMed]
  42. Bruno, M.; Hofmann, M.; Vermathen, M.; Alder, A.; Beyer, P.; Al-Babili, S. On the substrate- and stereospecificity of the plant carotenoid cleavage dioxygenase 7. FEBS Lett. 2014, 588, 1802–1807. [Google Scholar] [CrossRef] [Green Version]
  43. Abe, S.; Sado, A.; Tanaka, K.; Kisugi, T.; Asami, K.; Ota, S.; Kim, H., II; Yoneyama, K.; Xie, X.; Ohnishi, T.; et al. Carlactone is converted to carlactonoic acid by MAX1 in Arabidopsis and its methyl ester can directly interact with AtD14 in vitro. Proc. Natl. Acad. Sci. USA 2014, 111, 18084–18089. [Google Scholar] [CrossRef]
  44. Brewer, P.B.; Yoneyama, K.; Filardo, F.; Meyers, E.; Scaffidi, A.; Frickey, T.; Akiyama, K.; Seto, Y.; Dun, E.A.; Cremer, J.E.; et al. LATERAL BRANCHING OXIDOREDUCTASE acts in the final stages of strigolactone biosynthesis in Arabidopsis. Proc. Natl. Acad. Sci. USA 2016, 113, 6301–6306. [Google Scholar] [CrossRef] [PubMed]
  45. Wang, L.; Wang, B.; Jiang, L.; Liu, X.; Li, X.L.; Lu, Z.F.; Meng, X.B.; Wang, Y.H.; Smith, S.M.; Li, J.Y. Strigolactone Signaling in Arabidopsis Regulates Shoot Development by Targeting D53-Like SMXL Repressor Proteins for Ubiquitination and Degradation. Plant Cell 2015, 27, 3128–3142. [Google Scholar] [CrossRef] [Green Version]
  46. Dalma-Weiszhausz, D.D.; Warrington, J.; Tanimoto, E.Y.; Miyada, C.G. The affymetrix GeneChip platform: An overview. Methods Enzym. 2006, 410, 3–28. [Google Scholar] [CrossRef]
  47. Smyth, G.K. Linear models and empirical bayes methods for assessing differential expression in microarray experiments. Stat. Appl. Genet. Mol. Biol. 2004, 3. [Google Scholar] [CrossRef] [PubMed]
  48. Seto, Y.; Sado, A.; Asami, K.; Hanada, A.; Umehara, M.; Akiyama, K.; Yamaguchi, S. Carlactone is an endogenous biosynthetic precursor for strigolactones. Proc. Natl. Acad. Sci. USA 2014, 111, 1640–1645. [Google Scholar] [CrossRef] [Green Version]
  49. Bell, E.M.; Lin, W.C.; Husbands, A.Y.; Yu, L.F.; Jaganatha, V.; Jablonska, B.; Mangeon, A.; Neff, M.M.; Girke, T.; Springer, P.S. Arabidopsis LATERAL ORGAN BOUNDARIES negatively regulates brassinosteroid accumulation to limit growth in organ boundaries. Proc. Natl. Acad. Sci. USA 2012, 109, 21146–21151. [Google Scholar] [CrossRef]
  50. Soundappan, I.; Bennett, T.; Morffy, N.; Liang, Y.Y.; Stang, J.P.; Abbas, A.; Leyser, O.; Nelson, D.C. SMAX1-LIKE/D53 Family Members Enable Distinct MAX2-Dependent Responses to Strigolactones and Karrikins in Arabidopsis. Plant Cell 2015, 27, 3143–3159. [Google Scholar] [CrossRef]
  51. Dong, Z.J.; Yu, Y.W.; Li, S.H.; Wang, J.; Tang, S.J.; Huang, R.F. Abscisic Acid Antagonizes Ethylene Production through the ABI4-Mediated Transcriptional Repression of ACS4 and ACS8 in Arabidopsis. Mol. Plant 2016, 9, 126–135. [Google Scholar] [CrossRef] [PubMed]
  52. Tsuchisaka, A.; Yu, G.X.; Jin, H.L.; Alonso, J.M.; Ecker, J.R.; Zhang, X.M.; Gao, S.; Theologis, A. A Combinatorial Interplay Among the 1-Aminocyclopropane-1-Carboxylate Isoforms Regulates Ethylene Biosynthesis in Arabidopsis thaliana. Genetics 2009, 183, 979–1003. [Google Scholar] [CrossRef] [PubMed]
  53. Zhao, Q.P.; Wang, X.N.; Li, N.N.; Zhu, Z.Y.; Mu, S.C.; Zhao, X.; Zhang, X. Functional Analysis of MAX2 in Phototropins-Mediated Cotyledon Flattening in Arabidopsis. Front. Plant Sci. 2018, 9. [Google Scholar] [CrossRef] [PubMed]
  54. Jia, K.P.; Luo, Q.; He, S.B.; Lu, X.D.; Yang, H.Q. Strigolactone-Regulated Hypocotyl Elongation Is Dependent on Cryptochrome and Phytochrome Signaling Pathways in Arabidopsis. Mol. Plant 2014, 7, 528–540. [Google Scholar] [CrossRef] [PubMed] [Green Version]
  55. Demarsy, E.; Schepens, I.; Okajima, K.; Hersch, M.; Bergmann, S.; Christie, J.; Shimazaki, K.; Tokutomi, S.; Fankhauser, C. Phytochrome Kinase Substrate 4 is phosphorylated by the phototropin 1 photoreceptor. EMBO J. 2012, 31, 3457–3467. [Google Scholar] [CrossRef] [PubMed]
  56. Nelson, D.C.; Scaffidi, A.; Dun, E.A.; Waters, M.T.; Flematti, G.R.; Dixon, K.W.; Beveridge, C.A.; Ghisalberti, E.L.; Smith, S.M. F-box protein MAX2 has dual roles in karrikin and strigolactone signaling in Arabidopsis thaliana. Proc. Natl. Acad. Sci. USA 2011, 108, 8897–8902. [Google Scholar] [CrossRef] [PubMed]
  57. Diet, A.; Link, B.; Seifert, G.J.; Schellenberg, B.; Wagner, U.; Pauly, M.; Reiter, W.D.; Ringli, C. The Arabidopsis root hair cell wall formation mutant lrx1 is suppressed by mutations in the RHM1 gene encoding a UDP-L-rhamnose synthase. Plant Cell 2006, 18, 1630–1641. [Google Scholar] [CrossRef] [PubMed]
  58. Kolesnikova, M.D.; Xiong, Q.B.; Lodeiro, S.; Hua, L.; Matsuda, S.P.T. Lanosterol biosynthesis in plants. Arch. Biochem. Biophys. 2006, 447, 87–95. [Google Scholar] [CrossRef] [PubMed]
  59. Ohyama, K.; Suzuki, M.; Kikuchi, J.; Saito, K.; Muranaka, T. Dual biosynthetic pathways to phytosterol via cycloartenol and lanosterol in Arabidopsis. Proc. Natl. Acad. Sci. USA 2009, 106, 725–730. [Google Scholar] [CrossRef] [PubMed]
  60. Dai, Y.; Wang, H.; Li, B.; Huang, J.; Liu, X.; Zhou, Y.; Mou, Z.; Li, J. Increased expression of MAP KINASE KINASE7 causes deficiency in polar auxin transport and leads to plant architectural abnormality in Arabidopsis. Plant Cell 2006, 18, 308–320. [Google Scholar] [CrossRef] [PubMed]
  61. Cho, W.K.; Yu, J.; Lee, K.M.; Son, M.; Min, K.; Lee, Y.W.; Kim, K.H. Genome-wide expression profiling shows transcriptional reprogramming in Fusarium graminearum by Fusarium graminearum virus 1-DK21 infection. BMC Genom. 2012, 13. [Google Scholar] [CrossRef] [PubMed]
  62. Workman, C.; Jensen, L.J.; Jarmer, H.; Berka, R.; Gautier, L.; Nielser, H.B.; Saxild, H.H.; Nielsen, C.; Brunak, S.; Knudsen, S. A new non-linear normalization method for reducing variability in DNA microarray experiments. Genome Biol. 2002, 3. [Google Scholar] [CrossRef]
  63. Minh-Thu, P.T.; Hwang, D.J.; Jeon, J.S.; Nahm, B.H.; Kim, Y.K. Transcriptome analysis of leaf and root of rice seedling to acute dehydration. Rice 2013, 6. [Google Scholar] [CrossRef] [PubMed]
  64. Zeeberg, B.R.; Feng, W.M.; Wang, G.; Wang, M.D.; Fojo, A.T.; Sunshine, M.; Narasimhan, S.; Kane, D.W.; Reinhold, W.C.; Lababidi, S.; et al. GoMiner: A resource for biological interpretation of genomic and proteomic data. Genome Biol. 2003, 4. [Google Scholar] [CrossRef]
  65. Chae, S.; Kim, J.S.; Jun, K.M.; Lee, S.B.; Kim, M.S.; Nahm, B.H.; Kim, Y.K. Analysis of Genes with Alternatively Spliced Transcripts in the Leaf, Root, Panicle and Seed of Rice Using a Long Oligomer Microarray and RNA-Seq. Mol. Cells 2017, 40, 714–730. [Google Scholar] [CrossRef] [PubMed] [Green Version]
  66. Meur, N.L.; Gentleman, R. Analyzing biological data using R: Methods for graphs and networks. Methods Mol Biol. 2012, 804, 343–373. [Google Scholar] [CrossRef] [PubMed]
  67. Kerr, S.C.; Beveridge, C.A. IPA1: A direct target of SL signaling. Cell Res. 2017, 27, 1191–1192. [Google Scholar] [CrossRef]
Figure 1. Strigolactone biosynthesis pathway and perception. (A) Strigolactone biosynthesis, signaling perception pathway and mutants identified by genetic methods in this pathway. (B) The max mutants with their branched phenotypes. (C) Number of branches per max mutant compared with the wild-type. Bars indicate standard error of five replicates. The asterisk sign (∗) indicates the significant difference between max mutants and Col-0 at p < 0.05 (Student’s t-test).
Plants 08 00352 g001
Figure 2. Microarray analysis of the gene expression profiles in max mutants compared with wild-type. (A) Significantly changed genes in max mutants compared with wild-type. (B) Venn diagram for several genes that changed expressed levels in mutants compared with those of wild-type control. (C) Heatmap of differentially expressed Gene Ontology (GO) in all four max mutants. Panel on the right side of the heat map shows the GO identity and its role in various biological processes. Red boxes in the heat map show up-regulated GO, green boxes show down-regulated GO, and black boxes show unchanged GO expression in four max mutants.
Plants 08 00352 g002
Figure 3. The transcript level of genes involved in strigolactone biosynthesis and signaling pathway in four max mutants. (AD) Relative expression of SL metabolism-related genes in max3-9, max4-1, max1-1, and max2-1 mutant respectively compared with wild-type based on microarray results. Leaf of the mature plant was used to isolate RNA. Each data point represents the mean (±SE) from 2 different plants. The star indicates a significant difference between mutant and wild-type. * p < 0.05, ** p < 0.05, *** p < 0.001 (Two-way ANOVA test).
Plants 08 00352 g003
Figure 4. Differentially expressed genes in max2 mutants. (AD) Relative normalized gene expression compared to wild-type in the max mutant. Error bars represent standard error of three replicates. Leaf of the mature plant was used to isolate RNA. The star indicates a significant difference between mutant and wild-type. * p < 0.05, ** p < 0.01 (Student’s t-test).
Plants 08 00352 g004
Figure 5. Proposed SL signaling pathways. DEGs means differential expressed genes. Black arrows represent up-regulated genes, dotted lines, and question mark (?) represent unreported genes.
Plants 08 00352 g005

