Article

Reactive Oxygen Species Alleviate Cell Death Induced by Thaxtomin A in Arabidopsis thaliana Cell Cultures

1
Centre SÈVE, Département de Biologie, Université de Sherbrooke, Sherbrooke, QC J1K 2R1, Canada
2
Groupe de Recherche en Biologie Végétale, Département de Chimie, Biochimie et Physique, Université du Québec à Trois-Rivières, Trois-Rivières, QC G9A 5H7, Canada
3
Institut de Pharmacologie de Sherbrooke, Département de Pharmacologie et Physiologie, Université de Sherbrooke, Sherbrooke, QC J1H 5N4, Canada
*
Author to whom correspondence should be addressed.
Plants 2019, 8(9), 332; https://doi.org/10.3390/plants8090332
Submission received: 28 June 2019 / Revised: 26 August 2019 / Accepted: 3 September 2019 / Published: 6 September 2019
(This article belongs to the Special Issue ROS Responses in Plants)

Abstract

:
Thaxtomin A (TA) is a cellulose biosynthesis inhibitor synthesized by the soil actinobacterium Streptomyces scabies, which is the main causal agent of potato common scab. TA is essential for the induction of scab lesions on potato tubers. When added to Arabidopsis thaliana cell cultures, TA induces an atypical programmed cell death (PCD). Although production of reactive oxygen species (ROS) often correlates with the induction of PCD, we observed a decrease in ROS levels following TA treatment. We show that this decrease in ROS accumulation in TA-treated cells is not due to the activation of antioxidant enzymes. Moreover, Arabidopsis cell cultures treated with hydrogen peroxide (H2O2) prior to TA treatment had significantly fewer dead cells than cultures treated with TA alone. This suggests that H2O2 induces biochemical or molecular changes in cell cultures that alleviate the activation of PCD by TA. Investigation of the cell wall mechanics using atomic force microscopy showed that H2O2 treatment can prevent the decrease in cell wall rigidity observed after TA exposure. While we cannot exclude the possibility that H2O2 may promote cell survival by altering the cellular redox environment or signaling pathways, our results suggest that H2O2 may inhibit cell death, at least partially, by reinforcing the cell wall to prevent or compensate for damages induced by TA.

1. Introduction

Reactive oxygen species (ROS) are involved in several plant physiological processes, including growth and development, stress and defense responses, tissue differentiation, and senescence. ROS can regulate gene expression and participate as secondary messengers in various signaling pathways [1,2,3]. Plant cells can produce ROS enzymatically to fulfill specialized function or in response to a wide variety of stimuli. ROS production can also occur non-enzymatically, during photosynthesis and respiration, through electron transport chain reactions occurring in chloroplasts and mitochondria [1,3,4]. While basal ROS levels are essential to maintain normal cell functions, stress conditions can greatly enhance their accumulation up to toxic levels and cause important oxidative damage to cells. To maintain an adequate redox balance and prevent ROS-mediated damage, plant cells have evolved different anti-oxidative strategies involving various non-enzymatic and enzymatic ROS scavengers [2,3,5].
Hydrogen peroxide (H2O2) is a type of ROS involved in central physiological processes and signaling pathways within and between plant cells [6,7]. For instance, H2O2 has been implicated in the regulation of stomatal movements [8], seed germination [9], root system development, root hair growth [10], pollen tube formation [11], and reinforcement of the cell wall [12,13,14]. Generation of H2O2 can be mediated by enzymes such as cell wall peroxidases [15], cell membrane NADPH-dependent oxidases [16], and amine oxidase [17]. Plant cells exposed to stress can produce a burst of ROS mainly composed of H2O2 [18]. Such H2O2 production has been detected in response to various abiotic and biotic stresses, such as heat stress [19], wounding [20], salt stress [21], and response to a bacterial or a fungal pathogen [22,23,24]. Plant pathogen recognition also involves a rapid ROS accumulation (the so-called “oxidative burst”) associated with the activation of defense-related programmed cell death (PCD) known as the hypersensitive (HR) cell death [25]. Production of H2O2 is commonly associated with most types of developmental or stress-induced PCD [6]. Moreover, H2O2 itself can activate PCD [26]. At high concentrations, H2O2 is highly toxic to all living cells. H2O2 can react with various cellular components, causing extensive damages that may lead to cell death. Hence, H2O2 production has been involved in direct anti-pathogen roles [18]. However, high levels of H2O2 also induce the synthesis of antioxidant molecules that can protect cells from oxidative damage. Consequently, it is now widely accepted that H2O2 produced during PCD mainly plays a role as an important signaling component of complex PCD regulatory pathways rather than being the direct cause of cell death [2].
Using Arabidopsis thaliana cell suspensions, it was shown that the phytotoxin thaxtomin A (TA) can induce a form of PCD that is not associated with ROS production and the activation of mitogen activated protein kinase (MAPK) signaling cascades [27,28]. TA is synthesized by the phytopathogen Streptomyces scabies (syn. scabiei), which is a soil actinobacterium causing potato common scab [29,30,31]. This phytotoxin is essential for the formation of disease symptoms characterized by scab-like suberized cell layers on the surface of potato tubers [30,32,33,34]. TA inhibits cellulose biosynthesis, which may facilitate pathogen entry through the cell walls of potato cells [31,35,36]. In A. thaliana seedlings, TA treatment also inhibits root growth and causes root swelling [36,37]. Recently, it was shown that TA activates Enhanced Disease Susceptibility 1 (EDS1)-dependent and Phytoalexin Deficient 4 (PAD4)-dependent defense responses independently of SA production [38]. EDS1 and PAD4 are important regulators of plant innate immunity and were shown to be essential for disease resistance. During plant pathogen interactions, EDS1/PAD4 form complexes that activate defense gene expression, which leads to plant immunity and/or localized cell death [39,40,41,42]. Activation of EDS1/PAD4-mediated pathway by TA does not depend on ROS production [38].
Considering the documented implication of ROS in most plant PCD pathways, the fact that ROS production is not stimulated by TA is quite intriguing. In this work, we studied this question using A. thaliana cell suspensions. We first showed that ROS production was diminished by TA treatment. We investigated the possible role of antioxidant enzymes catalase (CAT), ascorbate peroxidase (AXP), and superoxide dismutase (SOD) in controlling ROS accumulation in response to TA. We found that addition of H2O2 to cell cultures prior to TA treatment protected cells from TA-induced cell death. Measurements of cell surface mechanics using atomic force microscopy (AFM)-based force microscopy showed that, while TA treatment decreased cell wall stiffness, the addition of H2O2 alone or in combination with TA increased cell wall rigidity. This suggests that ROS may, at least partially, inhibit TA-induced PCD by preventing or compensating for cell wall damages induced by TA.

2. Results

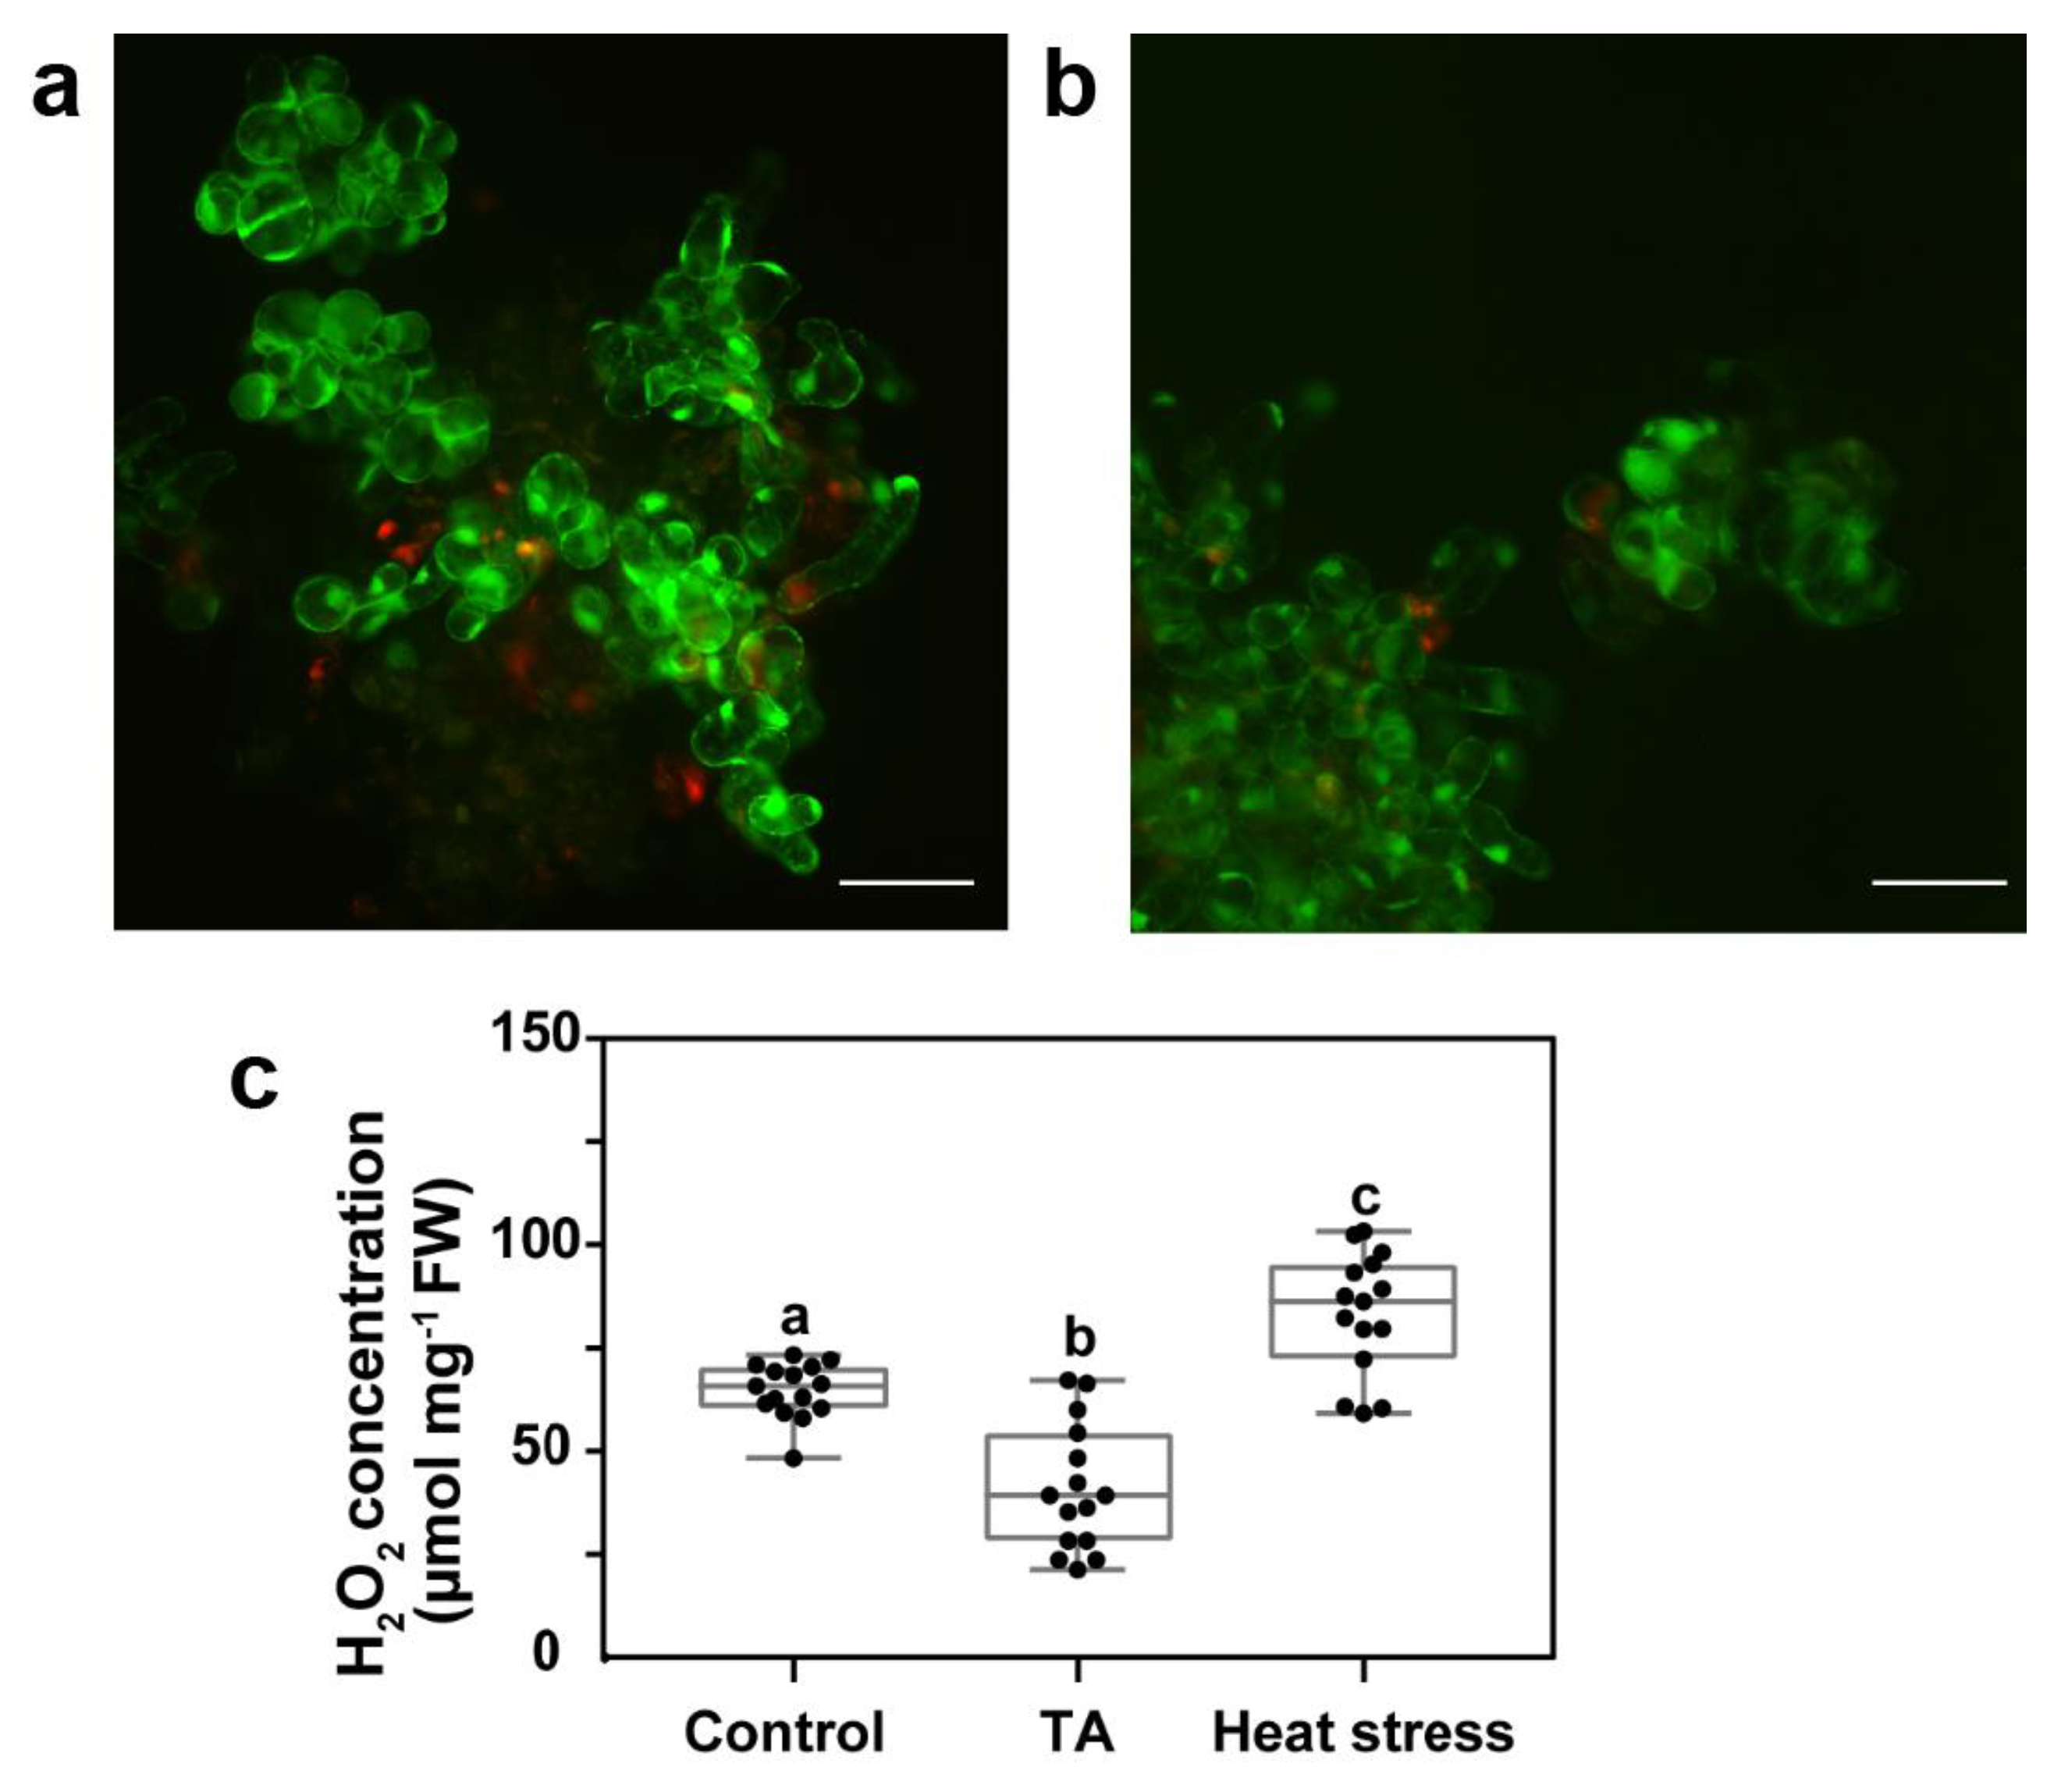
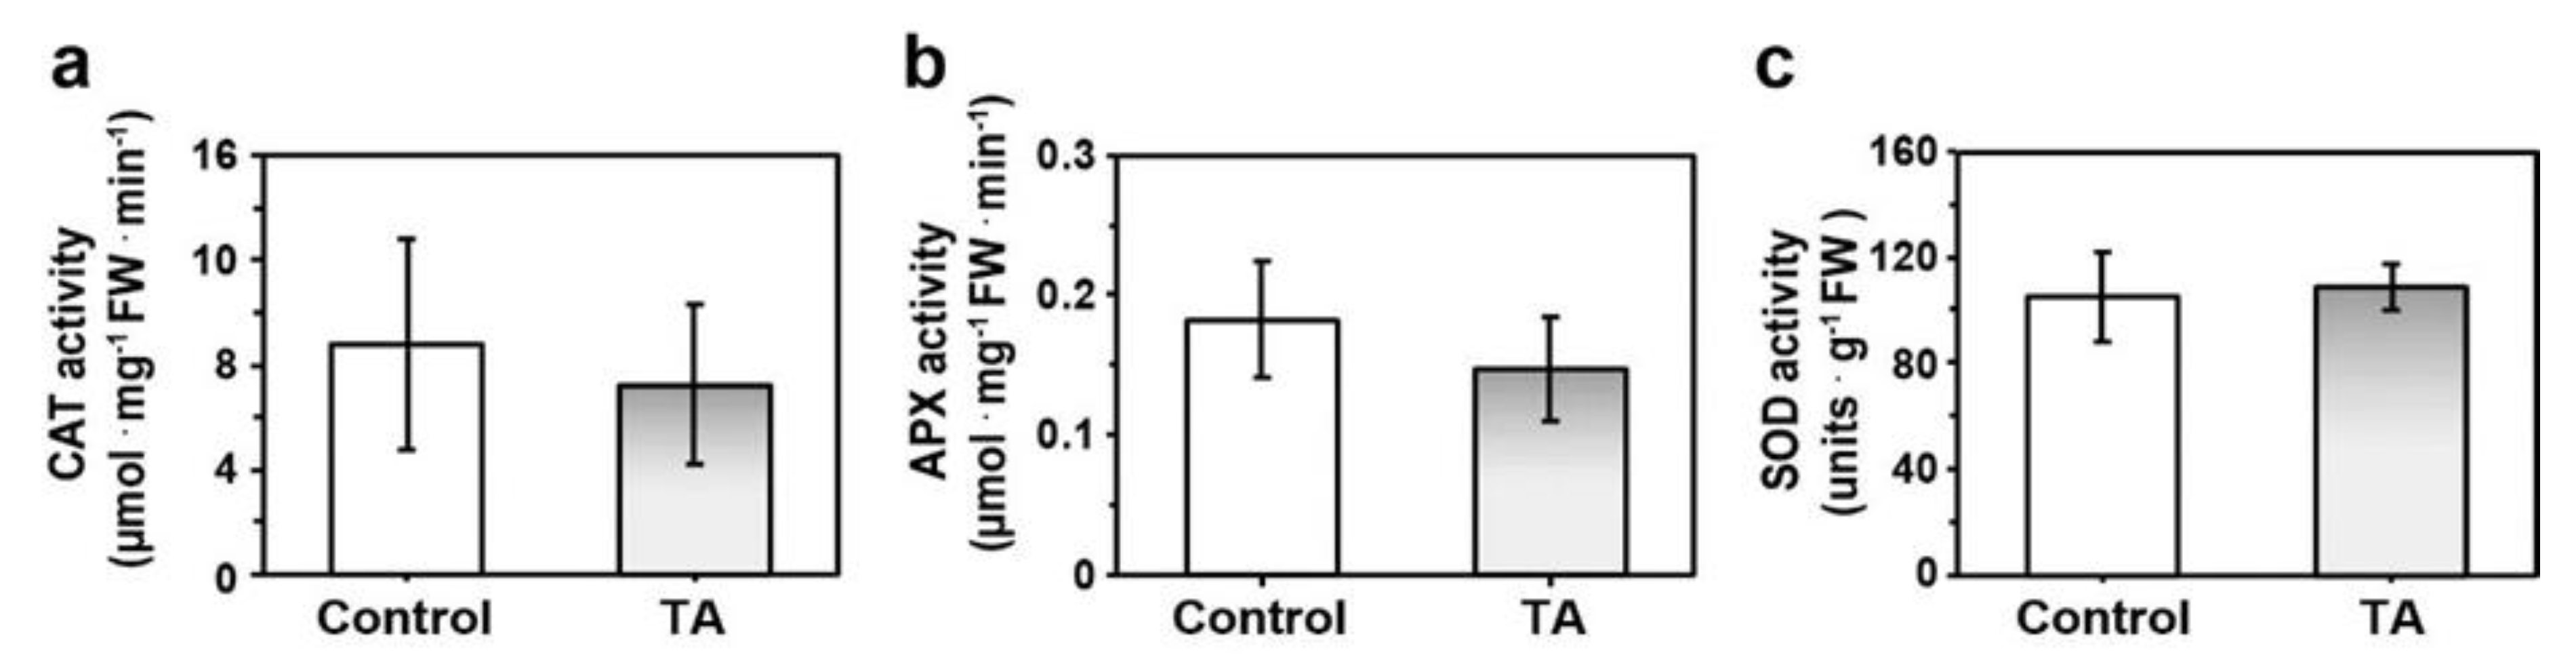
2.1. Reduced Accumulation of ROS Was Not Asssociated with Increased Antioxidant Enzyme Activity

Previous work has shown that TA-induced PCD in Arabidopsis cell suspension cultures was not associated with the production of ROS [27,28]. We first evaluated the level of ROS production before and after TA-treatment in the Arabidopsis suspension cultures used in the present study. Since TA was diluted in methanol, control cells were treated with the same volume of methanol, with a final concentration of 0.1% methanol or less. As reported before, this methanol concentration had no impact on cell viability (Suppl. Figure S1, [27,28]) or ROS production [28,43]. TA-treated and control cells were incubated with H2DCFDA, which is a general oxidative stress indicator that emits fluorescence in the presence of ROS. We observed some H2DCFDA fluorescence in control cells, which indicates basal ROS production (Figure 1a). However, there was less fluorescence detected in TA-treated cells, which indicates that TA did not stimulate ROS production and appeared to decrease ROS abundance (Figure 1b). We then quantified H2O2 production in cell cultures using ferrous oxidation-xylenol orange (FOX) modified assay (Figure 1c) [44,45]. There was a significantly lower production of H2O2 in TA-treated cells when compared to the control cells. Heat stress of cell cultures was used as a positive control of H2O2 production [19]. These results showed that TA-induced cell death was not associated with the production of ROS. In fact, H2O2 accumulation in TA-treated cell cultures was significantly decreased below control levels.
Plants can use diverse mechanisms to control abnormal ROS levels and prevent their deleterious effects on plant cells. One of these mechanisms is the expression or activation of antioxidant enzymes that can scavenge ROS, such as catalase (CAT), ascorbate peroxidase (APX), and superoxide dismutase (SOD) [5]. We quantified these enzyme activities in cell extracts from Arabidopsis cell cultures treated or not with TA. The average activity of CAT and APX were lower in TA-treated cells than in control cells, but these differences were not statistically different (Figure 2). Hence, a decrease of ROS accumulation by TA did not involve the activation of these typical antioxidant enzymes.

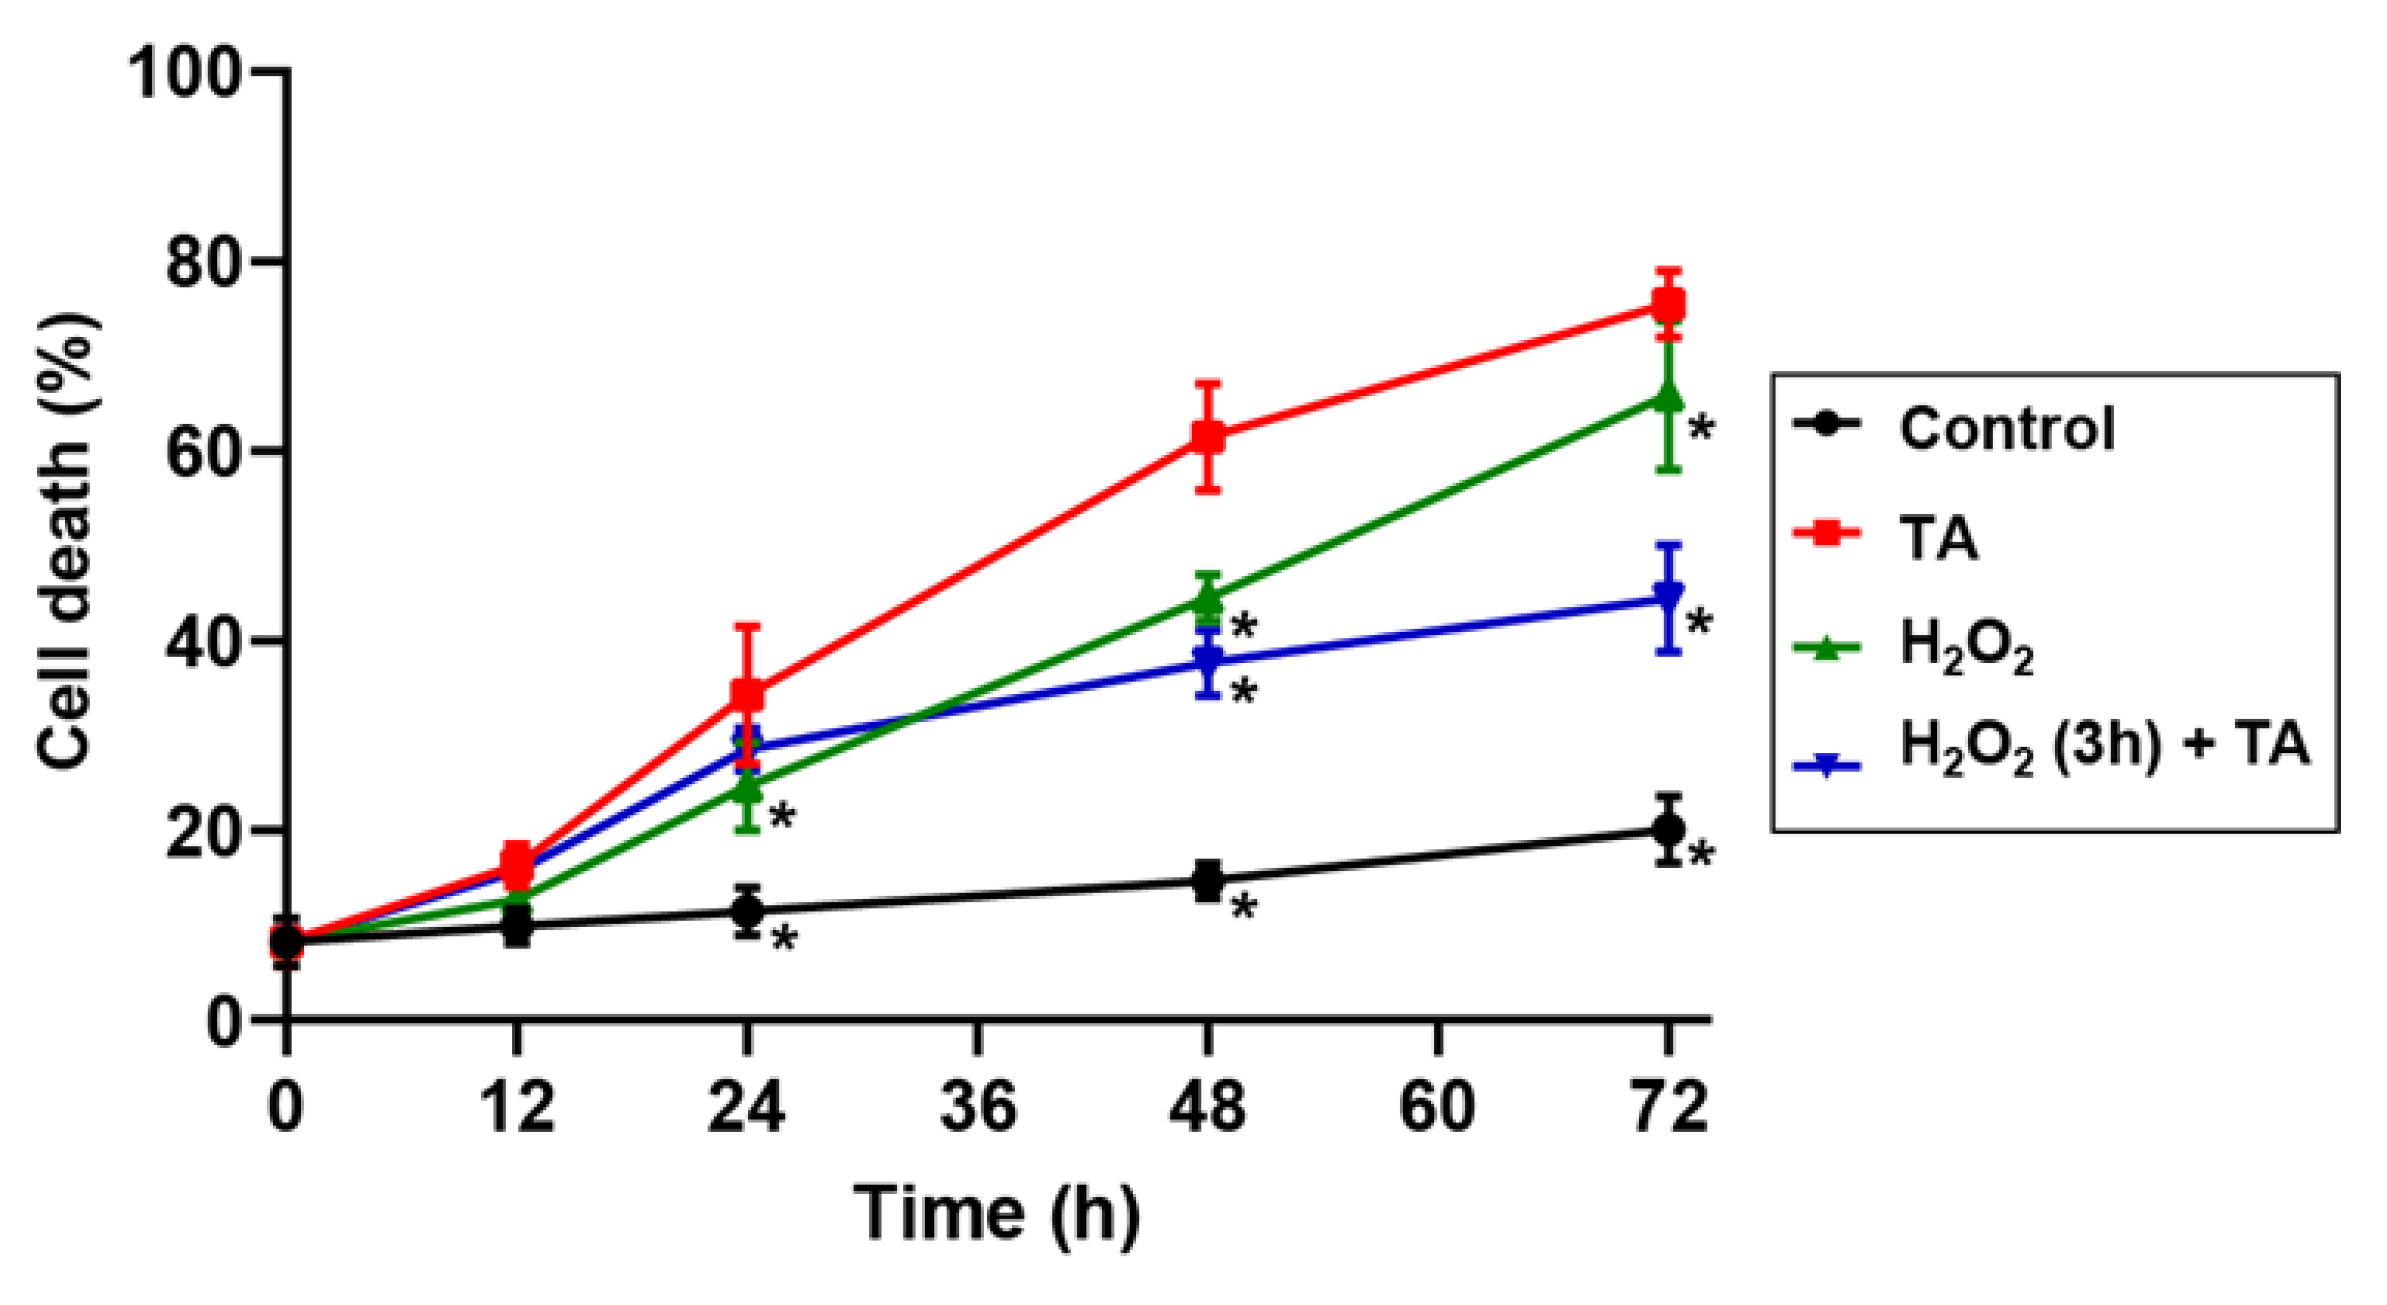
2.2. Hydrogen Peroxide Protected Arabidopsis Cells from TA-Induced Cell Death

To determine whether reduction of H2O2 production by TA was associated with the induction of cell death, we added H2O2 to Arabidopsis cell suspension cultures prior to TA treatment. The percentage of dead cells was evaluated in the control cells, after TA treatment, H2O2 treatment, and a combination of both treatments. We tested two different concentrations of H2O2 (1 and 10 mM) and a different duration of treatment or pre-treatment to evaluate the effect of H2O2 on TA-induced cell death (Figure 3, Suppl. Figure S2). The addition of TA alone led to a drastic increase in cell death with close to 61% of dead cells within 48 h when compared to control cell cultures, which had less than 15% of dead cells. Treatment of cell cultures with 1 mM and 10 mM H2O2 for 48 h induced 44% and 95% of cell death, respectively. For both H2O2 concentrations, the induction of cell death when H2O2 and TA were added simultaneously was equivalent to a treatment with H2O2 alone (data not shown). Pretreatment of cell cultures with 10 mM H2O2 prior to TA addition led to a significant decrease in cell death when compared to the H2O2 treatment alone, but the proportion of cell death was comparable to that observed in TA-treated cells (Suppl. Figure S2). When cells were pretreated with 1 mM H2O2 3 h prior to TA addition, the proportion of dead cells was significantly decreased down to 38% when compared to 61% in TA-treated cells (Figure 3). These results demonstrate that H2O2 at this concentration can prevent cell death caused by TA in Arabidopsis cell suspension cultures.

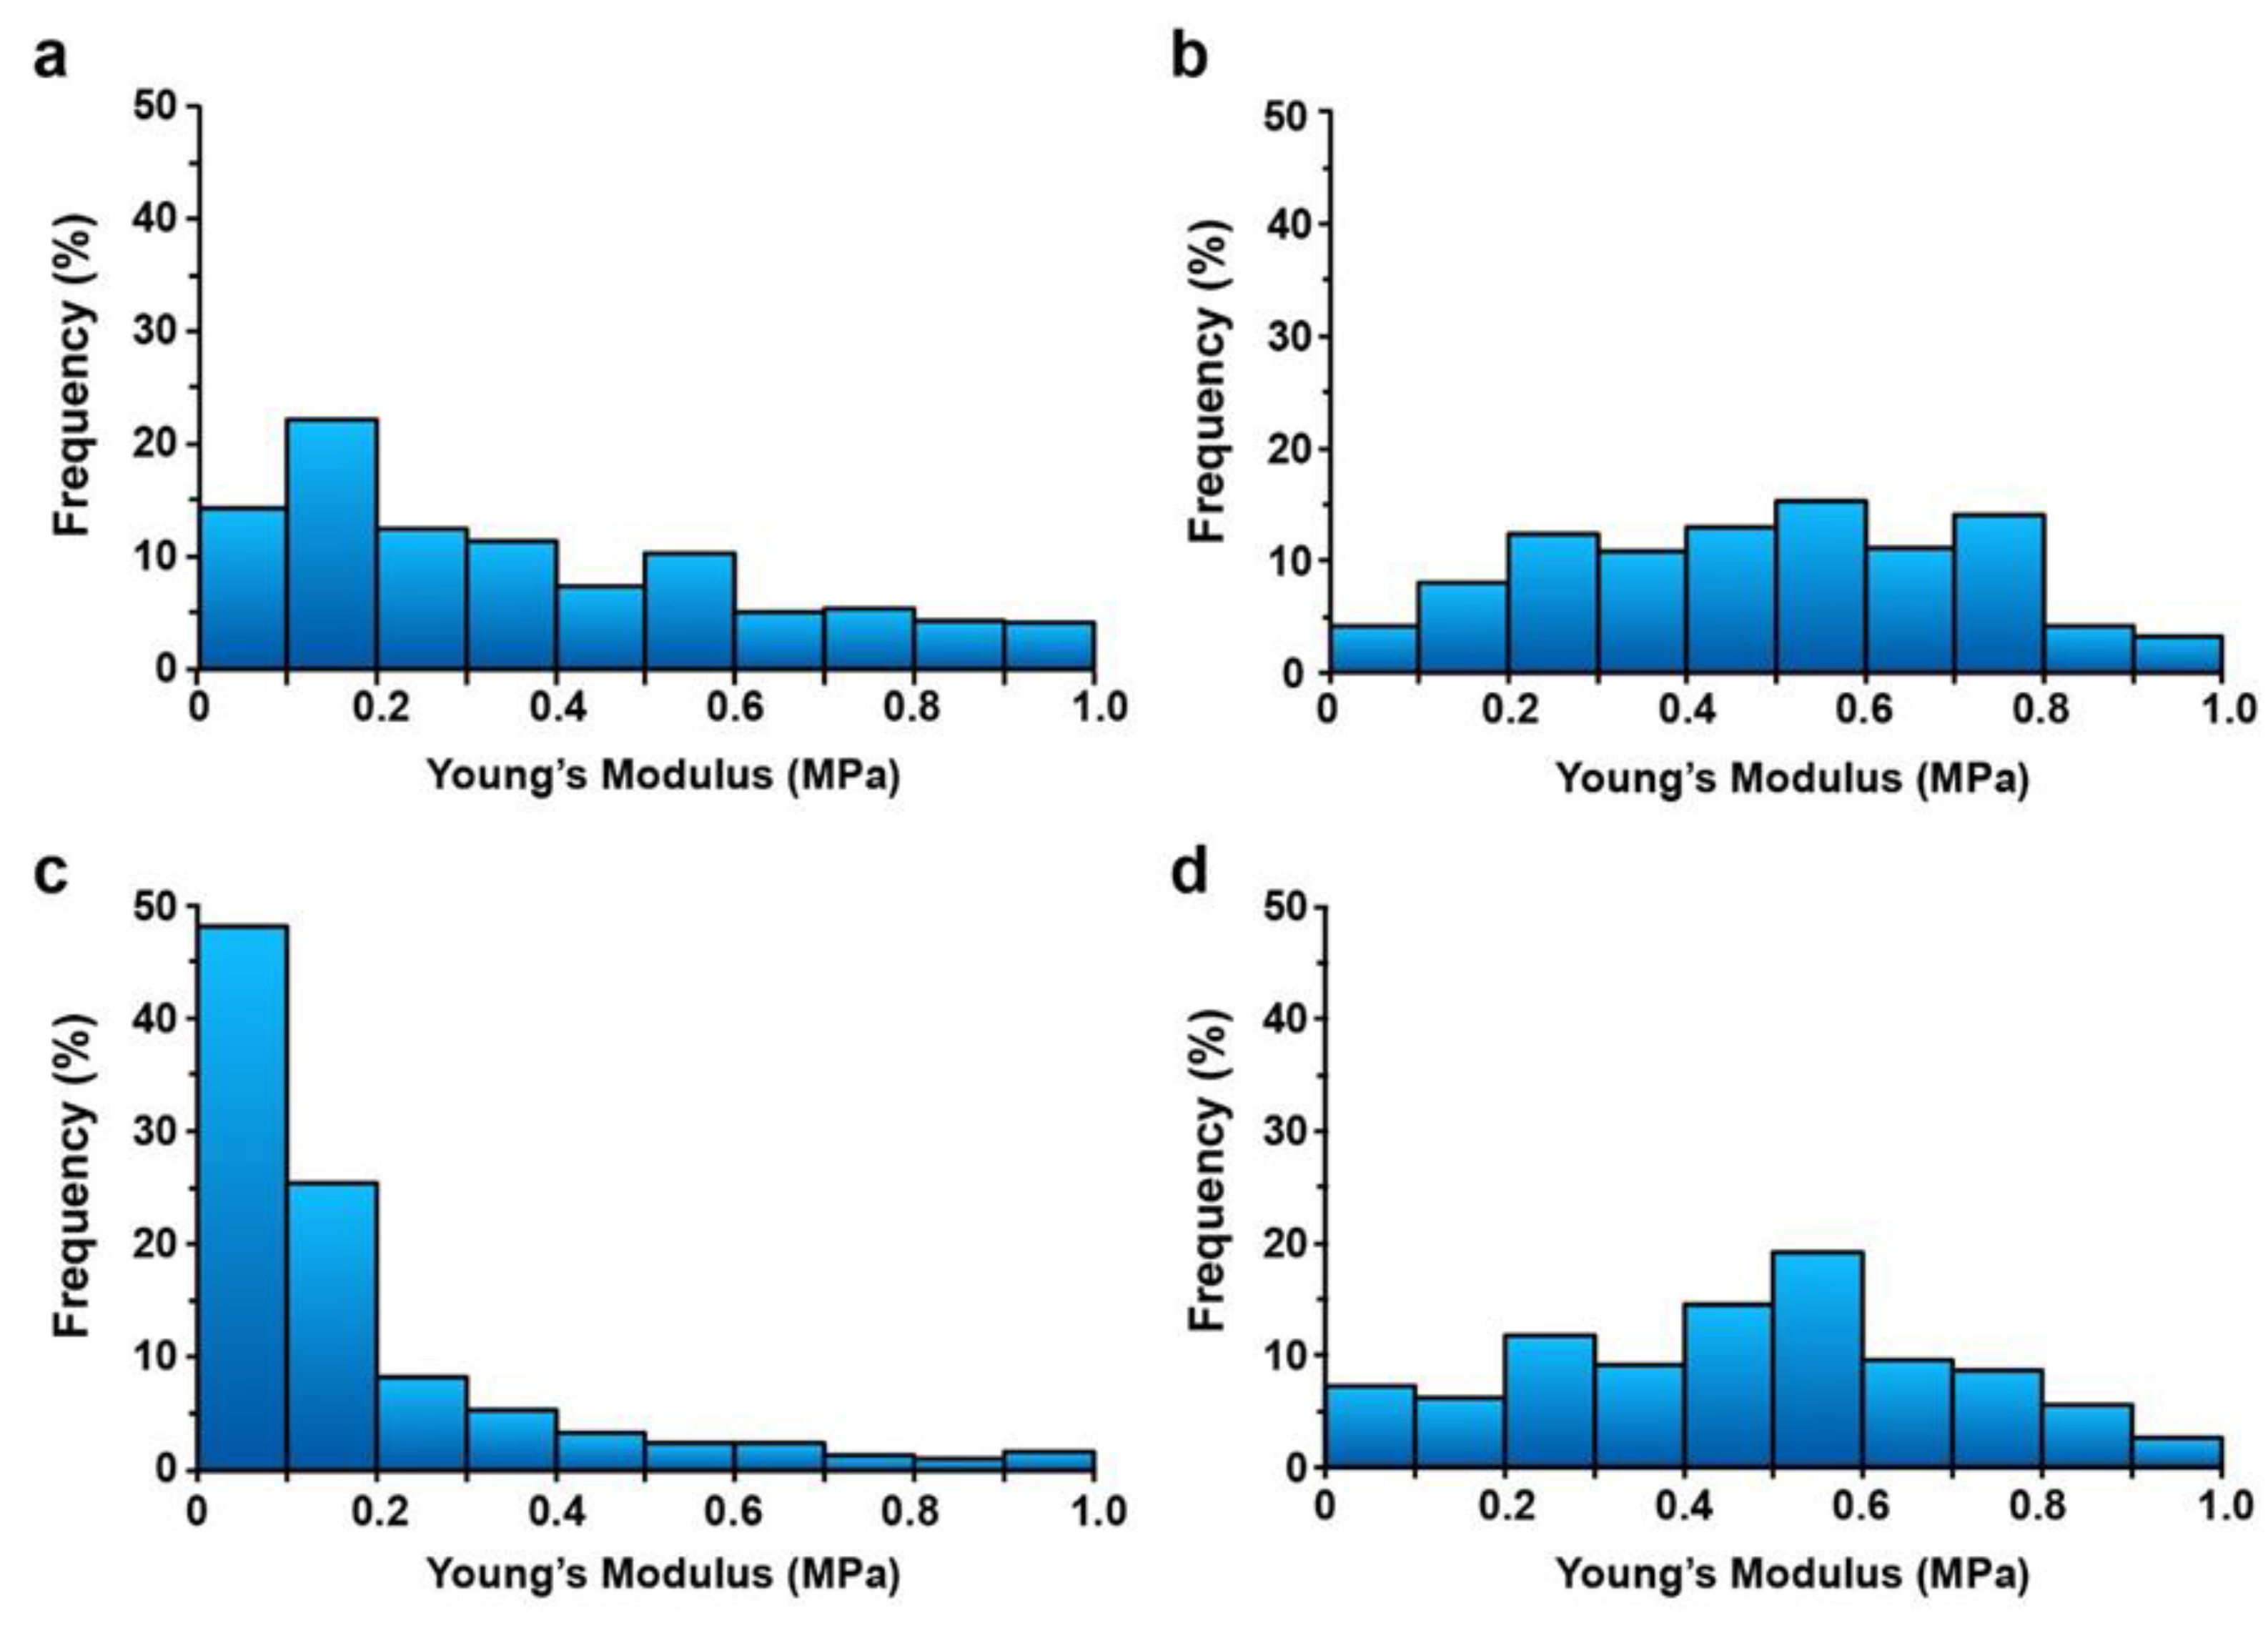
2.3. Increased Cell Wall Rigidity by H2O2 was Maintained after TA Treatment

Treatments of Arabidopsis cell cultures with TA or H2O2 can both alter the cell wall composition and organization. To investigate the mechanical properties of the cell surface of suspension-cultured cells after TA or H2O2 treatment, we used atomic-force microscopy (AFM) to quantify the elastic modulus (Young’s modulus) of the cell wall, as described before [46]. We compared the overall cell wall stiffness between different cells grown in the same conditions but exposed to different treatments. The distribution of Young’s modulus values in control cells was spread almost evenly in the range of 0.1 to 0.6 MPa, with 14% of values below 0.1 MPa and 49% of values below 0.3 MPa (Figure 4a). In TA-treated cells, 48% of Young’s modulus values were below 0.1 MPa and 82% below 0.3 MPa, which indicates a marked decrease in the stiffness of the cell wall attributed to inhibition of cellulose synthesis (Figure 4c). In contrast, cells treated with H2O2 alone showed an increase in cell wall stiffness with only 25% of Young’s modulus values distributed below 0.3 MPa and almost half (48%) of the values found above 0.5 MPa (Figure 4b). Similarly, cell walls of cells treated with both H2O2 and TA showed an increased stiffness with 25% of values below 0.3 MPa and 46% of Young’s modulus values higher than 0.5 MPa (Figure 4d). These results show that cell treatment with 1 mM H2O2 increased cell wall stiffness in A. thaliana cell cultures, and this enhanced rigidity was maintained even after TA treatment.

3. Discussion

ROS are key players in signaling and defense responses in plants [47,48,49]. They are generally produced during the induction of PCD activated by both abiotic and biotic stress, where they play a role as second messengers in PCD signaling pathways. The inhibitor of cellulose synthesis thaxtomin A (TA) can activate PCD without increasing ROS production in Arabidopsis cell suspensions [27,28]. In this case, we showed that there was less ROS detected by H2DCFDA fluorescence in TA-treated suspension-cultured cells (Figure 1a,b) than in control cells. Quantification of H2O2 levels using a FOX modified assay confirmed a significantly lower production of H2O2 in TA-treated cells compared to the control cells (Figure 1c). Since production of H2O2 in the first 4 h after addition of TA to cell cultures was similar to that of untreated cultures [28], the decrease in H2O2 levels 24 h after TA treatment suggests that TA activated biochemical or molecular mechanisms which could either scavenge ROS or inhibit their production. Our results show that the reduction in ROS production was not due to the activation of the antioxidant enzymes CAT, APX, or SOD (Figure 3). This supports previous results showing that expression of the corresponding CAT, APX, and SOD genes was not induced or repressed by TA treatment in Arabidopsis cell suspensions [50]. However, it is possible that TA induced other ROS scavenging mechanisms, such as the activation of other antioxidant enzymes (e.g., gluthatione peroxidase, peroxiredoxins, etc. [5]) or the production of antioxidant molecules (e.g., ascorbate, glutathione, phenolic compounds, etc. [5]). For instance, TA treatment of A. thaliana seedlings was shown to induce the production of scopoletin [51], which is a phytoalexin with antioxidant properties [52]. Additional work will be required to identify how TA treatment leads to a decrease in ROS levels.
These results show that TA-induced PCD can occur in the presence of sub-basal levels of ROS. In animal research, there is increasing evidence that cell proliferation and survival may be compromised not only by toxic ROS levels but also by the lack of necessary ROS, as it could dramatically perturb the cellular redox balance [2,53]. Whether TA can activate PCD by decreasing ROS production down to critically low levels, cannot be excluded at this time.
It was recently shown that TA activates the EDS1/PAD4-mediated defense pathway, which is involved in the induction of plant immunity activated via Toll/Interleukin-1 (TIR)-type immune receptors [38,54]. The EDS1/PAD4-dependent pathway is necessary for the activation of defense responses that may lead to the induction of defense related-cell death, with EDS1 working upstream of the oxidative burst and HR cell death. TA-mediated activation of the EDS1/PAD4 pathway occurred independently of ROS production [38]. Based on these results, the EDS1/PAD4-dependent pathway appears as a possible candidate to mediate TA-induced PCD. In Arabidopsis seedlings, TA induces the expression of EDS1/PAD4 dependent genes, such as FMO1, EDS1, PAD4, SAG101, and PR1 [38]. Yet, none of these genes were upregulated in Arabidopsis cell cultures during the induction of PDC by TA [50], which suggests that the EDS1/PAD4-mediated pathway was not activated during this process. However, we cannot exclude the possibility that these divergent results are due to differences in experimental conditions. Further experiments will be necessary to determine whether the EDS1/PAD4-mediated pathway is involved or not in TA-induced PCD in Arabidopsis cell suspensions.
We then investigated whether increasing ROS levels could promote cell survival. To test this hypothesis, we added H2O2 to cell suspensions to simulate increased ROS production before the addition of TA. The percentage of cell death after TA addition was significantly reduced in cells that had been pre-treated for 3 h with 1 mM H2O2 (Figure 3). This suggests that reduced H2O2 production in the presence of TA negatively affects cell survival. This also shows that H2O2 plays a role in controlling cell sensitivity to TA and its ability to induce cell death. Previous work using the TA resistant mutant txr1-1 has provided some indirect evidence that increased ROS accumulation may be implicated in the control of resistance to TA in txr1-1 seedlings [36,55]. The txr1-1 mutant (also known as Atpam16-2) is mutated in the mitochondrial gene AtPAM16, which codes for a mitochondrial protein that works as a negative regulator of ROS production [55]. The Atpam16-1 mutant and TA resistant txr1-1/Atpama16-2 mutant show overproduction of ROS in leaf tissues and enhanced immunity [55]. However, how ROS would modulate TA toxicity has not yet been investigated.
In this work, we found that addition of H2O2 was efficient in protecting against TA when added 3 h prior to TA treatment. The fact that H2O2 added to cell suspensions is rapidly degraded, with a half-life of 2 to 5 minutes [56], indicates that the protective effect did not result from the direct interaction of H2O2 and TA molecules but was due to molecular or biochemical changes induced by H2O2. We have shown previously that TA-mediated induction of PCD depends on TA’s ability to inhibit cellulose synthesis, since isoxaben, which is another cellulose biosynthesis inhibitor, also activates a similar PCD [27,50]. Hence, TA-induced cell wall damages and alteration in cell wall integrity are involved in the induction of PCD. Apart from its role as a signaling molecule, H2O2 can activate MAPK signaling cascades, redox-sensitive enzymes, and transcription factors [6]. It can also modify the plant cell wall. In particular, H2O2 is involved in the peroxidase-mediated cross-linking of cell-wall polymers that leads to cell wall stiffening [12,13]. Production and assembly of secondary cell wall components, such as lignin and suberin, also depend on H2O2 [57,58]. These changes were proposed to maintain cell wall integrity that can be compromised by cell wall damages, such as those induced by inhibition of cellulose synthesis [59]. Accordingly, we hypothesized that TA and H2O2 may both cause changes in the cell wall rigidity that may be decisive for cell survival.
We used AFM–based force microscopy to measure changes in cell wall stiffness induced by TA and H2O2 in Arabidopsis cell suspensions, as described before [46]. In comparison to control cells, TA-treated cells presented an important decrease in cell wall stiffness correlating with inhibition of cellulose biosynthesis (Figure 4a,c). In contrast, the addition of 1 mM H2O2 increased cell wall stiffness (Figure 4b), with half of Young’s modulus values over 0.5 MPa compared to 29% for control cells and 9% for TA-treated cells. Cell wall stiffening induced by H2O2 may be the result of peroxidase-mediated cross-linking of various compounds, such as polysaccharide-linked ferulates (bound to lignin or not), extensins, and lignin monomers [13,60]. It was suggested that changes in H2O2 concentration may shift peroxidase activity from an extensin cross-linking activity to another function [61]. The degree of pectin methylesterification is another key element in the control of cell wall stiffness. H2O2 can also induce changes in pectin content and de-methylesterification [14], which suggests that H2O2 mediated pectin modifications may also contribute to cell wall stiffening [62].
The H2O2-mediated increase in cell wall rigidity was not altered by the subsequent addition of TA (Figure 4d). This indicates that H2O2 induced changes in the cell wall organization or composition that prevented or compensated for cell wall mechanical alterations induced by TA. Consequently, we suggest that reinforcement of the cell wall mediated by H2O2 may, at least partially, halt the induction of cell death in response to TA either by protecting cells from cell wall damage or by maintaining cell wall integrity. However, we cannot exclude the possibility that the signaling role of H2O2 also contributes to the inhibition of TA-induced PCD. Additional studies will be required to evaluate these possibilities.
In the context of a plant-pathogen interaction, reduction in ROS production by TA may be useful for the pathogen to promote infection. S. scabies infects young developing potato tubers mainly through wounds, lenticels, or directly through cells of the nascent periderm [31,35,63]. Secretion of TA perturbs plant cell wall synthesis and reduces ROS production, which decreases overall cell wall rigidity. This, in turn, could facilitate S. scabies direct entry through cells. As a defense response against S. scabies infection, potato tubers synthesize new cork-like cells embedded with suberin to slow down S. scabies invasion. Since ROS are necessary for the assembly of suberin [58,64], inhibiting ROS production may delay the construction of the suberin barrier that protects potato tubers against S. scabies, which increases infection.

4. Material and Methods

4.1. Plant Material and Treatments

Cell suspension cultures of A. thaliana accession Landsberg erecta derived from stem explants (line PDB-D, Arabidopsis Biological Resource Center-ABRC) were graciously provided by Dr. Jean Rivoal [65]. Unless otherwise indicated, all chemicals were purchased from Sigma Aldrich. Cell suspensions were grown in 45 mL Murashige and Skoog (MS) medium (pH 5.7) supplemented with B5 vitamins and 1 mg L−1 2,4-dichlorophenoxyacetic acid (2,4-D) in 125 mL Erlenmeyer flasks kept on a rotary shaker (120 rpm) at 22 °C in the dark. Arabidopsis cell cultures were sub-cultured weekly by diluting 15 mL cells into fresh medium. Treatments were performed using 10 mL log-phase cells 3 to 4 days after subculture. Thaxtomin A (TA) was prepared as described before [27]. TA (stock of 1 mM) was prepared in methanol and added at a final concentration of 1 µM. The same volume of methanol (0.1% of final volume) was added to the control cells. H2O2 was diluted in water at a concentration of 1 M and added to cell suspensions at a final concentration of 1 or 10 mM. To investigate the effect of H2O2 on the induction of cell death by TA, H2O2 was added 0, 3, or 6 h prior to TA treatment.

4.2. Cell Death Assay

Cell death was assessed using trypan blue staining, as described before [27]. For each experimental condition, at least 500 cells were counted. Each experiment was repeated at least three times.

4.3. ROS Visualization in Cell Cultures

For microscopic evaluation of ROS production, cells were incubated for 30 min in a phosphate buffer solution (PBS) containing 10 µM H2DCFDA (2’,7’-dichlorodihydrofluorescein diacetate) and then washed twice with PBS before mounting in medium containing 2.78 µM propidium iodide (PI, [66]). Images were taken with a Zeiss Imager Z1 microscope (Carl Zeiss Canada Ltd., Ontario, Canada) equipped with a monochromatic camera using AxioVision 4.8.2 version. Aliquots of 40 µL of cell culture were examined using an excitation wavelength of 488 nm (H2DCFDA) and 535 nm (PI). H2DCFDA fluorescence was detected in the presence of ROS in cells with an FITC filter (520 nm). Dead cells labelled by PI were visualized using a rhodamine filter (617 nm).

4.4. Quantification of H2O2

Cell cultures were treated for 24 h with 0.1% methanol (control), TA (10 µM), or heated at 45 °C for 30 min (positive control [19]). Quantification of H2O2 in cell extracts was performed using a modified ferrous ammonium sulphate/xylenol orange (FOX) method [43,44]. Samples of filtered cell cultures (0.1 g) were powdered in liquid nitrogen and homogenized in a balanced salt solution [44]. After centrifugation, 100 µL of supernatant were mixed with 0.9 mL of reaction solution (250 mM ammonium ferrous sulphate, 100 mM xylenol orange, and 100 mM sorbitol in 25 mM H2SO4) and incubated at room temperature for 30 min. Absorbance at 560 nm was determined. Concentration of H2O2 was calculated using a standard curve and expressed as the equivalent µmol of H2O2 per mg of cells (fresh weight).

4.5. Antioxidant Enzymes Activity Assays

Catalase (CAT) activity was assayed using a protocol modified from Aebi, 1984 [67]. Additionally, 0.1 g of filtered cell cultures were ground in liquid nitrogen and resuspended in 1.5 mL homogenization buffer (50 mM Tris-HCL, 0.1 mM EDTA, 0.2% TritonX-100, 1 mM PMSF, 2 mM DTT). After centrifugation, 70 µL aliquots were taken from the supernatant. Each aliquot was added to a quartz cuvette containing 920 µL assay buffer (50 mM sodium phosphate buffer, pH 7.0, 0.1 mM EDTA). The reaction was initiated by adding 10 µL of 3% (v/v) H2O2 or 10 µL of ddH20 (blank). Absorbance at 240 nm was measured every 10 s for 3 min to quantify the decrease in concentration of H2O2. Enzyme activity was calculated using the H2O2 extinction coefficient (E) = 39.4 M−1 cm−1.
Ascorbate peroxidase (APX) activity was determined using a protocol adapted from Nakano and Asada, 1981 [68]. Furthermore, 0.1 g of filtered cell cultures were ground in liquid nitrogen and resuspended in 1.5 mL extraction buffer (50 mM sodium phosphate buffer, pH 7.0, 2% polyvinylpolypyrrolidone (PVPP), 0.1 mM ethylenediaminetetraacetic acid (EDTA), 2 mM ascorbate). After centrifugation, 100 µL aliquots were taken from the supernatant. Each aliquot was added to a quartz cuvette containing 600 µL of 50 mM potassium phosphate buffer, 100 µL 1 mM EDTA, and 100 µL ascorbate. The reaction was started by adding 100 µL of 0.1 mM H2O2 or 100 µL ddH20 (blank). Absorbance was measured continuously for 3 min at 290 nm to evaluate the reduction in ascorbate. APX activity was calculated using the extinction coefficient of ascorbate (E) = 2.8 mM−1 cm−1.
To measure superoxide dismutase (SOD) activity, we used a modified protocol from Beauchamp and Fridovich, 1971 [69]. Furthermore, 0.1 g of filtered cell cultures were ground in liquid nitrogen and resuspended in 1.5 mL homogenization buffer (50 mM sodium phosphate buffer, pH 7.8, 1 mM EDTA, 2% (w/v) PVPP). After centrifugation, aliquots of 200 µL were taken from the supernatant. The reaction mixture (50 mM phosphate buffer, pH 7.8, 33 µM nitro-blue tetrazolium (NBT), 10 mM L-methionine, 0.66 mM EDTA, 0.0033 mM of Riboflavin added just before the assay) was filtered and kept in the dark. Each aliquot was added to a final volume of 3.2 mL of the reaction mixture. Samples were prepared and kept in the dark until all sets were ready. Control and samples were illuminated with a luminescent lamp for 10 min before reading the absorbance at 560 nm. The extinction at 560 nm was read against the blank. One unit of SOD was defined as the amount of sample causing a 50% inhibition of the photoreduction.

4.6. Cell Surface Mechanics

The elastic modulus (Young’s modulus) of individual cells was quantified from force/tip-sample separation curves recorded using atomic force microscopy (AFM). Cell cultures were pre-treated for 24 h with 0.1% methanol (control), TA, H2O2, or a combination of both, as described above. Turgescent cells kept in liquid culture medium were used for this analysis, since plasmolysis can mimic the cellular response to cell wall damage [70,71] and alter the induction of PCD. A 40 µL-aliquot of cells was laid on a poly-l-lysine (0.1 mg mL−1) coated slide cover slip for 5 min to allow adhesion. The cover slip was washed three times with culture medium and fixed with a minute drop of vacuum grease in a small petri dish containing 2 mL of culture medium. AFM analysis was conducted in contact mode as described before [46] using a JPK instrument NanoWizard® 4 V.6 (Berlin, Germany) mounted on top of an inverted Zeiss imager Z1 microscope (Carl Zeiss Canada Ltd., Ontario, Canada). We used the MLCT cantilever A with a nominal spring constant of 0.07 N/m (Bruker AFM probes, Camarillo, CA, USA). We obtained spring constants for this cantilever typically ranging from 0.05 to 0.11 N/m using the thermal noise technique [72]. We calculated the Young’s modulus using the Hertz model adapted for a four-sided pyramid indenter, built-in the JPK analysis software. The Young’s modulus of the glass cover slip was considered infinitely rigid when compared to that of the measured cells. All studies were carried at room temperature. Force-curves were recorded at five different arbitrary locations in a 5-μm radius over the cell surface leading to five batches of 30 to 50 points per cell. We used 3 to 4 cells per experiment and each experiment was repeated 3 times.

4.7. Statistics

Statistical analysis was performed with GraphPad Prism 7. For the measurements of cell death, at least 500 cells were counted in groups of 100 or 500 cells for one experiment. Each experiment was repeated at least three times. Data was analyzed using the t-test or one-way ANOVA for each time point, as indicated. Results were considered statistically different when the p-value was <0.05.

5. Conclusions

In Arabidopsis cell cultures, TA-induced cell death was associated with a decreased ROS accumulation that was not due to the activation of antioxidant CAT, APX, and SOD enzyme activity. However, other proteins or compounds could be involved in scavenging ROS after TA treatment. Perturbation of ROS production by TA may alter cellular redox homeostasis or activate signaling pathways that induce cell death. It can also prevent various H2O2-dependent cell wall modifications known to strengthen the cell wall. Hence, when exogenous H2O2 was added to cells prior to TA-treatment, the level of cell death was significantly decreased, which suggests that TA’s inhibitory effect on the production of ROS may contribute to the induction of cell death. While H2O2 treatment was shown to increase cell wall stiffness, TA treatment had the opposite effect. Moreover, alleviation of TA-induced cell death by H2O2 pretreatment was associated with cell wall stiffening. We suggest that H2O2 protection against TA-induced PCD could be, at least partially, due to the H2O2-mediated increase in rigidity of the cell wall, which could prevent or compensate for cell wall damages induced by TA.

Supplementary Materials

The following are available online at https://www.mdpi.com/2223-7747/8/9/332/s1, Supplementary Figure S1: Effect of 0.1% methanol on Arabidopsis thaliana cell suspensions viability. Supplementary Figure S2: Induction of cell death in response to thaxtomin A, H2O2, and a combination of both.

Author Contributions

Conceptualization, F.A. and N.B. Methodology, F.A. and N.B. Validation, F.A. and N.B. Formal analysis, F.A., N.B., and M.G. Investigation, F.A. and G.B. Resources, N.B. and M.G. Data curation, F.A. Writing—Original draft preparation, F.A. and N.B. Writing—Review and editing, F.A., G.B., N.B., and M.G. Visualization, F.A. and N.B. Supervision, N.B. Project administration, N.B. Funding acquisition, N.B.

Funding

The National Sciences and Engineering Research Council of Canada (NSERC) grant number 5397 and Faculté des Sciences, Université de Sherbrooke, funded this research.

Conflicts of Interest

The authors declare no conflict of interest. The funders had no role in the design of the study, in the collection, analyses, or interpretation of data, in the writing of the manuscript, or in the decision to publish the results.

References

  1. Mittler, R.; Vanderauwera, S.; Suzuki, N.; Miller, G.; Tognetti, V.B.; Vandepoele, K.; Gollery, M.; Shulaev, V.; Van Breusegem, F. ROS signaling: The new wave? Trends Plant Sci. 2011, 16, 300–309. [Google Scholar] [CrossRef] [PubMed]
  2. Mittler, R. ROS are good. Trends Plant Sci. 2017, 22, 11–19. [Google Scholar] [CrossRef] [PubMed]
  3. Waszczak, C.; Carmody, M.; Kangasjärvi, J. Reactive oxygen species in plant signaling. Annu. Rev. Plant Biol. 2018, 69, 209–236. [Google Scholar] [CrossRef] [PubMed]
  4. Foyer, C.H.; Bloom, A.J.; Queval, G.; Noctor, G. Photorespiratory metabolism: Genes, mutants, energetics, and redox signaling. Annu. Rev. Plant Biol. 2009, 60, 455–484. [Google Scholar] [CrossRef] [PubMed]
  5. Caverzan, A.; Casassola, A.; Brammer, S.P. Reactive oxygen species and antioxidant enzymes involved in plant tolerance to stress. In Abiotic and Biotic Stress in Plants-Recent Advances and Future Perspectives; IntechOpen: London, UK, 2016. [Google Scholar]
  6. Petrov, V.D.; Van Breusegem, F. Hydrogen peroxide-a central hub for information flow in plant cells. AoB Plants 2012, 2012, pls014. [Google Scholar] [CrossRef] [PubMed]
  7. Niu, L.; Liao, W. Hydrogen peroxide signaling in plant development and abiotic responses: Crosstalk with nitric oxide and calcium. Front. Plant Sci. 2016, 7, 230. [Google Scholar] [CrossRef]
  8. Pei, Z.-M.; Murata, Y.; Benning, G.; Thomine, S.; Klüsener, B.; Allen, G.J.; Grill, E.; Schroeder, J.I. Calcium channels activated by hydrogen peroxide mediate abscisic acid signalling in guard cells. Nature 2000, 406, 731. [Google Scholar] [CrossRef] [PubMed]
  9. Barba-Espin, G.; Diaz-Vivancos, P.; Job, D.; Belghazi, M.; Job, C.; Hernandez, J.A. Understanding the role of H2O2 during pea seed germination: A combined proteomic and hormone profiling approach. Plant Cell Environ. 2011, 34, 1907–1919. [Google Scholar] [CrossRef] [PubMed]
  10. Foreman, J.; Demidchik, V.; Bothwell, J.H.; Mylona, P.; Miedema, H.; Torres, M.A.; Linstead, P.; Costa, S.; Brownlee, C.; Jones, J.D.; et al. Reactive oxygen species produced by NADPH oxidase regulate plant cell growth. Nature 2003, 422, 442–446. [Google Scholar] [CrossRef] [PubMed]
  11. Potocký, M.; Jones, M.A.; Bezvoda, R.; Smirnoff, N.; Žárský, V. Reactive oxygen species produced by NADPH oxidase are involved in pollen tube growth. New Phytol. 2007, 174, 742–751. [Google Scholar] [CrossRef]
  12. Lin, C.C.; Kao, C.H. Cell wall peroxidase activity, hydrogen peroxide level and NaCl-inhibited root growth of rice seedlings. Plant Soil 2001, 230, 135–143. [Google Scholar] [CrossRef]
  13. Passardi, F.; Penel, C.; Dunand, C. Performing the paradoxical: How plant peroxidases modify the cell wall. Trends Plant Sci. 2004, 9, 534–540. [Google Scholar] [CrossRef] [PubMed]
  14. Xiong, J.; Yang, Y.; Fu, G.; Tao, L. Novel roles of hydrogen peroxide (H2O2) in regulating pectin synthesis and demethylesterification in the cell wall of rice (Oryza sativa) root tips. New Phytol. 2015, 206, 118–126. [Google Scholar] [CrossRef] [PubMed]
  15. Francoz, E.; Ranocha, P.; Nguyen-Kim, H.; Jamet, E.; Burlat, V.; Dunand, C. Roles of cell wall peroxidases in plant development. Phytochemistry 2015, 112, 15–21. [Google Scholar] [CrossRef] [PubMed]
  16. Sagi, M.; Fluhr, R. Production of reactive oxygen species by plant NADPH oxidases. Plant Physiol. 2006, 141, 336–340. [Google Scholar] [CrossRef] [PubMed]
  17. Cona, A.; Rea, G.; Angelini, R.; Federico, R.; Tavladoraki, P. Functions of amine oxidases in plant development and defence. Trends Plant Sci. 2006, 11, 80–88. [Google Scholar] [CrossRef] [PubMed]
  18. O’Brien, J.A.; Daudi, A.; Butt, V.S.; Bolwell, G.P. Reactive oxygen species and their role in plant defence and cell wall metabolism. Planta 2012, 236, 765–779. [Google Scholar] [CrossRef] [PubMed]
  19. Volkov, R.A.; Panchuk, I.I.; Mullineaux, P.M.; Schoffl, F. Heat stress-induced H2O2 is required for effective expression of heat shock genes in Arabidopsis. Plant Mol. Biol. 2006, 61, 733–746. [Google Scholar] [CrossRef] [PubMed]
  20. Orozco-Cárdenas, M.L.; Narváez-Vásquez, J.; Ryan, C.A. Hydrogen peroxide acts as a second messenger for the induction of defense genes in tomato plants in response to wounding, systemin, and methyl jasmonate. Plant Cell 2001, 13, 179–191. [Google Scholar] [CrossRef]
  21. Yang, Y.; Xu, S.; An, L.; Chen, N. NADPH oxidase-dependent hydrogen peroxide production, induced by salinity stress, may be involved in the regulation of total calcium in roots of wheat. J. Plant Physiol. 2007, 164, 1429–1435. [Google Scholar] [CrossRef]
  22. Torres, M.A.; Dangl, J.L.; Jones, J.D. Arabidopsis gp91phox homologues AtrbohD and AtrbohF are required for accumulation of reactive oxygen intermediates in the plant defense response. Proc. Natl. Acad. Sci. USA 2002, 99, 517–522. [Google Scholar] [CrossRef] [PubMed]
  23. Choi, H.W.; Kim, Y.J.; Lee, S.C.; Hong, J.K.; Hwang, B.K. Hydrogen peroxide generation by the pepper extracellular peroxidase CaPO2 activates local and systemic cell death and defense response to bacterial pathogens. Plant Physiol. 2007, 145, 890–904. [Google Scholar] [CrossRef] [PubMed]
  24. Mellersh, D.G.; Foulds, I.V.; Higgins, V.J.; Heath, M.C. H2O2 plays different roles in determining penetration failure in three diverse plant–fungal interactions. Plant J. 2002, 29, 257–268. [Google Scholar] [CrossRef] [PubMed]
  25. Van Breusegem, F.; Dat, J.F. Reactive oxygen species in plant cell death. Plant Physiol. 2006, 141, 384–390. [Google Scholar] [CrossRef] [PubMed]
  26. Desikan, R.; Reynolds, A.; Hancock, J.T.; Neill, S.J. Harpin and hydrogen peroxide both initiate programmed cell death but have differential effects on defence gene expression in Arabidopsis suspension cultures. Biochem. J. 1998, 330, 115–120. [Google Scholar] [CrossRef] [PubMed]
  27. Duval, I.; Brochu, V.; Simard, M.; Beaulieu, C.; Beaudoin, N. Thaxtomin A induces programmed cell death in Arabidopsis thaliana suspension-cultured cells. Planta 2005, 222, 820–831. [Google Scholar] [CrossRef] [PubMed]
  28. Errakhi, R.; Dauphin, A.; Meimoun, P.; Lehner, A.; Reboutier, D.; Vatsa, P.; Briand, J.; Madiona, K.; Rona, J.P.; Barakate, M.; et al. An early Ca2+ influx is a prerequisite to thaxtomin A-induced cell death in Arabidopsis thaliana cells. J. Exp. Bot. 2008, 59, 4259–4270. [Google Scholar] [CrossRef] [PubMed]
  29. King, R.R.; Lawrence, C.H.; Calhoun, L.A. Chemistry of phytotoxins associated with Streptomyces scabies, the causal organism of potato common scab. J. Agric. Food. Chem. 1992, 40, 834–837. [Google Scholar] [CrossRef]
  30. King, R.R.; Lawrence, C.H.; Clark, M.C. Correlation of phytotoxin production with pathogenicity of Streptomyces scabies isolates from scab infected potato tubers. Am. Potato J. 1991, 68, 675–680. [Google Scholar] [CrossRef]
  31. Loria, R.; Bignell, D.R.; Moll, S.; Huguet-Tapia, J.C.; Joshi, M.V.; Johnson, E.G.; Seipke, R.F.; Gibson, D.M. Thaxtomin biosynthesis: The path to plant pathogenicity in the genus Streptomyces. Antonie van Leeuwenhoek 2008, 94, 3–10. [Google Scholar] [CrossRef]
  32. Goyer, C.; Vachon, J.; Beaulieu, C. Pathogenicity of Streptomyces scabies mutants altered in thaxtomin A production. Phytopathology 1998, 88, 442–445. [Google Scholar] [CrossRef]
  33. Healy, F.G.; Wach, M.; Krasnoff, S.B.; Gibson, D.M.; Loria, R. The txtAB genes of the plant pathogen Streptomyces acidiscabies encode a peptide synthetase required for phytotoxin thaxtomin A production and pathogenicity. Mol. Microbiol. 2000, 38, 794–804. [Google Scholar] [CrossRef]
  34. Lawrence, C.H.; Clark, M.C.; King, R.R. Induction of common scab symptoms in aseptically cultured potato tubers by the vivotoxin, thaxtomin. Phytopathology 1990, 80, 606–608. [Google Scholar] [CrossRef]
  35. Loria, R.; Coombs, J.; Yoshida, M.; Kers, J.; Bukhalid, R. A paucity of bacterial root diseases: Streptomyces succeeds where others fail. Physiol. Mol. Plant Pathol. 2003, 62, 65–72. [Google Scholar] [CrossRef]
  36. Scheible, W.R.; Fry, B.; Kochevenko, A.; Schindelasch, D.; Zimmerli, L.; Somerville, S.; Loria, R.; Somerville, C.R. An Arabidopsis mutant resistant to thaxtomin A, a cellulose synthesis inhibitor from Streptomyces species. Plant Cell 2003, 15, 1781–1794. [Google Scholar] [CrossRef]
  37. Tegg, R.S.; Shabala, S.N.; Cuin, T.A.; Davies, N.W.; Wilson, C.R. Enhanced resistance to the cellulose biosynthetic inhibitors, thaxtomin A and isoxaben in Arabidopsis thaliana mutants, also provides specific co-resistance to the auxin transport inhibitor, 1-NPA. BMC Plant Biol. 2013, 13, 76. [Google Scholar] [CrossRef]
  38. Joglekar, S.; Suliman, M.; Bartsch, M.; Halder, V.; Maintz, J.; Bautor, J.; Zeier, J.; Parker, J.E.; Kombrink, E. Chemical activation of EDS1/PAD4 signaling leading to pathogen resistance in Arabidopsis. Plant Cell Physiol. 2018, 59, 1592–1607. [Google Scholar] [CrossRef]
  39. Rustérucci, C.; Aviv, D.H.; Holt, B.F.; Dangl, J.L.; Parker, J.E. The disease resistance signaling components EDS1 and PAD4 are essential regulators of the cell death pathway controlled by LSD1 in Arabidopsis. Plant Cell 2001, 13, 2211–2224. [Google Scholar] [CrossRef]
  40. Straus, M.R.; Rietz, S.; Ver Loren van Themaat, E.; Bartsch, M.; Parker, J.E. Salicylic acid antagonism of EDS1-driven cell death is important for immune and oxidative stress responses in Arabidopsis. Plant J. 2010, 62, 628–640. [Google Scholar] [CrossRef]
  41. Cui, H.; Gobbato, E.; Kracher, B.; Qiu, J.; Bautor, J.; Parker, J.E. A core function of EDS1 with PAD4 is to protect the salicylic acid defense sector in Arabidopsis immunity. New Phytol. 2017, 213, 1802–1817. [Google Scholar] [CrossRef]
  42. Gruner, K.; Griebel, T.; Navarova, H.; Attaran, E.; Zeier, J. Reprogramming of plants during systemic acquired resistance. Front. Plant Sci. 2013, 4, 252. [Google Scholar] [CrossRef] [Green Version]
  43. Tran, D.; Dauphin, A.; Meimoun, P.; Kadono, T.; Nguyen, H.T.H.; Arbelet-Bonnin, D.; Zhao, T.; Errakhi, R.; Lehner, A.; Kawano, T.; et al. Methanol induces cytosolic calcium variations, membrane depolarization and ethylene production in arabidopsis and tobacco. Ann. Bot. 2018, 122, 849–860. [Google Scholar] [CrossRef]
  44. Gay, C.; Collins, J.; Gebicki, J.M. Hydroperoxide assay with the ferric–xylenol orange complex. Anal. Biochem. 1999, 273, 149–155. [Google Scholar] [CrossRef]
  45. Wei, H.; Zhang, X.; Wang, Y.; Lebwohl, M. Inhibition of ultraviolet light-induced oxidative events in the skin and internal organs of hairless mice by isoflavone genistein. Cancer. Lett. 2002, 185, 21–29. [Google Scholar] [CrossRef]
  46. Radotić, K.; Roduit, C.; Simonović, J.; Hornitschek, P.; Fankhauser, C.; Mutavdžić, D.; Steinbach, G.; Dietler, G.; Kasas, S. Atomic force microscopy stiffness tomography on living Arabidopsis thaliana cells reveals the mechanical properties of surface and deep cell-wall layers during growth. Biophys. J. 2012, 103, 386–394. [Google Scholar] [CrossRef]
  47. Choudhury, F.K.; Rivero, R.M.; Blumwald, E.; Mittler, R. Reactive oxygen species, abiotic stress and stress combination. Plant J. 2017, 90, 856–867. [Google Scholar] [CrossRef]
  48. Herrera-Vasquez, A.; Salinas, P.; Holuigue, L. Salicylic acid and reactive oxygen species interplay in the transcriptional control of defense genes expression. Front. Plant Sci. 2015, 6, 171. [Google Scholar] [CrossRef]
  49. Huang, S.; Van Aken, O.; Schwarzlander, M.; Belt, K.; Millar, A.H. The roles of mitochondrial reactive oxygen species in cellular signaling and stress sesponse in plants. Plant Physiol. 2016, 171, 1551–1559. [Google Scholar] [CrossRef]
  50. Duval, I.; Beaudoin, N. Transcriptional profiling in response to inhibition of cellulose synthesis by thaxtomin A and isoxaben in Arabidopsis thaliana suspension cells. Plant Cell Rep. 2009, 28, 811–830. [Google Scholar] [CrossRef]
  51. Lerat, S.; Babana, A.H.; El Oirdi, M.; El Hadrami, A.; Daayf, F.; Beaudoin, N.; Bouarab, K.; Beaulieu, C. Streptomyces scabiei and its toxin thaxtomin A induce scopoletin biosynthesis in tobacco and Arabidopsis thaliana. Plant Cell Rep. 2009, 28, 1895–1903. [Google Scholar] [CrossRef]
  52. Chong, J.; Baltz, R.; Schmitt, C.; Beffa, R.; Fritig, B.; Saindrenan, P. Downregulation of a pathogen-responsive tobacco UDP-Glc:phenylpropanoid glucosyltransferase reduces scopoletin glucoside accumulation, enhances oxidative stress, and weakens virus resistance. Plant Cell 2002, 14, 1093–1107. [Google Scholar] [CrossRef] [PubMed]
  53. Handy, D.E.; Loscalzo, J. Responses to reductive stress in the cardiovascular system. Free Radic. Biol. Med. 2017, 109, 114–124. [Google Scholar] [CrossRef] [PubMed]
  54. Wiermer, M.; Feys, B.J.; Parker, J.E. Plant immunity: The EDS1 regulatory node. Curr. Opin. Plant Biol. 2005, 8, 383–389. [Google Scholar] [CrossRef] [PubMed]
  55. Huang, Y.; Chen, X.; Liu, Y.; Roth, C.; Copeland, C.; McFarlane, H.E.; Huang, S.; Lipka, V.; Wiermer, M.; Li, X. Mitochondrial AtPAM16 is required for plant survival and the negative regulation of plant immunity. Nat. Commun. 2013, 4, 2558. [Google Scholar] [CrossRef] [Green Version]
  56. Neill, S.J.; Desikan, R.; Clarke, A.; Hurst, R.D.; Hancock, J.T. Hydrogen peroxide and nitric oxide as signalling molecules in plants. J. Exp. Bot. 2002, 53, 1237–1247. [Google Scholar] [CrossRef] [PubMed]
  57. Kärkönen, A.; Kuchitsu, K. Reactive oxygen species in cell wall metabolism and development in plants. Phytochemistry 2015, 112, 22–32. [Google Scholar] [CrossRef]
  58. Bernards, M.A.; Summerhurst, D.K.; Razem, F.A. Oxidases, peroxidases and hydrogen peroxide: The suberin connection. Phytochem. Rev. 2004, 3, 113–126. [Google Scholar] [CrossRef]
  59. Denness, L.; McKenna, J.F.; Segonzac, C.; Wormit, A.; Madhou, P.; Bennett, M.; Mansfield, J.; Zipfel, C.; Hamann, T. Cell wall damage-induced lignin biosynthesis is regulated by a reactive oxygen species- and jasmonic acid-dependent process in Arabidopsis. Plant Physiol. 2011, 156, 1364–1374. [Google Scholar] [CrossRef]
  60. Tenhaken, R. Cell wall remodeling under abiotic stress. Front. Plant Sci. 2015, 5, 771. [Google Scholar] [CrossRef]
  61. Price, N.J.; Pinheiro, C.; Soares, C.M.; Ashford, D.A.; Ricardo, C.P.; Jackson, P.A. A biochemical and molecular characterization of LEP1, an extensin peroxidase from lupin. J. Biol. Chem. 2003, 278, 41389–41399. [Google Scholar] [CrossRef]
  62. Levesque-Tremblay, G.; Pelloux, J.; Braybrook, S.A.; Müller, K. Tuning of pectin methylesterification: Consequences for cell wall biomechanics and development. Planta 2015, 242, 791–811. [Google Scholar] [CrossRef] [PubMed]
  63. Braun, S.; Gevens, A.; Charkowski, A.; Allen, C.; Jansky, S. Potato common scab: A review of the causal pathogens, management practices, varietal resistance screening methods, and host resistance. Am. J. Potato Res. 2017, 94, 283–296. [Google Scholar] [CrossRef]
  64. Razem, F.A.; Bernards, M.A. Reactive oxygen species production in association with suberization: Evidence for an NADPH-dependent oxidase. J. Exp. Bot. 2003, 54, 935–941. [Google Scholar] [CrossRef] [PubMed]
  65. Dumont, S.; Bykova, N.V.; Khaou, A.; Besserour, Y.; Dorval, M.; Rivoal, J. Arabidopsis thaliana alcohol dehydrogenase is differently affected by several redox modifications. PLoS ONE 2018, 13, e0204530. [Google Scholar] [CrossRef] [PubMed]
  66. Leshem, Y.; Melamed-Book, N.; Cagnac, O.; Ronen, G.; Nishri, Y.; Solomon, M.; Cohen, G.; Levine, A. Suppression of Arabidopsis vesicle-SNARE expression inhibited fusion of H2O2-containing vesicles with tonoplast and increased salt tolerance. Proc. Natl. Acad. Sci. USA 2006, 103, 18008–18013. [Google Scholar] [CrossRef] [PubMed]
  67. Aebi, H. Catalase in vitro. Methods Enzymol. 1984, 105, 121–126. [Google Scholar] [CrossRef]
  68. Nakano, Y.; Asada, K. Hydrogen peroxide is scavenged by ascorbate-specific peroxidase in spinach chloroplasts. Plant Cell Physiol. 1981, 22, 867–880. [Google Scholar] [CrossRef]
  69. Beauchamp, C.; Fridovich, I. Superoxide dismutase: Improved assays and an assay applicable to acrylamide gels. Anal. Biochem. 1971, 44, 276–287. [Google Scholar] [CrossRef]
  70. Feraru, E.; Feraru, M.I.; Kleine-Vehn, J.; Martiniere, A.; Mouille, G.; Vanneste, S.; Vernhettes, S.; Runions, J.; Friml, J. PIN polarity maintenance by the cell wall in Arabidopsis. Curr. Biol. 2011, 21, 338–343. [Google Scholar] [CrossRef]
  71. Tolmie, F.; Poulet, A.; McKenna, J.; Sassmann, S.; Graumann, K.; Deeks, M.; Runions, J. The cell wall of Arabidopsis thaliana influences actin network dynamics. J. Exp. Bot. 2017, 68, 4517–4527. [Google Scholar] [CrossRef]
  72. Hutter, J.L.; Bechhoefer, J. Calibration of atomic-force microscope tips. Rev. Sci. Instrum. 1993, 64, 1868–1873. [Google Scholar] [CrossRef]
Figure 1. Detection of a reactive oxygen species (ROS). (a) ROS were detected using H2DCFDA (green) in Arabidopsis suspension cells treated for 24 h with 0.1% methanol (Control) or (b) with 1 µM thaxtomin A (TA). Scale = 100 µm. (c) H2O2 concentration was measured in µmol·mg−1 fresh weight (FW) using a modified FOX assay in cells treated for 24 h with 0.1% methanol (Control), 10 µM thaxtomin A (TA), or at 45 °C for 30 min (Heat stress). Values represent 15 measurements from three independent experiments. The three groups were compared using Dunnett’s multiple comparison test. Different letters indicate statistically significant differences, p < 0.05.
Plants 08 00332 g001
Figure 2. Antioxidant enzyme activity. Arabidopsis cell suspensions were treated with 0.1% methanol (Control) or 1 µM thaxtomin A (TA) for 24 h. (a) Catalase (CAT) activity in µmol ·mg−1 fresh weight (FW)·min−1. Each value is the mean of two samples from three biological replicates ± SD (n = 6). (b) Ascorbate peroxidase (APX) activity in µmol·mg−1 FW·min−1. (c) Superoxide dismutase (SOD) activity in units·g−1 FW. (b) and (c) each value is the mean of three samples per condition ± SD. Data was analyzed using the t-test followed by the Holm-Šídák method with alpha = 0.05. No significant difference was detected (p < 0.05).
Plants 08 00332 g002
Figure 3. Induction of cell death by thaxtomin A and H2O2. Percentage of cell death in Arabidopsis suspension-cultured cells 48 h after treatment with 0.1% methanol (Control, black circle), 1 µM thaxtomin A (TA, red square), 1 mM H2O2 (green triangle), and 3 h-pretreatment with 1 mM H2O2 followed by 1 µM TA (blue inverted triangle). Cells were counted in groups of 500 and the mean ± SD was calculated from three replicates. Data was analyzed using one-way ANOVA. A significant difference with TA treatment for each time point (p < 0.05) is indicated by an asterisk (*).
Plants 08 00332 g003
Figure 4. Measurements of cell wall rigidity by Atomic Force Microscopy (AFM). Force curves were recorded at the surface of three to five cells per condition in order to extract Young’s modulus value. Each graph represents the distribution of the relative frequency (%) of Young’s modulus values measured on the cell surface in each condition. Arabidopsis cell suspension were treated for 24 h with: (a) control (0.1% methanol), (b) 1 mM H2O2, (c) 1 µM thaxtomin A (TA), and (d) pretreated for 3 h with 1 mM H2O2 prior to TA treatment.
Plants 08 00332 g004

