Identification of Genes Differentially Expressed in Response to Cold in Pisum sativum Using RNA Sequencing Analyses


Abstract
:1. Introduction
2. Materials and Methods
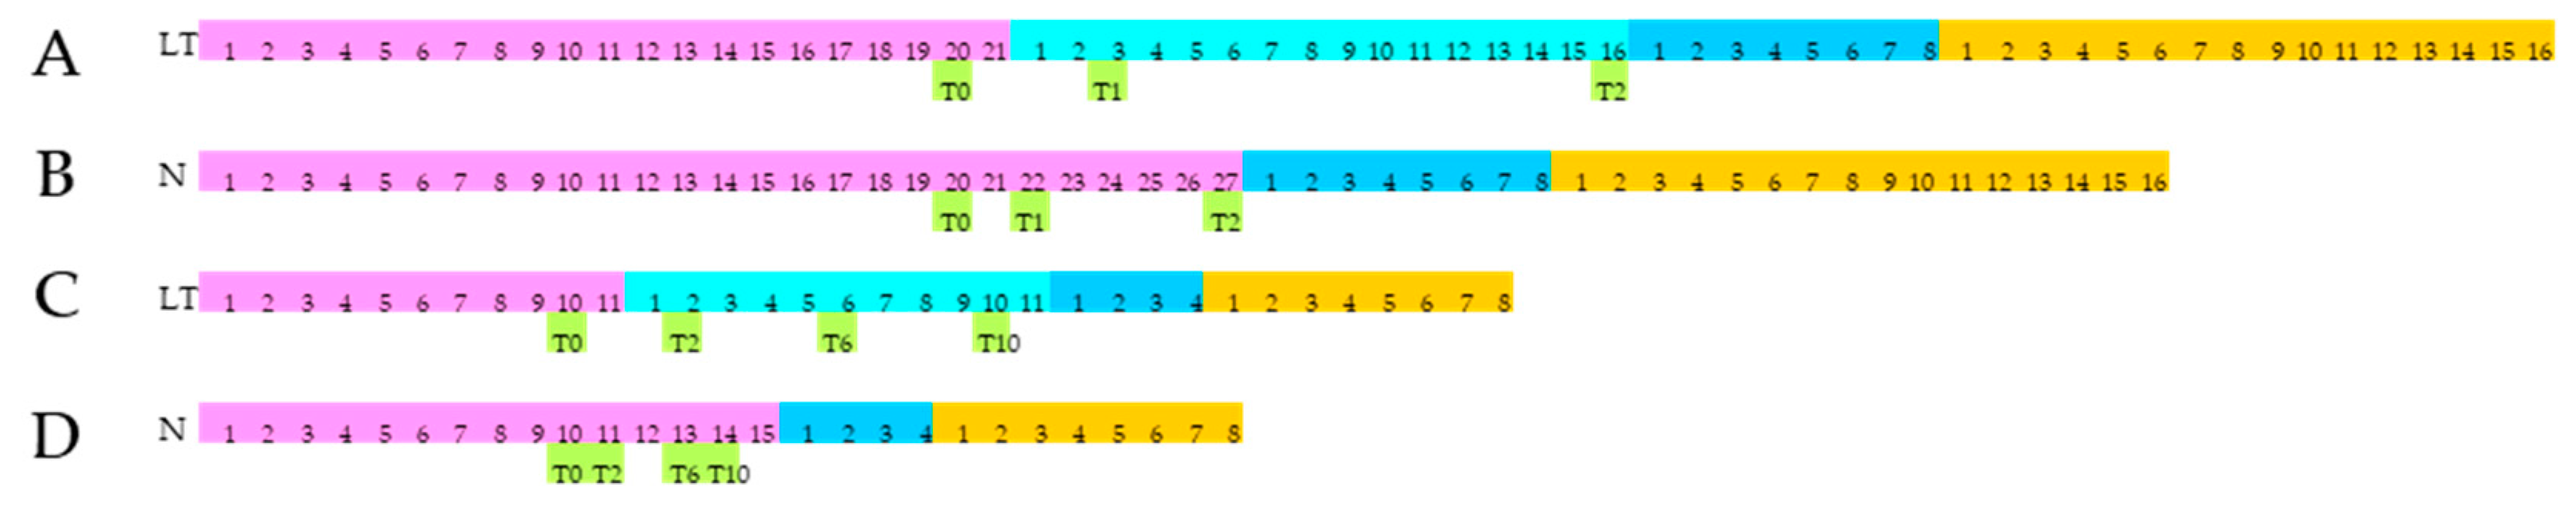
2.1. Plant Materials, Experimental Design, and Cold Stress
2.2. RNA Extraction and High Throughput Sequencing
2.3. RNA-Sequencing Analysis, Assembly, and Annotation
2.4. Differential Expression Analysis and Statistical Tools
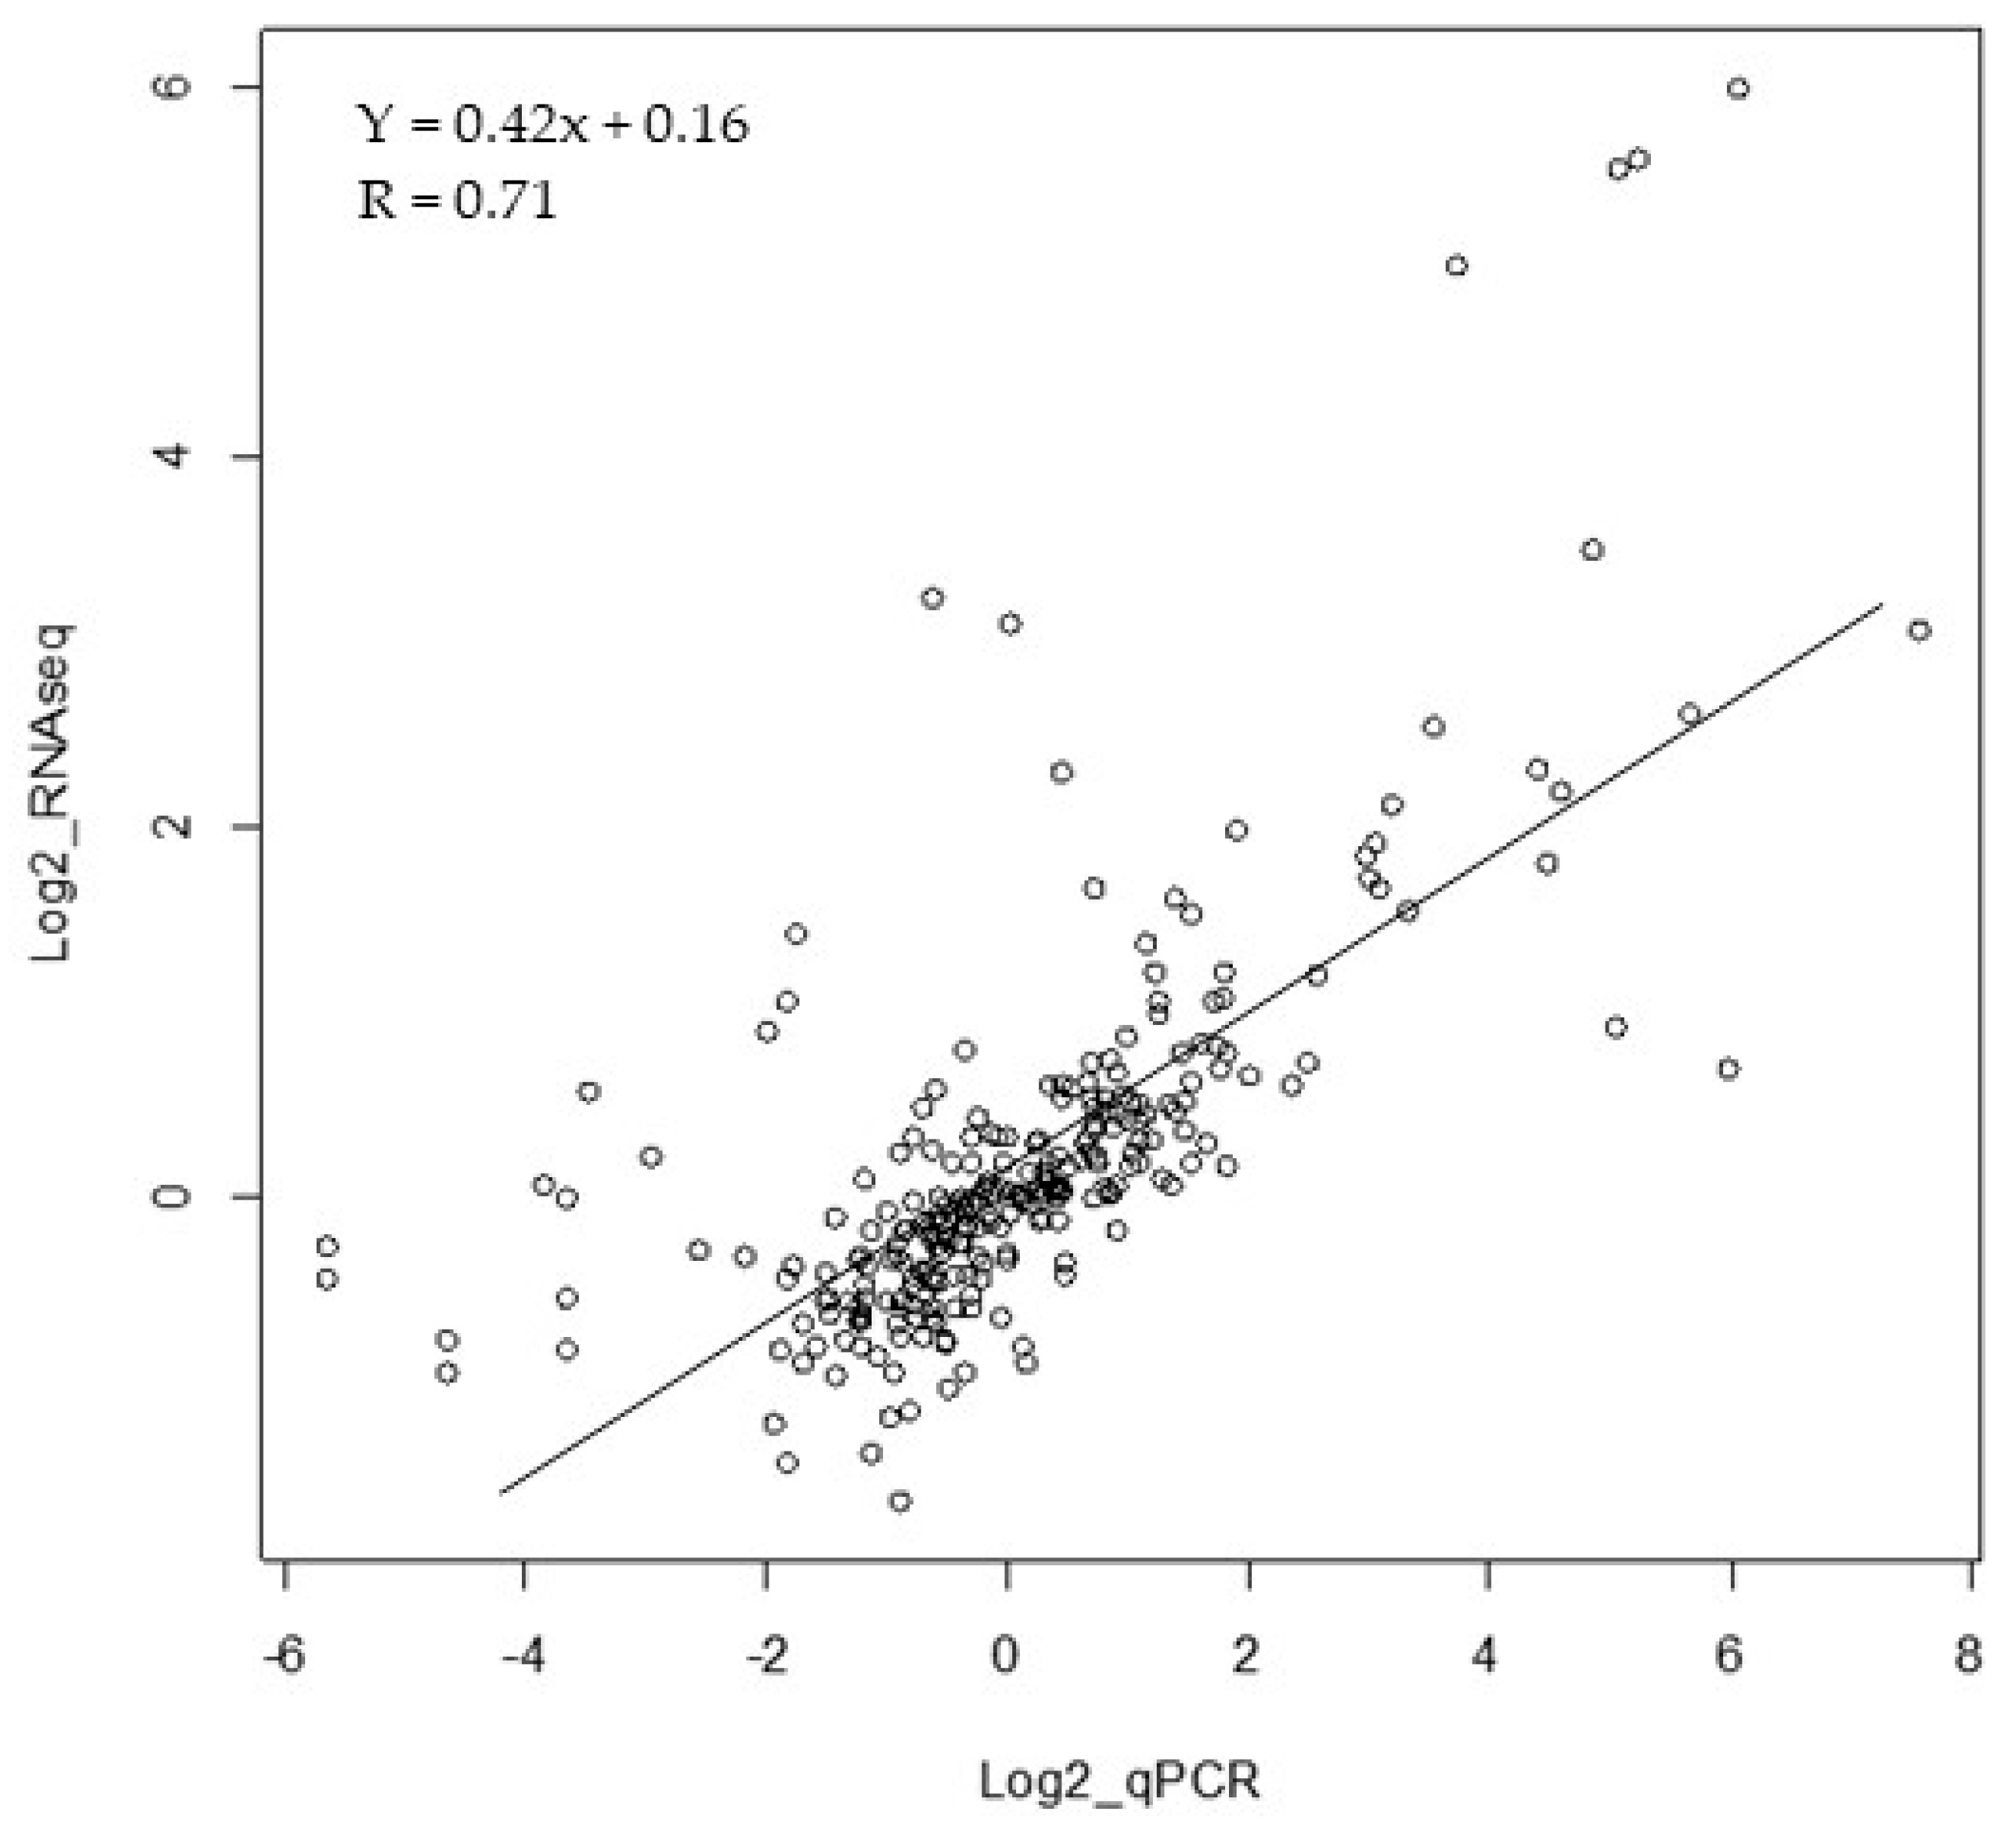
2.5. Statistical Differentially Expressed Genes (DEGs) Corroboration
3. Results
3.1. Samples, Sequencing, and Assembly Assessment
3.2. Differential Expression Analysis and Clustering
3.3. Functional Annotation, Gene Ontology (GO) Term Enrichment, and Kyoto Encyclopedia of Genes and Genomes (KEGG) Pathways
4. Discussion
4.1. Differences in Gene Expression Between The Two Lines Independently of the LT Treatment: Predispositions to Face Cold Stress?
4.2. How Pea Faces Cold Stress
4.2.1. Chilling Response
4.2.2. Champagne Specific Responses to Cold and Acquisition of Freezing Tolerance
5. Conclusions
Supplementary Materials
Author Contributions
Funding
Acknowledgments
Conflicts of Interest
References
- Pennycooke, J.C.; Cheng, H.; Stockinger, E.J. Comparative genomic sequence and expression analyses of Medicago truncatula and alfalfa subspecies falcata COLD-ACCLIMATION-SPECIFIC genes. Plant Physiol. 2008, 146, 1242–1254. [Google Scholar] [CrossRef] [PubMed]
- Carvallo, M.A.; Pino, M.T.; Jeknić, Z.; Zou, C.; Doherty, C.J.; Shiu, S.-H.; Chen, T.H.H.; Thomashow, F. A comparison of the low temperature transcriptomes and CBF regulons of three plant species that differ in freezing tolerance: Solanum commersonii, Solanum tuberosum, and Arabidopsis thaliana. J. Exp. Bot. 2011, 62, 3807–3819. [Google Scholar] [CrossRef] [PubMed]
- Tayeh, N.; Bahrman, N.; Devaux, R.; Bluteau, A.; Prosperi, J.-M.; Delbreil, B.; Lejeune-Hénaut, I. A high-density genetic map of the Medicago truncatula major freezing tolerance QTL on chromosome 6 reveals colinearity with a QTL related to freezing damage on Pisum sativum linkage group VI. Mol. Breed. 2013, 32, 279–289. [Google Scholar] [CrossRef]
- Zhang, L.L.; Zhao, M.G.; Tian, Q.Y.; Zhang, W.H. Comparative studies on tolerance of Medicago truncatula and Medicago falcata to freezing. Planta 2011, 234, 445–457. [Google Scholar] [CrossRef] [PubMed]
- Koornneef, M.; Alonso-Blanco, C.; Vreugdenhil, D. Naturally occurring genetic variation in Arabidopsis thaliana. Ann. Rev. Plant Biol. 2004, 55, 141–172. [Google Scholar] [CrossRef] [PubMed]
- Maloof, J.N.; Borevitz, J.O.; Dabi, T.; Lutes, J.; Nehring, R.B.; Redfern, J.L.; Trainer, G.T.; Wilson, J.M.; Asami, T.; Berry, C.C.; et al. Natural variation in light sensitivity of Arabidopsis. Nat. Genet. 2001, 29, 441–446. [Google Scholar] [CrossRef] [PubMed]
- Michaels, S.D.; Ditta, G.; Gustafson-Brown, C.; Pelaz, S.; Yanofsky, M.; Amasino, R.M. AGL24 acts as a promoter of flowering in Arabidopsis and is positively regulated by vernalization. Plant J. 2003, 33, 867–874. [Google Scholar] [CrossRef] [PubMed]
- Thomashow, M.F. Plant cold acclimation: Freezing tolerance genes and regulatory mechanisms. Annu. Rev. Plant Physiol. Plant Mol. Biol. 1999, 50, 571–599. [Google Scholar] [CrossRef]
- Levitt, J. Responses of plants to environmental stresses. In Water, Radiation, Salt, and Other Stresses; Academic Press: Cambridge, MA, USA, 1980; Volume 2. [Google Scholar]
- Guy, C.L. Cold acclimation and freezing stress tolerance: Role of protein metabolism. Annu. Rev. Plant Physiol. Plant Mol. Biol. 1990, 41, 187–223. [Google Scholar] [CrossRef]
- Guy, C.; Kaplan, F.; Kopka, J.; Selbig, J.; Hincha, D.K. Metabolomics of temperature stress. Physiol. Plant. 2008, 132, 220–235. [Google Scholar] [CrossRef]
- Ruelland, E.; Vaultier, M.N.; Zachowski, A.; Hurry, V. Cold Signalling and Cold Acclimation in Plants. Adv. Bot. Res. 2009, 49, 35–150. [Google Scholar] [CrossRef]
- Bertrand, A.; Bipfubusa, M.; Claessens, A.; Rocher, S.; Castonguay, Y. Effect of photoperiod prior to cold acclimation on freezing tolerance and carbohydrate metabolism in alfalfa (Medicago sativa L.). Plant Sci. 2017, 264, 122–128. [Google Scholar] [CrossRef] [PubMed]
- Kreps, J.A.; Wu, Y.; Chang, H.-S.; Zhu, T.; Wang, X.; Harper, J.F. Transcriptome Changes for Arabidopsis in Response to Salt, Osmotic, and Cold Stress. Plant Physiol. 2002, 130, 2129–2141. [Google Scholar] [CrossRef] [PubMed]
- Chinnusamy, V.; Ohta, M.; Kanrar, S.; Lee, B.-H.; Hong, X.; Agarwal, M.; Zhu, J.-K. ICE1: A regulator of cold-induced transcriptome and freezing tolerance in Arabidopsis. Genes Dev. 2003, 17, 1043–1054. [Google Scholar] [CrossRef]
- Pang, T.; Ye, C.-Y.; Xia, X.; Yin, W. De novo sequencing and transcriptome analysis of the desert shrub, Ammopiptanthus mongolicus, during cold acclimation using Illumina/Solexa. BMC Genom. 2013, 14, 488. [Google Scholar] [CrossRef]
- Kidokoro, S.; Watanabe, K.; Ohori, T.; Moriwaki, T.; Maruyama, K.; Mizoi, J.; Htwe, N.M.P.S.; Fujita, Y.; Sekita, S.; Shinozaki, K.; et al. Soybean DREB1/CBF-type transcription factors function in heat and drought as well as cold stress-responsive gene expression. Plant J. 2015, 81, 505–518. [Google Scholar] [CrossRef]
- Calzadilla, P.I.; Maiale, S.J.; Ruiz, O.A.; Escaray, F.J. Transcriptome Response Mediated by Cold Stress in Lotus japonicus. Front. Plant Sci. 2016, 7, 374. [Google Scholar] [CrossRef]
- Tan, H.; Huang, H.; Tie, M.; Tang, Y.; Lai, Y.; Li, H. Transcriptome profiling of two Asparagus Bean (Vigna unguiculata subsp. sesquipedalis) cultivars differing in chilling tolerance under cold stress. PLoS ONE 2016, 11, e0151105. [Google Scholar] [CrossRef]
- Bonthala, V.S.; Mayes, K.; Moreton, J.; Blythe, M.; Wrigh, T.V.; May, S.T.; Massawe, F.; Mayes, S.; Twycross, J. Identification of Gene Modules Associated with Low Temperatures Response in Bambara Groundnut by Network-Based Analysis. PLoS ONE 2016, 11, e0148771. [Google Scholar] [CrossRef]
- Miao, Z.; Xu, W.; Li, D.; Hu, X.; Liu, J.; Zhang, R.; Wang, T. De novo transcriptome analysis of Medicago falcata reveals novel insights about the mechanisms underlying abiotic stress-responsive pathway. BMC Genom. 2015, 16, 818. [Google Scholar] [CrossRef]
- Song, L.; Jiang, L.; Chen, Y.; Shu, Y.; Bai, Y.; Guo, C. Deep-sequencing transcriptome analysis of field-grown Medicago sativa L. crown buds acclimated to freezing stress. Funct. Integr. Genom. 2016, 16, 495–511. [Google Scholar] [CrossRef] [PubMed]
- Zhou, Q.; Luo, D.; Chai, X.; Wu, Y.; Wang, Y.; Nan, Z.; Yang, Q.; Liu, W.; Liu, Z. Multiple Regulatory Networks Are Activated during Cold Stress in Medicago sativa L. Int. J. Mol. Sci. 2018, 19, 3169. [Google Scholar] [CrossRef] [PubMed]
- Garg, R.; Bhattacharjee, A.; Jain, M. Genome-scale transcriptomic insights into molecular aspects of abiotic stress responses in chickpea. Plant Mol. Biol. Rep. 2015, 33, 388–400. [Google Scholar] [CrossRef]
- Chinnusamy, V.; Zhu, J.; Zhu, J.-K. Cold stress regulation of gene expression in plants. Trends Plant Sci. 2007, 12, 444–451. [Google Scholar] [CrossRef]
- Lejeune-Hénaut, I.; Delbreil, B.; Devaux, R.; Guilioni, L. Cold temperatures and the functioning of the canopy in pea. In Physiology of the Pea Crop; Science Publishers: Enfield, NH, USA, 2010; pp. 168–181. [Google Scholar]
- Lucau-Danila, A.; Toitot, C.; Goulas, E.; Blervacq, A.-S.; Hot, D.; Bahrman, N.; Sellier, H.; Lejeune-Hénaut, I.; Delbreil, B. Transcriptome analysis in pea allows to distinguish chilling and acclimation mechanisms. Plant Physiol. Biochem. 2012, 58, 236–244. [Google Scholar] [CrossRef] [PubMed]
- Legrand, S.; Marque, G.; Blassiau, C.; Bluteau, A.; Canoy, A.-S.; Fontaine, V.; Jaminon, O.; Bahrman, N.; Mautord, J.; Morin, J.; et al. Combining gene expression and genetic analyses to identify candidate genes involved in cold responses in pea. J. Plant Physiol. 2013, 170, 1148–1157. [Google Scholar] [CrossRef] [PubMed]
- Lejeune-Hénaut, I.; Hanocq, E.; Béthencourt, L.; Fontaine, V.; Delbreil, B.; Morin, J.; Petit, A.; Devaux, R.; Boilleau, M.; Stempniak, J.-J.; et al. The flowering locus Hr colocalizes with a major QTL affecting winter frost tolerance in Pisum sativum L. Theor. Appl. Genet. 2008, 116, 1105–1116. [Google Scholar] [CrossRef]
- Bonhomme, R. Bases and limits to using “degree.day” units. Eur. J. Agron. 2000, 13, 1–10. [Google Scholar] [CrossRef]
- Andrews, S. FastQC: A Quality Control Tool for High Throughput Sequence Data. 2010. Available online: http://www.bioinformatics.babraham.ac.uk/projects/fastqc/ (accessed on 12 August 2019).
- Martin, M. Cutadapt removes adapter sequences from high-throughput sequencing reads. EMBnet. J. 2011, 17, 10–12. [Google Scholar] [CrossRef]
- Schmieder, R.; Edwards, R. Quality control and preprocessing of metagenomic datasets. Bioinformatics 2011, 27, 863–864. [Google Scholar] [CrossRef] [Green Version]
- Grabherr, M.G.; Haas, B.J.; Yassour, M.; Levin, J.Z.; Thompson, D.A.; Amit, I.; Adiconis, X.; Fan, L.; Raychowdhury, R.; Zeng, Q.; et al. Trinity: Reconstructing a full-length transcriptome without a genome from RNA-Seq data. Nat. Biotechnol. 2011, 29, 644–652. [Google Scholar] [CrossRef] [PubMed]
- Smith-Unna, R.; Boursnell, C.; Patro, R.; Hibberd, J.M.; Kelly, S. TransRate: Referance-free quality asssessment of de novo transcriptome assemblies. Genome Res. 2016, 26, 1134–1144. [Google Scholar] [CrossRef] [PubMed]
- Gurevich, A.; Saveliev, V.; Vyahhi, N.; Tesler, G. QUAST: Quality assessment tool for genome assemblies. Bioinformatics 2013, 29, 1072–1075. [Google Scholar] [CrossRef] [PubMed]
- Altschul, S.F.; Gish, W.; Miller, W.; Myers, E.W.; Lipman, D.J. Basic local alignment search tool. J. Mol. Biol. 1990, 215, 403–410. [Google Scholar] [CrossRef]
- Li, J.; Liu, H.; Xia, W.; Mu, J.; Feng, Y.; Liu, R.; Yan, P.; Wang, A.; Lin, Z.; Guo, Y.; et al. De Novo Transcriptome Sequencing and the Hypothetical Cold Response Mode of Saussurea involucrata in Extreme Cold Environments. Int. J. Mol. Sci. 2017, 18, 1155. [Google Scholar] [CrossRef] [PubMed]
- Chinnusamy, V.; Zhu, J.-K.; Sunkar, R. Gene regulation during cold stress acclimation in plants. Methods Mol. Biol. 2010, 639, 39–55. [Google Scholar] [CrossRef] [PubMed]
- Huang, X.; Zhang, Y.; Zhang, X.; Shi, Y. Long-chain base kinase1 affects freezing tolerance in Arabidopsis thaliana. Plant Sci. 2017, 259, 94–103. [Google Scholar] [CrossRef]
- Pareek, A.; Khurana, A.; Sharma, A.; Kumar, R. An overview of signaling regulons during cold stress tolerance in plants. Curr. Genom. 2017, 18, 498–511. [Google Scholar] [CrossRef]
- Ye, Y.; Ding, Y.; Jiang, Q.; Wang, F.; Sun, J.; Zhu, C. The role of receptor-like protein kinases (RLKs) in abiotic stress response in plants. Plant Cell Rep. 2017, 36, 235–242. [Google Scholar] [CrossRef]
- Nakashima, K.; Yamaguchi-Shinozaki, K.; Shinozaki, K. The transcriptional regulatory network in the drought response and its crosstalk in abiotic stress responses including drought, cold, and heat. Front. Plant Sci. 2014, 5, 170. [Google Scholar] [CrossRef] [Green Version]
- Huang, G.-T.; Ma, S.-L.; Bai, L.-P.; Zhang, L.; Ma, H.; Jia, P.; Liu, J.; Zhong, M.; Guo, Z.-F. Signal transduction during cold, salt, and drought stresses in plants. Mol. Biol. Rep. 2012, 39, 969–987. [Google Scholar] [CrossRef] [PubMed]
- Janská, A.; Maršík, P.; Zelenková, S.; Ovesná, J. Cold stress and acclimation—What is important for metabolic adjustment? Plant Biol. 2010, 12, 395–405. [Google Scholar] [CrossRef] [PubMed]
- Miura, K.; Furumoto, T. Cold Signaling and Cold Response in Plants. Int. J. Mol. Sci. 2013, 14, 5312–5337. [Google Scholar] [CrossRef] [PubMed] [Green Version]
- Zheng, Y.; Jiao, C.; Sun, H.; Rosli, H.G.; Pombo, M.A.; Zhang, P.; Banf, M.; Dai, X.; Martin, G.B.; Giovannoni, J.J.; et al. iTAK: A program for genome-wide prediction and classification of plant transcription factors, transcriptional regulators, and protein kinases. Mol. Plant 2016, 9, 1667–1670. [Google Scholar] [CrossRef] [PubMed]
- Pérez-Rodríguez, P.; Riaño-Pachón, D.M.; Corrêa, L.G.G.; Rensing, S.A.; Kersten, B.; Mueller-Roeber, B. PlnTFDB: Updated content and new features of the plant transcription factor database. Nucleic Acids Res. 2010, 38, D822–D827. [Google Scholar] [CrossRef] [PubMed]
- Davuluri, R.V.; Sun, H.; Palaniswamy, S.K.; Matthews, N.; Molina, C.; Kurtz, M.; Grotewold, E. AGRIS: Arabidopsis Gene Regulatory Information Server, an information resource of Arabidopsis cis-regulatory elements and transcription factors. BMC Bioinform. 2003, 4, 25. [Google Scholar] [CrossRef]
- Bray, N.L.; Pimentel, H.; Melsted, P.; Pachter, L. Near-optimal probabilistic RNA-seq quantification. Nat. Biotechnol. 2016, 34, 525–527. [Google Scholar] [CrossRef] [PubMed]
- Love, M.I.; Huber, W.; Anders, S. Moderated estimation of fold change and dispersion for RNA-seq data with DESeq2. Genome Biol. 2014, 15, 550. [Google Scholar] [CrossRef] [Green Version]
- Saeed, A.I.; Sharov, V.; White, J.; Li, J.; Liang, W.; Bhagabati, N.; Braisted, J.; Klapa, M.; Currier, T.; Thiagarajan, M.; et al. TM4: A free, open-source system for microarray data management and analysis. Biotechniques 2003, 34, 374–378. [Google Scholar] [CrossRef]
- Kim, Y.; Park, S.; Gilmour, S.J.; Thomashow, M.F. Roles of CAMTA transcription factors and salicylic acid in configuring the low-temperature transcriptome and freezing tolerance of Arabidopsis. Plant J. 2013, 75, 364–376. [Google Scholar] [CrossRef]
- Kawamura, Y.; Uemura, M. Mass spectrometric approach for identifying putative plasma membrane proteins of Arabidopsis leaves associated with cold acclimation. Plant J. 2003, 36, 141–154. [Google Scholar] [CrossRef] [PubMed]
- Lee, B.-H.; Henderson, D.A.; Zhu, J.-K. The Arabidopsis Cold-Responsive Transcriptome and Its Regulation by ICE. Plant Cell 2005, 17, 3155–3175. [Google Scholar] [CrossRef] [PubMed]
- Lee, H.; Guo, Y.; Ohta, M.; Xiong, L.; Stevenson, B.; Zhu, J.-K. LOS2, a genetic locus required for cold-responsive gene transcription encodes a bi-functional enolase. EMBO J. 2002, 21, 2692–2702. [Google Scholar] [CrossRef] [PubMed]
- Mizoguchi, T.; Irie, K.; Hirayama, T.; Hayashida, N.; Yamaguchi-Shinozaki, K.; Matsumoto, K.; Shinozaki, K. A gene encoding a mitogen-activated protein kinase kinase kinase is induced simultaneously with genes for a mitogen-activated protein kinase and an S6 ribosomal protein kinase by touch, cold, and water stress in Arabidopsis thaliana. Proc. Natl. Acad. Sci. USA 1996, 93, 765–769. [Google Scholar] [CrossRef] [PubMed]
- Vermel, M.; Guermann, B.; Delage, L.; Grienenberger, J.-M.; Maréchal-Drouard, L.; Gualberto, J.M. A family of RRM-type RNA-binding proteins specific to plant mitochondria. Proc. Natl. Acad. Sci. USA 2002, 99, 5866–5871. [Google Scholar] [CrossRef] [PubMed] [Green Version]
- Kwak, K.J.; Kim, Y.O.; Kang, H. Characterization of transgenic Arabidopsis plants overexpressing GR-RBP4 under high salinity, dehydration, or cold stress. J. Exp. Bot. 2005, 56, 3007–3016. [Google Scholar] [CrossRef]
- Capel, J.; Jarillo, J.A.; Salinas, J.; Martínez-Zapate, J.M. Two homologous low-temperature-inducible genes from Arabidopsis encode highly hydrophobic proteins. Plant Physiol. 1997, 115, 569–576. [Google Scholar] [CrossRef]
- Reyes, J.L.; Campos, F.; Wei, H.; Arora, R.; Yang, Y.; Karlson, D.T.; Covarrubias, A.A. Functional dissection of Hydrophilins during in vitro freeze protection. Plant Cell Environ. 2008, 31, 1781–1790. [Google Scholar] [CrossRef]
- Nishizawa, A.; Yabuta, Y.; Shigeoka, S. Galactinol and Raffinose Constitute a Novel Function to Protect Plants from Oxidative Damage. Plant Physiol. 2008, 147, 1251–1263. [Google Scholar] [CrossRef] [Green Version]
- Fourrier, N.; Bédard, J.; Lopez-Juez, E.; Barbrook, A.; Bowyer, J.; Jarvis, P.; Warren, G.; Thorlby, G. A role for sensitive to freezing2 in protecting chloroplasts against freeze-induced damage in Arabidopsis. Plant J. 2008, 55, 734–745. [Google Scholar] [CrossRef]
- Wang, S.; Bai, G.; Wang, S.; Yang, L.; Yang, F.; Wang, Y.; Zhu, J.-K.; Hua, J. Chloroplast RNA-Binding Protein RBD1 Promotes Chilling Tolerance through 23S rRNA Processing in Arabidopsis. PLoS Genet. 2016, 12, e1006027. [Google Scholar] [CrossRef] [PubMed]
- Drea, S.C.; Lao, N.T.; Wolfe, K.H.; Kavanagh, T.A. Gene duplication, exon gain and neofunctionalization of OEP16-related genes in land plants. Plant J. 2006, 46, 723–735. [Google Scholar] [CrossRef] [PubMed]
- Goulas, E.; Schubert, M.; Kieselbach, T.; Kleczkowski, L.A.; Gardeström, P.; Schröder, W.; Hurry, V. The chloroplast lumen and stromal proteomes of Arabidopsis thaliana show differential sensitivity to short- and long-term exposure to low temperature. Plant J. 2006, 47, 720–734. [Google Scholar] [CrossRef] [PubMed]
- Ganeteg, U.; Klimmek, F.; Jansson, S. Lhca5—An LHC-type protein associated with photosystem I. Plant Mol. Biol. 2004, 54, 641–651. [Google Scholar] [CrossRef] [PubMed]
- Simpson, P.J.; Tantitadapitak, C.; Reed, A.M.; Mather, O.C.; Bunce, C.M.; White, S.A.; Ride, J.P. Characterization of Two Novel Aldo–Keto Reductases from Arabidopsis: Expression Patterns, Broad Substrate Specificity, and an Open Active-Site Structure Suggest a Role in Toxicant Metabolism Following Stress. J. Mol. Biol. 2009, 392, 465–480. [Google Scholar] [CrossRef] [PubMed]
- Dong, C.H.; Zolman, B.K.; Bartel, B.; Lee, B.H.; Stevenson, B.; Agarwal, M.; Zhu, J.-K. Disruption of Arabidopsis CHY1 reveals an important role of metabolic status in plant cold stress signaling. Mol. Plant 2009, 2, 59–72. [Google Scholar] [CrossRef] [PubMed]
- Hyun, T.K.; Van Der Graaff, E.; Albacete, A.; Eom, S.H.; Großkinsky, D.K.; Böhm, H.; Janschek, U.; Rim, Y.; Ali, W.W.; Kim, S.Y.; et al. The Arabidopsis PLAT Domain Protein1 Is Critically Involved in Abiotic Stress Tolerance. PLoS ONE 2014, 9, e112946. [Google Scholar] [CrossRef]
- Mizoguchi, T.; Hayashida, N.; Yamaguchi-Shinozaki, K.; Kamada, H.; Shinozaki, K. Two genes that encode ribosomal-protein S6 kinase homologs are induced by cold or salinity stress in Arabidopsis thaliana. FEBS Lett. 1995, 358, 199–204. [Google Scholar] [CrossRef]
- Amme, S.; Matros, A.; Schlesier, B.; Mock, H.-P. Proteome analysis of cold stress response in Arabidopsis thaliana using DIGE-technology. J. Exp. Bot. 2006, 57, 1537–1546. [Google Scholar] [CrossRef]
- Joubès, J.; Raffaele, S.; Bourdenx, B.; Garcia, C.; Laroche-Traineau, J.; Moreau, P.; Domergue, F.; Lessire, R. The VLCFA elongase gene family in Arabidopsis thaliana: Phylogenetic analysis, 3D modelling and expression profiling. Plant Mol. Biol. 2008, 67, 547–566. [Google Scholar] [CrossRef]
- Du, Z.-Y.; Xiao, S.; Chen, Q.-F.; Chye, M.-L. Depletion of the Membrane-Associated Acyl-Coenzyme A-Binding Protein ACBP1 Enhances the Ability of Cold Acclimation in Arabidopsis. Plant Physiol. 2010, 152, 1585–1597. [Google Scholar] [CrossRef] [PubMed]
- Sheldon, C.C.; Finnegan, E.J.; Dennis, E.S.; Peacock, W.J. Quantitative effects of vernalization on FLC and SOC1 expression. Plant J. 2006, 45, 871–883. [Google Scholar] [CrossRef] [PubMed]
- Jarillo, J.A.; Leyva, A.; Salinas, J.; Martinez-Zapater, J.M. Low Temperature lnduces the Accumulation of Alcohol Dehydrogenase mRNA in Arabidopsis thaliana, a Chilling-Tolerant Plant. Plant Physiol. 1993, 101, 833–837. [Google Scholar] [CrossRef] [PubMed]
- Cantero, A.; Barthakur, S.; Bushart, T.J.; Chou, S.; Morgan, R.O.; Fernandez, M.P.; Clark, G.B.; Roux, S.J. Expression profiling of the Arabidopsis annexin gene family during germination, de-etiolation and abiotic stress. Plant Physiol. Biochem. 2006, 44, 13–24. [Google Scholar] [CrossRef] [PubMed]
- Doukhanina, E.V.; Chen, S.; Van Der Zalm, E.; Godzik, A.; Reed, J.; Dickman, M.B. Identification and Functional Characterization of the BAG Protein Family in Arabidopsis thaliana. J. Biol. Chem. 2006, 281, 18793–18801. [Google Scholar] [CrossRef] [PubMed]
- Bae, M.S.; Cho, E.J.; Choi, E.-Y.; Park, O.K. Analysis of the Arabidopsis nuclear proteome and its response to cold stress. Plant J. 2003, 36, 652–663. [Google Scholar] [CrossRef] [PubMed]
- Yang, T.; Chaudhuri, S.; Yang, L.; Chen, Y.; Poovaiah, B.W. Calcium/Calmodulin Up-regulates a Cytoplasmic Receptor-like Kinase in Plants. J. Biol. Chem. 2004, 279, 42552–42559. [Google Scholar] [CrossRef] [PubMed] [Green Version]
- Pandey, G.K.; Cheong, Y.H.; Kim, B.-G.; Grant, J.J.; Li, L.; Luan, S. CIPK9: A calcium sensor-interacting protein kinase required for low-potassium tolerance in Arabidopsis. Cell Res. 2007, 17, 411–421. [Google Scholar] [CrossRef] [PubMed]
- Kolesinski, P.; Piechota, J.; Szczepaniak, A. Initial characteristics of RbcX proteins from Arabidopsis thaliana. Plant Mol. Biol. 2011, 77, 447–459. [Google Scholar] [CrossRef] [PubMed]
- Carpenter, C.D.; Kreps, J.A.; Simon, A.E. Genes encoding Glycine - Rich Arabidopsis thaliana proteins with RNA-Binding motifs are influenced by cold treatment and an endogenous circadian rhythm. Plant Physiol. 1994, 104, 1015–1025. [Google Scholar] [CrossRef] [PubMed]
- Li, X.; Ma, D.; Lu, S.-X.; Hu, X.; Huang, R.; Liang, T.; Xu, T.; Tobin, E.M.; Liu, H. Blue Light-and Low Temperature-Regulated COR27 and COR28 Play Roles in the Arabidopsis Circadian Clock. Plant Cell 2016, 28, 2755–2769. [Google Scholar] [CrossRef] [PubMed]
- Zhang, X.; Liu, S.; Takano, T. Two cysteine proteinase inhibitors from Arabidopsis thaliana, AtCYSa and AtCYSb, increasing the salt, drought, oxidation and cold tolerance. Plant Mol. Biol. 2008, 68, 131–143. [Google Scholar] [CrossRef] [PubMed]
- Gong, Z.; Lee, H.; Xiong, L.; Jagendorf, A.; Stevenson, B.; Zhu, J.-K. RNA helicase-like protein as an early regulator of transcription factors for plant chilling and freezing tolerance. Proc. Natl. Acad. Sci. USA 2002, 99, 11507–11512. [Google Scholar] [CrossRef] [PubMed] [Green Version]
- Gómez-Merino, F.C.; Brearley, C.A.; Ornatowska, M.; Abdel-Haliem, M.E.F.; Zanor, M.-I.; Mueller-Roeber, B. AtDGK2, a Novel Diacylglycerol Kinase from Arabidopsis thaliana, phosphorylates 1-Stearoyl-2-arachidonoyl-sn-glycerol and 1, 2-Dioleoyl-sn-glycerol and Exhibits Cold-inducible Gene Expression. J. Biol. Chem. 2004, 279, 8230–8241. [Google Scholar] [CrossRef] [PubMed]
- Dong, C.-H.; Agarwal, M.; Zhang, Y.; Xie, Q.; Zhu, J.-K. The negative regulator of plant cold responses, HOS1, is a RING E3 ligase that mediates the ubiquitination and degradation of ICE1. Proc. Natl. Acad. Sci. USA 2006, 103, 8281–8286. [Google Scholar] [CrossRef] [Green Version]
- Vergnolle, C.; Vaultier, M.-N.; Taconnat, L.; Renou, J.-P.; Kader, J.-C.; Zachowski, A.; Ruelland, E. The Cold-Induced Early Activation of Phospholipase C and D Pathways Determines the Response of Two Distinct Clusters of Genes in Arabidopsis Cell Suspensions. Plant Physiol. 2005, 139, 1217–1233. [Google Scholar] [CrossRef] [PubMed]
- Rae, L.; Lao, N.T.; Kavanagh, T.A. Regulation of multiple aquaporin genes in Arabidopsis by a pair of recently duplicated DREB transcription factors. Planta 2011, 234, 429–444. [Google Scholar] [CrossRef]
- Kim, Y.-O.; Kim, J.S.; Kang, H. Cold-inducible zinc finger-containing glycine-rich RNA-binding protein contributes to the enhancement of freezing tolerance in Arabidopsis thaliana. Plant J. 2005, 42, 890–900. [Google Scholar] [CrossRef]
- Chen, C.-N.; Chu, C.-C.; Zentella, R.; Pan, S.-M.; Ho, T.-H.D. AtHVA22 gene family in Arabidopsis: Phylogenetic relationship, ABA and stress regulation, and tissue-specific expression. Plant Mol. Biol. 2002, 49, 633–644. [Google Scholar]
- Torabinejad, J.; Donahue, J.L.; Gunesekera, B.N.; Allen-Daniels, M.J.; Glenda, E.; Gillaspy, G.E. VTC4 Is a Bifunctional Enzyme That Affects Myoinositol and Ascorbate Biosynthesis in Plants. Plant Physiol. 2009, 150, 951–961. [Google Scholar] [CrossRef] [Green Version]
- Xu, D.; Huang, X.; Xu, Z.-Q.; Schläppi, M. The HyPRP gene EARLI1 has an auxiliary role for germinability and early seedling development under low temperature and salt stress conditions in Arabidopsis thaliana. Planta 2011, 234, 565–577. [Google Scholar] [CrossRef] [PubMed]
- Nordin, K.; Vahala, T.; Palva, E.T. Differential expression of two related, low-temperature-induced genes in Arabidopsis thaliana (L.) Heynh. Plant Mol. Biol. 1993, 21, 641–653. [Google Scholar] [CrossRef] [PubMed]
- Li, H.; Ding, Y.; Shi, Y.; Zhang, X.; Zhang, S.; Gong, Z.; Yang, S. MPK3-and MPK6-Mediated ICE1 Phosphorylation Negatively Regulates ICE1 Stability and Freezing Tolerance in Arabidopsis. Dev. Cell 2017, 43, 630–642. [Google Scholar] [CrossRef] [PubMed]
- Dong, M.A.; Farré, E.M.; Thomashow, M.F. Circadian clock-associated 1 and late elongated HYPOCOTYL regulate expression of the c-repeat binding factor (CBF) pathway in Arabidopsis. Proc. Natl. Acad. Sci. USA 2011, 108, 7241–7246. [Google Scholar] [CrossRef] [PubMed]
- Hirayama, T.; Ohto, C.; MizoguchiI, T.; Shinozaki, K. A gene encoding a phosphatidylinositol-specific phospholipase C is induced by dehydration and salt stress in Arabidopsis thaliana. Proc. Natl. Acad. Sci. USA 1995, 92, 3903–3907. [Google Scholar] [CrossRef] [PubMed]
- Li, W.; Li, M.; Zhang, W.; Welti, R.; Wang, X. The plasma membrane–bound phospholipase Dδ enhances freezing tolerance in Arabidopsis thaliana. Nat. Biotechnol. 2004, 22, 427–433. [Google Scholar] [CrossRef] [PubMed]
- Covington, M.F.; Panda, S.; Liu, X.L.; Strayer, C.A.; Wagner, D.R.; Kay, S.A. ELF3 Modulates Resetting of the Circadian Clock in Arabidopsis. Plant Cell 2001, 13, 1305–1315. [Google Scholar] [CrossRef]
- Xin, Z.; Mandaokar, A.; Chen, J.; Last, R.L.; Browse, J. Arabidopsis ESK1 encodes a novel regulator of freezing tolerance. Plant J. 2007, 49, 786–799. [Google Scholar] [CrossRef]
- Cao, S.; Ye, M.; Jiang, S. Involvement of GIGANTEA gene in the regulation of the cold stress response in Arabidopsis. Plant Cell Rep. 2005, 24, 683–690. [Google Scholar] [CrossRef]
- Salleh, F.M.; Evans, K.; Goodall, B.; Machin, H.; Mowla, S.B.; Mur, L.A.J.; Runions, J.; Theodoulou, F.L.; Foyer, C.H.; Rogers, H.J. A novel function for a redox-related LEA protein (SAG21/AtLEA5) in root development and biotic stress responses. Plant Cell Environ. 2012, 35, 418–429. [Google Scholar] [CrossRef]
- Maruyama, K.; Takeda, M.; Kidokoro, S.; Yamada, K.; Sakuma, Y.; Urano, K.; Fujita, M.; Yoshiwara, K.; Matsukura, S.; Morishita, Y.; et al. Metabolic Pathways Involved in Cold Acclimation Identified by Integrated Analysis of Metabolites and Transcripts Regulated by DREB1A and DREB2A. Plant Physiol. 2009, 150, 1972–1980. [Google Scholar] [CrossRef] [PubMed] [Green Version]
- Yamazaki, T.; Kawamura, Y.; Minami, A.; Uemura, M. Calcium-Dependent Freezing Tolerance in Arabidopsis Involves Membrane Resealing via Synaptotagmin SYT1. Plant Cell 2008, 20, 3389–3404. [Google Scholar] [CrossRef] [PubMed]
- Kim, M.J.; Shin, R.; Schachtman, D.P. A Nuclear Factor Regulates Abscisic Acid Responses in Arabidopsis. Plant Physiol. 2009, 151, 1433–1445. [Google Scholar] [CrossRef] [PubMed]
- Chu, B.; Snustad, D.P.; Carter, J.V. Alteration of β-Tubulin Gene Expression during Low-Temperature Exposure in Leaves of Arabidopsis thaliana. Plant Physiol. 1993, 103, 371–377. [Google Scholar] [CrossRef] [PubMed]
- Jiang, Y.; Deyholos, M.K. Functional characterization of Arabidopsis NaCl-inducible WRKY25 and WRKY33 transcription factors in abiotic stresses. Plant Mol. Biol. 2009, 69, 91–105. [Google Scholar] [CrossRef] [PubMed]
- Polisensky, D.H.; Braam, J. Cold-Shock Regulation of the Arabidopsis TCH Genes and the Effects of Modulating lntracellular Calcium Levels. Plant Physiol. 1996, 111, 1271–1279. [Google Scholar] [CrossRef] [PubMed]
- Okawa, K.; Nakayama, K.; Kakizaki, T.; Yamashita, T.; Inaba, T. Identification and characterization of Cor413im proteins as novel components of the chloroplast inner envelope. Plant Cell Environ. 2008, 31, 1470–1483. [Google Scholar] [CrossRef] [PubMed]
- Carlsson, A.S.; LaBrie, S.T.; Kinney, A.J.; Von Wettstein-Knowles, P.; Browse, J. A KAS2 cDNA complements the phenotypes of the Arabidopsis fab1 mutant that differs in a single residue bordering the substrate binding pocket. Plant J. 2002, 29, 761–770. [Google Scholar] [CrossRef] [PubMed]
- Hemsley, P.A.; Hurst, C.H.; Kaliyadasa, E.; Lamb, R.; Knight, M.R.; De Cothi, E.A.; Steele, J.F.; Knight, H. The Arabidopsis Mediator Complex Subunits MED16, MED14, and MED2 Regulate Mediator and RNA Polymerase II Recruitment to CBF-Responsive Cold-Regulated Genes. Plant Cell 2014, 26, 465–484. [Google Scholar] [CrossRef]
- Furuya, T.; Matsuoka, D.; Nanmori, T. Phosphorylation of Arabidopsis thaliana MEKK1 via Ca2+ signaling as a part of the cold stress response. J. Plant Res. 2013, 126, 833–840. [Google Scholar] [CrossRef]
- Yano, R.; Nakamura, M.; Yoneyama, T.; Nishida, I. Starch-Related a-Glucan/Water Dikinase Is Involved in the Cold-Induced Development of Freezing Tolerance in Arabidopsis. Plant Physiol. 2005, 138, 837–846. [Google Scholar] [CrossRef] [PubMed]
- Vlachonasios, K.E.; Thomashow, M.F.; Triezenberg, S.J. Disruption Mutations of ADA2b and GCN5 Transcriptional Adaptor Genes Dramatically Affect Arabidopsis Growth, Development, and Gene Expression. Plant Cell 2003, 15, 626–638. [Google Scholar] [CrossRef] [PubMed]
- Kim, J.Y.; Park, S.J.; Jang, B.; Jung, C.-H.; Ahn, S.J.; Goh, C.-H.; Cho, K.; Han, O.; Kang, H. Functional characterization of a glycine-rich RNA-binding protein 2 in Arabidopsis thaliana under abiotic stress conditions. Plant J. 2007, 50, 439–451. [Google Scholar] [CrossRef] [PubMed]
- Roudier, F.; Gissot, L.; Beaudoin, F.; Haslam, R.; Michaelson, L.; Marion, J.; Molino, D.; Lima, A.; Bach, L.; Morin, H.; et al. Very-Long-Chain Fatty Acids Are Involved in Polar Auxin Transport and Developmental Patterning in Arabidopsis. Plant Cell 2010, 22, 364–375. [Google Scholar] [CrossRef] [PubMed]
- Novillo, F.; Medina, J.; Salinas, J. Arabidopsis CBF1 and CBF3 have a different function than CBF2 in cold acclimation and define different gene classes in the CBF regulon. Proc. Natl. Acad. Sci. USA 2007, 104, 21002–21007. [Google Scholar] [CrossRef] [PubMed]
- Nakai, Y.; Nakahira, Y.; Sumida, H.; Takebayashi, K.; Nagasawa, Y.; Yamasaki, K.; Akiyama, M.; Ohme-Takagi, M.; Fujiwara, S.; Shiina, T.; et al. Vascular plant one-zinc-finger protein 1/2 transcription factors regulate abiotic and biotic stress responses in Arabidopsis. Plant J. 2013, 73, 761–775. [Google Scholar] [CrossRef] [PubMed]
- Du, J.-L.; Zhang, S.-W.; Huang, H.-W.; Cai, T.; Li, L.; Chen, S.; He, X.-J. The Splicing Factor PRP31 Is Involved in Transcriptional Gene Silencing and Stress Response in Arabidopsis. Mol. Plant 2015, 8, 1053–1068. [Google Scholar] [CrossRef] [PubMed]
- Chardon, F.; Bedu, M.; Calenge, F.; Klemens, P.A.W.; Spinner, L.; Clement, G.; Chietera, G.; Léran, S.; Ferrand, G.; Lacombe, B.; et al. Leaf Fructose Content Is Controlled by the Vacuolar Transporter SWEET17 in Arabidopsis. Curr. Biol. 2013, 23, 697–702. [Google Scholar] [CrossRef] [PubMed]
- Chen, M.; Markham, J.E.; Cahoon, E.B. Sphingolipid Δ8 unsaturation is important for glucosylceramide biosynthesis and low-temperature performance in Arabidopsis. Plant J. 2012, 69, 769–781. [Google Scholar] [CrossRef] [PubMed]
- Meyerhoff, O.; Müller, K.; Roelfsema, M.R.G.; Latz, A.; Lacombe, B.; Hedrich, R.; Dietrich, P.; Becker, D. AtGLR3.4, a glutamate receptor channel-like gene is sensitive to touch and cold. Planta 2005, 222, 418–427. [Google Scholar] [CrossRef]
- Küfner, I.; Koch, W. Stress regulated members of the plant organic cation transporter family are localized to the vacuolar membrane. BMC Res. Notes 2008, 1, 43. [Google Scholar] [CrossRef] [PubMed]
- Schlaen, R.G.; Mancini, E.; Sanchez, S.E.; Perez-Santangelo, S.; Rugnone, M.L.; Simpson, C.G.; Brown, J.W.S.; Zhang, X.; Chernomoretz, A.; Yanovsky, M.J. The spliceosome assembly factor GEMIN2 attenuates the effects of temperature on alternative splicing and circadian rhythms. Proc. Natl. Acad. Sci. USA 2015, 112, 9382–9387. [Google Scholar] [CrossRef] [PubMed] [Green Version]
- Dumont, E.; Fontaine, V.; Vuylsteker, C.; Sellier, H.; Bodèle, S.; Voedts, N.; Devaux, R.; Frise, M.; Avia, K.; Hilbert, J.-L.; et al. Association of sugar content QTL and PQL with physiological traits relevant to frost damage resistance in pea under field and controlled conditions. Theor. Appl. Genet. 2009, 118, 1561–1571. [Google Scholar] [CrossRef] [PubMed]
- Schönrock, N.; Bouveret, R.; Leroy, O.; Borghi, L.; Köhler, C.; Gruissem, W.; Hennig, L. Polycomb-group proteins repress the floral activator AGL19 in the FLC-independent vernalization pathway. Genes Dev. 2006, 20, 1667–1678. [Google Scholar] [CrossRef] [PubMed]
- Dumont, E.; Bahrman, N.; Goulas, E.; Valot, B.; Sellier, H.; Hilbert, J.-L.; Vuylsteker, C.; Lejeune-Hénaut, I.; Delbreil, B. A proteomic approach to decipher chilling response from cold acclimation in pea (Pisum sativum L.). Plant Sci. 2011, 180, 86–98. [Google Scholar] [CrossRef] [PubMed]
- Thomashow, M.F. Role of cold-responsive genes in plant freezing tolerance. Plant Physiol. 1998, 118, 1–8. [Google Scholar] [CrossRef] [PubMed]
- Siol, M.; Jacquin, F.; Chabert-Martinello, M.; Smýkal, P.; Le Paslier, M.-C.; Aubert, G.; Burstin, J. Patterns of Genetic Structure and Linkage Disequilibrium in a Large Collection of Pea Germplasm. Genes Genomes Genet. 2017, 7, 2461–2471. [Google Scholar] [CrossRef] [PubMed] [Green Version]
- Grimaud, F.; Renaut, J.; Dumont, E.; Sergeant, K.; Lucau-Danila, A.; Blervacq, A.-S.; Sellier, H.; Bahrman, N.; Lejeune-Hénaut, I.; Delbreil, B.; et al. Exploring chloroplastic changes related to chilling and freezing tolerance during cold acclimation of pea (Pisum sativum L.). J. Proteom. 2013, 80, 145–159. [Google Scholar] [CrossRef]
- Liu, X.; Zhou, Y.; Xiao, J.; Bao, F. Effects of Chilling on the Structure, Function and Development of Chloroplasts. Front. Plant Sci. 2018, 9, 1715. [Google Scholar] [CrossRef] [PubMed] [Green Version]
- Ambrosone, A.; Costa, A.; Leone, A.; Grillo, S. Beyond transcription: RNA-binding proteins as emerging regulators of plant response to environmental constraints. Plant Sci. 2012, 182, 12–18. [Google Scholar] [CrossRef] [PubMed]
- Zhang, H.; Van Nocker, S. The Vernalization Independence 4 gene encodes a novel regulator of flowering locus C. Plant J. 2002, 31, 663–673. [Google Scholar] [CrossRef] [PubMed]
- Hey, S.J.; Byrne, E.; Halford, N.G. The interface between metabolic and stress signaling. Ann. Bot. 2010, 105, 197–203. [Google Scholar] [CrossRef] [PubMed]
- Lee, B.-H.; Kapoor, A.; Zhu, J.; Zhu, J.-K. STABILIZED1, a Stress-Upregulated Nuclear Protein, Is Required for Pre-mRNA Splicing, mRNA Turnover, and Stress Tolerance in Arabidopsis. Plant Cell 2006, 18, 1736–1749. [Google Scholar] [CrossRef] [PubMed]
- Kim, J.Y.; Kim, W.Y.; Kwak, K.J.; Oh, S.H.; Han, Y.S.; Kang, H. Zinc finger-containing glycine-rich RNA-binding protein in Oryza sativa has an RNA chaperone activity under cold stress conditions. Plant Cell Environ. 2010, 33, 759–768. [Google Scholar] [PubMed]
- Benschop, J.J.; Mohammed, S.; O’Flaherty, M.; Heck, A.J.R.; Slijper, M.; Menke, F.L.H. Quantitative Phosphoproteomics of Early Elicitor Signaling in Arabidopsis. Mol. Cell. Proteom. 2007, 6, 1198–1214. [Google Scholar] [CrossRef] [PubMed]
- Mori, I.C.; Murata, Y.; Yang, Y.; Munemasa, S.; Wang, Y.F.; Andreoli, S.; Tiriac, H.; Alonso, J.M.; Harper, J.F.; Ecker, J.R.; et al. CDPKs CPK6 and CPK3 function in ABA regulation of guard cell S-type anion- and Ca 2þ -permeable channels and stomatal closure. PLoS Biol. 2006, 4, e327. [Google Scholar] [CrossRef]
- Yu, Y.; Chakravorty, D.; Assmann, S.M. The G Protein b-Subunit, AGB1, interacts with FERONIA in RALF1-Regulated St; omatal Movement. Plant Physiol. 2018, 176, 2426–2440. [Google Scholar] [CrossRef]
- Le, M.H.; Cao, Y.; Zhang, X.-C.; Stacey, G. LIK1, A CERK1-Interacting Kinase, Regulates Plant Immune Responses in Arabidopsis. PLoS ONE 2014, 9, e102245. [Google Scholar] [CrossRef]
- Hu, Y.; Jiang, Y.; Han, X.; Wang, H.; Pan, J.; Yu, D. Jasmonate regulates leaf senescence and tolerance to cold stress: Crosstalk with other phytohormones. J. Exp. Bot. 2017, 68, 1361–1369. [Google Scholar] [CrossRef]
- Chen, Q.-F.; Xiao, S.; Chye, M.-L. Overexpression of the Arabidopsis 10-Kilodalton Acyl-Coenzyme A-Binding Protein ACBP6 Enhances Freezing Tolerance. Plant Physiol. 2008, 148, 304–315. [Google Scholar] [CrossRef]


| Set | Subset Description | # Genes | 5 Most Significant Enriched GO Terms Related to Biological Process | 5 Most Significant Enriched GO Terms Related to Cellular Localization | Kegg Pathways: # Mapped Genes (%), # Represented Pathways, Most Represented Pathways (#) | iTak: # Kinases (%), # Families | Transcription Factors: # TF (%), # Families, Most Represented Family (#) | GO Terms Related to Cold: # Genes |
|---|---|---|---|---|---|---|---|---|
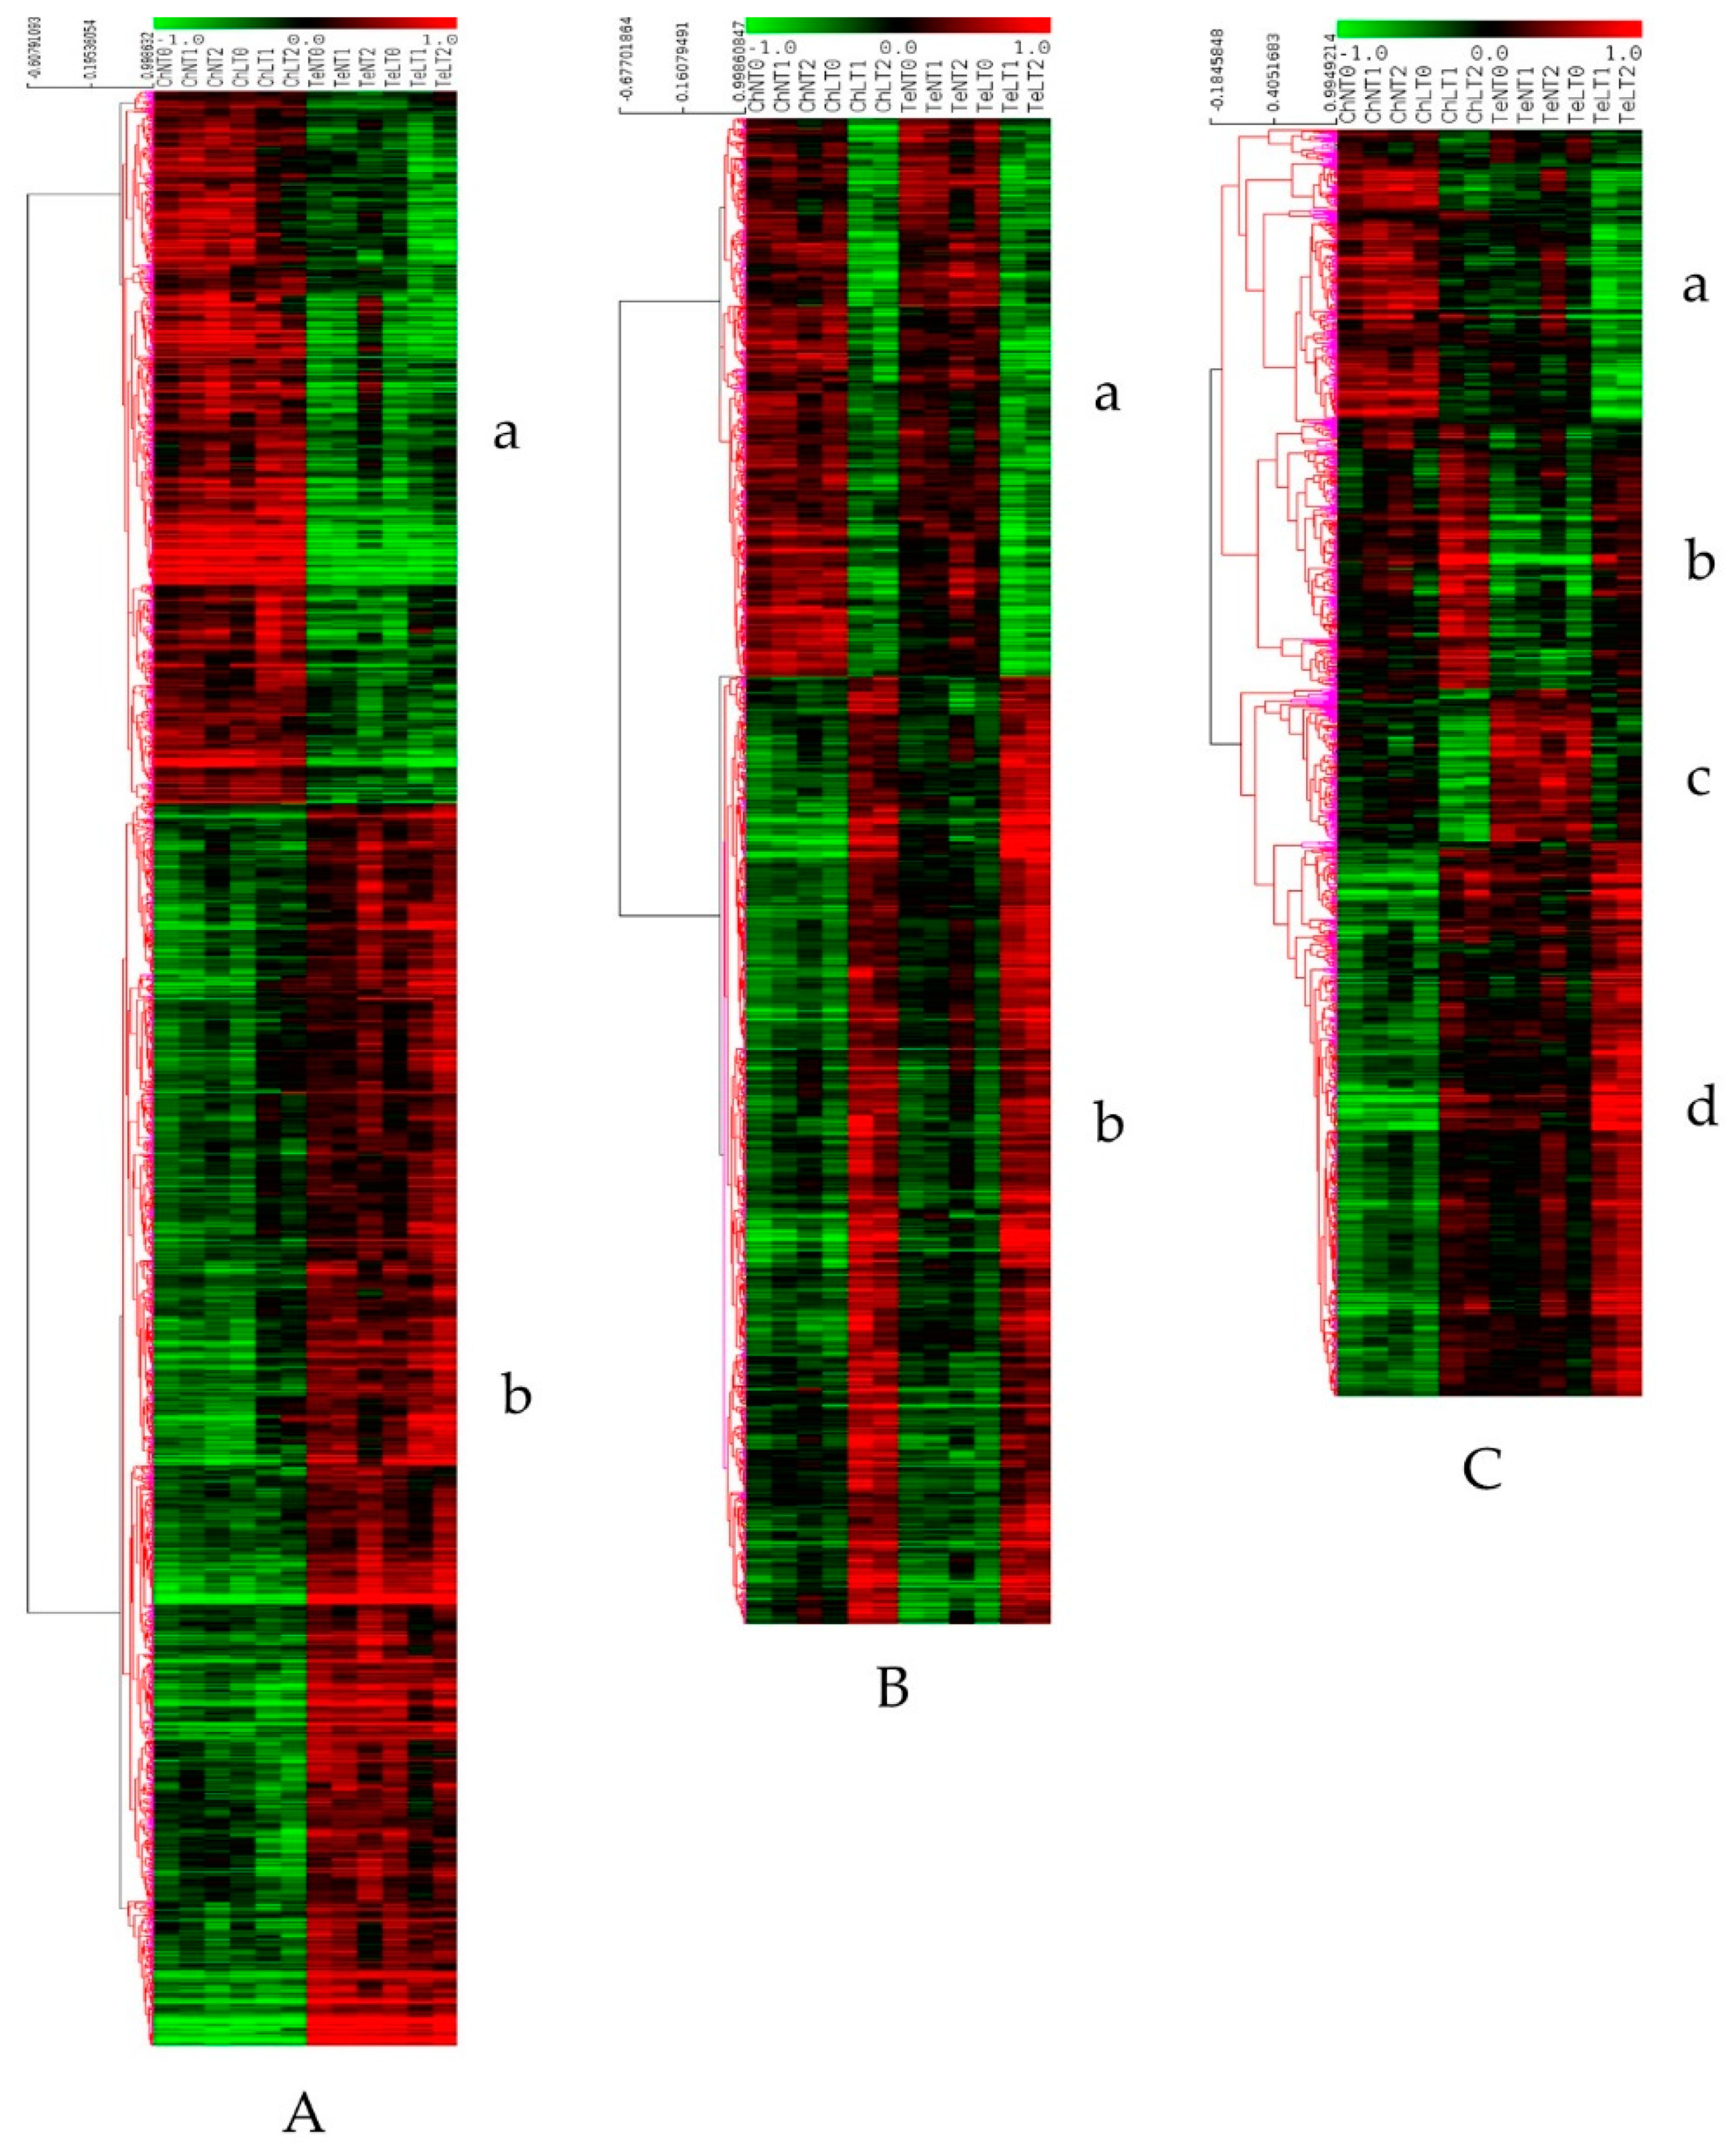
| Line response (LR): genes differentially expressed between Ch and Te at T0 and not modulated under LT | Genes more expressed in Ch than in Te (Figure 3A a) | 906 | metabolic process, cellular process, localization, cellular component organization or biogenesis, response to stimulus | plastid, chloroplast cytoplasmic part, cell part, cell | 553 (61.0%), 110, Cysteine and methionine metabolism (13) | 26 (3.0%), 12 | 50 (5.5%), 26, AP2-EREBP (6) | -response to cold GO:0009409: 23 -cold acclimation GO:0009631: 4 -cellular response to cold GO:0070417: 2 -total: 29 (3.2%) |
| Genes more expressed in Te than in Ch(Figure 3A b) | 1581 | cellular process, metabolic process, localization, cellular component organization or biogenesis, response to stimulus | cell part, cell, intracellular part, intracellular and intracellular organelle | 616 (39.0%), 106, Ribosome (25) | 70 (4.4%), 19 | 138 (8.7%) 43, bHLH (13) | -response to cold GO:0009409: 35 -cellular response to cold GO:0070417: 1 -total: 36 (2.3%) | |
| Temperature Common Response (TCR): Genes responding identically in Ch and Te under LT | Genes down expressed during LT (Figure 3B a) | 520 | metabolic process, cellular process, cellular component organization or biogenesis, localization, response to stimulus | chloroplast, plastid, chloroplast part, plastid part, cytoplasm | 366 (70.4%), 77, Glyoxylate and dicarboxylate metabolism (10) | 16 (3.1%), 12 | 25 (4.8%), 16, bHLH (4) | -response to cold GO:0009409: 14 -Total: 14 (2.7%) |
| Genes up expressed during LT (Figure 3B b) | 883 | metabolic process, cellular process, cellular component organization or biogenesis, localization, response to stimulus | intracellular, intracellular part, cell part, cell, membrane-bounded organelle | 388 (43.9%), 88, Ribosome biogenesis (21) | 38 (4.3%), 22 | 89 (10.1%), 38, bHLH (7), C2C2-CO-like (7) | -response to cold GO:0009409: 25 -cold acclimation GO:0009631: 3 -cellular response to cold GO:0070417: 2 -total: 30 (3.4%) | |
| Temperature Line Specific Response (TLSR): genes responding differentially in Ch and Te under LT | Genes more expressed in Ch than in Te and down regulated during LT (Figure 3C a) | 253 | metabolic process, cellular process, localization, cellular component organization or biogenesis, response to stimulus | cytoplasmic part, plastid, chloroplast, cytoplasm, intracellular organelle part | 201 (79.5%), 73, Oxidative phosphorylation (6), Starch and sucrose metabolism (6) | 7 (2.8%), 6 | 16 (6.3%), 10, C3H (3), MYB (3) | -response to cold GO:0009409: 8 -cold acclimation GO:0009631: 1 -total: 9 (3.6%) |
| Genes more expressed in Ch than in Te and up regulated during LT (Figure 3C b) | 228 | cellular process, metabolic process, localization, response to stimulus, cellular component organization or biogenesis | cell part, cell, intracellular part, cytoplasm, intracellular | 170 (74.6%), 62, Purine metabolism (5) | 11 (4.8%), 10 | 21 (9.2%), 15, AP2-EREBP (3) | -response to cold GO:0009409: 4 -cold acclimation GO:0009631: 1 -cellular response to cold GO:0070417: 1 -total: 6 (2.6%) | |
| Genes less expressed in Ch than in Te and down regulated during LT (Figure 3C c) | 131 | metabolic process, cellular process, localization, response to stimulus, cellular component organization or biogenesis | cytoplasmic part | 57 (43.5%), 34, several pathways represented by 2 genes | 2 (1.5%), 2 | 12 (9.2%), 11, AP2-EREBP (2) | -response to cold GO:0009409: 8 -cold acclimation GO:0009631: 1 -total: 9 (6.9%) | |
| Genes less expressed in Ch than in Te and up regulated during LT (Figure 3C d) | 479 | metabolic process, cellular process, localization, cellular component organization or biogenesis, response to stimulus | cell part, cell, intracellular part, intracellular, nucleus | 173 (36.1%), 71, mRNA surveillance pathway (7) | 23 (4.8%), 16 | 46 (9.6%), 25, C2H2 (5) | -response to cold GO:0009409: 11 -cold acclimation GO:0009631: 1 -total: 12 (2.5%) |
| Protein/Gene/Function | Class of Function | Reference | Orthologous in AT | Ch Up | Te Up | TCR Down | TCR Up | TLSR a | TLSR b | TLSR c | TLSR d |
|---|---|---|---|---|---|---|---|---|---|---|---|
| GO:0009409 (response to cold) | |||||||||||
| Calmodulin-binding transcription activator 2 | TF, Induction of CBFs | [53] | AT5G64220.2 | 1 | |||||||
| Plasma-membrane cation-binding protein 1 | Plasma membrane protein | [54] | AT4G20260.6 | 1 | |||||||
| Vacuolar H(+)-ATPase subunit E1 | Hydrogen ion transport | [54] | AT4G11150.1 | 1 | |||||||
| Adenine nucleotide alpha hydrolases-like | Cold shock response | [54] | AT3G53990.1 | 2 | |||||||
| Calcium-dependent lipid-binding protein | Response to cold | [54] | AT4G34150.1 | 1 | |||||||
| SAUR-like auxin-responsive protein family | Auxin metabolism | [55] | AT4G38840.1 | 4 | 4 | ||||||
| Enolase, ENO2 | Glycolysis/Gluconeogenesis | [56] | AT2G36530.1 | 1 | |||||||
| MAP kinase kinase kinase1 | Kinase activity | [57] | AT4G08500.1 | 1 | |||||||
| Protein HAPLESS 6, Ribophorin II | N-linked glycosylation | [58] | AT4G21150.3 | 1 | |||||||
| Cold, circadian rhythm, RNA-binding 2, GRP7 | RNA-binding | [59] | AT2G21660.2 | 5 | 5 | 5 | |||||
| Glycine-rich RNA-binding protein 3, RBG3 | RNA-binding, transcription | [59] | AT5G61030.1 | 2 | |||||||
| Hydrophobic protein RCI2A and LTI6A | Response to cold | [60] | AT3G05880.1 | 2 | |||||||
| Late embryogenesis abundant protein 46 | Cryoprotectant | [61] | AT5G06760.1 | 1 | |||||||
| Galactinol synthase 2, GOLS2 | Galactose metabolism | [62] | AT1G56600.1 | 1 | |||||||
| Protein sensitive to freezing 2 | Glucosidase activity | [63] | AT3G06510.1 | 1 | |||||||
| Pentatricopeptide repeat-containing protein | RNA modification, binding | [64] | AT3G22690.2 | 1 | |||||||
| RNA-binding (RRM/RBD/RNP motifs) | rRNA-binding | [64] | AT1G70200.1 | 1 | |||||||
| Outer envelope pore protein 16-1, OEP16-1 | Amino acid transport, porin | [65] | AT2G28900.1 | 2 | 2 | ||||||
| Glutathione S-transferase F8 | Oxidoreductase, peroxidase | [66] | AT2G47730.1 | 1 | |||||||
| Glyoxalase I | methylglyoxal degradation | [66] | AT1G67280.2 | 2 | |||||||
| Plastid-lipid-associated protein 1, Fibrillin-1a | Photoinhibition | [66] | AT4G04020.1 | 1 | |||||||
| Phosphoribulokinase, PRK | Photosynthesis, transferase | [66] | AT1G32060.1 | 1 | |||||||
| NADPH-dependent alkenal/one | Oxidoreductase | [66] | AT1G23740.1 | 2 | 2 | ||||||
| Serine hydroxymethyltransferase | One-carbon metabolism | [66] | AT4G37930.1 | 1 | |||||||
| RuBisCo activase | ATP- and nucleotide-binding | [66] | AT2G39730.1 | 1 | |||||||
| Chlorophyll a-b binding protein 4, LHCA4 | Photosynthesis | [67] | AT3G47470.1 | 1 | 1 | ||||||
| NADPH-dependent aldo-keto reductase | Oxidation-reduction process | [68] | AT2G37770.2 | 2 | 2 | ||||||
| 3-hydroxyisobutyryl-CoA hydrolase 1 | L-valine degradation | [69] | AT5G65940.1 | 1 | |||||||
| PLAT domain-containing protein 1, PLAT1 | Catalase, Peroxidase activity | [70] | AT4G39730.1 | 2 | 2 | ||||||
| Serine/threonine protein kinase | ATP binding, transferase | [71] | AT3G08720.2 | 1 | |||||||
| Phosphoglyceromutase 1, PGAM 1 | Glycolysis/Gluconeogenesis | [72] | AT1G09780.1 | 1 | |||||||
| 3-ketoacyl-CoA synthase 1 | Fatty acid elongation | [73] | AT2G26250.1 | 1 | 2 | 2 | |||||
| Acyl-CoA-binding protein 1, ACBP1 | Fatty Acid Beta-Oxidation | [74] | AT5G53470.1 | 1 | 1 | ||||||
| Agamous-like MADS-box protein, SOC1 | Transcription regulation | [75] | AT2G45660.1 | 2 | |||||||
| Alcohol dehydrogenase 1 | Glycolysis/Gluconeogenesis | [76] | AT1G77120.1 | 1 | |||||||
| Annexin D8, calcium/phospholipid binding | Calcium binding | [77] | AT5G12380.1 | 1 | 1 | 1 | |||||
| BAG family molecular chaperone regulator 4 | Chaperone binding | [78] | AT3G51780.1 | 1 | |||||||
| Calcium-binding protein | Calcium ion binding | [79] | AT1G02270.1 | 1 | |||||||
| Heat shock 70 KDa protein 1, HSP70-1 | ATPase activity, chaperone | [79] | AT5G02500.1 | 2 | |||||||
| DNA damage-repair/toleration, DRT102 | Isomerase activity | [79] | AT3G04880.1 | 1 | |||||||
| Proteasome subunit alpha type-3, PAG1 | Folding, sorting, degradation | [79] | AT2G27020.1 | 1 | |||||||
| Hsp 70 kDa protein 1 | ATPase activity, Chaperone | [79] | AT5G02500.1 | 2 | |||||||
| Calmodulin-binding receptor-like, kinase 1 | Calmodulin binding | [80] | AT5G58940.1 | 1 | |||||||
| Serine/threonine-protein kinase | ATP-binding | [81] | AT1G01140.3 | 1 | |||||||
| Chaperonin-like RBCX protein 1 | Protein folding chaperone | [82] | AT4G04330.1 | 1 | |||||||
| Cinnamoyl-CoA reductase 1 | Lignin biosynthesis | [83] | AT1G15950.1 | 1 | |||||||
| Cold regulated protein 27, COR27 | Cold, circadian rhythm | [84] | AT5G42900.3 | 1 | |||||||
| Cysteine proteinase inhibitor 6, CYS6 | Cysteine proteinase inhibitor | [85] | AT3G12490.2 | 1 | |||||||
| Protein CRYOPHYTE, RH38 | RNA-binding, hydrolase | [86] | AT3G53110.1 | 1 | |||||||
| Diacylglycerol kinase 2 | Glycerolipid metabolism | [87] | AT5G63770.1 | 1 | |||||||
| E3 ubiquitin-protein ligase HOS1 | Protein ubiquitination | [88] | AT2G39810.1 | 1 | |||||||
| Early light-induced protein 1, Chloroplastic | Photosynthesis | [89] | AT3G22840.1 | 1 | |||||||
| Ethylene-responsive TF, RAP2-4 and RAP2 | Transcription factor | [90] | AT1G78080.1 | 1 | 1 | ||||||
| Glycine-rich RNA-binding protein RZ1A | RNA-binding, transcription | [91] | AT3G26420.1 | 1 | 1 | ||||||
| HVA22-like protein a, similarity to TB2/DP1 | Cold and stress response | [92] | AT1G74520.1 | 1 | 1 | ||||||
| Inositol-1-monophosphatase | Myo-inositol biosynthesis | [93] | AT3G02870.3 | 1 | |||||||
| Lipid transfer protein EARLI 1 | Lipid-transfer | [94] | AT4G12480.1 | 1 | |||||||
| LOW-TEMPERATURE-INDUCED 65, LTI65 | Response to abscisic acid | [95] | AT5G52300.2 | 1 | |||||||
| MAP kinase 3 | ATP binding | [96] | AT3G45640.1 | 1 | |||||||
| MYB-related transcription factor CCA1 | DNA binding | [97] | AT2G46830.1 | 2 | |||||||
| Phosphoinositide phospholipase C1 | Hydrolase, lipid metabolism | [98] | AT5G58670.1 | 1 | |||||||
| Phospholipase D delta | Lipid degradation | [99] | AT4G35790.2 | 2 | 2 | ||||||
| Protein EARLY FLOWERING 3, ELF3 | DNA-binding TF activity | [100] | AT2G25930.1 | 1 | |||||||
| Protein ESKIMO 1, Signal-anchor | Xylan O-acetyltransferase | [101] | AT3G55990.1 | 1 | |||||||
| Protein GIGANTEA, GI | Phytochrome B signaling | [102] | AT1G22770.1 | 1 | |||||||
| Protein Senescence-Associated Gene 21 | Oxidative stresses | [103] | AT4G02380.1 | 2 | |||||||
| Raffinose synthase 6 | Carbohydrate metabolism | [104] | AT5G20250.4 | 1 | |||||||
| Synaptotagmin-1, SYT1 | Lipid binding, Ca2+ transport | [105] | AT2G20990.1 | 1 | |||||||
| Transcription factor GTE10, NPX1 | ABA signaling pathway | [106] | AT5G63320.1 | 1 | |||||||
| Tubulin beta-6 chain, TUBB6 | GTPase activity, Transport | [107] | AT5G12250.1 | 1 | |||||||
| WRKY DNA-binding protein 33, WRKY33 | DNA-binding TF activity | [108] | AT2G38470.1 | 1 | |||||||
| Xyloglucan endotransglucosylase/hydrolase protein 22 | Glycosidase, Transferase | [109] | AT5G57560.1 | 1 | |||||||
| GO:0009631 (cold acclimation) | |||||||||||
| Cold-regulated 413 thylakoid membrane 1 | Cellular response to cold | [110] | AT1G29395.1 | 1 | |||||||
| 3-oxoacyl-[acyl-carrier-protein] synthase II | Fatty acid biosynthesis | [111] | AT1G74960.3 | 1 | |||||||
| Mediator of RNA polymerase II transcription subunit 32 | Transcription regulation | [112] | AT1G11760.1 | 1 | |||||||
| Calcium/calmodulin-regulated receptor-like kinase 1 | Calmodulin-binding | [113] | AT5G54590.2 | 1 | |||||||
| Alpha-glucan water dikinase 1 | Carbohydrate metabolism | [114] | AT1G10760.1 | 1 | |||||||
| Transcriptional adapter ADA2b, PRZ1 | Transcription regulation | [115] | AT4G16420.1 | 1 | |||||||
| Glycine-rich RNA-binding protein 2 | Chaperone, RNA-binding | [116] | AT4G13850.3 | 1 | |||||||
| Acetyl-CoA carboxylase 1 | Fatty acid metabolism | [117] | AT1G36160.2 | 1 | |||||||
| C-repeat binding factor 3, DREB1A, CBF3 | TF, DNA-binding | [118] | AT4G25480.1 | 1 | |||||||
| VOZ1, vascular plant one zinc finger | Transcription factor | [119] | AT1G28520.2 | 1 | |||||||
| GO:0070417 (cellular response to cold) | |||||||||||
| Pre-mRNA-processing factor 31 homolog | RNA-binding, splicing | [120] | AT1G60170.1 | 1 | |||||||
| Bidirectional sugar transporter SWEET17 | Fructose, sugar transport | [121] | AT4G15920.1 | 1 | |||||||
| Delta(8)-fatty-acid desaturase1 | Oxidoreductase | [122] | AT2G46210.1 | 1 | 1 | ||||||
| Glutamate receptor 3.4, GLR3.4 | Ion transport | [123] | AT1G05200.2 | 1 | |||||||
| Organic cation/carnitine transporter 3, OCT3 | Transporter activity | [124] | AT1G16390.1 | 1 | |||||||
| spliceosome protein-like protein | RNA processing, splicing | [125] | AT1G54380.1 | 1 | |||||||
| Total of genes in GO bulk analyses | 29 | 36 | 14 | 30 | 9 | 6 | 9 | 12 | |||
| Total of genes in each subset | 906 | 1581 | 520 | 883 | 253 | 228 | 131 | 479 | |||
| Ratio % | 3.20 | 2.28 | 2.69 | 3.40 | 3.56 | 2.63 | 6.87 | 2.51 |
© 2019 by the authors. Licensee MDPI, Basel, Switzerland. This article is an open access article distributed under the terms and conditions of the Creative Commons Attribution (CC BY) license (http://creativecommons.org/licenses/by/4.0/).
Share and Cite
Bahrman, N.; Hascoët, E.; Jaminon, O.; Dépta, F.; Hû, J.-F.; Bouchez, O.; Lejeune-Hénaut, I.; Delbreil, B.; Legrand, S. Identification of Genes Differentially Expressed in Response to Cold in Pisum sativum Using RNA Sequencing Analyses. Plants 2019, 8, 288. https://doi.org/10.3390/plants8080288
Bahrman N, Hascoët E, Jaminon O, Dépta F, Hû J-F, Bouchez O, Lejeune-Hénaut I, Delbreil B, Legrand S. Identification of Genes Differentially Expressed in Response to Cold in Pisum sativum Using RNA Sequencing Analyses. Plants. 2019; 8(8):288. https://doi.org/10.3390/plants8080288
Chicago/Turabian StyleBahrman, Nasser, Emilie Hascoët, Odile Jaminon, Frédéric Dépta, Jean-François Hû, Olivier Bouchez, Isabelle Lejeune-Hénaut, Bruno Delbreil, and Sylvain Legrand. 2019. "Identification of Genes Differentially Expressed in Response to Cold in Pisum sativum Using RNA Sequencing Analyses" Plants 8, no. 8: 288. https://doi.org/10.3390/plants8080288
APA StyleBahrman, N., Hascoët, E., Jaminon, O., Dépta, F., Hû, J.-F., Bouchez, O., Lejeune-Hénaut, I., Delbreil, B., & Legrand, S. (2019). Identification of Genes Differentially Expressed in Response to Cold in Pisum sativum Using RNA Sequencing Analyses. Plants, 8(8), 288. https://doi.org/10.3390/plants8080288