Article

Photosynthetic Responses of Canola and Wheat to Elevated Levels of CO2, O3 and Water Deficit in Open-Top Chambers

by
Bheki G. Maliba
1,2,*,
Prabhu M. Inbaraj
1,3 and
Jacques M. Berner
1
1
Unit for Environmental Sciences and Management, North-West University, Potchefstroom 2520, South Africa
2
Eskom Research, Testing and Development, Cleveland 2022, South Africa
3
Department of Chemistry, School of Basic Sciences, Manipal University Jaipur, Jaipur 303007, India
*
Author to whom correspondence should be addressed.
Plants 2019, 8(6), 171; https://doi.org/10.3390/plants8060171
Submission received: 26 April 2019 / Revised: 16 May 2019 / Accepted: 18 May 2019 / Published: 12 June 2019
(This article belongs to the Special Issue Adapting Crops to Climate Change)

Abstract

:
The effects of elevated CO2 (700 ppm) and O3 (80 ppb) alone and in combination on the photosynthetic efficiency of canola and wheat plants were investigated in open-top chambers (OTCs). The plants were fumigated for four weeks under well-watered and water-stressed (water deficit) conditions. The fast chlorophyll a fluorescence transients were measured after 2 and 4 weeks of fumigation, as well as in control plants, and analyzed by the JIP-test, which is a non-destructive, non-invasive, informative, very fast and inexpensive technique used to evaluate the changes in photosynthetic efficiency. Biomass measurements were taken only after 4 weeks of fumigation. The performance index (PItotal), an overall parameter calculated from the JIP-test formulae, was reduced by elevated CO2 and O3 under well-watered conditions. In the absence of any other treatment, water stress caused a decrease of the PItotal, and it was partly eliminated by fumigation with elevated CO2 and CO2 + O3. This finding was also supported by the biomass results, which revealed a higher biomass under elevated CO2 and CO2 + O3. The decrease in biomass induced by elevated O3 was likely caused by the decline of photosynthetic efficiency. Our findings suggest that elevated CO2 reduces the drought effect both in the absence and presence of O3 in canola and wheat plants. The study also indicates that elevated O3 would pose a threat in future to agricultural crops.

1. Introduction

The concentrations of carbon dioxide (CO2) and ozone (O3) are increasing at a steady rate in the atmosphere [1,2]. The increasing CO2 trend is mostly caused by the use of fossil fuels for combustion [2]. It is projected that CO2 concentration will rise to about 550 ppm by 2050 [3]. Elevated CO2 stimulates plant growth and development but elevated O3 often has the opposite effect [4,5]. Ozone causes considerable damage in agricultural crops, which includes visible injury, reduced photosynthetic capacity, modifications to carbon allocation and reduced yield quantity and quality [6,7]. Prolonged exposure to O3 levels above 40 ppb decreases crop yields due to reduced photosynthesis and disruption of metabolism [8]. These findings suggest that agricultural crops in southern Africa may be at risk because of elevated O3 levels [9]. The seasonal variation of O3 indicates the highest O3 concentrations in spring and winter and the lowest in summer [10]. The maximum O3 concentrations in this region are between 40–60 ppb and can rise to more than 90 ppb in the spring season [11]. What is of concern is how these changes will interact with one another and influence plant growth, as well as the interaction of these gasses with other factors of climate change, such as droughts.
Climate change will have effects on agriculture and food security [12]. Agriculture plays a vital role in the economy of developing countries. Subsistence farmers in the southern Africa region depend on staple crops for income generation. Commercial farmers will also be affected by climate change, which could affect food security on a local and global scale. The effect of elevated CO2 and O3 on important crops (and vegetation) has received a lot of attention in Europe and North America. To be specific, studies that relate to the effect of elevated CO2 in combination with O3 and droughts are very limited in southern Africa. As a result, the findings of developed countries have been extrapolated in developing countries [7], but given differences in climatic conditions, these results may not represent the local conditions. Plants grown under elevated CO2 have been shown to alleviate the effects of drought stress [13,14], due to CO2-induced increases in stomatal resistance. Moreover, elevated CO2 is understood to alleviate the harmful effects of O3 by reducing stomatal conductance and thus reducing O3 uptake and the potential for oxidant damage [15]. The combined effects of O3 with elevated CO2 and droughts are important but not well understood. In fact, there has been little consideration on how the different components of global climate change, such as O3, CO2, temperature and weather extremes, might combine and interact to influence the agricultural sector [7].
Photosynthesis is regarded as a reliable measure of the overall performance in plants [16]. It is one of the important processes to be affected by abiotic stress, such as elevated O3 and droughts, which cause a decline in CO2 diffusion to the chloroplast and metabolic constraints [17]. Drought stress gradually decreases CO2 assimilation rates because of reduced stomatal conductance [18]. Stomatal closure is the initial response to droughts and the main limitation of photosynthesis at mild to moderate drought stress [19]. At a time of severe drought, the inhibition of metabolic process induces reduction in the contents of ribulose bisphosphate, which becomes the main limitation and thus inhibits photosynthetic CO2 assimilation [19]. In addition, drought stress enhances the generation of active oxygen species and antioxidant defenses [18]. In a meta-analysis of photosynthesis and drought, Pinheiro and Chaves [20] indicated the interaction of sugars, reactive oxygen species and hormones with photosynthetic responses to droughts. Furthermore, Zivcak et al. [21] showed that under drought stress conditions there is a complex interconnected and regulated photoprotective response.
In order to study the effects of elevated CO2 and O3 on the photosynthetic apparatus of canola and wheat plants, the chlorophyll (Chl) a fluorescence transients OJIP (a non-destructive, simple and rapid technique for sensing stress) was applied. Analysis of the OJIP transients by the JIP-test provides significant information about the structure and function of the photosynthetic apparatus [22,23,24]. The parameters calculated by the JIP-test and the shape of the transients have been found to be very sensitive to stress caused by environmental conditions, such as light intensity, temperature, drought, flooding, atmospheric CO2 or elevated O3 and chemical influences [25,26,27,28,29]. Therefore, it was hypothesized that elevated CO2 reduces the water stress (water deficit) effect both in the absence and presence of O3 in canola and wheat crops. The hypothesis was tested by exposing canola and wheat plants to elevated levels of CO2, O3 and the combination of these two gases in open-top chambers (OTCs) under well-watered and water-stressed (water deficit) conditions to quantify the biophysical and physiological responses. The objective was to understand how locally cultivated canola and wheat plants respond to elevated CO2 and O3 and if these environmental factors will interact with each other under well-watered and water-stressed conditions.

2. Results

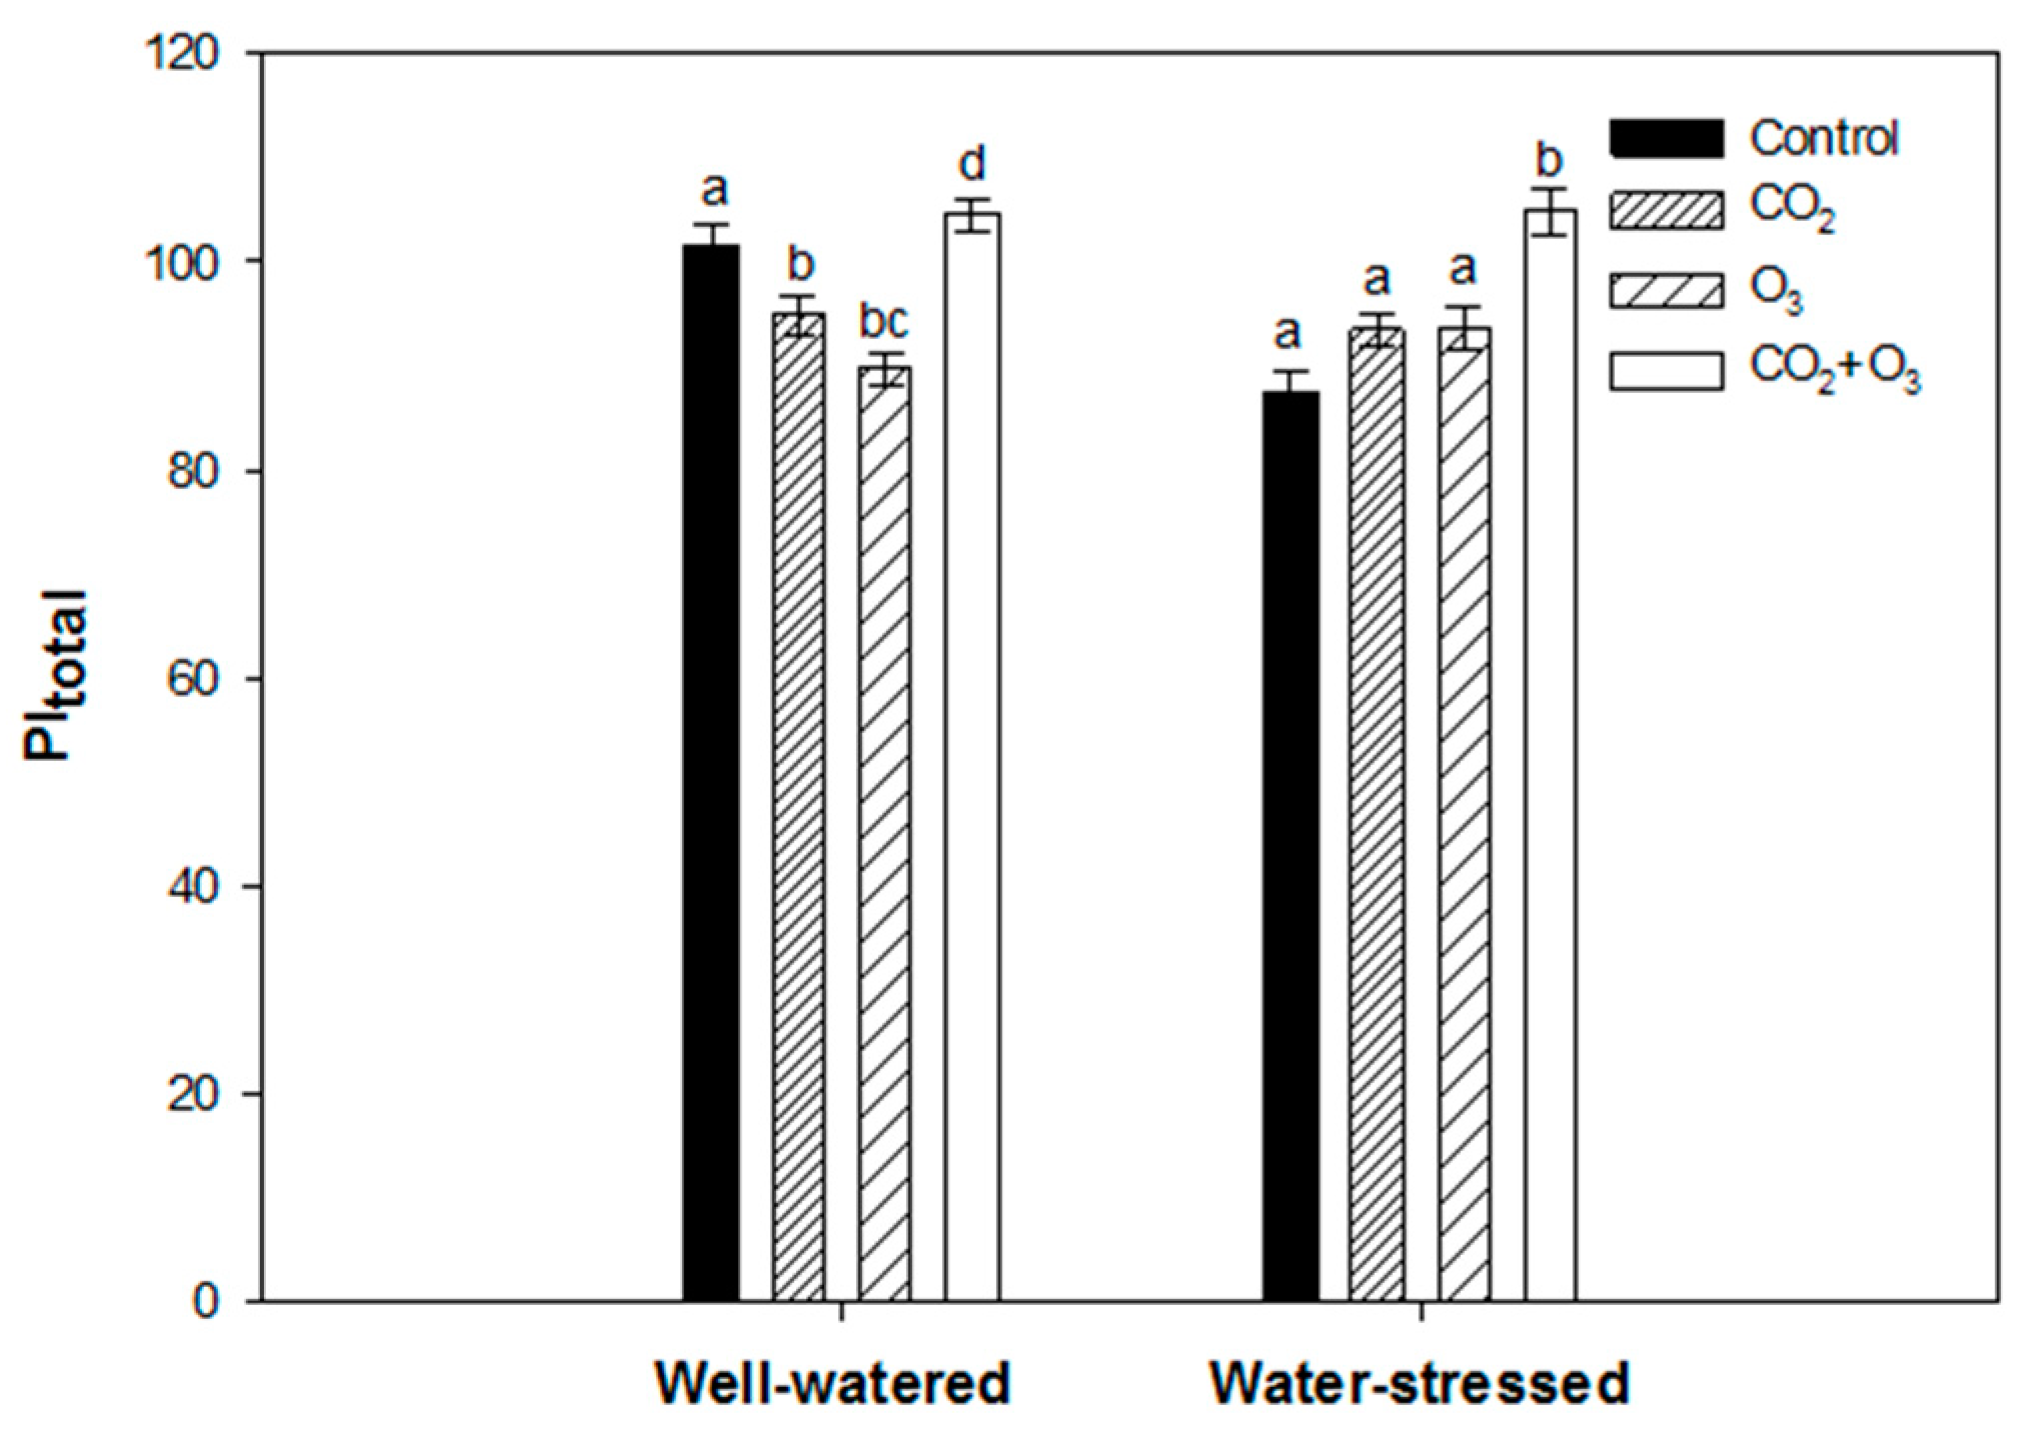
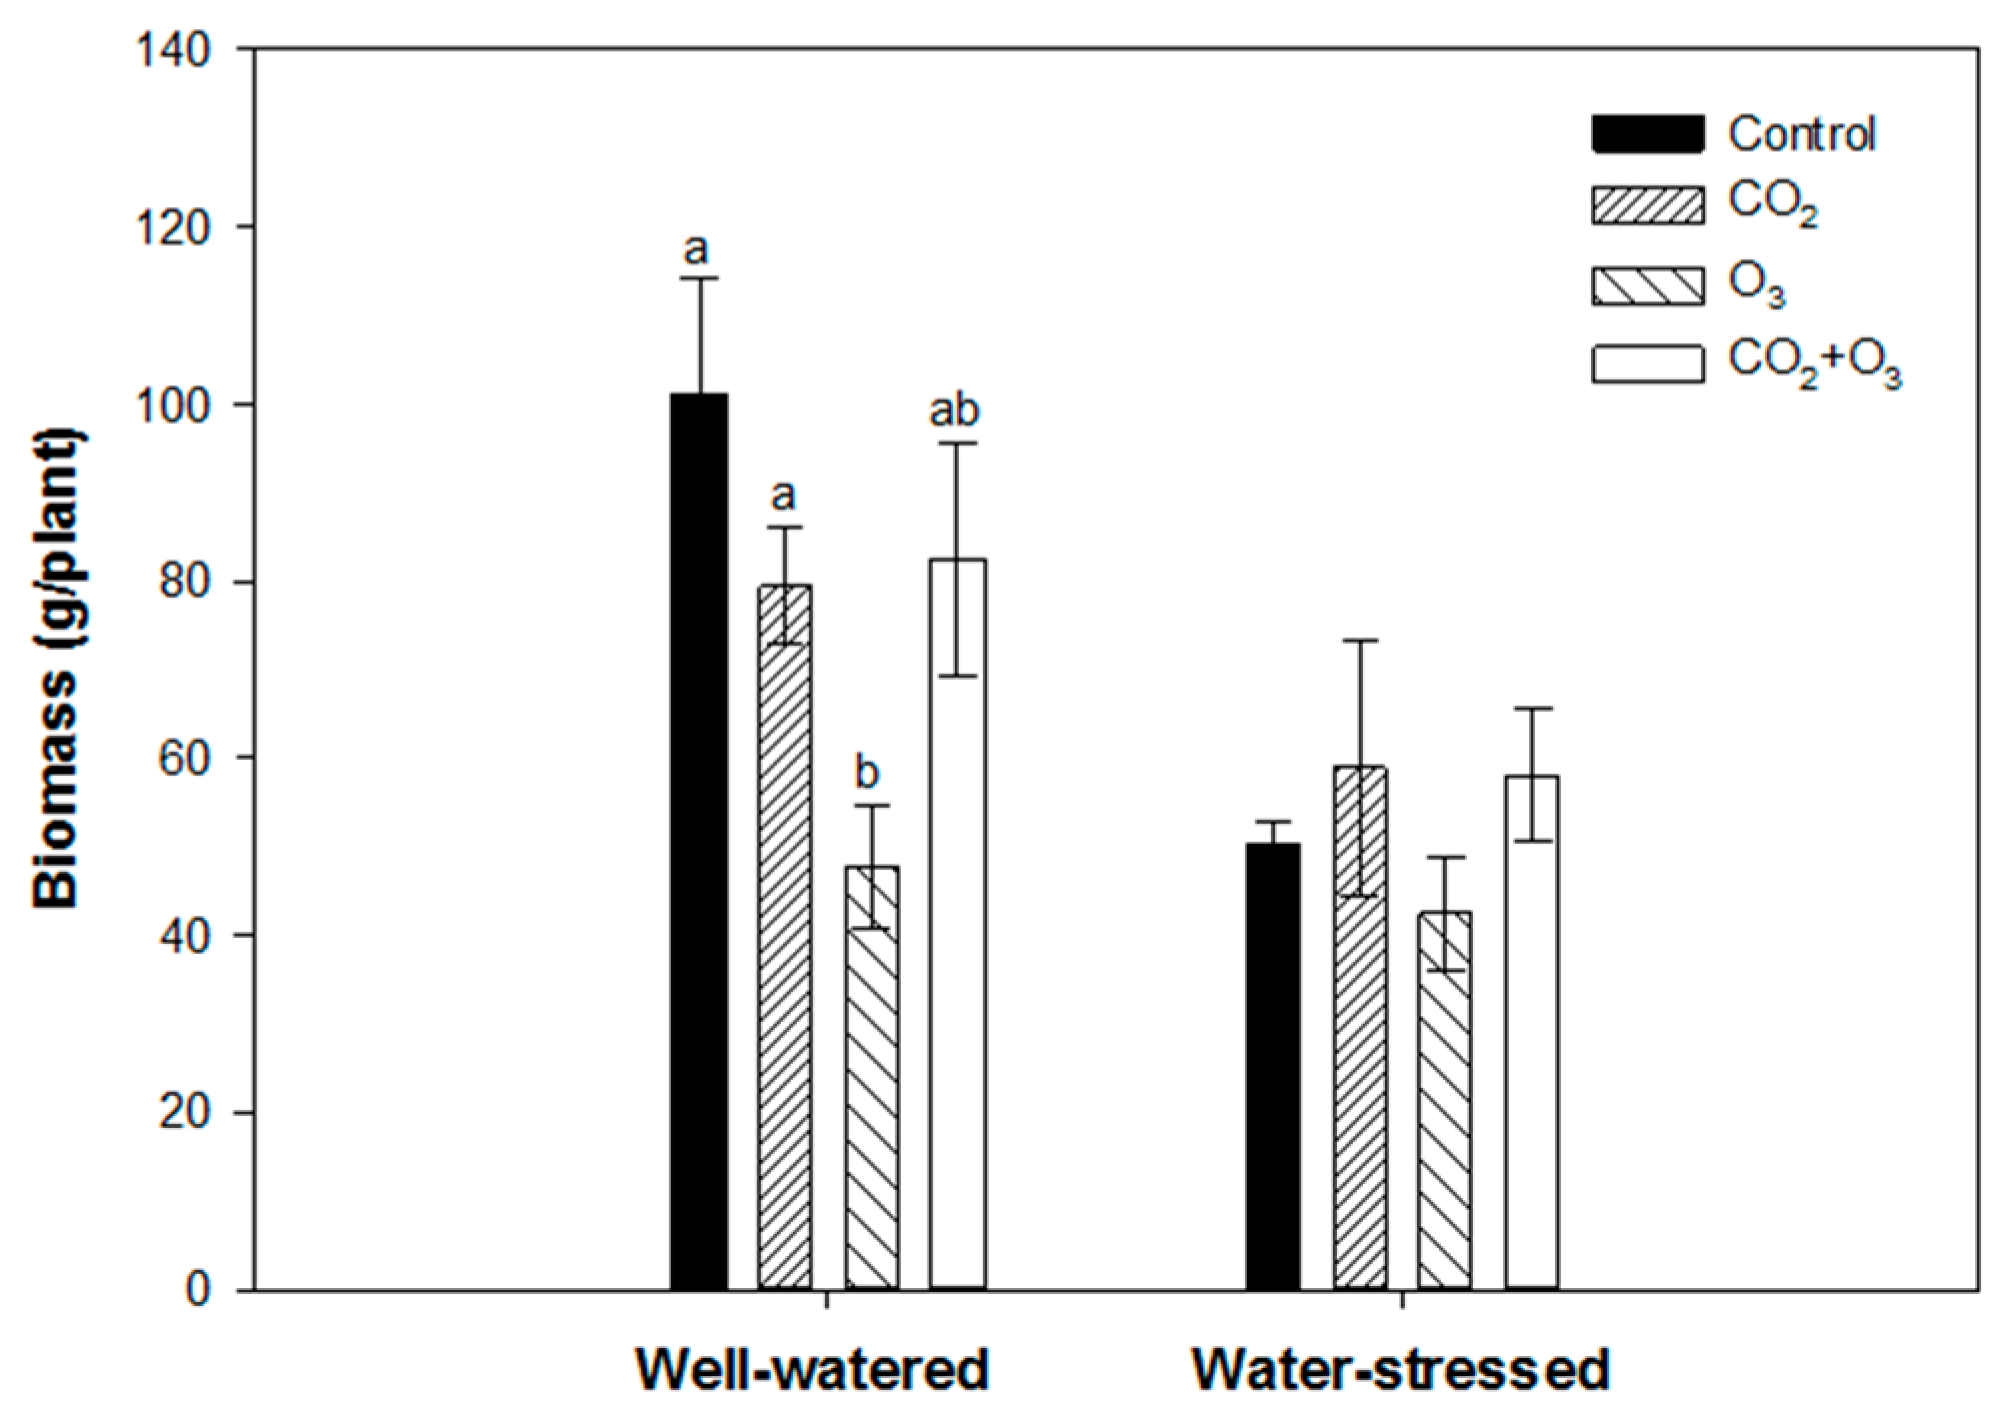
2.1. Photosynthetic Responses of Canola to Elevated Levels of CO2 and O3

The averages of the raw fluorescence transients of canola leaves were plotted on a logarithmic time scale from 20 µs to 1 s and the values are expressed as Ft/F0 (Figure 1). The steps O, J, I and P are indicated. In order to reveal hidden differences, the fluorescence data were normalized between O (20 μs) and K (300 μs) steps, as VOK = (Ft − F0)/(FK − F0), and plotted as difference kinetics ΔVOK = VOK(treatment) − VOK (control). Also, fluorescence data were normalized between the steps O and J (2 ms), as VOJ = (Ft − F0)/(FJ − F0), and plotted as difference kinetics ΔVOJ = VOJ (treatment) − VOJ (control). These allowed the visualization of the positive ΔL (0.15 ms) and ΔK-band (0.3 ms) in the O3 treatment (Figure 2). The appearance of ΔL and ΔK-band is regarded as a good indicator to detect the physiological disturbances of plants caused by environmental conditions [30].
Canola plants fumigated with elevated CO2 and O3 caused the decline of the PItotal when subjected to well-watered conditions (Figure 3). However, in water-stressed plants, no significant difference was found when compared with the control. The combination of elevated CO2 and O3 had higher PItotal values under both water regimes (Figure 3).
The PItotal is an overall parameter calculated from the JIP-test that combines biophysical parameters. The parameters are the density of reaction centers (RC/ABS); the parameter (φPo /(1 − φPo), where φPo represents the maximum quantum yield of primary photochemistry; the parameter (ψEo /(1 − ψEo), where ψEo represents the efficiency with which an electron moves into the electron transport chain further than QA-; the parameter (δRo /(1 − δRo), where δRo represents the efficiency with which an electron from the intersystem electron carriers is transferred to reduce end electron acceptors at the PSI (Photosystem I) acceptor side. The statistical analysis of the effect of elevated CO2, O3 and CO2 + O3 on the components of the PItotal in canola leaves is shown in Table 1.
Plants in the O3 treatment enhanced the parameter ψEo/(1 − ψEo) under both water regimes, while the parameter δRo /(1 − δRo) was reduced. The combination of CO2 and O3 improved the parameter δRo /(1 − δRo) when subjected to well-watered and water-stressed conditions (Table 1).
Elevated CO2 and the combination of CO2 and O3 had no significant effect on the above ground biomass of well-watered plants. However, canola plants exposed to O3 (80 ppb) caused a significant reduction in biomass under well-watered conditions (Figure 4). In water-stressed plants, none of the treatments had a significant effect on biomass production, but based on average values, elevated CO2 and the combination of CO2 and O3 led to a higher biomass than the control (Figure 4).
The radar plot indicates that the decline of PItotal in well-watered canola plants exposed to elevated O3 was caused by the parameter δRo /(1 − δRo) (Figure 5). This drop was linked to the decrease of biomass accumulation. The higher PItotal in canola plants fumigated with a combination of CO2 and O3 was sustained by the parameter, δRo /(1 − δRo).

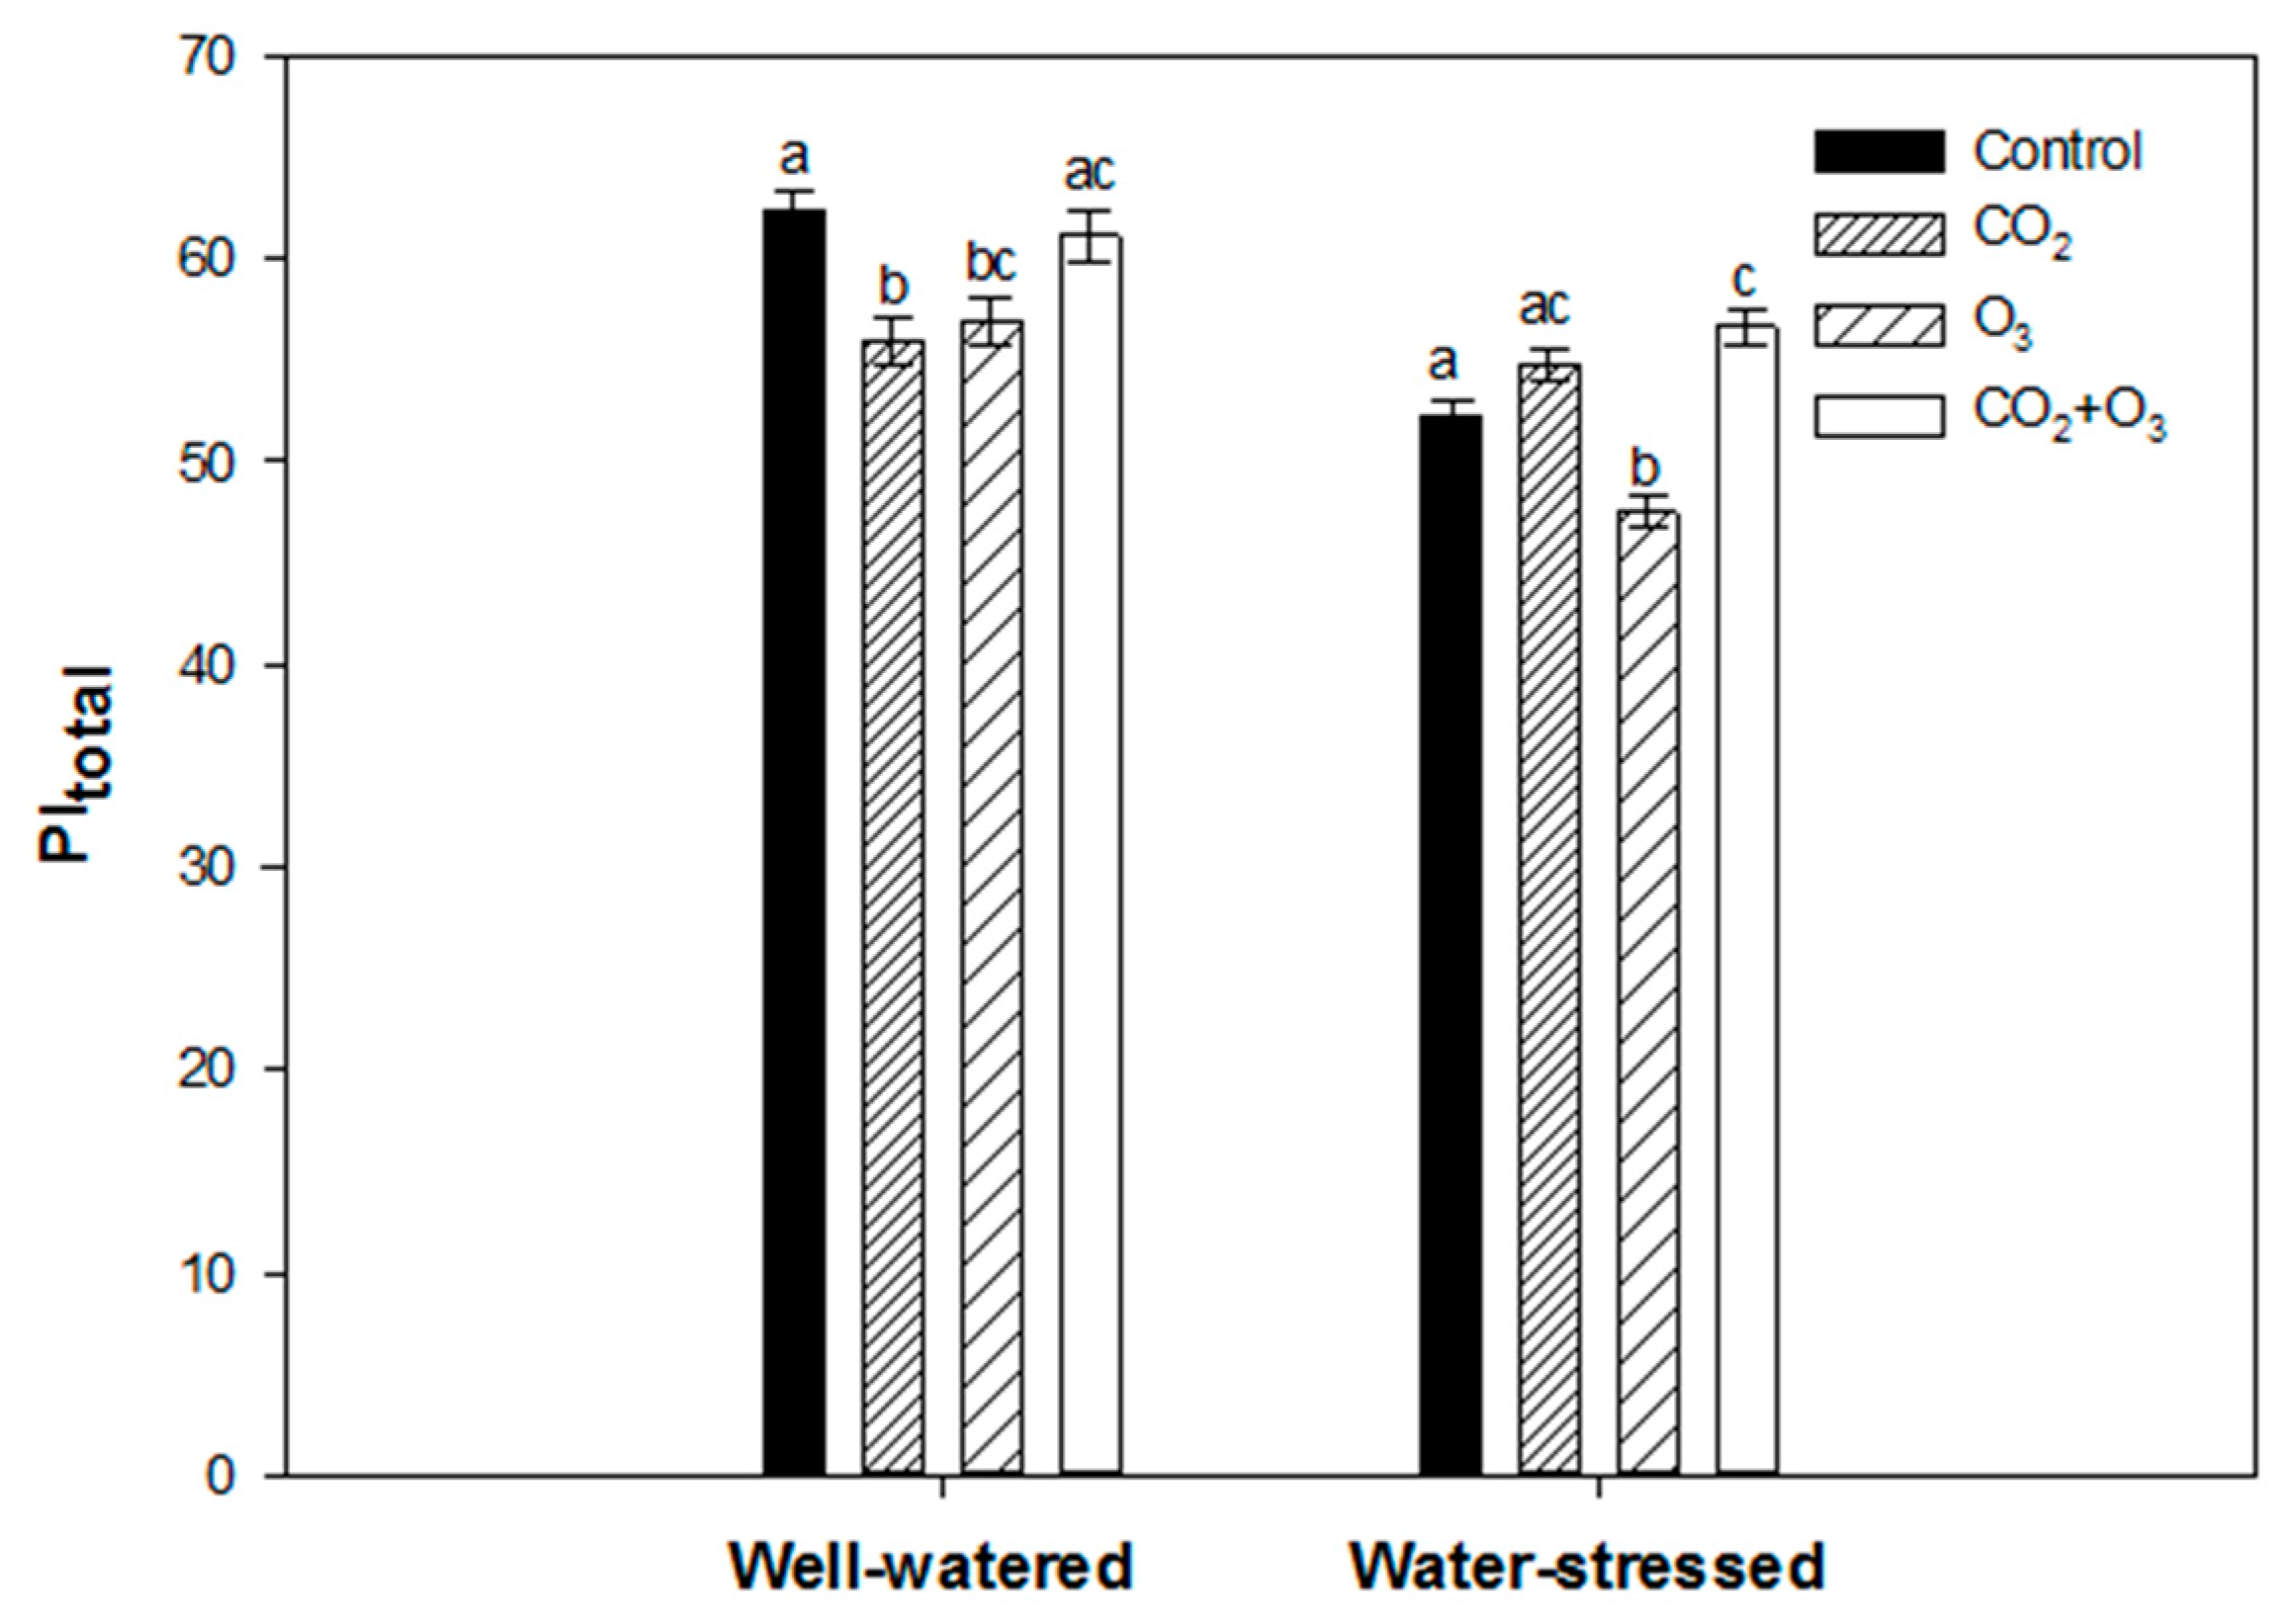
2.2. Photosynthetic Responses of Wheat to Elevated Levels of CO2 and O3

The average Chl a fluorescence transient of dark-adapted wheat leaves for the four treatments under well-watered (Figure 6A) and water-stressed (Figure 6B) conditions were plotted on a logarithmic time scale, 20 μs to 1 s and expressed as Ft/F0 for clarity. The four transients showed a typical OJIP shape, with small differences between them. In order to show the hidden differences, the fluorescence data were normalized between O (20 μs) and K (300 μs) steps, as VOK = (Ft − F0)/(FK − F0), and plotted as difference kinetics ΔVOK = VOK(treatment) − VOK (control), which revealed the ΔL-band. A positive ΔL-band indicates lower energetic connectivity while a negative ΔL-band indicates higher energetic connectivity [31]. Furthermore, the fluorescence data were normalized between the steps O and J (2 ms), as VOJ = (Ft − F0)/(FJ − F0), and plotted as difference kinetics ΔVOJ = VOJ(treatment) − VOJ (control) revealing the ΔK-band.
A positive ΔK-band shows an increased reduction rate of quinone (QA), from QA to QA, which suggests that the oxygen evolving complex (OEC) may have become leaky and offers access to non-water electron donors [32]. Positive ΔL- and ΔK-bands in the O3 treatment were revealed clearly under both water regimes (Figure 7).
Elevated CO2 resulted in a significant decrease of the total performance index (PItotal) in wheat plants subjected to well-watered conditions (Figure 8). However, no significant difference was found in water-stressed plants exposed to elevated CO2. Ozone fumigation led to a significant decline in PItotal under both water regimes. The combination of elevated CO2 and O3 did not affect the photosynthetic performance (based on the PItotal) of well-watered wheat plants. However, in water-stressed wheat plants, the PItotal increased significantly by 9%, compared with the non-fumigated plants (Figure 8).
The statistical analysis of the effect of elevated CO2, O3 and CO2 + O3 on these parameters under well-watered and water-stressed conditions is presented in Table 2. We note that fumigation on wheat plants had a significant effect on the components of the PItotal with the exception of the parameter (ψEo /(1 − ψEo) in well-watered plants. Elevated CO2 and O3 caused a significant decline in the density of reaction centers and the parameter δRo /(1 − δRo) (Table 2). The combination of CO2 and O3 enhanced the density of reaction centers under both water regimes.
Ozone fumigation caused a reduction in biomass of wheat plants when subjected to well-watered and water-stressed conditions. Compared with the control, biomass was reduced by about 40% under well-watered and 22% under water-stressed conditions (Figure 9). In water-stressed plants, fumigation did not have any significant effect on biomass. However, based on average values the plants exposed to elevated CO2 and CO2 + O3, treatments had a higher biomass compared with the control (Figure 9).
The radar plot of the PItotal and its components and biomass is presented in Figure 10. As shown, the reduction in biomass of ozone-treated plants is related to the decrease of the PItotal. On the other hand, the biomass enhancement in water-stressed wheat plants exposed to the combined effect of elevated CO2 and O3 is well associated with the increase in PItotal. We noted that the PItotal was generally influenced by the density of reaction centers and efficiency, with which an electron from the intersystem electron carriers is transferred to reduce end electron acceptors at the PSI acceptor side (Figure 10).

3. Discussion

Elevated CO2 increases the photosynthetic performance of plants, which in turn results in higher biomass production [33,34], but often declines with time when plants are subjected to elevated CO2 over extended periods [33]. Prolonged exposure of plants to elevated CO2 reduces the initial stimulation of photosynthesis [35] and as a result suppresses photosynthesis, which reduces growth responses [36]. It has been suggested that crop plants subjected to reduced water will respond positively to elevated CO2 in comparison to crop plants under sufficient water supply, as CO2 causes an increase in stomatal resistance [5]. We found that plants fumigated with elevated CO2 resulted in a decline of the photosynthetic performance (as revealed by the PItotal) under well-watered conditions in both crop species. The decline of the PItotal can be ascribed to exposing the plants to elevated CO2 for more than four weeks. The decrease in the PItotal under well-watered conditions was mainly influenced by the density of reaction centers and efficiency with which an electron from the intersystem electron carriers is transferred to reduce end electron acceptors at the PSI acceptor side (δRo). A low I-P amplitude may indicate a low capacity of electron transport through PSI. It was shown that the activity of PSI can limit photosynthetic electron transport through PSI, and that PSI can be limiting for CO2 assimilation [37,38], which can be especially important under elevated CO2 [39]. Liu et al. [40] reported that elevated CO2 enhanced the photosynthetic performance of cucumber plants under moderate drought stress. We found that none of the water-stressed plants were affected by elevated CO2, but on average the PItotal values were higher than those of the control. The PItotal values were well-maintained by an increase of the parameter δRo, indicating an increased capacity to reduce end acceptors beyond PSI. The increase of the I-P amplitude was shown to be associated also with an increase of capacity in alternative electron transport pathways [41]. In addition, above ground biomass in both crops was not significantly affected by elevated CO2 when subjected to well-watered and water-stressed conditions. However, previous studies reported that elevated CO2 significantly increased biomass in canola and wheat plants [42,43,44]. The difference can be attributed to the decline in the photosynthetic capacity of the plants, as indicated by the PItotal, and that the response of crops to elevated CO2 varies between genotypes [5]. Even though there was no significant difference in the water-stressed plants, the CO2 treatment enhanced the biomass of both crops. The biomass stimulation caused by elevated CO2 can also result from reduced water loss and water stress, and/or from decreased respiration [45]. The greater biomass in dry conditions in response to elevated CO2 has been discussed by Fitzgerald et al. [46]. It should be noted that the beneficial effect of elevated CO2 in plants subjected to water-stress not only increases biomass production, but also translates into higher crop yield [14,47]. Elevated CO2 stimulated yield of water-stressed wheat plants (data not shown). Our results suggest that elevated CO2 concentrations may counteract the negative effect of droughts on canola and wheat. Therefore, it appears that canola and wheat crops grown in limited water availability will benefit more from elevated CO2.
The appearance of the positive ΔL- and ΔK-bands indicates that both crops are more sensitive to elevated O3 with reference to lower energetic connectivity and inactivation of the OEC, respectively [26,31,48]. Similar findings were reported by Desotgiu et al. [49] in poplar plants subjected to O3 and water stress. The amplitude of the ΔK-band was higher in the well-watered plants when compared with the water-stressed plants. This suggests that limited water availability can reduce inactivation of the OEC. The OEC represents one of the sensitive components of the PSII (Photosystem II) [50,51]. Furthermore, the appearance of the K-band revealed that elevated O3 upset the functioning of OEC in the PSII [52]. The transients were further analyzed with the JIP-test equations, which led to the calculation of several photosynthetic parameters and the PItotal. In the present experiment, both crop species—canola and wheat—showed a tendency to reduce the PItotal in the O3 treatment (80 ppb) particularly under well-watered conditions. Under drought conditions, the decrease was significant only in wheat plants. This indicates that the effect of O3 was minor under drought conditions in canola plants [53]. The reduction of the PItotal was caused by the efficiency with which an electron from the intersystem electron carriers was transferred to reduce end electron acceptors at the PSI acceptor side, as well as the decline of the density of reaction centers, which, taking into account that φPo remained nearly unchanged, represented an increase of the functional PSII antenna size [26]. The efficiency that an electron moves further than Q was relatively less affected by elevated O3 in both plants. Although a temporarily enhanced ψEo was detected in canola plants, it did not influence the PItotal. The increased efficiency was linked to the activating of repair processes, but when it was linked to a reduced end acceptor capacity in combination with a reduced Calvin cycle, energy demand led to over-excitation of the photosynthetic apparatus [27]. These results support the findings obtained from other studies that the I-P region (as revealed by the relevant parameters) is sensitive to stress caused by O3 [27,54]. The biomass was significantly affected by O3 fumigation in both crop plants under well-watered conditions. There was no significant difference under water-stressed treatment, but based on average values, the biomass was reduced in O3 treatment. In the experiment, where fumigation with 60 ppb of O3 was applied in canola, the biomass was barely affected [43], and similar findings were reported in a study using four canola cultivars [44]. On the contrary, Feng et al. [55] found that elevated O3 decreased above ground biomass by 18%. The response to O3 achieved in the present study can be interpreted by the higher than 60 ppb concentration applied, and to cultivar differences [56]. Similarly, only two out of five wheat cultivars showed a decrease in above ground biomass when subjected to O3 [57]. Based on the radar, it was suggested that the drop in biomass production was associated with the decline of the PItotal [58,59].
The ΔL-band exhibited differences in energetic connectivity among the PSII units [26]. The energetic connectivity among PSII units improved in the CO2 + O3 treatment under water-stressed conditions. This was demonstrated by the appearance of the negative ΔL-band, which indicated higher energetic connectivity. A higher energetic connectivity resulted in an improved use of the excitation energy and a higher stability of the photosynthetic system [31,60]. This suggests that elevated CO2 and reduced water supply could improve the utilization of excitation energy and the stability of photosynthetic systems. Furthermore, the appearance of the negative ΔK-band under water stress showed that plants fumigated with elevated CO2 + O3 have either a more active oxygen evolving system or a smaller PSII antenna size [60]. These effects should be regarded as favorable for the photosynthetic apparatus [60]. As shown by the PItotal, fumigation with elevated CO2 + O3 increased the photosynthetic efficiency of canola plants under both well-watered and water-stressed conditions. In wheat plants, the increase was significant only under water-stressed conditions. The increase in the PItotal was mostly caused by the parameter δRo. The combinations of CO2 and O3 did not reveal any significant reductions in biomass. This suggests that elevated CO2 can ameliorate the detrimental effects of elevated O3 and droughts upon canola and wheat. In addition, the photosynthetic process was not compromised as a result of the combined effects of elevated CO2 and O3. The increase in photosynthetic performance (as revealed by the JIP-test parameters) was associated with the increase in biomass production. This indicates that biomass enhancement was most probably caused by the increase in photosynthetic efficiency of the plants.

4. Materials and Methods

4.1. Experimental Site and Plant Materials

The experiments were conducted in Open-Top Chambers situated at the North-West University, South Africa. The canola and wheat experiments were performed from June to August in 2014 and 2015, respectively. Heyneke et al. [61] has discussed the design and operation of the OTCs system used in the current study. Canola (Brassica napus L. cv. Rainbow) and wheat (Triticum aestivum L. cv. SST875) seeds were sown in pots with a diameter of about 30 cm. The pots were watered manually prior to the start of fumigation with elevated CO2 and O3 to ensure that the seeds germinated successfully. Six-month slow release fertilizer (25 g) was added to each pot comprising 17 nitrogen:11 phosphorus:10 potassium:2 magnesium oxide:TE (Osmocote Pro, The Netherlands). The growth medium was composed of topsoil, river sand and vermiculite (2:1:1). The pots were placed into eight OTCs. Two chambers were used per treatment. The treatments were the control (carbon filtered air, OTC 1 and 2); CO2 (700 ppm, OTC 3 and 4); O3 (80 ppb, OTC 5 and 6) and CO2 + O3 (700 ppm + 80 ppb, OTC 7 and 8). The carbon filtered air was used only for the control treatment, from which O3 and other pollutants were removed.

4.2. Fumigation and Water Treatment

Plants were exposed to elevated CO2 (700 ppm) and O3 (80 ppb) and the combination of these two gases (CO2 + O3) from 08:00am to 17:00pm for 4 weeks. Elevated CO2 levels inside the OTCs were monitored with a CO2 monitor (Model 174687 CO2_temp-relative-humidity monitor, Scientific Associates, Inc., China). Ozone levels were continuously monitored using an O3 monitor (Model 205 Ozone Monitor, 2B Technologies, Inc., USA). The temperatures varied between 23 °C and 17 °C during the fumigation period. The ambient ozone levels were below 35 ppb over the entire fumigation period.
The plants were exposed to two water regimes, namely water-watered and water-stressed (water deficit) conditions. All the plants absorbed water through glass fiber wicks that were projected into water reservoirs. In the well-watered treatment, four wicks were placed at four levels within the pots, while in the water-stressed treatment, one glass fiber wick was positioned at the middle level of each pot [43]. The pots were positioned into reservoirs that were connected to a drip irrigation system that filled up the water.

4.3. Chlorophyll a Fluorescence

The fast chlorophyll a fluorescence transients were measured with a Handy PEA (Plant Efficiency Analyser) fluorimeter (Hansatech Instruments Ltd, UK) on the leaves of canola and wheat. Before measurements were taken, the leaves were dark-adapted for an hour. The OJIP transients were induced by red light (peak at 650 nm) of 3000 μmol photons m−2 s−1 provided by an array of three light-emitting diodes and recorded for 1 s with 12 bit resolution. The data acquisition occurred at every 10 μs, from 10 μs to 0.3 ms; every 0.1 ms, from 0.3 to 3 ms; every 1 ms, from 3 to 30 ms; every 10 ms, from 30 to 300 ms and every 100 ms, from 300 ms to 1 s. The OJIP transients were analyzed by the JIP-test [19,50] using the PEA Plus ver. 1.10 Program (Hansatech Instruments Ltd, UK). The following fluorescence data from the original measurements were used by the JIP-test: the minimal intensity at 20 µs (O step); the intensities at 50 and 300 µs (F300 and F50) used for calculation of the initial slope (M0); the intensity at 2 ms (J step); the intensity at 30 ms (I step) and the maximal measured intensity when all PSII reaction centers (RCs) were closed (Fm, P step). The following JIP-test parameters were derived from the OJIP transients, all referring to time zero (onset of fluorescence induction): the maximum quantum yield of primary photochemistry, φPo = TR0/ABS = [1 − (F0/FM)]; the efficiency/probability that an electron moves further than QA into the electron transport chain, ψEo = ET0/TR0 = (1 − VJ); the efficiency/probability with which an electron from the intersystem electron carriers is transferred to reduce end electron acceptors at the PSI acceptor side (RE), δRo = RE0/ET0 = (1 − VI)/(1 − VJ); the density of reaction centers, RC/ABS = γRC /(1 − γRC) = φPo (VJ/M0) and the total performance index (PItotal) = [γRC /(1 − γRC)], [φPo /(1− φPo)], [ψEo /(1 − ψEo)], [δRo /(1 − δRo)], an index (potential) for energy conservation from excitons to the reduction of PSI end-electron acceptors.

4.4. Biomass

Plants were harvested after four weeks and the fresh plant material was oven-dried at 60 °C for 72 h and weighed.

4.5. Statistical Analysis

Statistical analysis were carried out with STATISTICA 13 (Stat Soft. Inc., Tulsa, OK, USA).
The data were analyzed using one-way analysis of variance (ANOVA) and significant differences between treatment means were determined by the Tukey’s honest significant difference (HSD) post-hoc test.

5. Conclusions

In conclusion, elevated O3 led to a decrease in biomass of canola and wheat plants. This reduction was caused by a decline in the photosynthetic efficiency as revealed by the total performance index (PItotal). The results of the current study indicate that elevated O3 would pose a threat in the future to agricultural crops. The decline in the PItotal was mostly influenced by the efficiency with which an electron from the intersystem electron carriers was transferred to reduce end electron acceptors at the PSI acceptor side. The present study also suggests that the PSII was damaged and the photosynthetic apparatus was compromised due to elevated O3. Elevated CO2 reduces the drought effect both in the absence and presence of O3. This was also supported by above ground biomass results, which showed higher values under elevated CO2. Our findings suggest that elevated CO2 can reduce the negative effect of abiotic stress, such as droughts and O3 in canola and wheat plants. The measurement of Chl a fluorescence can be used to screen the effect of elevated CO2 and O3 in canola and wheat plants cultivated locally. Further studies should seek to investigate several local varieties of canola and wheat responses to elevated CO2, O3 and droughts and their interaction.

Author Contributions

J.M.B. and P.M.I. were leaders of the project. All authors were responsible for experimental and project design.

Funding

This study was supported by the Cuomo Foundation, through the partnership with the Intergovernmental Panel on Climate Change (IPCC) scholarship programme and the Applied Centre for Climate and Earth Systems Science (ACCESS).

Conflicts of Interest

The authors declare no conflict of interest.

References

  1. Mulholland, B.J.; Craigon, J.; Black, C.R.; Colls, J.J.; Atherton, J.; Landon, G. Effects of elevated carbon dioxide and ozone on the growth and yield of spring wheat (Triticum aestivum L.). Environ. Exp. Bot. 1997, 48, 113–122. [Google Scholar] [CrossRef]
  2. Pleijel, H.; Gelang, J.; Sild, E.; Danielsson, H.; Younis, S.; Karlsson, P.E.; Wallin, G.; Skärby, L.; Selldén, G. Effects of elevated carbon dioxide, ozone and water availability on spring wheat growth and yield. Physiol. Plant 2000, 108, 61–70. [Google Scholar] [CrossRef]
  3. Jaggard, K.W.; Qi, A.; Ober, E.S. Possible changes to arable crop yields by 2050. Philos. Trans. R. Soc. B 2010, 365, 2835–2851. [Google Scholar] [CrossRef] [PubMed] [Green Version]
  4. Li, X.; Zhang, L.; Li, Y.; Ma, L.; Chen, Q.; Wang, L.L.; He, X. Effects of elevated carbon dioxide and/or ozone on endogenous plant hormones in the leaves of Ginkgo biloba. Acta Physiol. Plant 2011, 33, 129–136. [Google Scholar] [CrossRef]
  5. Porter, J.R.; Xie, L.; Challinor, A.J.; Cochrane, K.; Howden, S.M.; Iqbal, M.M.; Lobell, D.B.; Travasso, M.I. Food security and food production systems. In Climate Change 2014: Impacts, Adaptation, and Vulnerability. Part A: Global and Sectoral Aspects. Contribution of Working Group II to the Fifth Assessment Report of the Intergovernmental Panel on Climate Change; Field, C.B., Barros, V.R., Dokken, D.J., Mach, K.J., Mastrandrea, M.D., Bilir, T.E., Chatterjee, M., Ebi, K.L., Estrada, Y.O., Genova, R.C., et al., Eds.; Cambridge University Press: Cambridge, UK, 2014; pp. 485–533. [Google Scholar]
  6. Ainsworth, E.A.; Yendrek, C.R.; Sitch, S.; Collins, W.J.; Emberson, L.D. The effects of tropospheric ozone on net primary productivity and implications for climate change. Annu. Rev. Plant Biol. 2012, 63, 637–661. [Google Scholar] [CrossRef] [PubMed]
  7. Emberson, L.D.; Pleijel, H.; Ainsworth, E.A.; Van Den Berg, M.; Ren, W.; Osborne, S.; Mills, G.; Pandey, D.; Dentener, F.; Büker, P.; et al. Ozone effects on crops and consideration in crop models. Eur. J. Agron. 2018, 100, 19–34. [Google Scholar] [CrossRef]
  8. Krasensky, J.; Carmody, M.; Sierla, M.; Kangasjärvi, J. Ozone and reactive oxygen species. eLS. 2017. Available online: http://www.els.net (accessed on 26 October 2018). [CrossRef]
  9. Van Tienhoven, A.M.; Zunckel, M.; Emberson, L.; Koosailee, A.; Otter, L. Preliminary assessment of risk of ozone impacts to maize (Zea mays) in southern Africa. Environ. Pollut. 2006, 140, 220–230. [Google Scholar] [CrossRef] [PubMed]
  10. Laakso, L.; Beukes, J.P.; Van Zyl, P.G.; Pienaar, J.J.; Josipovic, M.; Venter, A.D.; Jaars, K.; Vakkari, V.; Labuschagne, C.; Chiloane, K.; et al. Ozone concentrations and their potential impacts on vegetation in southern Africa. In Climate Change, Air Pollution and Global Challenges Understanding and Perspectives from Forest Research; Matyssek, R., Clarke, N., Cudlin, P., Mikkelsen, T.N., Tuovinen, J.-P., Wieser, G., Paoletti, E., Eds.; Elsevier: Oxford, UK, 2013; pp. 2–622. [Google Scholar]
  11. Zunckel, M.; Venjonoka, K.; Pienaar, J.J.; Brunke, E.G.; Pretorius, O.; Koosialee, A.; Raghunandan, A.; Van Tienhoven, A.M. Surface ozone over southern Africa: Synthesis of monitoring results during the Cross border Air Pollution Impact Assessment project. Atmos. Environ. 2004, 38, 6139–6147. [Google Scholar] [CrossRef]
  12. Hatfield, J.L.; Boote, K.J.; Kimball, B.A.; Ziska, L.H.; Izaurralde, R.C.; Ort, D.; Thomson, A.M.; Wolfe, D. Climate impacts on agriculture: Implications for crop production. Agron. J. 2011, 103, 351–370. [Google Scholar] [CrossRef]
  13. Robredo, A.; Pérez-López, U.; de la Maza, H.S.; González-Moro, B.; Lacuesta, M.; Mena-Petite, A.; Munoz-Rueda, A. Elevated CO2 alleviates the impact of drought on barley improving water status by lowering stomatal conductance and delaying its effects on photosynthesis. Environ. Exp. Bot. 2007, 59, 252–263. [Google Scholar] [CrossRef]
  14. Van Der Kooi, C.J.; Reich, M.; Löw, M.; De Kok, L.J.; Tausz, M. Growth and yield stimulation under elevated CO2 and drought: A meta-analysis on crops. Environ. Exp. Bot. 2016, 122, 150–157. [Google Scholar] [CrossRef]
  15. Volin, J.C.; Reich, P.B.; Givnish, T.J. Elevated carbon dioxide ameliorates the effects of ozone on photosynthesis and growth: Species respond similarly regardless of photosynthetic pathway or plant functional group. New Phytol. 1998, 138, 315–325. [Google Scholar] [CrossRef]
  16. Kalaji, H.M.; Rastogi, A.; Živčák, M.; Brestic, M.; Daszkowska-Golec, A.; Sitko, K.; Alsharafa, K.Y.; Lotfi, R.; Stypiński, P.; Samborska, I.A.; et al. Prompt chlorophyll fluorescence as a tool for crop phenotyping: An example of barley landraces exposed to various abiotic stress factors. Photosynthetica 2018, 56, 953–961. [Google Scholar] [CrossRef]
  17. Bhagat, K.P.; Kumar, R.A.; Ratnakumar, P.; Kumar, S.; Bal, S.K.; Agrawal, P.K. Photosynthesis and associated aspects under abiotic stresses environment. In Approaches to Plant Stress and Their Management; Springer: New Delhi, India, 2014; pp. 191–205. [Google Scholar]
  18. Reddy, A.R.; Chaitanya, K.V.; Vivekanandan, M. Drought-induced responses of photosynthesis and antioxidant metabolism in higher plants. J. Plant Physiol. 2004, 161, 1189–1202. [Google Scholar] [CrossRef]
  19. Flexas, J.; Medrano, H. Drought-inhibition of photosynthesis in C3 plants: Stomatal and non-stomatal limitations revisited. Ann. Bot. 2002, 89, 183–189. [Google Scholar] [CrossRef] [PubMed]
  20. Pinheiro, C.; Chaves, M.M. Photosynthesis and drought: Can we make metabolic connections from available data? Environ. Exp. Bot. 2010, 62, 869–882. [Google Scholar] [CrossRef] [PubMed]
  21. Zivcak, M.; Brestic, M.; Balatova, Z.; Drevenakova, P.; Olsovska, K.; Kalaji, H.M.; Yang, X.; Allakhverdiev, S.I. Photosynthetic electron transport and specific photoprotective responses in wheat leaves under drought stress. Photosynth. Res. 2013, 117, 529–546. [Google Scholar] [CrossRef] [PubMed]
  22. Strasser, R.J.; Tsimilli-Michael, M.; Qiang, S.; Goltsev, V. Simultaneous in vivo recording of prompt and delayed fluorescence and 820-nm reflection changes during drying and after rehydration of the resurrection plant Haberlea rhodopensis. Biochim. Biophys. Acta. 2010, 1797, 1313–1326. [Google Scholar] [CrossRef] [PubMed]
  23. Baghel, L.; Kataria, S.; Guruprasad, K.N. Effect of static magnetic field pretreatment on growth, photosynthetic performance and yield of soybean under water stress. Photosynthetica 2018, 56, 718–730. [Google Scholar] [CrossRef]
  24. Olechowicz, J.; Chomontowski, C.; Olechowicz, P.; Pietkiewicz, S.; Jajoo, A.; Kalaji, M.H. Impact of intraspecific competition on photosynthetic apparatus efficiency in potato (Solanum tuberosum) plants. Photosynthetica 2018, 56, 971–975. [Google Scholar] [CrossRef]
  25. Tsimilli-Michael, M.; Strasser, R.J. Fingerprints for climate changes on the behaviour of the photosynthetic apparatus, monitored by the JIP-test. A case study on light and heat stress adaptation of the symbionts of temperate and coral reef foraminifers in hospite. In “Fingerprints” of Climate Changes–Adapted Behaviour and Shifting Species Ranges; Walther, G.-R., Burga, C.A., Edwards, P.J., Eds.; Kluwer Academic Publishers: New York, NY, USA, 2001; pp. 229–247. [Google Scholar]
  26. Strasser, R.J.; Tsimilli-Michael, M.; Srivastava, A. Analysis of the chlorophyll a fluorescence transient. In Chlorophyll Fluorescence: A Signature of Photosynthesis; Papageorgiou, E., Govindjee, G.C., Eds.; Kluwer Academic Publishers: Rotterdam, The Netherlands, 2004; pp. 321–362. [Google Scholar]
  27. Bussotti, F.; Desotgiu, R.; Cascio, C.; Pollastrini, M.; Gravano, E.; Gerosa, G.; Marzuoli, R.; Nali, C.; Lorenzini, G.; Salvatori, E.; et al. Ozone stress in woody plants assessed with chlorophyll a fluorescence. A critical reassessment of existing data. Environ. Exp. Bot. 2011, 73, 19–30. [Google Scholar] [CrossRef]
  28. Perboni, A.; Cassol, D.; Silva, F.; Silva, D.; Bacarin, M. Chlorophyll a fluorescence study revealing effects of flooding in canola hybrids. Biologia 2012, 67, 38–346. [Google Scholar] [CrossRef]
  29. Kalaji, H.M.; Jajoo, A.; Oukarroum, A.; Brestic, M.; Zivcak, M.; Samborska, I.A.; Cetner, M.D.; Łukasik, I.; Goltsev, V.; Ladle, R.J. Chlorophyll a fluorescence as a tool to monitor physiological status of plants under abiotic stress conditions. Acta Physiol. Plant. 2016, 38, 102. [Google Scholar] [CrossRef]
  30. Oukarroum, A.; El Madidi, S.; Schansker, G.; Strasser, R.J. Probing the responses of barley cultivars (Hordeum vulgare L.) by chlorophyll a fluorescence OLKJIP under drought stress and re-watering. Environ. Exp. Bot. 2007, 60, 438–446. [Google Scholar] [CrossRef]
  31. Yusuf, M.A.; Kumar, D.; Rajwanshi, R.; Strasser, R.J.; Tsimilli-Michael, M.; Sarin, N.B. Overexpression of γ-tocopherol methyl transferase gene in transgenic Brassica juncea plants alleviates abiotic stress: Physiological and chlorophyll a fluorescence measurements. Biochim. Biophys. Acta 2010, 1797, 1428–1438. [Google Scholar] [CrossRef] [PubMed]
  32. Gururani, M.A.; Venkatesh, J.; Ganesan, M.; Strasser, R.J.; Han, Y.; Kim, J.I.; Lee, H.Y.; Song, P.S. In vivo assessment of cold tolerance through chlorophyll-a fluorescence in transgenic zoysiagrass expressing mutant phytochrome A. PLoS ONE 2015, 10, e0127200. [Google Scholar] [CrossRef] [PubMed]
  33. Kant, S.; Seneweera, S.; Rodin, J.; Materne, M.; Burch, D.; Rothstein, S.J.; Spangenberg, G. Improving yield potential in crops under elevated CO2: Integrating the photosynthetic and nitrogen utilization efficiencies. Front Plant Sci. 2012, 3, 162. [Google Scholar] [CrossRef] [PubMed]
  34. Thompson, M.; Gamage, D.; Hirotsu, N.; Martin, A.; Seneweera, S. Effects of elevated carbon dioxide on photosynthesis and carbon partitioning: A perspective on root sugar sensing and hormonal crosstalk. Front Physiol. 2017, 8, 578. [Google Scholar] [CrossRef]
  35. Makino, A.; Mae, T. Photosynthesis and plant growth at elevated levels of CO2. Plant Cell Physiol. 1999, 40, 999–1006. [Google Scholar] [CrossRef]
  36. Wang, L.; Feng, Z.; Schjoerring, J.K. Effects of elevated atmospheric CO2 on physiology and yield of wheat (Triticum aestivum L.): A meta-analytic test of current hypotheses. Agric. Ecosyst. Environ. 2013, 178, 57–63. [Google Scholar] [CrossRef]
  37. Brestic, M.; Zivcak, M.; Kunderlikova, K.; Sytar, O.; Shao, H.; Kalaji, H.M.; Allakhverdiev, S.I. Low PSI content limits the photoprotection of PSI and PSII in early growth stages of chlorophyll b-deficient wheat mutant lines. Photosynth. Res. 2015, 125, 151–166. [Google Scholar] [CrossRef] [PubMed]
  38. Zivcak, M.; Brestic, M.; Kunderlikova, K.; Sytar, O.; Allakhverdiev, S.I. Repetitive light pulse-induced photoinhibition of photosystem I severely affects CO2 assimilation and photoprotection in wheat leaves. Photosynth. Res. 2015, 126, 449–463. [Google Scholar] [CrossRef] [PubMed]
  39. Li, X.; Brestic, M.; Tan, D.X.; Zivcak, M.; Zhu, X.; Liu, S.; Song, F.; Reiter, R.J.; Liu, F. Melatonin alleviates low PSI-limited carbon assimilation under elevated CO2 and enhances the cold tolerance of offspring in chlorophyll b-deficient mutant wheat. J. Pineal Res. 2018, 64, e12453. [Google Scholar] [CrossRef] [PubMed]
  40. Liu, B.B.; Li, M.; Li, Q.M.; Cui, Q.Q.; Zhang, W.D.; Ai, X.Z.; Bi, H.G. Combined effects of elevated CO2 concentration and drought stress on photosynthetic performance and leaf structure of cucumber (Cucumis sativus L.) seedlings. Photosynthetica 2018, 56, 942–952. [Google Scholar] [CrossRef]
  41. Pšidová, E.; Živčák, M.; Stojnić, S.; Orlović, S.; Gömöry, D.; Kučerová, J.; Ditmarová, Ľ.; Střelcová, K.; Brestič, M.; Kalaji, H.M. Altitude of origin influences the responses of PSII photochemistry to heat waves in European beech (Fagus sylvatica L.). Environ. Exp. Bot. 2018, 152, 97–106. [Google Scholar] [CrossRef]
  42. Bender, J.; Hertstein, U.; Black, C.R. Growth and yield responses of spring wheat to increasing carbon dioxide, ozone and physiological stresses: A statistical analysis of ‘ESPACE-wheat’ results. Eur. J. Agron. 1999, 10, 185–195. [Google Scholar] [CrossRef]
  43. Clausen, S.K.; Frenck, G.; Linden, L.G.; Mikkelsen, T.N.; Lunde, C.; Jørgensen, R.B. Effects of single and multifactor treatments with elevated temperature, CO2 and ozone on oilseed rape and barley. J. Agron. Crop Sci. 2011, 197, 442–453. [Google Scholar] [CrossRef]
  44. Frenck, G.; Van Der Linden, L.; Mikkelsen, T.N.; Brix, H.; Jørgensen, R.B. Increased [CO2] does not compensate for negative effects on yield caused by higher temperature and [O3] in Brassica napus L. Eur. J. Agron. 2011, 35, 127–134. [Google Scholar] [CrossRef]
  45. Long, S.P.; Zhu, X.G.; Naidu, S.L.; Ort, D.R. Can improvement in photosynthesis increase crop yields? Plant Cell Environ. 2006, 29, 315–330. [Google Scholar] [CrossRef]
  46. Fitzgerald, G.J.; Tausz, M.; O’leary, G.; Mollah, M.R.; Tausz-Posch, S.; Seneweera, S.; Mock, I.; Löw, M.; Partington, D.L.; Mcneil, D.; et al. Elevated atmospheric [CO2] can dramatically increase wheat yields in semi-arid environments and buffer against heat waves. Glob. Change Biol. 2016, 22, 2269–2284. [Google Scholar] [CrossRef]
  47. Amthor, J.S. Effects of atmospheric CO2 concentration on wheat yield: Review of results from experiments using various approaches to control CO2 concentration. Field Crops Res. 2001, 73, 1–34. [Google Scholar] [CrossRef]
  48. Strasser, R.J.; Tsimilli-Michael, M.; Dangre, D.; Rai, M. Biophysical phenomics reveals functional building blocks of plants systems biology: A case study for the evaluation of the impact of mycorrhization with Piriformospora indica. In Advanced Techniques in Soil Microbiology; Varma, A., Oelmüller, R., Eds.; Springer: Berlin/Heidelberg, Germany, 2007; pp. 319–342. [Google Scholar]
  49. Desotgiu, R.; Pollastrini, M.; Cascio, C.; Gerosa, G.; Marzuoli, R.; Bussotti, F. Chlorophyll a fluorescence analysis along a vertical gradient of the crown in a poplar (Oxford clone) subjected to ozone and water stress. Tree Physiol. 2012, 32, 976–986. [Google Scholar] [CrossRef] [PubMed]
  50. Rastogi, A.; Zivcak, M.; Tripathi, D.K.; Yadav, S.; Kalaji, H.M.; Brestic, M. Phytotoxic effect of silver nanoparticles in Triticum aestivum: Improper regulation of photosystem I activity as the reason for oxidative damage in the chloroplast. Photosynthetica 2019, 57, 209–216. [Google Scholar] [CrossRef]
  51. Kalaji, H.M.; Bąba, W.; Gediga, K.; Goltsev, V.; Samborska, I.A.; Cetner, M.D.; Dimitrova, S.; Piszcz, U.; Bielecki, K.; Karmowska, K.; et al. Chlorophyll fluorescence as a tool for nutrient status identification in rapeseed plants. Photosynth. Res. 2018, 136, 329–343. [Google Scholar] [CrossRef] [PubMed]
  52. Baghbani, F.; Lotfi, R.; Moharramnejad, S.; Bandehagh, A.; Roostaei, M.; Rastogi, A.; Kalaji, H.M. Impact of Fusarium verticillioides on chlorophyll fluorescence parameters of two maize lines. Eur. J. Plant Pathol. 2018, 1–10. [Google Scholar] [CrossRef]
  53. Maliba, B.G.; Inbaraj, P.M.; Berner, J.M. The effect of ozone and drought on the photosynthetic performance of canola. J. Integr. Agric. 2018, 17, 1137–1144. [Google Scholar] [CrossRef]
  54. Desotgiu, R.; Pollastrini, M.; Cascio, C.; Gerosa, G.; Marzuoli, R.I.; Bussotti, F. Responses to ozone on Populus “Oxford” clone in an open top chamber experiment assessed before sunrise and in full sunlight. Photosynthetica 2013, 51, 267–280. [Google Scholar] [CrossRef]
  55. Feng, Z.; Kobayashi, K.; Ainsworth, E.A. Impact of elevated ozone concentration on growth, physiology, and yield of wheat (Triticum aestivum L.): A meta-analysis. Glob. Change Biol. 2008, 14, 2696–2708. [Google Scholar]
  56. Ollerenshaw, J.H.; Lyons, T.; Barnes, J.D. Impacts of ozone on the growth and yield of field-grown winter oilseed rape. Environ. Pollut. 1999, 104, 53–59. [Google Scholar] [CrossRef]
  57. Monga, R.; Marzuoli, R.; Alonso, R.; Bermejo, V.; González-Fernández, I.; Faoro, F.; Gerosa, G. Varietal screening of ozone sensitivity in Mediterranean durum wheat (Triticum durum, Desf.). Atmos. Environ. 2015, 110, 18–26. [Google Scholar] [CrossRef]
  58. Clark, A.J.; Landolt, W.; Bucher, J.B.; Strasser, R.J. Beech (Fagus sylvatica) response to ozone exposure assessed with a chlorophyll a fluorescence performance index. Atmos. Environ. 2001, 109, 501–507. [Google Scholar] [CrossRef]
  59. Pollastrini, M.; Desotgiu, R.; Cascio, C.; Bussotti, F.; Cherubini, P.; Saurer, M.; Gerosa, G.; Marzuoli, R. Growth and physiological responses to ozone and mild drought stress of tree species with different ecological requirements. Trees 2010, 24, 695–704. [Google Scholar] [CrossRef]
  60. Tsimilli-Michael, M.; Strasser, R.J. Biophysical Phenomics: Evaluation of the Impact of Mycorrhization with Piriformospora indica. In Piriformospora indica; Varma, A., Kost, G., Oelmüller, R., Eds.; Springer-Verlag: Berlin/Heidelberg, Germany, 2013; pp. 173–190. [Google Scholar]
  61. Heyneke, E.; Smit, P.R.; Van Rensburg, L.; Krüger, G.H.J. Open-top chambers to study air pollution impacts in South Africa. Part I: Microclimate in open-top chambers. S. Afr. J. Plant Soil 2012, 29, 1–2. [Google Scholar] [CrossRef]
Figure 1. Average (of all weeks) chlorophyll (Chl) a fluorescence transients of canola leaves exposed to elevated CO2, O3 and CO2 + O3 under well-watered (A) and water-stressed conditions (B).
Plants 08 00171 g001
Figure 2. Effect of elevated CO2, O3 and the combination of CO2 and O3 on differential plots of relative chlorophyll a fluorescence (ΔVt) under well-watered (B,D) and water-stressed conditions (A,C) in leaves of canola. The data represent the average of all weeks. (A,B), ΔVOK = VOK (treatment) − VOK (control); (C,D), ΔVOJ = VOJ (treatment) − VOJ (control).
Plants 08 00171 g002
Figure 3. Average (of all weeks) PItotal of canola plants exposed to CO2, O3 and CO2 + O3 under well-watered and water-stressed conditions for four weeks. For the same water treatment, different letters show statistically significant differences (p < 0.05).
Plants 08 00171 g003
Figure 4. Biomass of canola exposed to CO2, O3 and CO2 + O3 under well-watered and water-stressed conditions after four weeks. For the same treatment, different letters show statistically significant differences (p < 0.05).
Plants 08 00171 g004
Figure 5. Radar plot of selected biophysical parameters (PItotal, RC/ABS, φPo /(1 − φPo), ψEo /(1 − ψEo), δRo /(1 − δRo)) and biomass for canola. Values were normalized on those of the control, which is presented by the regular hexagon for well-watered (A) and water-stressed (B) plants.
Plants 08 00171 g005
Figure 6. Average (of all weeks) Chl a fluorescence transients of dark-adapted wheat leaves exposed to elevated CO2, O3 and CO2+O3 under well-watered (A) and water-stressed (B) conditions.
Plants 08 00171 g006
Figure 7. The effect of elevated CO2, O3 and CO2 +O3 on differential plots of relative Chl a fluorescence (ΔVt) under well-watered (A,C) and water-stressed conditions (B,D) in leaves of wheat. The data represent the average of all weeks. (A,B), ΔVOK = VOK (treatment) − VOK (control); (C,D), ΔVOJ = VOJ (treatment) − VOJ (control).
Plants 08 00171 g007
Figure 8. Average (of all weeks) PItotal of wheat plants exposed to CO2, O3 and CO2+O3 under well-watered and water-stressed conditions for four weeks. For the same water treatment, the different letters show statistically significant differences (p < 0.05).
Plants 08 00171 g008
Figure 9. Biomass of wheat exposed to CO2, O3 and CO2+O3 under well-watered and water-stressed conditions after four weeks. For the same water treatment, the different letters show statistically significant differences (p < 0.05).
Plants 08 00171 g009
Figure 10. The radar plot of selected biophysical parameters (PItotal, RC/ABS, φPo /(1 − φPo), ψEo /(1 − ψEo), δRo /(1 − δRo) and biomass of wheat. Values were normalized on those of the control, which is shown by the regular hexagon for well-watered (A) and water-stressed (B) plants. For the JIP-test parameters, the data represent the average of all weeks.
Plants 08 00171 g010
Table 1. The effect of elevated CO2, O3 and CO2 + O3 on the components of the PItotal in canola plants under well-watered and water-stressed conditions. Values are means of weeks and SE (Standard Error). Different letters in the same row indicate statistically significant differences between the treatments (p < 0.05).
Well-WateredControlCO2O3CO2 + O3p-level
φPo /(1 - φPo)5.775 ± 0.033a5.584 ± 0.029b5.359 ± 0.027c5.459 ± 0.031c<0.001
ψEo /(1 - ψEo)2.181 ± 0.043a2.214 ± 0.029a2.444 ± 0.031b2.180 ± 0.032a<0.001
δRo /(1 - δRo)1.164 ± 0.019a1.140 ± 0.023a1.042 ± 0.011b1.293 ± 0.020c<0.001
Density of reaction centers (RC/ABS)0.725 ± 0.005a0.692 ± 0.004b0.659 ± 0.004c0.704 ± 0.004b<0.001
Water-Stressed
φPo /(1 - φPo)5.388 ± 0.038a5.652 ± 0.036b5.643 ± 0.025b5.624 ± 0.036b<0.001
ψEo /(1 - ψEo)2.020 ± 0.034a2.164 ± 0.033b2.480 ± 0.027c2.124 ± 0.035ab<0.001
δRo /(1 - δRo)1.154 ± 0.016a1.121 ± 0.016a0.964 ± 0.012b1.243 ± 0.021c<0.001
RC/ABS0.695 ± 0.004a0.699 ± 0.004a0.671 ± 0.005b0.718 ± 0.005c<0.001
Table 2. The effect of elevated CO2, O3 and CO2 + O3 on the components of the PItotal in wheat plants under well-watered and water-stressed conditions. Values are means of weeks and SE. Different letters in the same row indicate statistically significant differences between the treatments (p < 0.05).
Well-WateredControlCO2O3CO2 + O3p-level
φPo /(1 - φPo)5.034 ± 0.021a4.987 ± 0.030a4.965 ± 0.22a5.161 ± 0.033b<0.001
ψEo /(1 - ψEo)2.321 ± 0.036a2.406 ± 0.039a2.357 ± 0.033a2.354 ± 0.043aN.S.
δRo /(1 - δRo)0.974 ± 0.010a0.880 ± 0.014b0.918 ± 0.015b0.892 ± 0.016b<0.001
RC/ABS0.555± 0.004a0.533 ± 0.003b0.532 ± 0.003b0.572 ± 0.004c<0.001
Water-Stressed
φPo /(1 - φPo)5.039 ± 0.022a5.013 ± 0.021a4.745 ± 0.028b5.101 ± 0.028a<0.001
ψEo /(1 - ψEo)2.125 ± 0.030a2.236 ± 0.025b2.270 ± 0.031b2.196 ± 0.037ab0.006
δRo /(1 - δRo)0.948 ± 0.011ab0.952 ± 0.009a0.913 ± 0.010b0.956 ± 0.015a0.017
RC/ABS0.520 ± 0.003a0.515 ± 0.002a0.485 ± 0.003b0.539 ± 0.003c<0.001

