Article

Growth and Nutritional Responses of Bean and Soybean Genotypes to Elevated CO2 in a Controlled Environment

by
José Soares
1,
Teresa Deuchande
1,
Luísa M.P. Valente
2,3,
Manuela Pintado
1 and
Marta W. Vasconcelos
1,*
1
CBQF—Centro de Biotecnologia e Química Fina—Laboratório Associado, Escola Superior de Biotecnologia, Universidade Católica Portuguesa, Rua Diogo Botelho 1327, 4169-005 Porto, Portugal
2
CIIMAR – Centro Interdisciplinar de Investigação Marinha e Ambiental, Universidade do Porto, Avenida General Norton de Matos, 4450-208 Matosinhos, Portugal
3
ICBAS, Instituto de Ciências Biomédicas de Abel Salazar, Universidade do Porto, Rua de Jorge Viterbo Ferreira, 228, 4050-313 Porto, Portugal
*
Author to whom correspondence should be addressed.
Plants 2019, 8(11), 465; https://doi.org/10.3390/plants8110465
Submission received: 6 August 2019 / Revised: 10 October 2019 / Accepted: 22 October 2019 / Published: 30 October 2019
(This article belongs to the Special Issue Adapting Crops to Climate Change)

Abstract

:
In the current situation of a constant increase in the atmospheric CO2 concentration, there is a potential risk of decreased nutritional value and food crop quality. Therefore, selecting strong-responsive varieties to elevated CO2 (eCO2) conditions in terms of yield and nutritional quality is an important decision for improving crop productivity under future CO2 conditions. Using bean and soybean varieties of contrasting responses to eCO2 and different origins, we assessed the effects of eCO2 (800 ppm) in a controlled environment on the yield performance and the concentration of protein, fat, and mineral elements in seeds. The range of seed yield responses to eCO2 was −11.0 to 32.7% (average change of 5%) in beans and −23.8 to 39.6% (average change of 7.1%) in soybeans. There was a significant correlation between seed yield enhancement and aboveground biomass, seed number, and pod number per plant. At maturity, eCO2 increased seed protein concentration in beans, while it did not affect soybean. Lipid concentration was not affected by eCO2 in either legume species. Compared with ambient CO2 (aCO2), the concentrations of manganese (Mn), iron (Fe), and potassium (K) decreased significantly, magnesium (Mg) increased, while zinc (Zn), phosphorus (P), and calcium (Ca) were not changed under eCO2 in bean seeds. However, in soybean, Mn and K concentrations decreased significantly, Ca increased, and Zn, Fe, P, and Mg concentrations were not significantly affected by eCO2 conditions. Our results suggest that intraspecific variation in seed yield improvement and reduced sensitivity to mineral losses might be suitable parameters for breeders to begin selecting lines that maximize yield and nutrition under eCO2.

Graphical Abstract

1. Introduction

With the worldwide population predicted to increase to almost 9.5 billion by 2050, a larger portion of the essential nutrients for humans will be provided by plant-based sources [1,2]. The regular consumption of plant proteins, including that of grain legumes, can reduce the risk of diet-related diseases like obesity, diabetes, cardiovascular problems, hypertension, stroke, and cancers that have been increasing in previous decades [3]. Consequently, legumes could be considered an important part of the human diet, as they are a good source of minerals, proteins, vitamins, and bioactive compounds [4]. Among the grain legumes cultivated, dry beans and soybeans are regarded as important crops, and the European Union highlighted the importance of increasing their production to reduce external requirements, and decrease possible negative impacts associated with intensive cereal production [5], thus improving farming sustainability. An overview from 2000 to 2017 reported an increase from 500 Kt to 1.1 Mt, and from 1.9 Mt to 10.7 Mt in dry bean and soybean production in Europe, respectively [6]. However, among European countries, Portugal has a diminutive production of beans equivalent to 1.7 Kt, and in the case of soybean, the production is practically non-existent.
Plant growth is dependent on some resources, including water, mineral nutrients, light, and CO2 [7]. The effects of elevated CO2 (eCO2) on plant responses is an important topic and has been the subject of scientific research. Nevertheless, there is a lack of information about the genotypic variation of eCO2 responses on yield and grain quality parameters, particularly in legume species. The atmospheric CO2 concentration has raised almost 12%, from nearly 370 ppm in 2000 to almost 413 ppm in 2019 [8], surpassing anything that plants had to deal with millions of years ago. In this manner, eCO2 is typically considered as either a positive or a negligible driver of photosynthesis, growth, and yield, mainly on C3 plants [9]. However, differences in the range of yield stimulation are usually detected [10], and a significant intraspecific variation in responses to eCO2 has been found in rice [11,12,13], cowpea [14], wheat [15], common bean [16], and soybean [17,18]. These variations in eCO2 responsiveness suggest that selecting and breeding genotypes that respond positively to eCO2 may ensure sustained productivity and improve food security in an upcoming high CO2 world [19].
Simultaneously, this trend of increasing ambient CO2 (aCO2) levels, which are projected to reach 550 ppm by the middle of this century, is possibly threatening human nutrition, even if further actions are taken to reduce emissions (IPCC, 2014). Consequently, the concentration of various grain mineral elements is influenced to a great extent by eCO2 conditions [20]. Myers et al. [2], in a meta-analysis, evaluated the response of several crops grown at aCO2 and eCO2 in free-air CO2 enrichment (FACE) conditions. Elevated CO2 was associated with significant decreases in the concentration of zinc (Zn) and iron (Fe) in the edible parts of rice, wheat, field peas, and soybeans. In another study, a decrease in the overall mineral concentrations (a change of −8%) was observed in several C3 crops, reflecting foliar and edible tissues, FACE and non-FACE studies [21]. Other studies also reported decreased nutritional value in edible parts of C3 crops due to eCO2 conditions [22,23,24]. Furthermore, eCO2 was associated with lower protein concentration in the edible parts of rice, wheat, barley, potato, field peas [2], and vegetables [25], but not in soybean, combining FACE and growth chamber data [2]. Further characteristics of seed quality are also maintained at eCO2 in legumes, such as grain crude fat on beans, mung bean, and soybean [26,27,28]. So, there is still a need to explore genotypic variability, among legume species, that reveal an improved seed yield and nutritional responsiveness to eCO2 levels.
In the present study, we focused on the intraspecific variation of two legume species on yield responses under eCO2 in a controlled environment, simultaneously assessing aspects associated with the nutritional quality.

2. Results

2.1. Genotypic Variation of Yield Responses to eCO2

A significant increase in seed yield due to eCO2 was observed in beans, with a mean response of 5.0% (p < 0.05), as demonstrated in Figure 1 and Table 1. The rank of seed yield improvement was greatest for Chocolate Brown Bean (CBB, 32.7%), followed by Medra (30.3%), Dandy (28.0%), and Shimi (25.0%) varieties. These were considered strong-responsive varieties under eCO2 conditions (see Section 4.1). Besides, no significant differences were observed among the remaining varieties due to eCO2. Agate had the highest seed yield at both CO2 concentrations. The extent of seed yield improvement due to eCO2 differed significantly among the varieties (p < 0.0001), with a significant CO2 x variety interaction (p < 0.05), as demonstrated in Table 1.
The aboveground biomass (sum of the weights of stems, pod shells, seeds) at maturity was significantly increased by eCO2 (p < 0.05), and there was a significant intraspecific variation associated with eCO2 (p < 0.0001) without a significant CO2 x variety interaction (p > 0.05). The biomass response was strongly correlated with yield increase to eCO2 (r = 0.747, p < 0.01). On the other hand, the harvest index, which was expressed as the ratio of seed yield to aboveground biomass, was not changed by eCO2 (p > 0.05). Further, there was no significant correlation between harvest index and yield enhancement due to eCO2 conditions (Table 1).
The relative increase in height in response to eCO2 was 4.8% (p < 0.05; Table 1), and the magnitude of this increase differed significantly between varieties (p < 0.0001), without a significant CO2 x variety interaction (p > 0.05). Further, we observed a strong correlation between yield response to eCO2 and relative increase in height (r = 0.593, p < 0.01).
Of the yield components, exposure to eCO2 resulted in a significant stimulation on the number of seeds per pod (mean CO2 effect of 7.5%, p < 0.01; Table 1), and the magnitude of this increase differed significantly among the varieties (p < 0.0001), without a CO2 x variety interaction (p > 0.05). Moreover, a correlation between increased seed yield and an increased number of seeds per pod was not observed (p > 0.05).
Elevated CO2 resulted in seed mass reduction by −13.1% (p < 0.0001), but there was no significant correlation between seed mass reduction and yield improvement (p > 0.05). No significant differences were observed in the number of pods (mean CO2 effect of 2.9%, p > 0.05) and in the number of seeds per plant (mean CO2 effect of 3.8%, p > 0.05) due to eCO2. However, a significant intraspecific variability was observed (p < 0.0001) with a significant CO2 x variety interaction (p < 0.05) for both yield components. There was a strong positive correlation between the number of pods (r = 0.736, p < 0.01) and the number of seeds per plant (r = 0.838, p < 0.01) with seed yield enhancement (Table 1).
Concerning soybean, CO2 enrichment significantly stimulated seed yield by an average of 7.1% (p < 0.05; Figure 2 and Table 2). This magnitude of seed yield enhancement differed significantly among the varieties (p < 0.0001), and there was a significant CO2 x variety interaction (p < 0.01). The largest seed yield increase at eCO2 was observed in Wisconsin Black (WB, 39.6%), Shironomai (28.5%), and Early Mandarin (24.5%), which were considered strong-responsive varieties, followed by Amurskaja (18.4%). No significant differences in seed yield were observed among the remaining cultivars, except for L.117 (p < 0.05), which showed a significant decrease in seed yield under eCO2. At aCO2, WB with Tubinger had the highest seed yield, which was consistent at eCO2, whereas WB significantly surpassed all other varieties (Figure 2).
The aboveground biomass was significantly increased by 6.9% due to eCO2 (p < 0.05, Table 2), and there was a significant difference among the varieties (p < 0.0001), without a CO2 x variety interaction (p > 0.05). This increase in biomass was significantly correlated with seed yield enhancement at eCO2. (r = 0.625, p < 0.01). The harvest index was not affected by eCO2 (p > 0.05), with a significant intraspecific variation (p < 0.0001). Further, there was no significant correlation between harvest index and yield enhancement due to eCO2 conditions (Table 2).
On the other hand, a significant increase in height due to eCO2 was observed, with an average response of about 4%. The magnitude of this enhancement due to eCO2 differed significantly among the varieties (p < 0.0001), with a significant CO2 x variety interaction (p < 0.0001, Table 2).
Of the yield components, eCO2 had significant effects on pod number per plant (mean CO2 effect of 7.2%, p < 0.01), seed number per plant (mean CO2 effect of 5.5%, p < 0.05), seed number per pod (mean CO2 effect of 5.9%, p < 0.05), and 100-seed weight (mean CO2 effect of −12.3%, p < 0.0001). The extent of all reproductive parameters differed significantly among the varieties (p < 0.05), with a significant CO2 x variety interaction (p < 0.05), except on the number of pods per plant (p > 0.05, Table 2). Moreover, there was a strong and positive correlation between seed yield improvement and pod number per plant (r = 0.784, p < 0.01), seed number per plant (r = 0.600, p < 0.05), and seed number per pod (r = 0.665, p < 0.01), as described in Table 2.

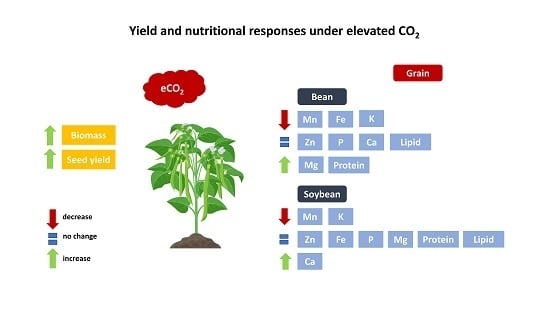
2.2. Variation of Grain Nutritional Composition Due to eCO2

Elevated CO2 did not influence Zn, P, or Ca concentrations in bean seeds at maturity (p > 0.05, Figure 3). However, the concentrations of the other minerals (viz. Mn, Fe, Mg, and K) responded differently to eCO2. Under eCO2, the Mn concentration was significantly decreased by 25.2% (p < 0.0001). The decrease was significant in 9 out of 18 varieties, whereas it increased in Garnet (p < 0.05), and in Kazak, Dama, PP63, G1378, Rosomanska, Yamal, Dandy, and CBB, no changes were observed at eCO2 (Figure 4).
The Fe concentration was decreased by 39.1%, 37.6%, 29.0%, 25.4%, 23.7%, and 22.9% (p < 0.001) in PP63, Dandy, Kazak, North Holland Bruine (NHB), Agate, and Zlaty Knot, respectively (Figure 4).
Grain Mg concentration increased under eCO2 for G1274, NHB, Dama, Trend, G1378, PV1-4, Rosomanska, Logan, Yamal, Dandy, and Medra and remained unchanged in the rest of the varieties (Figure 5). Significant changes in K concentration were observed in G1274, Kazak Logan, and Medra (Figure 5), which showed a decrease in grain K concentration (mean CO2 effect of −6.0%, p < 0.05, Figure 3), while no changes were demonstrated in the remaining varieties. The extent of change in all grain mineral concentrations in response to eCO2 varied between varieties (Table 3, p < 0.01), implying a significant CO2 x cultivar interaction (p < 0.01).
Exposure to eCO2 significantly increased protein concentration when compared to aCO2 (mean CO2 effect of 6.0%, p < 0.0001, Figure 3). The increase was significant in 12 out of 18 varieties, while decreased in Kazak (p < 0.05), and in Agate, CBB, Dandy, PP63, and Shimi, the concentration remained unchanged (Figure 6). A significant effect of CO2 × variety interaction on protein concentration was observed (p < 0.0001, Table 3). Elevated CO2 had no influence on fat concentration in all bean varieties at maturity when compared to aCO2 (Figure 3).
In soybean, eCO2 did not influence Zn, Fe, P, or Mg concentrations in seeds (p > 0.05, Figure 7). On the other hand, eCO2 significantly decreased grain Mn concentration by 23.2% (p < 0.0001). The concentration of this element decreased in Tubinger, Primorskaja, Bai Mao Shuang, DV-0197, Tono, Cschi675, Man-tsan-tszinxPhin-di-Huan (MTTPDH), Dunayka, and Novosadska, and no significant differences were observed in the remaining varieties (Figure 8).
Elevated CO2 significantly increased grain Ca concentration by 36.3%, 34.9%, 25.3%, and 24.3% in ISZ-II, Amurskaja, Ussuriscaja, Tubinger, respectively, decreased by 21.5% in Primorskaja, and was not affected in the remaining varieties (Figure 9). Furthermore, eCO2 decreased K concentration by 3.5% (p < 0.001) when compared to aCO2. The response of grain mineral concentrations to eCO2 varied between varieties (Table 4, p < 0.01), implying a significant CO2 x cultivar interaction (p < 0.01), except for P concentration. Also, eCO2 had no influence on the grain protein and lipid concentrations (p > 0.05, Figure 7) in soybean. However, the extent of change in grain protein and lipid concentrations in response to eCO2 varied between varieties (p < 0.001, Figure 10 and Table 4).

3. Discussion

Strong-responsive genotypes to eCO2 may be crucial and might support significant yield increases in a future eCO2 environment. The increased performance must encompass not only productivity at the whole-plant level, but must also nutritional resilience to future climate conditions.
The current study demonstrated that under eCO2, seed yield differed substantially among the varieties tested (p < 0.0001), ranging from −11.0 to 32.7% in bean, and from −23.8 to 39.6% in soybean (Figure 1 and Figure 2), suggesting a considerable genetic background for genomic improvement. It was also previously demonstrated that yield responses to increasing CO2 varied greatly, among varieties and between species, ranging from −10 to 80% for soybean [18,19,29,30] and from −11 to 39% for common bean [16,31]. Nevertheless, eCO2 increased the seed yield but failed to improve the harvest index; however, decreases in harvest index due to CO2 enrichment can occur in soybean [32]. Similar results have been reported in lupin [33], where exposure to eCO2 did not decrease the harvest index, because the effect of CO2 was mainly an increase in biomass and, consequently, an increase in the number of pods that reached maturity and the number of pods with filled seeds. Herein, the seed yield increase was 5.0% (bean) and 7.1% (soybean), which is relatively lower than other reports [16,18,19,29]. This failure of seed yield increase is possibly associated with the physical restriction to root growth, since the volume of the containers for root growth was <2 L. It is widely accepted that the pot size significantly affects seed yield responses to eCO2, since plants grown in larger pots (>9 L) have greater stimulation compared to those grown in small pots [32]. Also, the CO2-induced reduction in seed mass, which may be a consequence of the restriction of nutrient production, mobilization, and translocation to the seeds during seed filling, is probably associated with the physical restriction of root growth.
However, the driving force in the yield-enhancing strategy was linked to the response of biomass to eCO2 and, subsequently, to the number of pods and seeds production, and these were probably useful indicators of the intraspecific variation (Table 1 and Table 2). This is in agreement with Kumagai et al. [19], who reported the growth of soybean in a greenhouse at eCO2. The authors showed that cultivars with the strongest responsiveness of biomass to eCO2 produced more pods and greater seed yield. Bunce [16] also demonstrated seed yield improvement under eCO2, among common bean varieties, and a high correlation with stimulation of pod and seed numbers. Therefore, it was proposed that a genotype with higher sink formation due to eCO2 would be a promising candidate for higher yield responses to eCO2 [17].
However, it is important to understand whether the characteristics that lead to higher responsiveness to eCO2 are also manifested under aCO2 for the development of effective plant breeding strategies [16]. In the current study, the highest yielding variety at aCO2 was the highest yielding variety at eCO2 in both species. Therefore, Agate (bean) and WB (soybean) have a higher yield at both concentrations. This suggests that varieties best adapted to current CO2 levels may also have the characteristics best adapted to future CO2 concentrations, providing good genetic support for future studies.
The impact of eCO2 on the grain nutritional quality has also been studied, since CO2 enrichment can lead to a decrease in plant nutritional status, and pose a potential challenge to human health [20]. Elevated CO2 significantly reduced the grain nutritional value in terms of Mn, Fe, and K in bean, and Mn and K in soybean (Figure 3 and Figure 7). Similar results for Mn and K have been reported by Loladze [21] in a wide range of C3 crops, reflecting foliar and edible tissues, FACE and non-FACE studies, and by Myers et al. [2] in field peas. The reduction in grain Fe content due to eCO2 has also been reported in rice, wheat, barley, peas, and soybeans [2,20].
Furthermore, exposure to eCO2 increased Mg and Ca concentrations in bean and soybean, respectively. Similar results were obtained by Li et al. [20] in soybean seeds at the fresh edible and mature stages. On the other hand, grain Zn and P concentrations were not influenced by eCO2 in either species. Dong et al. [25] in vegetables and Li et al. [20] in soybean also found that P concentration was not affected by eCO2.
The mechanisms responsible for reducing the concentration of nutrients associated with eCO2 have not yet been fully clarified. Many studies attribute this to the carbohydrate dilution effect, where increasing plant biomass under eCO2 conditions dilutes the rest of the grain components [20,34,35,36]. Our findings were contradictory, with carbohydrate dilution functioning alone since we found that mineral changes within the same species are distinct from each other, suggesting that the mechanism is more complex than carbohydrate dilution alone. For example, in bean (Figure 3), the decrease in Mn concentration was significantly different from the decrease in Fe concentration or K concentration, and the increase in Mg concentration. It also seems that the mechanisms causing these changes function distinctly in different species. Consequently, we found Mg concentration to be significantly increased in bean (p < 0.0001), whereas it was not changed in soybean grains (p > 0.05, Figure 7). Therefore, eCO2 has both positive and negative effects on the nutritional quality of legume seeds. Inhibition of photorespiration and malate production [37], carbohydrate dilution, and decreased mass flow due to reduced transpiration may all be relevant to explain this phenomenon of decreased grain nutritional value under eCO2 conditions [38,39].
We also examined the effects of eCO2 on mineral concentrations as a function of variety. Both crops showed significant differences across varieties among all minerals studied (Table 3 and Table 4). Such changes among varieties suggest a basis for breeding varieties whose reduced nutrient levels are less responsive to eCO2.
Legumes are a major source of proteins and oil, particularly soybean, containing essential free amino acids and fatty acids [20]. Concerning grain protein concentration, it was demonstrated that eCO2 increased grain protein in bean (p < 0.0001) and had no influence in soybean seeds (p > 0.05, Figure 3 and Figure 4), with significant differences among varieties (Table 3 and Table 4). These findings that protein concentration was less affected are also associated with the competence of leguminous crops to counteract the stimulation of photosynthetic C gain at eCO2, with better nitrogen fixation for preserving tissue C:N ratios [40]. Our results are in agreement with those of Jablonski et al. [41], who, in a meta-analysis of several crops and wild species, found that seed protein was not affected by high CO2 concentrations in legumes, but declined significantly in most non-legumes. Similarly, Taub and Wang [42] indicated that eCO2 did not affect soybean seed protein concentration. Myers et al. [2] also found that eCO2 was associated with lower protein concentration in wheat and rice grains, and a non-significant effect of eCO2 was demonstrated in soybeans or C4 crops grown under FACE conditions.
Few studies dealing with the effects of eCO2 on plant lipid metabolism have been carried out. In this study, it was demonstrated that eCO2 had no effect on lipid concentration in bean and soybean grains (p > 0.05, Figure 3 and Figure 7). Similar results were reported in Arabidopsis thaliana [43], wheat [22], and soybean grains [20] at the fresh edible stages and grown at eCO2.
It was previously demonstrated that eCO2 decreased the concentrations of Fe and Zn in grains of most C3 plants [20,22,25,44], and usually, C3 crops other than legumes also have lower concentrations of protein [2]. These dietary deficiencies are considered a global public health problem, as it is estimated that two billion people worldwide are affected by these nutritional deficiencies [2]. Therefore, strong-responsive cultivars (i.e., CBB, Medra, and Shimi in bean, and EM in soybean) in terms of seed yield enhancement and that maintain or even increase Fe, Zn, and grain protein concentrations at eCO2 might be considered as promising varieties for future studies.

4. Materials and Methods

4.1. Plant Material

In this study, we used bean (Phaseolus vulgaris L.) and soybean (Glycine max L.) varieties, that were obtained either from CIAT (Cali, Colombia) or from USDA-ARS via Germplasm Resources Information Network (Washington, USA). Varieties of both species were chosen based on a preliminary experiment (aCO2, 400 ppm and eCO2, 600 ppm) conducted under FACE conditions at Campus Klein (Altendorf, Germany) to find out the performance under eCO2. The seed yield response (strong-responsive with >25% vs. weak-responsive with <25% of yield increase) at eCO2 was based on average seed yield responses under eCO2 and reported by [16,18,19,29,30,45,46]. In the selected varieties, the growth and yield performance at eCO2 were assessed in a controlled environment (Table 5).

4.2. Growth Conditions

The experiment was conducted from January to May in 2017, at the Grow to Green facility (Castelo Branco, Portugal). Seeds were sown on phenolic foam plugs, and seven days after sowing (DAS), seedlings were transplanted to the growth chamber. Plants were grown in a thin nutrient film solution in polyvinyl chloride-coated gullies and placed with 0.20 m in between. Irrigation was performed through 10 min ON/15 min OFF during light period; and 10 min ON/30 min OFF during night period. Plants grew with a photoperiod of 16/8 h (day/night) at an average light intensity expressed as photosynthetic photon flux density of 350 μmol m−2 s−1 at canopy level. Light conditions were provided by LED lamps with peak emissions of 650, 540, and 460 nm for Red/White/Blue (80:6:14) light, with ratio representing the contribution of red, white, and blue light to total intensity. The temperature was kept at 25/20 °C (day/night) and relative humidity at 75%. Electric conductivity and pH in the nutrient solution were registered by sensors and automatically readjusted to 0.60 mS m−1 and 5.5, respectively. The composition of the nutrient solution for hydroponic growth included: 1.2 mM KNO3, 0.8 mM Ca(NO3)2, 0.3 mM MgSO4.7H2O, 0.2 mM NH4H2PO4, 25 µM CaCl2, 25 µM H3BO3, 0.5 µM MnSO4, 2 µM ZnSO4.H2O, 0.5 µM CuSO4.H2O, 0.5 µM MoO3, 0.1 µM NiSO4, and 20 µM FeEDDHA. The experiment was conducted at eCO2 (800 ppm) and aCO2 (400 ppm) concentrations until maturity in two independent growth chambers. There were two replicates, with five plants per replicate, in each treatment arranged in a randomized block design.

4.3. Growth and Yield Measurements

For all genotypes, SPAD values were determined at 54 DAS at the pod formation stage. Following senescence of the foliage and discoloration of the pods between 9–10 weeks, irrigation was discontinued, and plants allowed to dry in situ. Pods were hand harvested at maturity between 79–99 DAS depending on the variety. At maturity, aboveground dry weight (sum of the weights of stems, pods shells, and seeds), plant’s height, number of pods per plant, number of seeds per plant, and the average weight of 100 seeds were performed for all varieties in both treatments. Seed yield per plant was obtained from ten plants (n = 2 replicates) and adjusted to a 15% moisture content.

4.4. Nutritional Analysis

Seeds from independent plants (n = 4 replicates) were collected and analyzed for minerals, protein N, and total lipid concentration. Mineral analysis determination was performed as described by Santos et al. [47]. The minerals analyzed were Zn, Fe, manganese (Mn), phosphorous (P), magnesium (Mg), calcium (Ca), and potassium (K). Briefly, 200 mg of the seed material was mixed with 5 mL of 65% HNO3 (v/v) and 1 mL of H2O2 30% (v/v) in a Teflon reaction vessel and heated in a SpeedwaveTM MWS-3+ (Berghof, Germany) microwave system. Digestion procedure was conducted in five steps, consisting of different temperature and time sets: 130 °C/10 min, 160 °C/15 min, 170 °C/12 min, 100 °C/7 min, and 100 °C/3 min. The resulting clear solutions of the digestion procedure were then brought to 50 mL with ultrapure water for further analysis. Mineral concentration determination was performed using the ICP-OES Optima 7000 DV (PerkinElmer, USA) with radial configuration.
Seeds were analyzed for crude protein concentration (N x 5.28 and N x 5.5 in bean and soybean, respectively) using a Leco nitrogen analyzer (Model FP-528, Leco Corporation, St. Joseph, USA), and crude fat concentration was measured by petroleum ether extraction (40–60 °C) using a Soxhlet fat extraction system (Gerhardt, Germany). All chemical analyses followed AOAC [48] methods.

4.5. Statistical Analysis

To test for significant differences between CO2 treatments and among varieties, and for significant interactions, plant data were analyzed as a completely randomized design using a two-way ANOVA. The correlations among seed yield and agronomic traits were performed using Pearson’s product-moment correlation (r). All statistical analyses were performed with version 25.0 of the SPSS statistics software.

5. Conclusions

In summary, our results indicate that consistent and significant variation in the response of seed yield to eCO2 under controlled conditions does exist among legume species, and that the response of pod and seed numbers are suitable for predicting their responsiveness to future eCO2. Moreover, Mn and K concentrations were significantly decreased by eCO2 in both species. The protein concentration in bean seeds was significantly increased. Lipid concentrations were not influenced by eCO2 in the present study Thus, it is important to develop specially designed programs to increase seed yield while avoiding or reducing some of the important nutritional losses that may arise under eCO2 conditions.

Author Contributions

Conceptualization, J.S. and M.V.; methodology, J.S.; validation, L.M.P.V., M.P., and M.V.; investigation, J.S. and T.D.; data curation, J.S.; writing—original draft preparation, J.S.; writing—review and editing L.M.P.V., M.P., and M.V.; visualization, J.S., T.D., L.M.P.V., M.P., and M.V.; supervision, M.P. and M.W.V.

Funding

This research was funded by Fundação para a Ciência e Tecnologia (FCT), Portugal, grant number PTDC/AGR-PRO/3972/2014.

Acknowledgments

The authors gratefully acknowledge the International PhD Programme in Biotechnology, Portugal for providing Ph.D. scholarship (No. NORTE-08-5369-FSE-000007) to José Carvalho Soares. We would also like to thank the scientific collaboration of CBQF under the FCT project UID/Multi/50016/2013.

Conflicts of Interest

The authors declare no conflicts of interest.

References

  1. Preece, K.E.; Hooshyar, N.; Zuidam, N.J. Whole soybean protein extraction processes: A review. Innov. Food Sci. Emerg. 2017, 43, 163–172. [Google Scholar] [CrossRef] [Green Version]
  2. Myers, S.S.; Zanobetti, A.; Kloog, I.; Huybers, P.; Leakey, A.D.B.; Bloom, A.J.; Carlisle, E.; Dietterich, L.H.; Fitzgerald, G.; Hasegawa, T.; et al. Increasing CO2 threatens human nutrition. Nature 2014, 510, 139–142. [Google Scholar] [CrossRef] [PubMed]
  3. Ebert, A.W.; Chang, C.-H.; Yan, M.-R.; Yang, R.-Y. Nutritional composition of mungbean and soybean sprouts compared to their adult growth stage. Food Chem. 2017, 237, 15–22. [Google Scholar] [CrossRef] [PubMed]
  4. Singh, B.; Singh, J.P.; Kaur, A.; Singh, N. Phenolic composition and antioxidant potential of grain legume seeds: A review. Food Res. Int. 2017, 101, 1–16. [Google Scholar] [CrossRef]
  5. Cernay, C.; Ben-Ari, T.; Pelzer, E.; Meynard, J.-M.; Makowski, D. Estimating variability in grain legume yields across Europe and the Americas. Sci. Rep. 2015, 5, 11171. [Google Scholar] [CrossRef]
  6. FAOSTAT. Food and Agriculture Organization of the United Nations. Available online: http://www.fao.org/faostat/en/#data/QC (accessed on 1 August 2019).
  7. Ma, Z.; Flynn, J.; Libra, G.; Shi, Z. Elevated CO2 Accelerates Depletion of Phosphorus by Common Bean (Phaseolus vulgaris) in association with Altered Leaf Biochemical Properties. Pedosphere 2017, 28, 422–429. [Google Scholar] [CrossRef]
  8. Earth System Research Laboratory, G.M.S. Available online: https://www.esrl.noaa.gov/gmd/ccgg/trends/ (accessed on 30 July 2019).
  9. Resco de Dios, V.; Mereed, T.E.; Ferrio, J.P.; Tissue, D.T.; Voltas, J. Intraspecific variation in juvenile tree growth under elevated CO2 alone and with O3: A meta-analysis. Tree Physiol. 2016, 36, 682–693. [Google Scholar] [CrossRef]
  10. Kimball, B.; Kobayashi, K.; Bindi, M. Responses of agricultural crops to free-air CO2 enrichment. In ADV AGRON; Elsevier: Amsterdam, The Netherlands, 2002; Volume 77, pp. 293–368. [Google Scholar]
  11. Moya, T.B.; Ziska, L.H.; Namuco, O.S.; Olsyk, D. Growth dynamics and genotypic variation in tropical, field-grown paddy rice (Oryza sativa L.) in response to increasing carbon dioxide and temperature. Glob. Chang. Biol. 1998, 4, 645–656. [Google Scholar] [CrossRef]
  12. Baker, J.T. Yield responses of southern US rice cultivars to CO2 and temperature. Agric. For. Meteorol. 2004, 122, 129–137. [Google Scholar] [CrossRef]
  13. Ziska, L.H.; Manalo, P.A.; Ordonez, R.A. Intraspecific variation in the response of rice (Oryza sativa L.) to increased CO2 and temperature: Growth and yield response of 17 cultivars1. J. Exp. Bot. 1996, 47, 1353–1359. [Google Scholar] [CrossRef]
  14. Ahmed, F.E.; Hall, A.E.; Madore, M.A. Interactive effects of high temperature and elevated carbon dioxide concentration on cowpea [Vigna unguiculata (L.) Walp.]. Plant Cell Environ. 1993, 16, 835–842. [Google Scholar] [CrossRef]
  15. Ziska, L.H.; Morris, C.F.; Goins, E.W. Quantitative and qualitative evaluation of selected wheat varieties released since 1903 to increasing atmospheric carbon dioxide: Can yield sensitivity to carbon dioxide be a factor in wheat performance? Glob. Chang. Biol. 2004, 10, 1810–1819. [Google Scholar] [CrossRef]
  16. Bunce, J.A. Contrasting responses of seed yield to elevated carbon dioxide under field conditions within Phaseolus vulgaris. Agric. Ecosyst. Environ. 2008, 128, 219–224. [Google Scholar] [CrossRef]
  17. Ziska, L.H.; Bunce, J.A. Sensitivity of field-grown soybean to future atmospheric CO2: Selection for improved productivity in the 21st century. Funct. Plant Biol. 2000, 27, 979–984. [Google Scholar] [CrossRef]
  18. Ziska, L.H.; Bunce, J.A.; Caulfield, F.A. Rising Atmospheric Carbon Dioxide and Seed Yield of Soybean Genotypes. Crop Sci. 2001, 41, 385–391. [Google Scholar] [CrossRef]
  19. Kumagai, E.; Aoki, N.; Masuya, Y.; Shimono, H. Phenotypic Plasticity Conditions the Response of Soybean Seed Yield to Elevated Atmospheric CO2 Concentration. Plant Physiol. 2015, 169, 2021–2029. [Google Scholar] [CrossRef]
  20. Li, Y.; Yu, Z.; Jin, J.; Zhang, Q.; Wang, G.; Liu, C.; Wu, J.; Wang, C.; Liu, X. Impact of Elevated CO2 on Seed Quality of Soybean at the Fresh Edible and Mature Stages. Front. Plant Sci. 2018, 9. [Google Scholar] [CrossRef]
  21. Loladze, I. Hidden shift of the ionome of plants exposed to elevated CO₂ depletes minerals at the base of human nutrition. eLife 2014, 3, e02245. [Google Scholar] [CrossRef]
  22. Högy, P.; Fangmeier, A. Effects of elevated atmospheric CO2 on grain quality of wheat. J. Cereal Sci. 2008, 48, 580–591. [Google Scholar] [CrossRef]
  23. Singh, S.K.; Barnaby, J.Y.; Reddy, V.R.; Sicher, R.C. Varying Response of the Concentration and Yield of Soybean Seed Mineral Elements, Carbohydrates, Organic Acids, Amino Acids, Protein, and Oil to Phosphorus Starvation and CO2 Enrichment. Front. Plant Sci. 2016, 7, 1967. [Google Scholar] [CrossRef]
  24. Dong, J.-L.; Li, X.; Nazim, G.; Duan, Z.-Q. Interactive effects of elevated carbon dioxide and nitrogen availability on fruit quality of cucumber (Cucumis sativus L.). J. Integr. Agric. 2018, 17, 2438–2446. [Google Scholar] [CrossRef]
  25. Dong, J.; Gruda, N.; Lam, S.K.; Li, X.; Duan, Z. Effects of Elevated CO2 on Nutritional Quality of Vegetables: A Review. Front. Plant Sci. 2018, 9, 924. [Google Scholar] [CrossRef] [PubMed]
  26. Ziska, L.H.; Palowsky, R.; Reed, D.R. A quantitative and qualitative assessment of mung bean (Vigna mungo (L.) Wilczek) seed in response to elevated atmospheric carbon dioxide: Potential changes in fatty acid composition. J. Sci. Food Agric. 2007, 87, 920–923. [Google Scholar] [CrossRef]
  27. Thomas, J.; Prasad, P.; Boote, K.; Allen, L., Jr. Seed composition, seedling emergence and early seedling vigour of red kidney bean seed produced at elevated temperature and carbon dioxide. J. Agron. Crop Sci. 2009, 195, 148–156. [Google Scholar] [CrossRef]
  28. Palacios, C.J.; Grandis, A.; Carvalho, V.J.; Salatino, A.; Buckeridge, M.S. Isolated and combined effects of elevated CO2 and high temperature on the whole-plant biomass and the chemical composition of soybean seeds. Food Chem. 2019, 275, 610–617. [Google Scholar] [CrossRef]
  29. Bunce, J.A. Elevated Carbon Dioxide Effects on Reproductive Phenology and Seed Yield among Soybean Cultivars. Crop Sci. 2015, 55, 339–343. [Google Scholar] [CrossRef]
  30. Bishop, K.A.; Betzelberger, A.M.; Long, S.P.; Ainsworth, E.A. Is there potential to adapt soybean (Glycine max Merr.) to future [CO2]? An analysis of the yield response of 18 genotypes in free-air CO2) enrichment. Plant Cell Environ. 2015, 38, 1765–1774. [Google Scholar] [CrossRef]
  31. Prasad, P.V.; Boote, K.J.; Allen, L.H., Jr.; Thomas, J.M. Effects of elevated temperature and carbon dioxide on seed-set and yield of kidney bean (Phaseolus vulgaris L.). Glob. Chang. Biol. 2002, 8, 710–721. [Google Scholar] [CrossRef]
  32. Ainsworth, E.A.; Davey, P.A.; Bernacchi, C.J.; Dermody, O.C.; Heaton, E.A.; Moore, D.J.; Morgan, P.B.; Naidu, S.L.; Ra, H.S.Y.; Zhu, X.G. A meta-analysis of elevated [CO2] effects on soybean (Glycine max) physiology, growth and yield. Glob. Chang. Biol. 2002, 8, 695–709. [Google Scholar] [CrossRef]
  33. Palta, J.; Ludwig, C. Elevated CO2 during pod filling increased seed yield but not harvest index in indeterminate narrow-leafed lupin. Aust. J. Agric. Res. 2000, 51, 279–286. [Google Scholar] [CrossRef]
  34. Wu, D.-X.; Wang, G.-X.; Bai, Y.-F.; Liao, J.-X. Effects of elevated CO2 concentration on growth, water use, yield and grain quality of wheat under two soil water levels. Agric. Ecosyst. Environ. 2004, 104, 493–507. [Google Scholar] [CrossRef]
  35. Pang, J.; Zhu, J.-G.; Xie, Z.-B.; Liu, G.; Zhang, Y.-L.; Chen, G.-P.; Zeng, Q.; Cheng, L. A new explanation of the N concentration decrease in tissues of rice (Oryza sativa L.) exposed to elevated atmospheric CO2. Environ. Exp. Bot. 2006, 57, 98–105. [Google Scholar] [CrossRef]
  36. Parvin, S.; Uddin, S.; Tausz-Posch, S.; Armstrong, R.; Fitzgerald, G.; Tausz, M. Grain mineral quality of dryland legumes as affected by elevated CO2 and drought: A FACE study on lentil (Lens culinaris) and faba bean (Vicia faba). Crop Pasture Sci. 2019, 70, 244–253. [Google Scholar] [CrossRef]
  37. Bloom, A.J. Photorespiration and nitrate assimilation: A major intersection between plant carbon and nitrogen. Photosynth. Res. 2015, 123, 117–128. [Google Scholar] [CrossRef]
  38. Pleijel, H.; Gelang, J.; Sild, E.; Danielsson, H.; Younis, S.; Karlsson, P.-E.; Wallin, G.; Skärby, L.; Selldén, G. Effects of elevated carbon dioxide, ozone and water availability on spring wheat growth and yield. Physiol. Plant. 2000, 108, 61–70. [Google Scholar] [CrossRef]
  39. Gifford, R.M.; Barrett, D.J.; Lutze, J.L. The effects of elevated [CO2] on the C:N and C:P mass ratios of plant tissues. Plant Soil 2000, 224, 1–14. [Google Scholar] [CrossRef]
  40. Qiao, Y.; Miao, S.; Li, Q.; Jin, J.; Luo, X.; Tang, C. Elevated CO2 and temperature increase grain oil concentration but their impacts on grain yield differ between soybean and maize grown in a temperate region. Sci. Total Environ. 2019, 666, 405–413. [Google Scholar] [CrossRef]
  41. Jablonski, L.M.; Wang, X.; Curtis, P.S. Plant reproduction under elevated CO2 conditions: A meta-analysis of reports on 79 crop and wild species. New Phytol. 2002, 156, 9–26. [Google Scholar] [CrossRef]
  42. Taub, D.R.; Wang, X. Why are Nitrogen Concentrations in Plant Tissues Lower under Elevated CO2? A Critical Examination of the Hypotheses. J. Integr. Plant Biol. 2008, 50, 1365–1374. [Google Scholar] [CrossRef]
  43. Ekman, A.; Bulow, L.; Stymne, S. Elevated atmospheric CO2 concentration and diurnal cycle induce changes in lipid composition in Arabidopsis thaliana. New Phytol. 2007, 174, 591–599. [Google Scholar] [CrossRef]
  44. Fernando, N.; Panozzo, J.; Tausz, M.; Norton, R.M.; Fitzgerald, G.J.; Myers, S.; Nicolas, M.E.; Seneweera, S. Intra-specific variation of wheat grain quality in response to elevated [CO2] at two sowing times under rain-fed and irrigation treatments. J. Cereal Sci. 2014, 59, 137–144. [Google Scholar] [CrossRef]
  45. Ziska, L.H.; Bunce, J.A. Predicting the impact of changing CO2 on crop yields: Some thoughts on food. New Phytol. 2007, 175, 607–618. [Google Scholar] [CrossRef] [PubMed]
  46. Ainsworth, E.A.; Long, S.P. What have we learned from 15 years of free-air CO2 enrichment (FACE)? A meta-analytic review of the responses of photosynthesis, canopy properties and plant production to rising CO2. New Phytol. 2005, 165, 351–372. [Google Scholar] [CrossRef] [PubMed]
  47. Santos, C.S.; Roriz, M.; Carvalho, S.M.P.; Vasconcelos, M.W. Iron partitioning at an early growth stage impacts iron deficiency responses in soybean plants (Glycine max L.). Front. Plant Sci. 2015, 6. [Google Scholar] [CrossRef] [PubMed]
  48. AOAC. Official Methods of Analysis of AOAC International; AOAC: Rockville, MD, USA, 2006. [Google Scholar]
Figure 1. Seed yield of bean grown under ambient CO2 (aCO2) (400 ppm) and elevated CO2 (eCO2) (800 ppm). Data are means ± SE (n = 10 plants). From left to right, varieties are classified in order of increasing seed yield responsiveness to eCO2. ** p < 0.01; * p < 0.05 significance level.
Plants 08 00465 g001
Figure 2. Seed yield of soybean grown under aCO2 (400 ppm) and eCO2 (800 ppm). Data are means ± SE (n = 10 plants). From left to right, varieties are classified in order of increasing seed yield responsiveness to eCO2. **** p < 0.0001; * p < 0.05 significance level.
Plants 08 00465 g002
Figure 3. Mean response change (%) of the seed mineral, protein, and lipid concentrations of 18 bean varieties grown under aCO2 (400 ppm) and eCO2 (800 ppm). **** p < 0.0001 significance level.
Plants 08 00465 g003
Figure 4. Grain micronutrient (ac) concentrations of bean grown under aCO2 (400 ppm) and eCO2 (800 ppm). Each bar represents the mean ± SE (n = 10 plants). * p < 0.05; ** p < 0.01; *** p < 0.001; **** p < 0.0001 significance level.
Plants 08 00465 g004
Figure 5. Grain macronutrient (ad) concentrations of bean grown under aCO2 (400 ppm) and eCO2 (800 ppm). Each bar represents the mean ± SE (n = 10 plants). * p < 0.05; ** p < 0.01; *** p < 0.001; **** p < 0.0001 significance level.
Plants 08 00465 g005
Figure 6. Influence of eCO2 on bean seed protein and lipid concentrations. Each bar represents the mean ± SE (n = 10 plants). * p < 0.05; ** p < 0.01; *** p < 0.001; **** p < 0.0001 significance level.
Plants 08 00465 g006
Figure 7. Mean response change (%) of the seed mineral, protein, and lipid concentrations of 17 soybean varieties grown under aCO2 (400 ppm) and eCO2 (800 ppm). ** p < 0.01; *** p < 0.001; **** p < 0.0001 significance level.
Plants 08 00465 g007
Figure 8. Grain micronutrient (ac) concentrations of soybean grown under aCO2 (400 ppm) and eCO2 (800 ppm). Each bar represents the mean ± SE (n = 10 plants). * p < 0.05; ** p < 0.01; *** p < 0.001; **** p < 0.0001 significance level.
Plants 08 00465 g008
Figure 9. Grain macronutrient (ad) concentrations of soybean grown under aCO2 (400 ppm) and eCO2 (800 ppm). Each bar represents the mean ± SE (n = 10 plants). * p < 0.05; *** p < 0.001 significance level.
Plants 08 00465 g009
Figure 10. Influence of eCO2 on soybean seed protein and lipid concentrations. (a) soybean seed protein and (b) lipid concentrations. Each bar represents the mean ± SE (n = 10 plants). * p < 0.05; ** p < 0.01 significance level; *** p < 0.001; **** p < 0.0001 significance level.
Plants 08 00465 g010
Table 1. Growth and reproductive characteristics at maturity of 18 bean varieties grown at ambient (400 ppm) and elevated (800 ppm) CO2, and correlations (Pearson’s r) and their statistical significance for the relationship between the relative increase in bean seed yield due to eCO2 (value at eCO2/value at aCO2) and values of other parameters measured under the same conditions. * p < 0.05; ** p < 0.01; *** p < 0.001; **** p < 0.0001. C x V, CO2 x variety interaction; ns, not significant.
ParameterMean CO2 EffectCO2VarietyC x VCorrelation
Aboveground dry weight, g plt−15.8%*****ns0.747*
Height, cm plt−14.8%*****ns0.593**
Seed yield, g plant−15.0%******
Harvest index, g g−1−0.2%ns**ns0.096ns
No. of pods, plt−12.9%ns*****0.736*
No. of seeds, plt−13.8%ns*******0.838**
No. of seeds, pod−17.5%******ns0.314ns
100-seed weight, g−13.1%*********−0.108ns
Table 2. Growth and reproductive characteristics at maturity of 17 soybean varieties grown at either ambient (400 ppm) and elevated (800 ppm) CO2, and correlations (Pearson’s r) and their statistical significance for the relationship between the relative increase in bean seed yield due to eCO2 (value at eCO2/value at aCO2) and values of other parameters measured under the same conditions. * p < 0.05; ** p < 0.01; **** p < 0.0001.
ParameterMean CO2 EffectCO2VarietyC x VCorrelation
Aboveground dry weight, g plt−16.9%*****ns0.625**
Height, cm plt−13.6%*********0.119ns
Seed yield, g plt−17.1%*******
Harvest index, g g−1−1.0%ns****ns0.396ns
No. of pods, plt−17.2%******ns0.784**
No. of seeds, plt−15.5%*********0.600*
No. of seeds, pod−15.9%***0.665**
100-seed weight, g−12.3%**********−0.280ns
Table 3. Significance levels of main effects and interactions of CO2 and varieties on bean grain nutrient, protein, and lipid concentrations at maturity. ns, not significant; ** p < 0.01; *** p < 0.001; **** p < 0.0001.
Seed ElementCO2VarietyC x V
Znns****ns
Mn***********
Fe************
Pns******
Mg********ns
Cans******
K**********
Protein************
Lipidns**ns
Table 4. Significance levels of main effects and interactions of CO2 and varieties on soybean grain nutrient, protein, and lipid concentrations at maturity. ns, not significant; ** p < 0.01; *** p < 0.001; **** p < 0.0001.
Seed ElementCO2VarietyC x V
Znns******
Mn**********
Fens********
Pns****ns
Mgns******
Ca*******
K*********
Proteinns******
Lipidns***ns
Table 5. List of bean (n = 18) and soybean (n = 17) varieties grown at aCO2 (400 ppm) and eCO2 (800 ppm). Performance at eCO2 was obtained from a preliminary FACE experiment to find out the strong-responsive (>25% yield increase) and weak-responsive (<25% yield increase) varieties against eCO2.
CropAcession NumberGrowth HabitCommon NameOriginPerformance at eCO2
Bean aPI 203929DG1274MexicoStrong-responsive
Bean aPI 458586D or INHBNetherlandsStrong-responsive
Bean bPI 169920DKazakTurkeyWeak-responsive
Bean aPI 324691D ZKHungaryWeak-responsive
Bean aW6 9628IDamaCzechoslovakiaWeak-responsive
Bean aW6 12428NSPP 63BulgariaStrong-responsive
Bean aPI 550128ITrendNetherlandsWeak-responsive
Bean aPI 550038NSGarnetUnited StatesWeak-responsive
Bean bPI 212027DG1378IranWeak-responsive
Bean aPI 598287IPV1-4JapanWeak-responsive
Bean aPI 368715D or IRosomanskaMacedoniaStrong-responsive
Bean aPI 550035DAgateUnited StatesWeak-responsive
Bean bPI 149484DLoganUnited StatesWeak-responsive
Bean aPI 136687DYamalCanadaWeak-responsive
Bean aPI 165933DShimiIndiaWeak-responsive
Bean aPI 550037DDandyUnited StatesStrong-responsive
Bean bG 8853DMedraGermanyStrong-responsive
BeanaPI 477023D or ICBBNetherlandsStrong-responsive
Soybean aPI 361085 AIL.117RomaniaStrong-responsive
Soybean aPI 437413IUssurijscaja RussiaWeak-responsive
Soybean aPI 424194DISZ-IIHungaryWeak-responsive
Soybean aPI 445823ITubingerGermanyWeak-responsive
Soybean aPI 378676 AIPrimorskaja RussiaStrong-responsive
Soybean aPI 561302 AIBMSChinaWeak-responsive
Soybean aPI 437101IDV-0197RussiaWeak-responsive
Soybean aPI 319537 AITonoChinaStrong-responsive
Soybean aPI 437224ICSchi 675MoldovaStrong-responsive
Soybean aPI 319534 AIHonshu ChinaStrong-responsive
Soybean aPI 437676 AIMTTPDH ChinaWeak-responsive
Soybean aPI 445829 AIDunaykaRomaniaStrong-responsive
Soybean aPI 361097 AINovosadskaSerbiaStrong-responsive
Soybean aPI 360952IAmurskaja RussiaWeak-responsive
Soybean aPI 417554IEMPolandStrong-responsive
Soybean aPI 538409DShironomaiJapanStrong-responsive
Soybean aPI 153271IWBBelgiumStrong-responsive
a Obtained from GRIN; b obtained from CIAT; D, determinate; I, indeterminate; NS, not specified; NHB, North Holland Bruine; ZK, Zlaty Knot; CBB, Chocolate Brown Bean; BMS, Bai mao Shuang¸ MTTPDH, Man-tsan-tszinxPhin-di-Huan; EM, Early Mandarin; WB, Wisconsin Black.

