Article

Biological Control of Alternaria Leaf Spot Caused by Alternaria spp. in Jerusalem Artichoke (Helianthus tuberosus L.) under Two Fertilization Regimes

1
Department of Agronomy, Khon Kaen University, Khon Kaen 40002, Thailand
2
Department of Entomology and Plant Pathology, Khon Kaen University, Khon Kaen 40002, Thailand
3
Department of Plant Pathology and Microbiology, Iowa State University, Ames, IA 50011, USA
4
Department of Biochemical Science and Technology, National Chiayi University, Chiayi 60004, Taiwan
*
Author to whom correspondence should be addressed.
Plants 2019, 8(11), 463; https://doi.org/10.3390/plants8110463
Submission received: 26 September 2019 / Revised: 26 October 2019 / Accepted: 28 October 2019 / Published: 30 October 2019

Abstract

:
The objectives of this study were to evaluate the efficacy of integrating resistant genotypes of Jerusalem artichoke with Trichoderma harzianum isolate T9 to control Alternaria leaf spot caused by Alternaria spp. under two fertilization regimes and to determine whether T9 application induced chitinase and β-1,3-glucanase activity in Jerusalem artichoke leaves. Six Jerusalem artichoke varieties (resistant varieties JA15, JA86, and JA116 and susceptible varieties HEL246, HEL293, and JA109) and three disease control methods (a non-inoculated control, application of T. harzianum T9, and fungicide sprays (propiconazole at a rate of 30 mL/20 L of water, 375 ppm)) was conducted in two separate trials (different fertilization regimes) at the experimental farm of the Faculty of Agriculture, Khon Kaen University, Khon Kaen, Thailand. Resistant genotypes controlled Alternaria leaf spot effectively. Application of Trichoderma showed low efficacy to control Alternaria leaf spot, but in specific susceptible genotypes—HEL246 and HEL293—the application of Trichoderma could reduce disease severity up to 10%. The application of Trichoderma was associated with a rise in production of chitinase and β-1,3-glucanase in HEL246 seedlings. The number of Trichoderma propagules in soil, as well as the extent of colonization of roots and leaves, were monitored. The results indicated that application of Trichoderma had higher propagules than non-inoculated control. Neither varietal resistance nor the disease control methods used in this study impacted the yield or yield components of Jerusalem artichoke.

1. Introduction

Jerusalem artichoke (Helianthus tuberosus L.), also known as sunchoke, a native of North America, can provide multiple benefits as a functional food and source of bioethanol and animal feed [1]. Tubers of Jerusalem artichoke produce large amounts of inulin, a long-chain fructose with a terminal glycopyranose unit at the reducing end [2]. Inulin has attracted human dietary interest as a prebiotic, since it confers sweetness but cannot be metabolized by the mammalian digestive system. Inulin promotes growth of beneficial microbes such as bifidobacterial and lactobacilli in the human gut, so it is considered to be a functional food [3]. Jerusalem artichoke is viewed as having potential as a new commercial crop suitable for production in tropical areas of the world [4].
A fungal leaf spot disease incited by an Alternaria spp. has emerged as a threat to Jerusalem artichoke production in Thailand [5]. Alternaria leaf spot can cause significant economic damage to a wide variety of additional hosts, including sunflower (Helianthus spp.), on which it can cause yield loss of up to 80% [6]. The conventional approach to control of Alternaria leaf spot—spray applications of synthetic chemical fungicides—has been recommended for potato (Solanum tuberosum) [7], chili pepper (Capsicum annuum) [8], sunflower [9], and Jerusalem artichoke [10].
However, many synthetic chemical fungicides have negative side effects, including environmental pollution, damage to human health, and loss of efficacy due to increased pathogen resistance to fungicides. Therefore, alternatives to chemical fungicides are being sought for Alternaria leaf spot management. For example, resistant genotypes have been recommended as a strategy for controlling this disease in peanut (Arachis hypogea) [11] and sunflower [12]. In addition, biocontrol methods against Alternaria leaf spot can provide alternatives to synthetic chemical fungicides that are much less damaging to people and the environment. Trichoderma includes several species that have been reported to be effective for control of Alternaria leaf spot in sunflower [13], aloe vera (Aloe vera) [14], peanut [15], and chili [16]. In peanut, Trichoderma inhibited Alternaria alternata mycelia growth in vitro and suppressed disease development index under field condition, but less effective than conventional fungicide control [15]. In Jerusalem artichoke, T. harzianum isolate T9 reduced incidence of stem rot (caused by Sclerotium rolfsii) by 30% in greenhouse trials [17] while increasing the activity of the fungal cell-wall-degrading enzymes chitinase and β-1,3-glucanase [18].
Plant nutrition may also play a role in Alternaria leaf spot control [19]. For example, cotton (Gossypium hirsutum) plants with potassium deficiency were more susceptible to A. alternata than those that were not deficient [20]. In potato, a low rate of nitrogen fertilization resulted in greater lesion area for potato early blight (caused by Alternaria solani) than a high nitrogen rate [21].
To our knowledge, alternatives to chemical fungicides for control of Alternaria leaf spot have not been investigated in Jerusalem artichoke but are worth exploring in order to mitigate environmental damage and reduce the risk of the development of fungicide resistance. The objectives of this study were to evaluate the efficacy of integrating resistant genotypes of Jerusalem artichoke with T. harzianum to control Alternaria leaf spot caused by Alternaria spp. under two fertilization regimes and to determine whether T. harzianum induces the activity of chitinase and β-1,3-glucanase in Jerusalem artichoke leaves.

2. Results

2.1. Disease Parameters

For combined analysis of variance, there was a significant difference of two-way interactions for genotypes × fertilization regimes for all disease parameters. Therefore, the results were presented separately for each fertilization regime. For individual analysis of variance of both fertilization regimes, the interaction of genotypes × disease control methods for all disease parameters were found. Therefore, the disease parameters of genotypes were presented in each disease control methods.
The Trichoderma and fungicide treatments showed low reduction in disease severity (0−9% and 0−10% for Trichoderma application and fungicide sprays, respectively), area under the disease progress curve for disease incidence (AUDPC-DI), and area under the disease progress curve for disease severity (AUDPC-DS) across all genotypes (Table 1). In the low-fertilization trial, HEL293 had the highest disease severity, AUDPC-DI, and AUDPC-DS under all three disease control methods, whereas JA86, JA116, and JA15 showed relatively low disease severity, AUDPC-DI, and AUDPC-DS.
Under the high-fertilization regime, the Trichoderma treatment, JA86 had the lowest disease incidence among the genotypes (Table 2). For disease control methods, the Trichoderma and fungicide treatments showed low reduction in disease severity (0−10% and 0−5% for Trichoderma application and fungicide sprays, respectively), AUDPC-DI, and AUDPC-DS across all genotypes. HEL246 and HEL293 had the highest disease severity, AUDPC-DI, and AUDPC-DS, whereas JA86, JA116, and JA15 showed the lowest disease severity, AUDPC-DI, and AUDPC-DS under all disease control methods.

2.2. Monitoring of Trichoderma Soil Populations and Plant Colonization

Under both fertilization regimes across genotypes, Trichoderma inoculation resulted in a higher number of Trichoderma propagules than non-inoculated control (data not shown). Among genotypes-plot, soil adjacent to HEL246 had the highest number of Trichoderma propagules. For root and leaf colonization, the Trichoderma treatment resulted in 99–100% incidence of colonization, whereas the non-inoculated control had no colonization (data not shown).

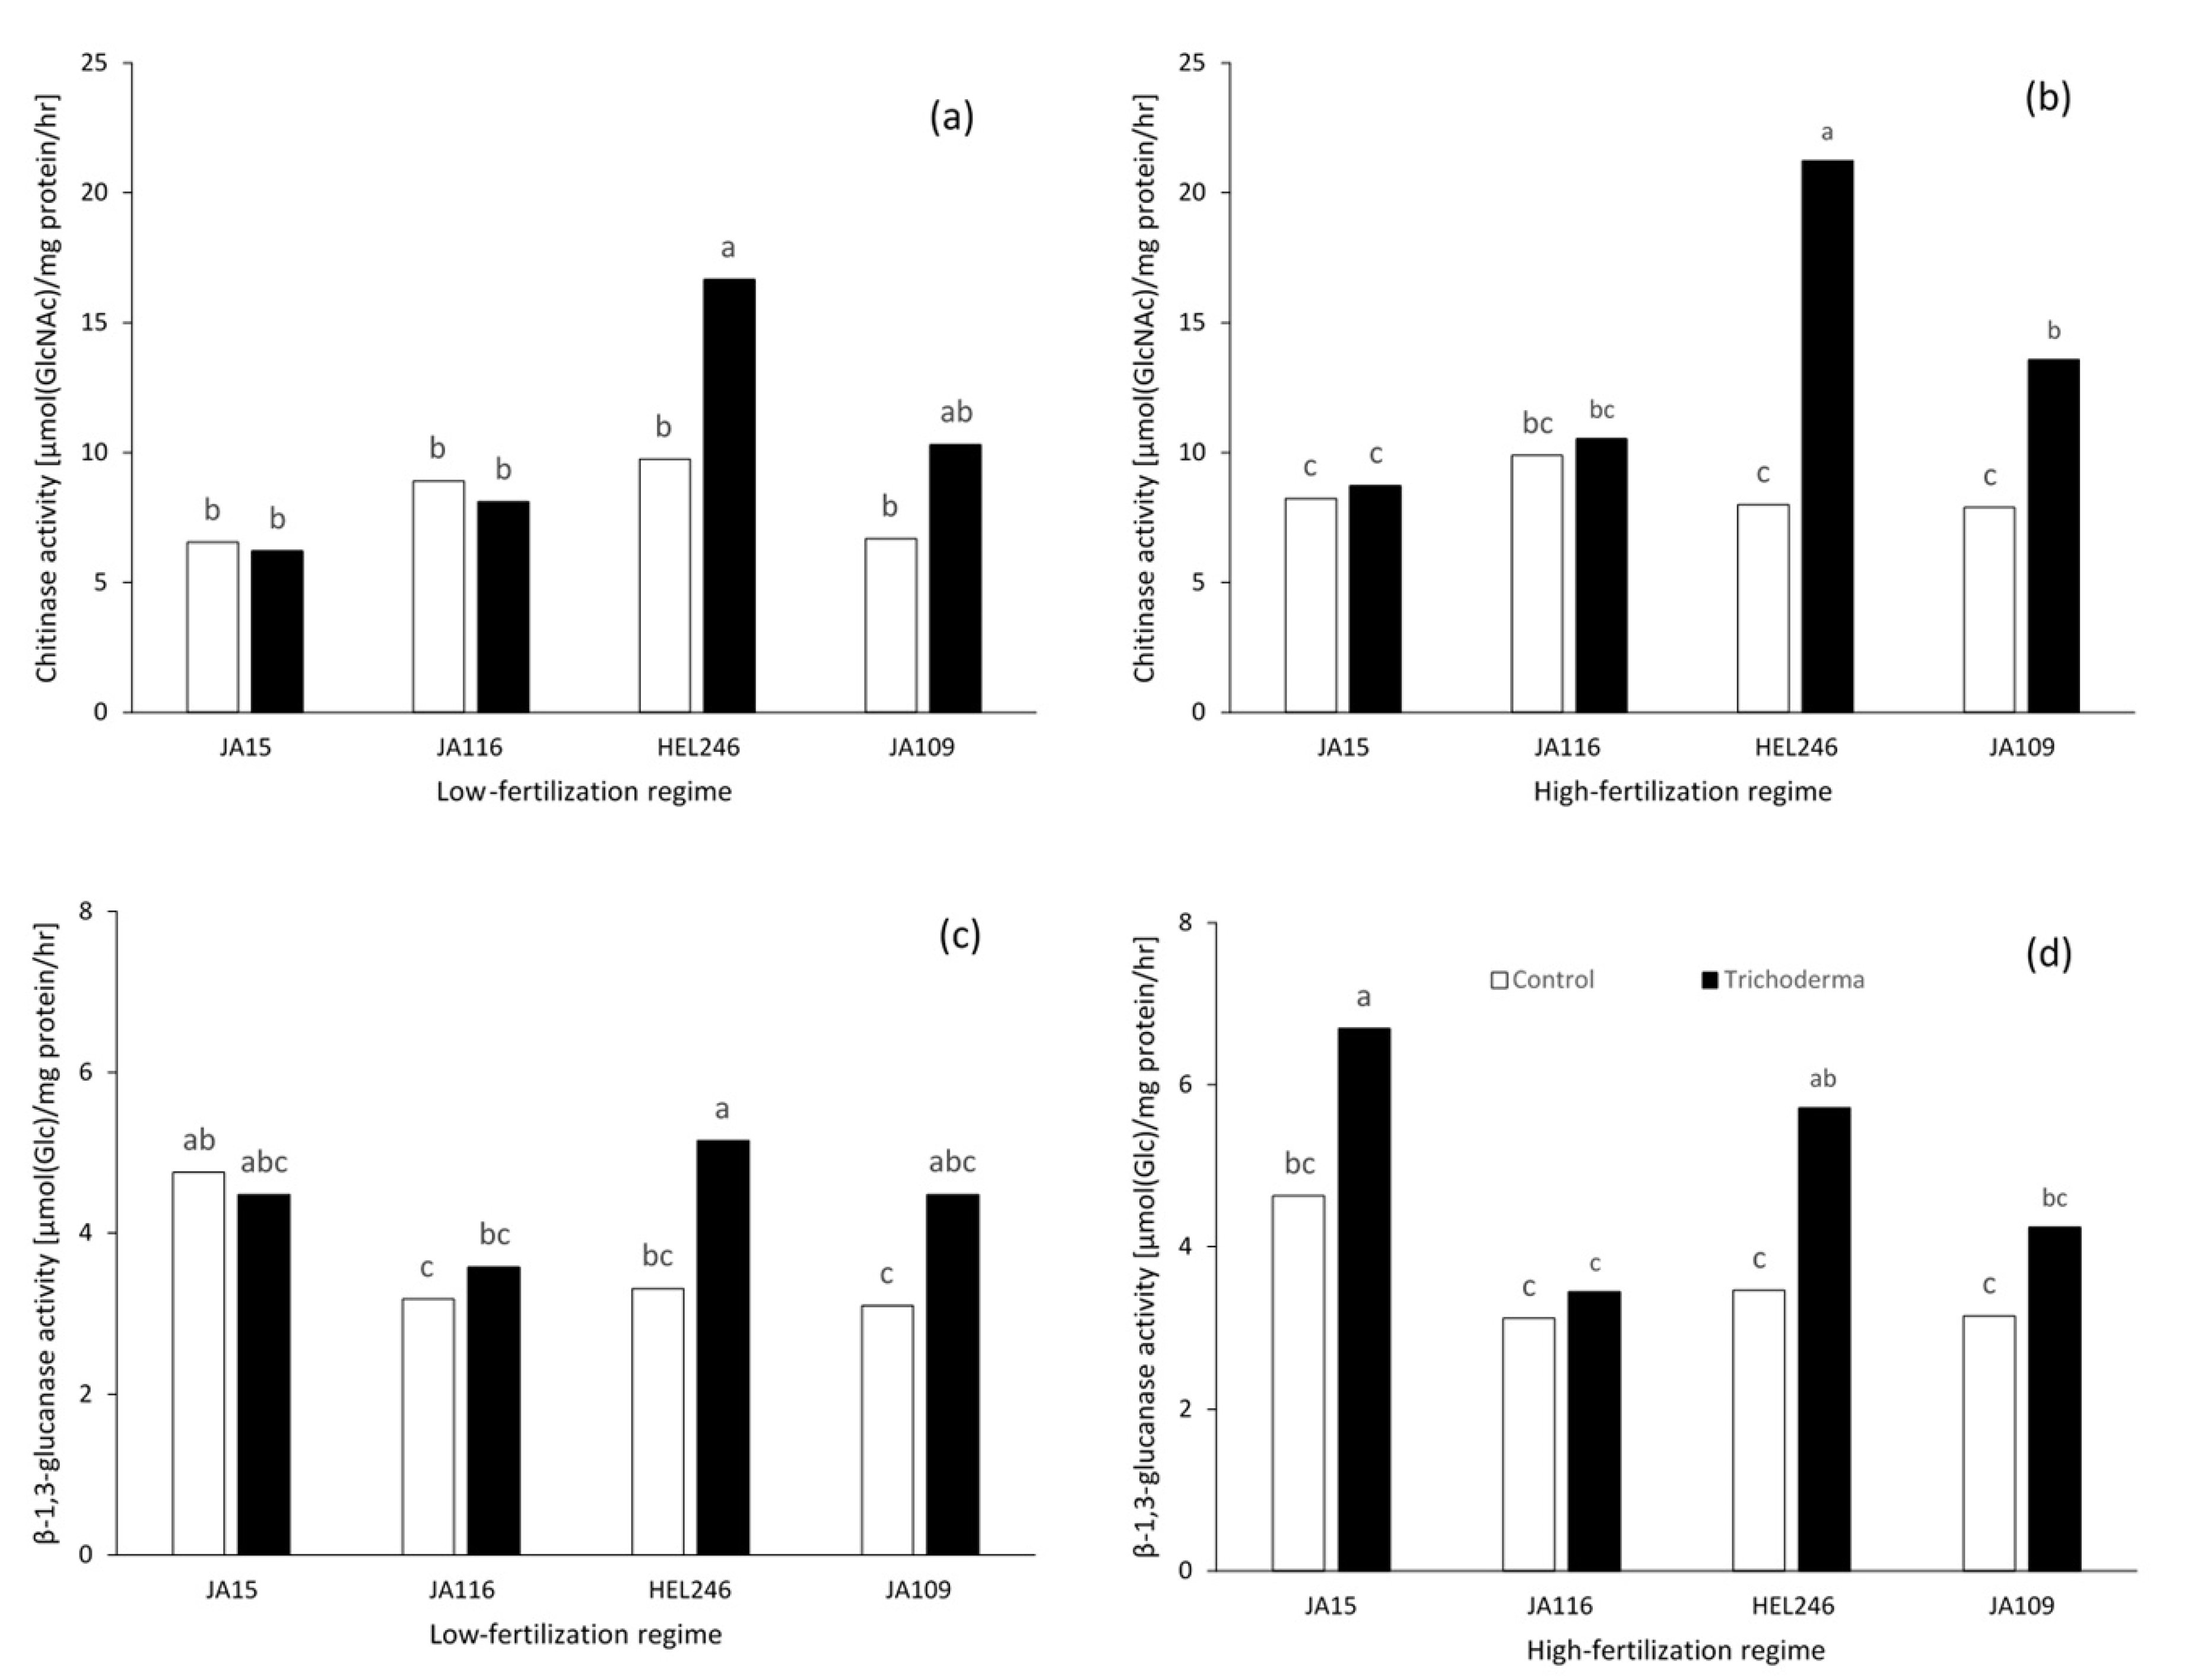
2.3. Enzyme Activity

2.3.1. Chitinase Activity

For combined analysis of variance, significant differences for fertilization regimes × genotypes were observed for chitinase activity, therefore the results were presented in a separate fertilization regime.
The Trichoderma treatment had higher chitinase activity than the non-inoculated control treatment only at seven days after transferring seedling (DATS) under high fertilization regime (data not shown) but was lower at 15 days after transplanting (DAT) under a low fertilization regime. No significant difference was observed at 7 DATS and 30 DAT under a low fertilization regime and 15 and 30 DAT under a high fertilization regime (data not shown). For genotypes, HEL246 had the highest chitinase activity at 7 DATS and higher than non-inoculated control under both fertilization regimes (Figure 1a,b).

2.3.2. β-1,3-Glucanase Activity

For combined analysis of variance, significant differences for fertilization regimes × genotypes were observed for β-1,3-glucanase activity, therefore the results were presented in a separate fertilization regime.
The Trichoderma treatment had higher β-1,3-glucanase activity than the non-inoculated control at 7 DATS under both fertilization regimes (data not shown), but lower at 30 DAT under high fertilization regime. No significant difference was observed at 15 and 30 DAT under low fertilization regime and 15 DAT under high fertilization regime across genotypes. AT 7 DATS, JA15 and HEL246 and JA109 had the highest β-1,3-glucanase activity, with the Trichoderma application under two fertilization regimes (Figure 1c,d) However, only HEL246 had higher β-1,3-glucanase activity than the non-inoculated control under both fertilization regimes.

2.4. Yield and Yield Components

No significant differences among disease control methods were found for tuber yield (Table 3) or yield components (number of tubers per plant and tuber size) across fertilization regimes (Table 4). For combined analysis of variance, significant differences were found for the interaction of genotypes × fertilization regime in tuber yield, so the results were presented in a two-way table.
Among genotypes, JA109 had the highest number of tubers per plant, whereas JA86 had the lowest number of tubers per plant (Table 4). JA86 had the largest tuber size, whereas JA116 and JA109 had the smallest tuber size. Under the low-fertilization regime, JA86 and HEL293 had the highest of tuber yield, whereas JA116 and JA109 had the lowest tuber yield under both fertilization regimes (Table 3).

3. Discussion

For the analysis of variance, the interaction between genotypes by disease control methods was observed. The results indicated that different efficacy of the control method depended on genotypes. For this study, applications of Trichoderma or fungicide sprays (propiconazole) suppressed disease severity, and AUDPC-DS of Alternaria leaf spot in Jerusalem artichoke genotypes under two fertilization regimes (Table 1 and Table 2). The different efficacy of Trichoderma to control the disease depended on level of resistant genotypes. Resistant genotypes, JA15, JA86, and JA116 [5] showed low disease severity (7–39% and 15–33% for low and high fertilization regimes, respectively), and AUDPC-DS in non-inoculated control, whereas the susceptible genotypes HEL246, HEL293, and JA109 [5] showed high disease severity (56–78% and 56–70% for low and high fertilization regimes, respectively). These findings supported that JA15, JA86, and JA116 had high resistance to Alternaria leaf spot. For high resistant genotypes, either application of Trichoderma or sprayed fungicide showed very low efficacy to reduce disease severity and AUDPC-DS under both fertilization regimes, so integrated control of resistant genotypes with Trichoderma or fungicide sprays (propiconazole) did not increase efficacy to control the disease. This outcome supports the conclusion that host plant resistance is the most practical, sustainable, and cost-efficient method for Alternaria leaf spot management in Jerusalem artichoke. For the susceptible genotypes, application of Trichoderma reduced the disease severity up to 10%, and AUDPC-DS only in HEL246 and HEL293 under both fertilization regimes. The results indicated low efficacy of Trichoderma application to control the disease. Similarly, T. harzianum was less effective to suppress Fusarium wilt in banana [22] and in tomato, only two of five isolates of T. harzinum inhibited growth of S. rolfsii according to in vitro and greenhouse trials [23]. Several contrasting reports include that T. harzianum reduced the disease incidence of Alternaria leaf spot more than 40% in bean [24], whereas in sunflower, Trichoderma viride reduced leaf spot severity caused by Alternaria helianthi more than 20% and increased seed yield [13]. The results of this study demonstrate the different efficacy of Trichoderma to control the disease depended on genotypes. Among susceptible genotypes, Trichoderma reduced disease severity only in genotypes HEL246 and HEL293 but did not reduce in JA109. Similar to previous reports, HEL246 was suppressed 20% of disease incidence and enhanced days to permanent wilting on stem rot caused by S. rolfsii after application of T. harzianum T9. In contrast JA37 found higher disease incidence and days to permanent wilting for application with T. harzianum T9 [17]. Trichoderma usually utilizes several mechanisms including antibiosis, competition, endophyte colonization, induced resistance, and mycoparasitism [25]. Trichoderma has two main components for biocontrol—direct activity of the plant pathogen by mycoparasitism and induced systemic resistance in plants [26]. In the present study, the hypothesis was Trichoderma-induced plant resistance and directly attacked the pathogen on Jerusalem artichoke. The results showed Trichoderma application had chitinase and β-1,3-glucanase activity higher than non-inoculated control only at 7 DATS in HEL 246 under two fertilization regimes, but there was no available data for HEL293. The chitinase and β-1,3-glucanase produced by plants defends against fungal infections in at least two different ways—by degrading fungal cell walls and promoting the release of cell-wall derived materials which can act as elicitors of defense reactions [27]. An upsurge of cell wall–degrading enzyme production is involved with plant resistance responses as pathogenesis-related proteins (PR protein). These responses are associated with a larger array of biochemical defenses against fungal pathogens [28]. Similarly, chitinase activity was also increased when inoculated with Trichoderma at five days after inoculation to control stem rot of Jerusalem artichoke in greenhouse conditions [18], whereas priming cucumber roots with Trichoderma spp. could increase activity of β-1,3-glucanase and chitinase up to 72 h post inoculation [29]. In the present study, at 15, and 30 DAT, chitinase and β-1,3-glucanase did not increase under both fertilization regimes, however, after inoculated with conidia, Trichoderma was able to survive in soil and colonize leaves and roots of Jerusalem artichoke. It might be because chitinases provide assets to enhance plant immunity and facilitate plant growth and development [30]. Either a less-effective strain of T. harzianum isolate T9 or inability to compete with native strains in the soil. These might be reasons for the low efficacy of Trichoderma to control Alternaria leaf spot in this study. For this study, the enzyme activity assay was a basic method to check plant expression, but further study should be carried out for a more accurate approach, such as gene expression using real time PCR. In this study, an enzyme activity assay was used as an index of expression of plant defense pathways. However, further studies are needed to characterize a wide range of defense pathway responses in Jerusalem artichoke against Alternaria spp.
Application of propiconazole decreased disease development in low efficacy of Jerusalem artichoke. In sunflower, severity of Alternaria leaf blight was reduced by applying propiconazole, and seed and oil yield increased [9]. Propiconazole also provided control of Alternaria leaf blight in peanut [15]. Despite its efficacy in controlling the disease in some crops, propiconazole was found to have several harmful effects on mammalian health [31]. Management tactics employing chemical fungicides should therefore be evaluated for impacts on applicators, consumers, and the environment, as well as for disease management.
Under the low-fertilization regime, most disease parameters were more severe than under the high-fertilization regime. In previous investigations, potassium promoted the development of thicker outer walls in epidermal cells, thus mitigating disease attack [32]. Similarly, the severity of Alternaria diseases in potato, tomato, and cotton was higher at lower levels of potassium [33]. Similar to potassium, the severity of disease was higher in the lower levels of calcium because it is essential for the functioning of plant membranes and as a component of plant cell wall structure [32]. In addition, plant tissues deficient in calcium are much more disease susceptible than non-deficient tissues [32]. Further study on the cost and benefit of Trichoderma and fungicide application for Alternaria leaf spot management in Jerusalem artichoke should be investigated in larger experimental plots across multiple seasons, sites, and years.
In the strategy for the management of Alternaria leaf spot, the high resistant varieties JA86 and JA116 should be used as a source of resistant lines and crossed with commercial varieties for high tuber yield, inulin content, and tuber quality. The segregating material should be used to select for resistant genotypes with high yield, inulin content, and quality for the grower.

4. Materials and Methods

4.1. Experimental Design and Treatment

A field trial at the experimental farm (Khon Kaen University, Thailand) was arranged as a 6 × 3 factorial in randomized complete block design with four replications. Six Jerusalem artichoke varieties included three resistance against Alternaria leaf spot (JA15, JA86, and JA116) and three susceptible to the disease (HEL246, HEL293, and JA109) [5]. The three disease control methods included applications of T. harzianum (isolate T9), sprays of propiconazole fungicide at a rate of 30 mL/20L of water (375 ppm), and a control that received neither T9 nor propiconazole.
Normal cultural practices for Jerusalem artichoke in Thailand would specify the application of commercial fertilizer (e.g., 15-15-15 of N–P2O5–K2O at a rate of 312.25 kg ha−1). However, small farmers usually apply half that rate in order to cut input costs. The experiment was conducted under two fertilization regimes (as environments)—a low- fertilization regime (applied commercial fertilizer (15–15–15 of N–P2O5–K2O at a rate of 156.125 kg ha−1) and a high- fertilization regime (15–15–15 of N–P2O5–K2O at a rate of 312.25 kg ha−1) during October 2016–Febuary 2017. There was a 10-day difference in planting date between the two fertilization regimes in order to allow sufficient time for disease assessment in both plantings. Weather data at these sites during the testing period (maximum and minimum temperature, amount of rainfall, and relative humidity) in both fertilization regimes were recorded; results were similar under the two fertilization regimes.

4.2. Preparation of T. harzianum T9 Inoculum

T. harzianum isolate T9, provided by the Department of Entomology and Plant Pathology, Khon Kaen University, Khon Kaen, Thailand, was isolated from soil at Nong Khai, Thailand [18] cultured on potato dextrose agar (PDA) and incubated at room temperature (28 ± 2 °C). Five days after incubation, 0.5-mm-diameter plugs of T. harzianum colony were excised by a cork borer and transferred to plastic bags containing 100 g of steam-sterilized sorghum (Sorghum bicolor) seeds. After three days of incubation at room temperature (28 ± 2 °C), the bags were shaken gently to separate individual seed and ensure thorough colonization by T. harzianum. The mixture was then incubated for 10 days until a layer of green spores covered all seeds.
For preparation of a T. harzianum spore suspension, the Trichoderma-infested seed was suspended in sterile water and then filtered through a layer of sterilized muslin cloth. The spore concentration was diluted to 106 conidia/mL with the aid of a hemocytometer.

4.3. Plant Material Preparation and Experimental Management

Soil preparation began by plowing three times, using conventional tillage equipment. Chemical fertilizer (15–15–15 of N–P2O5–K2O) was applied 30 DAT. Soil samples were taken at 0–30 cm depth by auger at three days before transplanting and at 37 DAT [34]. At each soil sampling time, samples were mixed thoroughly to assure uniformity and air-dried. The soil was assessed for soil texture, pH, organic matter [35], total N [36], available P [37], exchangeable K, exchangeable Ca, cation exchange capacity, and electrical conductivity. Raised beds (1.6 × 3 × 0.5 m) were created by tillage; spacing between plot-bed was 1.5 m. After application of fertilizer, the soil chemical and physical properties were similar, except for exchangeable K and Ca as follows: exchangeable potassium was 21.73 and 25.60 mg/kg, and exchangeable calcium was 325 and 340 mg/kg for low and high fertilization regimes, respectively.
Jerusalem artichoke genotypes were obtained from the Plant Gene Resource of Canada, Saskatoon, SK, Canada (JA15, JA86, JA116, and JA109) and the Leibniz Institute of Plant Genetics and Crop Plant Research, Gatersleben, Germany (HEL 246 and HEL293). Tubers were cut into small pieces with two to three active buds each and incubated for one week in moist coconut coir dust to facilitate uniform germination. The germinated tuber pieces were then transferred to plug trays with a mixture of soil and charred rice husks (1:1) until each seedling had two leaves. For the T. harzianum treatment, the medium was thoroughly mixed with 10 g of Trichoderma-infested seed inoculum per 1 kg medium. Healthy-appearing seedlings at the two-leaf stage were transplanted to field plots. Plant spacing was 0.4 m between rows and 0.3 m between plants within rows. For the T. harzianum treatment, three days before transplanting, Trichoderma-infested seed inoculum was incorporated into the soil at a rate of 200 g of the inoculum per plot. In addition, a spore suspension of T9 (106 conidia/ ml) was sprayed at a rate 10 mL/ plant at 20 and 45 DAT. For the fungicide treatment, propiconazole (Conacide, Nonthaburi, Thailand) at a rate of 30 mL/20 L of water (375 ppm) was sprayed at 30 DAT [9]. Hand weeding was performed at 27 and 60 DAT. Mini-sprinkler irrigation was available as necessary to avoid drought stress.

4.4. Monitoring of T. harzianum Propagules in Soil and Colonization of Roots and Leaves

T. harzianum populations in soil and colonization of roots and leaves were assessed in plots of JA15, JA116, HEL246, and JA109, both for the non-inoculated control and T. harzianum application treatments. Soil samples were collected from both treatments on the day of transplanting. The soil was collected by auger for 30 cm depth at five points per subplot and mixed well. The soil samples were subsampled for making soil dilution spread plates [38]. One gram of soil was placed in a test tube containing 9 mL of sterile distilled water and 10-fold serially diluted with sterile distilled water were made up to 10−7. Aliquots of 100 µL were taken from each dilution and spread on Martin’s medium [39]. The spreader plates were incubated at room temperature (28 ± 2 °C) for 24 h. After incubation, colonies of T. harzianum were counted on each plate. These numbers were recalculated to represent the number of T. harzianum T9 propagules in 1 g of soil as follows:
CFU/g soil = (A × B × C)/(D × E)
where A is the number of T. harzianum T9 colonies, B is the volume of added sterilized water (ml), C is a dilution factor, D is the weight of the soil sub-sample (g), and E is the volume of spreading the soil solution (mL).
Root samples were taken from T. harzianum-inoculated and non-inoculated control treatments 7 DATS. Roots of a single Jerusalem artichoke plant from each subplot were washed in sterilized water to remove media, then cut into 0.5 cm–long sections from root tip up to 3 cm, washed in sterile distilled water and dried with sterilized paper towels. Ten pieces of root were randomly placed on Martin’s medium plate and incubated at room temperature (28 ± 2 °C) for three days. The percentage for pieces of root colonization by T. harzianum was calculated as follows:
% pieces of colonized root = (number of roots colonized by Trichoderma/total number of roots) × 100
Colonized leaves of Jerusalem artichoke were examined at 30 DAT from T. harzianum-inoculated and non-inoculated control treatments. Two leaves from each plot were sampled. After that, the leaves were cut into 0.5 cm–long from the leaf blade, avoiding the midrib. Five pieces per leaf were washed in sterile distilled water and dried with sterilized paper towels. The method used was the same as described previously for root colonization.

4.5. Enzyme Activity Analysis

Leaf samples of Jerusalem artichoke were collected from JA15, JA116, HEL246, and JA109 in non-inoculated control and T. harzianum-inoculated treatments at 7, 15, and 30 DAT. Different plants in each subplot were sampled on each sampling date, so that no plant was sampled more than once. Six leaves from the top, medium, and low layer of plant from two plants were harvested from each subplot, placed in a plastic ziplock bag, and placed in an insulated cooler on ice for transport to the laboratory, where they were stored at −20 °C for crude protein extraction. Leaves were extracted for crude protein and analyzed for the activity of chitinase and β-1,3-glucanase. Samples (0.5 g) were ground in liquid nitrogen by using a mortar, then amended with 1200 μL of 0.1 M sodium acetate buffer pH 5.0 (sodium acetate trihydrate 13.6 g/ H2O 1-L adjusting pH levels by 1 N acetic acid). Samples were centrifuged at 4 °C and 14,000 rpm for 20 min. The supernatant was stored at −20 °C until analysis. Protein concentration analysis followed the Bradford method [40], using bovine serum albumin (BSA) as a standard protein.
For the chitinase activity assay, the reaction mixture was 0.1 mL of crude protein and 0.9 mL of 1% colloidal chitin used as a substrate in 0.1 M acetate buffer pH 5.0. The mixtures were incubated at 37 °C for 1 h, after which the reaction was stopped by heating at 100 °C for 20 min [41]. Reducing sugar in the supernatant was determined by spectrophotometry according to the method of Somogyi [42]. N-acetylglucosamine equivalent was evaluated as a measure of chitinase activity. One unit of enzyme activity was equated with 1 μmol of N-acetylglucosamine equivalent released from colloidal chitin within one hour per mg of protein in the reaction mixture.
Activity of β-1,3-glucanase was evaluated by incubation in 0.09% laminarin (β-1,3-glucan, Sigma Co., St. Louis, MO, USA) solution in 0.1 M acetate buffer, pH 5.0 in a volume of 0.9 mL with 0.1 mL of crude protein at 37 °C for 1 h. The reaction was stopped by heating at 100 °C for 20 min [41]. The reducing sugar (glucose equivalent) released from laminarin was reduced for enzyme analysis following the method of Somogyi [42]. One unit of enzyme activity was evaluated by the amount of glucose equivalent released from laminarin within 1 h per mg of protein in the reaction mixture.

4.6. Disease Assessment

Disease assessment was performed at three-day intervals from 20 to 81 DAT. Twelve plants per subplot, except bored row plants, plants for enzyme activity analysis, and plants for monitoring of T. harzianum colonization of roots and leaves, were assessed individually for the number of symptomatic plants and disease score (an index of disease severity). Disease score was determined by the qualitative rating scale developed by Mayee and Datar [43].
Disease incidence (DI) was calculated as follows [44]:
DI (%) = (number of symptomatic plants/total number of plants) × 100
Disease severity (DS) was calculated as follows [44]:
DS (%) = (∑ [(rating score × number of plants in rating) × 100]/(total number of sampled plants × highest rating)
The area under the disease progress curve (AUDPC) was calculated for disease incidence (AUDPC-DI) and disease severity (AUDPC-DS) using the formula provided by Ojiambo et al. [45].
AUDPC = ∑i=1[(Xi + Xi+3)/2] × (ti+3 − ti)
where xi is disease incidence or disease severity on day i, xi+3 is disease incidence or disease severity on day i + 3, ti is disease incidence or disease severity assessment on day i, and ti+3 is disease incidence or disease severity assessment on day i and i+3.

4.7. Yield and Yield Components of Jerusalem Artichoke

Five plants in each subplot, excluding border row plants, were sampled at maturity and used for the determination of yield components, number of tubers per plant, and tuber size. The number of tubers per plant was counted and averaged. Fresh tuber weight from five plants was determined and then divided by the number of tubers to obtain average tuber size (g/tuber).
Fresh weight of tubers was determined from 12 plants in each plot. Tubers were harvested, washed, and weighed, then the weights were divided by number of harvested plants to determine tuber yield (g/plant).

4.8. Statistical Analysis

Data set of each fertilization regime (environment) were analyzed according to analysis of variance. Error variances of individual analysis were tested for homogeneity. Data sets that complied with homogeneity of error variance were used for combined analysis. The results from combined analysis of variance showed that the genotype × fertilization regimes were significant for all disease parameters. The results indicated that the expression of genotypes and efficacy of disease control methods were different in the two fertilizer regimes, so the expression of genotypes and efficacy disease control methods were presented in each fertilization regimes base on individual analysis [46]. The least significant difference was used to compare treatment means [47]. Disease incidence and disease severity at 77 days after transplanting were presented because the data showed the highest F-test discriminates among genotypes and the lowest CV value. All calculations were done using the STATISTIX8 (Analytical Software, Tallahassee, FL, USA) software package [48].

5. Conclusions

In conclusion, resistant genotypes of Jerusalem artichoke alone showed low disease severity, AUDPC-DI, and AUDPC-DS and similar efficacy for suppression of Alternaria leaf spot as integrate control of resistant varieties and Trichoderma application or propiconazole sprays. Application of T. harzianum T9 or propiconazole sprays showed low reduction of disease severity (10% or less), and AUDPC-DS of Alternaria leaf spot in susceptible genotypes, especially HEL246 and HEL293, under two fertilization regimes. The application of T. harzianum induced an increase of chitinase and β-1,3- glucanase only at seedling stage in HEL246. Neither host resistance nor the biocontrol or fungicide strategies impacted yield or yield components of Jerusalem artichoke.

Author Contributions

Conceptualization, S.J., W.S. and S.S.; Data curation, W.V.; Formal analysis, W.V.; Investigation, W.V.; Methodology, S.J., W.S., and S.S.; Resources, M.L.G. and R.S.C.; Supervision, S.J.; Writing—original draft, W.V.; Writing—review & editing, W.V., S.J., M.L.G., and R.S.C.

Funding

This research was funded by the Royal Golden Jubilee Ph.D. Program (grant no. PHD/0066/2556), the Thailand Research Fund through the Senior Scholar Project of Sanun Jogloy (RTA6180002), and Peanut and Jerusalem Artichoke improvement for the Functional Food Project, Khon Kaen University.

Acknowledgments

The authors thank the Thailand Research Fund through the Senior Scholar Project of Sanun Jogloy (RTA6180002) and Peanut and Jerusalem Artichoke improvement for Functional Food Project, Khon Kaen University. The Leibniz Institute of Plant Genetics and Crop Plant Research, Gatersleben, Germany and the Plant Gene Resource of Canada, Saskatoon, SK, Canada are acknowledged for their donation of Jerusalem artichoke germplasm.

Conflicts of Interest

The authors declare no conflict of interest.

References

  1. Puttha, R.; Jogloy, S.; Wangsomnuk, P.P.; Srijaranai, S.; Kesmala, T.; Patanothai, A. Genotypic variability and genotype by environment interactions for inulin content of Jerusalem artichoke germplasm. Euphytica 2012, 183, 119–131. [Google Scholar] [CrossRef]
  2. Kays, S.J.; Nottingham, S.F. Biology and Chemistry of Jerusalem Artichoke Helianthus tuberosus L.; Taylor & Francis: Boca Raton, FL, USA, 2008. [Google Scholar]
  3. Hidaka, H.; Adachi, T.; Hirayama, M. Development and beneficial effects of fructo-oligosaccharides (Neosugar). In Advdnced Dietary Fibre Technology; McCleary, B.V., Prosky, L., Eds.; Blackwell Science: Oxford, UK, 2001; pp. 471–479. [Google Scholar]
  4. Ruttanaprasert, R.; Jogloy, S.; Vorasoot, N.; Kesmala, T.; Kanwar, R.S.; Holbrook, C.C.; Patanothai, A. Root responses of Jerusalem artichoke genotypes to different water regimes. Biomass Bioenergy 2015, 81, 369–377. [Google Scholar] [CrossRef]
  5. Viriyasuthee, W.; Saksirirat, W.; Saepaisan, S.; Gleason, M.L.; Jogloy, S. Variability of Alternaria leaf spot resistance in Jerusalem artichoke (Helianthus tuberosus L.) accessions grown in a humid tropical region. Agromomy 2019, 9, 268. [Google Scholar] [CrossRef]
  6. Dudhe, M.Y.; Bharsakle, S.S. Screening of germplasm line for resistance to Alterneria blight and necrosis disease in sunflower. Crop. Prot. Prod. 2005, 1, 84–87. [Google Scholar]
  7. Horsfield, A.; Wicks, T.; Davies, K.; Wilson, D.; Paton, S. Effect of fungicide use strategies on the control of early blight (Alternaria solani) and potato yield. Australas. Plant Pathol. 2010, 39, 368–375. [Google Scholar] [CrossRef]
  8. Gohel, N.M.; Solanky, K.U. In-vitro and In-vivo evaluation of fungicides against Alternaria alternata causing leaf spot and fruit rot disease of chilli. Green Farm. 2012, 3, 84–86. [Google Scholar]
  9. Mesta, R.K.; Benagi, V.I.; Kulkarni, S.; Basavarajappa, M.P. Management of Alternaria blight of sunflower through fungicides. Karnataka J. Agric. Sci. 2011, 24, 149–152. [Google Scholar]
  10. Figueirêdo, G.S.D.; Figueirêdo, L.C.D.; Cavalcanti, F.C.N.; Santos, A.C.D.; Antonio Felix da Costa, A.F.D.; Oliveira, N.T.D. Biological and Chemical Control of Sclerotinia sclerotiorum using Trichoderma spp. and Ulocladium atrum and Pathogenicity to Bean Plants. Braz. Arch. Biol. Technol. 2010, 53, 1–9. [Google Scholar] [CrossRef]
  11. Gremillion, S.K.; Culbreath, A.K.; Gorbet, D.W.; Mullinix, B.G.; Pittman, R.N.; Stevenson, K.L.; Todd, J.W.; Escobar, R.E.; Condori, M.M. Field evaluations of leaf spot resistance and yield in peanut genotypes in the United States and Bolivia. Plant Dis. 2011, 95, 263–268. [Google Scholar] [CrossRef]
  12. Reddy, C.V.C.M.; Reddy, A.V.V.; Sinha, B.; Lakshmi, M.S. Screening of sunflower genotypes for resistance against Alternaria blight. Asian J. Plant. Sci. 2006, 5, 511–515. [Google Scholar] [CrossRef]
  13. Vijayalakshmi, G.; Karuna, K.; Mahadevaswamy, G. Evaluation of Microbial Biocontrol Agents and Fungicides against Alternaria helianthi Causing Leaf Blight of Sunflower. Int. J. Curr. Microbiol. App. Sci. 2018, 7, 2726–2730. [Google Scholar] [CrossRef]
  14. Ghosh, R.; Barman, S.; Khatun, J.; Mandal, N.C. Biological control of Alternaria alternata causing leaf spot disease of Aloe vera using two strains of rhizobacteria. Biol. Control. 2016, 97, 102–108. [Google Scholar] [CrossRef]
  15. Ajayabhai, C.D.; Nath, K.; Bekriwala, T.; Bala, M. Management of Alternaria leaf blight of groundnut caused by Alternaria alternata. Indian Phytopathol. 2018, 71, 543–548. [Google Scholar] [CrossRef]
  16. Begum, M.F.; Rahman, M.A.; Alam, M.F. Biological control of Alternaria fruit rot of chili by Trichoderma species under field conditions. Mycobiology 2010, 38, 113–117. [Google Scholar] [CrossRef] [PubMed]
  17. Sennoi, R.; Jogloy, S.; Saksirirat, W.; Kesmala, T.; Patanothai, A. Genotypic variation of resistance to southern stem rot of Jerusalem artichoke caused by Sclerotium Rolfsii. Euphytica 2013, 190, 415–424. [Google Scholar] [CrossRef]
  18. Charirak, P.; Saksirirat, W.; Jogloy, S.; Saepaisan, S. Application of microorganisms for induced resistance in Jerusalem artichoke (Helianthus tuberosus L.) against stem rot caused by Sclerotium Rolfsii Sacc. J. Pure Appl. Microbiol. 2016, 10, 853–863. [Google Scholar]
  19. Wright, P.R. Research into early senescence syndrome in cotton. Better Crops Int. 1998, 12, 14–16. [Google Scholar]
  20. Zhao, J.; Zhao, F.; Jian, G.; Ye, Y.; Zhang, W.; Li, J.; Qi, F. Intensified Alternaria spot disease under potassium deficiency conditions results in acceleration of cotton (Gossypium hirsutum L.) leaf senescence. AJCS 2013, 7, 241–248. [Google Scholar]
  21. MacDonald, W.; Peters, R.D.; Coffin, R.H.; Lacroix, C. Effect of strobilurin fungicides on control of early blight (Alternaria solani) and yield of potatoes grown under two N fertility regimes. Phytoprotection 2007, 28, 9–15. [Google Scholar] [CrossRef]
  22. Castillo, A.G.; Puig, C.G.; Cumagun, C.J.R. Non-synergistic effect of Trichoderma harzianum and Glomus spp. in reducing infection of Fusarium wilt in banana. Pathogens 2019, 8, 43. [Google Scholar] [CrossRef]
  23. Suriyagamon, S.; Phonkerd, N.; Bunyatratchata, W.; Riddech, N.; Mongkolthanaruk, W. Compost seed of Trichoderma harzianum UD12-102 in controlling collar and stem rot of tomato caused by Sclerotium Rolfsii. Environ. Nat. Resour. J. 2018, 16, 20–28. [Google Scholar]
  24. Abd-El-Kareem, F. Induced resistance in bean plants against root rot and Alternaria leaf spot diseases using biotic and abiotic inducers under field conditions. Res. J. Agric. Biol. Sci. 2007, 3, 767–774. [Google Scholar]
  25. Benítez, T.; Rincón, A.M.; Limón, M.C.; Codón, A.C. Biocontrol mechanisms of Trichoderma strains. Int. Microbiol. 2004, 7, 249–260. [Google Scholar] [PubMed]
  26. Zeilinger, S.; Omann, M. Trichoderma biocontrol: Signal transduction pathways involved in host sensing and mycoparasitism. Gene Regul. Syst. Biol. 2007, 1, 227–234. [Google Scholar] [CrossRef]
  27. Boller, T. Antimicrobial functions of the plant hydrolases chitinase and β-1,3-glucanase. In Mechanisms of Plant Defense Responses; Fritig, B., Legrand, M., Eds.; Springer: Dordrecht, The Netherlands, 1993; Volume 2, pp. 391–400. [Google Scholar]
  28. Bigirimana, J.; De Meyer, G.; Poppe, J.; Elad, Y.; Hofte, M. Induction of systemic resistance on bean (Phaseolus vulgaris) by Trichoderma harzianum. Med. Fac. Landbouww. Univ. Gent 1997, 62, 1001–1007. [Google Scholar]
  29. Yedidia, I.; Shoresh, M.; Kerem, Z.; Benhamou, N.; Kapulnik, Y.; Chet, I. Concomitant induction of systemic resistance to Pseudomonas syringae pv. lachrymans in cucumber by Trichoderma asperellum (T-203) and the accumulation of phytoalexins. Appl. Environ. Microbiol. 2003, 69, 7343–7353. [Google Scholar] [CrossRef]
  30. Kumar, M.; Brar, A.; Yadav, M.; Chawade, A.; Vivekanand, V.; Pareek, N. Chitinases—Potential candidates for enhanced plant resistance towards fungal pathogens. Agriculture 2018, 8, 88. [Google Scholar] [CrossRef]
  31. Gupta, R.C. Veterinary Toxicology; Elsevier: San Diego, CA, USA, 2018. [Google Scholar]
  32. Dordas, C. Role of nutrients in controlling plant disease in sustainable agriculture. Agron. Sustain. Dev. 2008, 28, 33–46. [Google Scholar] [CrossRef]
  33. Blachinski, D.; Shtienberg, D.; Dinoor, A.; Kafkafi, U.; Sujkowski, L.S.; Zitter, T.A.; Fry, W.E. Influence of foliar application of nitrogen and potassium on Alternaria diseases in potato, tomato and cotton. Phytoparasitica 1996, 24, 281–292. [Google Scholar] [CrossRef]
  34. Carter, M.R.; Gregorich, E.G. Soil Sampling and Methods of Analysis Second Edition; Taylor & Francis: Boca Raton, FL, USA, 2007. [Google Scholar]
  35. Walkley, A.A. Critical examination of rapid method for determining organic carbon in soils: Effect of variation in digestion conditions and inorganic soil constituents. Soil Sci. 1947, 63, 251–264. [Google Scholar] [CrossRef]
  36. Bremner, J.M. Total nitrogen. Agronomy 1965, 9, 1149–1178. [Google Scholar]
  37. Bray, R.H.; Kurtz, L.T. Determination of total organic and available forms of phosphorus in soils. Soil Sci. 1945, 59, 39–45. [Google Scholar] [CrossRef]
  38. Johnson, L.F.; Curl, E.A. Methods for Research on the Ecology of Soil Borne Plant Pathogens; Burgess Publishing Co.: Minneapolis, MN, USA, 1972; p. 247. [Google Scholar]
  39. Slusarski, C.; Pietr, S.J. Combined application of dazomet and Trichoderma asperellum as an efficient alternative to methyl bromide in controlling the soil-borne disease complex of bell pepper. Crop Prot. 2009, 28, 668–674. [Google Scholar] [CrossRef]
  40. Bradford, M.M. A rapid and sensitive method for the quantitation of microgram quantities of protein utilizing the principle of protein-dye binding. Anal. Biochem. 1976, 72, 248–254. [Google Scholar] [CrossRef]
  41. Saksirirat, W.; Hoppe, H.H. Secretion of extracellular enzyme by Verticillium psalliotae Treschow and Verticillium lecanii (Zimm,) Viegas during growth on uredospore of the soybean rust fungus (Phakopsora pachyrhizi Syd) in liquid cultures. J. Phytopathol. 1991, 131, 161–173. [Google Scholar] [CrossRef]
  42. Somogyi, M. Notes on sugar determination. J. Biol. Chem. 1952, 95, 19–23. [Google Scholar]
  43. Mayee, C.D.; Datar, V.V. Sunflower Diseases. Phytopathometry—Tech. Bull. 1; Marathwad Agricultural University: Parabhan, India, 1986. [Google Scholar]
  44. Anfok, G.H. Benzo-(1,2,3)-thiadiazole-7-carbothioic acid S-methyl ester induces systemic resistance in tomato (Lycopersicon esculentum. Mill cv. Vollendung) to cucumber mosaic virus. Crop Prot. 2000, 19, 401–405. [Google Scholar] [CrossRef]
  45. Ojiambo, P.S.; Narla, R.D.; Ayiecho, P.O.; Nyabundi, J.O. Effect of infection level of sesame (Sesamum indicum L.) seed by Alternaria sesame on severity of Alternaria leaf spot. Tare 1998, 1, 125–130. [Google Scholar]
  46. Gomez, K.A.; Gomez, A.A. Statistical Procedures for Agricultural Research; John Wiley & Sons: New York, NY, USA, 1984. [Google Scholar]
  47. Hoshmand, A.R. Design of Experiments for Agriculture and the Natural Sciences; Chapman & Hall: Boca Raton, FL, USA, 2006. [Google Scholar]
  48. Statistix8: Analytical Software User’s Manual; Analytical Software: Tallahassee, FL, USA, 2003.
Figure 1. Enzyme activity of Trichoderma application and non-Trichoderma application for four Jerusalem artichoke genotypes at seven days after transferring seedling (DATS) under two fertilization regimes. (a) Chitinase activity at low fertilization regime; (b) Chitinase activity at high fertilization regime; (c) β-1,3-glucanase activity at low fertilization regime; (d) β-1,3-glucanase activity at high fertilization regime. Different letters indicate significant differences at p ≤ 0.05 among treatments.
Plants 08 00463 g001
Table 1. Means of disease parameters under low- fertilization regime of six Jerusalem artichoke genotypes and three control methods.
GenotypesDisease Incidence (%) 1 Disease Severity (%) 1
Non-Inoculated ControlTrichodermaFungicideMean Non-Inoculated ControlTrichodermaFungicideMean
JA15100 a100 a100 a100 A 39 d33 e33 e35 D
JA8667 b0 c50 b39 B 7 fg0 h6 g4 F
JA116100 a100 a100 a100 A 11 f11 f11 f11 E
HEL246100 a100 a100 a100 A 78 a69 b68 b72 B
HEL293100 a100 a100 a100 A 78 a75 a75 a76 A
JA109100 a100 a100 a100 A 56 c56 c56 c56 C
Mean94 A83 B92 A 45 A41 B42 B
GenotypesAreas under Disease Progress Curve for Disease Incidence Areas under Disease Progress Curve for Disease Severity
Non-Inoculated ControlTrichodermaFungicideMean Non-Inoculated ControlTrichodermaFungicideMean
JA152606 c2575 c2550 c2577 C 485 e453 e448 e462 C
JA86413 ef0 g230 fg214 E 46 f0 f26 f24 D
JA116700 d525 de579 de601 D 78 f58 f64 f67 D
HEL2465506 a5528 a5416 a5483 A 1840 a1534 bc1501 c1625 A
HEL2935581 a5559 a5341 a5494 A 1811 a1523 c1609 b1648 A
JA1093950 b3944 b3769 b3888 B 1189 d1160 d1138 d1163 B
Mean3126 A3022 B2981 B 908 A788 B798 B
Means followed by the same small letters were not significantly different treatment in combination according to least significant difference (LSD) at p ≤ 0.05. Means followed by the same capital letters were not significantly different for each of main effects, according to least significant difference (LSD) at p ≤ 0.05. 1 Disease incidence and disease severity at 77 days after transplanting.
Table 2. Means of disease parameters under high- fertilization regime of six Jerusalem artichoke genotypes and three control methods.
GenotypesDisease Incidence (%) 1 Disease Severity (%) 1
Non-Inoculated ControlTrichodermaFungicideMean Non-Inoculated ControlTrichodermaFungicideMean
JA15100 a100 a100 a100 A 33 e33 e33 e33 C
JA86100 a63 b100 a88 B 15 f7 h11 g11 E
JA116100 a100 a100 a100 A 16 f11 g11 g13 D
HEL246100 a100 a100 a100 A 70 a64 bc66 b67 A
HEL293100 a100 a100 a100 A 71 a61 c66 b66 A
JA109100 a100 a100 a100 A 56 d56 d56 d56 B
Mean100 A94 B100 A 44 A39 C40 B
GenotypesAreas under Disease Progress Curve for Disease Incidence Areas under Disease Progress Curve for Disease Severity
Non-Inoculated ControlTrichodermaFungicideMean Non-Inoculated ControlTrichodermaFungicideMean
JA152150 f2006 f2150 f2102 D 402 f374 f397 f391 D
JA86820 g225 i641 h562 E 97 g25 g71 g64 E
JA116627 h519 h532 h559 E 77 g58 g59 g65 E
HEL2465469 a5444 ab5281 b5398 A 1864 a1453 bc1576 b1631 A
HEL2935453 ab5459 a4958 c5290 B 1801 a1383 c1410 c1532 B
JA1094213 d3956 e3981 e4050 C 1208 d1067 e1050 e1108 C
Mean3122 A2935 B2924 B 908 A727 B761 B
Means followed by the same small letters were not significantly different treatment in combination according to least significant difference (LSD) at p ≤ 0.05. Means followed by the same capital letters were not significantly different for each of main effects, according to least significant difference (LSD) at p ≤ 0.05. 1 Disease incidence and disease severity at 77 days after transplanting.
Table 3. Means of tuber yield (g/plant) under two fertilization regimes of six Jerusalem artichoke genotypes and three control methods.
FactorsLow-Fertilization Regime High-Fertilization Regime
Genotypes
JA15182 bc 273 b
JA86243 a 278 ab
JA116107 d 150 c
HEL246189 bc 330 a
HEL293222 ab 321 ab
JA109150 cd 171 c
TreatmentsAcross Fertilization Regimes
Control (non-inoculated) 213 a
Trichoderma 219 a
Fungicide 221 a
Means followed by the same small letters in the same column were not significantly different according to least significant difference (LSD) at p ≤ 0.05.
Table 4. Means of the number of tubers per plant and tuber size (g/tuber) averaged over two fertilization regimes of six Jerusalem artichoke genotypes and three control methods.
FactorsNumber of Tubers/Plant Tuber Size (g/tuber)
Genotypes
JA1515.7 b 14.4 b
JA868.9 c 30.2 a
JA11616.5 b 7.7 c
HEL24616.3 b 15.8 b
HEL29317.6 b 15.4 b
JA10920.7 a 7.8 c
Treatments
Control (non-inoculated)16.3 a 14.5 a
Trichoderma15.0 a 15.9 a
Fungicide16.5 a 15.3 a
Means followed by the same small letters in the same column were not significantly different according to least significant difference (LSD) at p ≤ 0.05.

