Article

Integrative Molecular, Cytological, and Anatomical Analyses Reveal Two Distinct Clusters in Fittonia Cultivars


1
Mid-Florida Education and Research Centre, Horticultural Sciences Department, Institute of Food and Agricultural Sciences, University of Florida, 2725 Binion Road, Apopka, FL 32703, USA
2
State Key Laboratory of Vegetation Structure, Function and Construction (VegLab); Ministry of Education Key Laboratory for Transboundary Ecosecurity of Southwest China; Yunnan Key Laboratory of Biological Adaptation, Conservation and Utilization; School of Ecology and Environmental Science, Yunnan University, Kunming 650500, China
3
Southeastern Center for Conservation, Atlanta Botanical Garden, 1345 Piedmont Avenue NE, Atlanta, GA 30309, USA
*
Author to whom correspondence should be addressed.
Plants 2026, 15(9), 1391; https://doi.org/10.3390/plants15091391
Submission received: 20 March 2026 / Revised: 28 April 2026 / Accepted: 28 April 2026 / Published: 1 May 2026
(This article belongs to the Section Plant Systematics, Taxonomy, Nomenclature and Classification)

Abstract

Fittonia Coem. is a widely cultivated ornamental foliage genus, but the taxonomy and relationships of cultivated forms remain poorly resolved because traditional classifications rely heavily on variable foliar traits. In this study, we investigated the genetic relationships and phenotypic variation among 14 commercially available Fittonia cultivars using amplified fragment length polymorphism (AFLP), methylation-sensitive amplified fragment length polymorphism (MSAP), DNA flow cytometry, chromosome counting, and comparative morphological and anatomical analyses. Morphological character states were further mapped onto AFLP- and MSAP-derived phylograms to assess their evolutionary patterns and taxonomic relevance. AFLP and MSAP analyses consistently recovered two well-supported clusters within the cultivated material examined: Clade I, comprising ‘Titanic’ and ‘Angel Snow’, and Clade II, comprising the remaining 12 cultivars. These clades were independently supported by stable differences in trichome morphology, cystolith distribution, epidermal cell form, leaf venation architecture, and stem anatomy. In contrast, several traditionally used diagnostic characters, including leaf vein color and petiole length, were found to be homoplastic or continuously variable. Chromosome counts and flow cytometry indicated that all cultivars were diploid (2n = 36) and exhibited limited variation in genome size. Together, these results provide integrative evidence for two distinct clusters within cultivated Fittonia. However, because sampling was limited to commercially available cultivars, the relationship of these clusters to currently recognized species remains unresolved. Our findings highlight the limitations of traditional trait-based classifications and underscore the need for broader sampling, including wild populations, to reassess species boundaries in the genus.

1. Introduction

Fittonia Coem. is a small genus of tropical perennial herbs native to Colombia, Ecuador, Peru, and northern Brazil [1,2]. For their striking foliage, marked by networks of white, pink, or red veins, Fittonia species are widely cultivated as ornamental foliage plants. They are commonly known as nerve plants or silver-nerve plants. The horticultural history of the genus dates to the 1860s, when Fittonia albivenis (Veitch) Brummitt and F. gigantea Linden were introduced into England and Belgium and subsequently distributed throughout Europe [2,3]. Over more than 150 years of introduction, vegetative propagation, and horticultural selection, numerous cultivars differing in leaf size, shape, color, and variegation patterns have been developed. Commercially important cultivars include Angel Snow, Frankie, Fortissima, Black Star, Jacmita, Leather Leaf, Mini-Josan, Red Angel, Red Anne, Red Star, Red Vein, Superba, Titanic, and White Anne, all of which are now widely produced as indoor foliage plants worldwide [4]. In addition to their ornamental value, recent studies have shown that Fittonia can respond efficiently to far-red light and that genomic resources are emerging, including a near-complete haplotype-resolved genome and regulatory analyses of chlorophyll and anthocyanin biosynthesis [5,6,7].
Despite its horticultural importance and increasing research attention, the taxonomy of Fittonia remains unresolved. Early classifications recognized three species: F. argyroneura Coemans, F. gigantea Linden, and F. albivenis (Lem.) Coemans, and additional infraspecific distinctions were proposed based largely on leaf venation color, plant stature, and petiole length. For example, within F. argyroneura, the white-veined cultivar Argyroneura and the more robust Pearcei were distinguished by DeWolf [1] and in Hortus Third [8]. Later treatments reduced the genus to two species, F. gigantea and F. albivenis, with F. verschaffeltii treated as a synonym [1,2,3]. In that framework, F. gigantea was defined primarily by its larger habit, longer petioles, and white-veined leaves, whereas F. albivenis included smaller, creeping plants with shorter petioles. Brummitt [3] further subdivided F. albivenis into two informal groups, the “Argyroneura group” and the “Verschaffeltii group,” largely on the basis of venation color. However, these classifications are largely based on cultivated material and a limited set of morphological traits.
The difficulty with these classifications is that the characters on which they rely are highly plastic, continuous, or horticulturally selected. Leaf venation color, degree of variegation, blade size, and growth habit are all traits that can be strongly modified by selection and may not faithfully track underlying evolutionary differentiation. As a result, morphological resemblance among cultivars may reflect convergence or parallel selection for ornamental traits rather than shared ancestry. Conversely, less conspicuous structural traits, such as leaf architecture, epidermal micromorphology, trichome type, and cystolith distribution, may be more conserved and therefore more informative for taxonomic purposes. This raises a central systematic question: do currently cultivated Fittonia represent variation within a single highly polymorphic taxon, or do they reflect multiple distinct evolutionary groups or lineages obscured by overlapping horticultural phenotypes?
Previous anatomical and cytological observations suggest that the latter possibility deserves serious consideration. Ahmad [9] reported that the dense ocelli in ‘Pearcei’ differed from those of other taxa and proposed that it might represent a distinct species. Cytological studies also suggested ploidy variation, reporting triploidy in ‘Pearcei’ (2n = 54) and diploidy in var. verschaffeltii, var. argyroneura, and F. gigantea (2n = 36) [10,11]. At the same time, the overlap and inconsistency of diagnostic characters led Brummitt [3] to suggest that perhaps only a single species could be recognized in the genus. Thus, both lumping and splitting interpretations have persisted, and relationships among cultivated forms remain uncertain. Importantly, most of these interpretations are based on limited samples of cultivated materials rather than on comprehensive surveys of natural populations.
Resolving this uncertainty requires an integrative approach. Marker systems such as amplified fragment length polymorphism (AFLP) can detect broad genomic differentiation among closely related taxa [12], whereas methylation-sensitive amplified fragment length polymorphism (MSAP) can reveal epigenetic divergence associated with cytosine methylation patterns. When combined with flow cytometry, chromosome counts, and comparative anatomy, these methods can help distinguish patterns of differentiation associated with major genomic or cytological differences from those arising primarily through structural or regulatory variation. Such integration is particularly important in Fittonia, where striking foliar diversity may reflect relatively limited genomic divergence but substantial developmental and epigenetic differentiation.
The objectives of this study were therefore to clarify the relationships among currently cultivated Fittonia using AFLP, MSAP, DNA flow cytometry, chromosome counting, and traditional morphological and anatomical analyses. In addition, morphological character states were mapped onto AFLP- and MSAP-derived phylogenetic trees to assess whether historically important taxonomic characters reflect shared ancestry or repeated, independent evolution. By combining genomic, epigenetic, cytological, and anatomical evidence, we sought to determine whether cultivated Fittonia represents a single variable cluster or multiple distinct lineages and to identify characters that may provide a more reliable basis for future systematic assessment. This study provides an important framework for interpreting phenotypic variation and offers useful insights into the classification, trait-based selection, and breeding of ornamental Fittonia cultivars.

2. Materials and Methods

2.1. Plant Materials

A total of 14 Fittonia cultivars and two outgroup taxa, Aphelandra squarrosa Nees ‘Dania’ and Hypoestes ‘Pink Splash’ (Acanthaceae), were collected from research greenhouses at the University of Florida Mid-Florida Research and Education Center (MREC) and from commercial ornamental foliage plant nurseries in central Florida (Table S1).
Each cultivar was represented by a single horticultural accession maintained under greenhouse conditions, reflecting typical clonal propagation practices in cultivated Fittonia. Because cultivars are vegetatively propagated, within-cultivar genetic variation is expected to be minimal; the sampling design therefore focuses on comparisons among cultivars rather than on population-level variation. Sampling was restricted to commercially available cultivars from a limited geographic source; thus, the results are intended to reflect patterns within cultivated material rather than the full diversity of the genus. Voucher specimens were deposited in the Florida Museum of Natural History Herbarium (FLAS).

2.2. Molecular Analysis

2.2.1. DNA Extraction

Fresh young leaves were collected and immediately frozen in liquid nitrogen. Total genomic DNA was extracted using the cetyltrimethylammonium bromide (CTAB) method as described by Bousquet et al. [13]. DNA quality was assessed by electrophoresis on 0.65% agarose gels. DNA concentration was measured using the Turner Biosystems TB5-380 fluorometer (Turner BioSystems Inc., Sunnyvale, CA, USA).

2.2.2. Amplified Fragment Length Polymorphism (AFLP) Analysis

AFLP analysis was performed following the protocol of Vos et al. [14] with minor modifications. Restriction and ligation reactions were conducted in separate steps. For restriction digestion, 200 ng of genomic DNA from each sample was digested with 2 U of EcoRI and 2 U of MseI (New England Biolabs, Ipswich, MA, USA) at 37 °C overnight in 20 µL reaction volumes containing sterile water, 0.1% bovine serum albumin (BSA), and 10× NEBuffer 2.
Ligation reactions were performed in 20 µL volumes containing 1 U of T4 DNA ligase (Promega, Madison, WI, USA), 2 µL of 10× ligase buffer, 0.5 µM EcoRI adapter, 5 µM MseI adapter, 5 µL of digested DNA, and sterile water. Reactions were incubated at 20 °C for 12 h.
Pre-amplification reactions were carried out in 20 µL volumes containing 2 µL of restriction–ligation product, 1 U Taq DNA polymerase (Promega), 5× PCR buffer, 3.5 mM MgCl2, 0.5 mM dNTPs, and 1.25 ng µL−1 each of EcoRI + A and MseI + C primers. Amplification was performed using a Bio-Rad DNAEngine® PCR machine (Bio-Rad Laboratories, Hercules, CA, USA) under the following conditions: 1 cycle at 94 °C for 1 min; 20 cycles of 94 °C for 30 s, 56 °C for 1 min, and 72 °C for 1 min; followed by a final extension at 72 °C for 10 min. Pre-amplified products were diluted 1:20 with double-distilled water and used as templates for selective amplification.
Selective amplification was conducted in 12 µL reaction volumes containing 3 µL diluted pre-amplification product, 0.5 U Taq DNA polymerase (Promega), 5× PCR buffer, 3 mM MgCl2, 0.25 mM dNTPs, 0.05 µM IRDye700- or IRDye800-labeled EcoRI + 3 primers, and 0.125 µM MseI + 3 primers. The cycling profile consisted of 94 °C for 2 min; 10 cycles of 94 °C for 30 s, 65 °C for 30 s (decreasing by 0.7 °C per cycle), and 72 °C for 60 s; followed by 23 cycles of 94 °C for 30 s, 56 °C for 30 s, and 72 °C for 60 s; with a final extension at 72 °C for 5 min.
Five mL of Blue Stop loading buffer (LI-COR, Lincoln, NE, USA) was added to each reaction. Samples were denatured at 94 °C for 3 min, chilled on ice, and immediately loaded onto a 25 cm × 0.25 mm 6.5% denaturing polyacrylamide gel. Electrophoresis was performed in 1× TBE buffer using a LI-COR 4300 DNA Analyzer (LI-COR, Inc.). Twelve EcoRI + 3 and MseI + 3 primer combinations were analyzed (Table S2).

2.2.3. Methylation-Sensitive Amplified Fragment Length Polymorphism (MSAP) Analysis

MSAP analysis followed the AFLP protocol, with modifications to the restriction enzymes. MseI was replaced by the methylation-sensitive isoschizomers HpaII and MspI. The EcoRI adapters and primers remained unchanged, whereas adapters and primers for HpaII and MspI were designed according to Salmon et al. [15,16] (Table S2). Restriction–ligation reactions and PCR amplification conditions were identical to those used for AFLP.

2.3. Data Analysis

HpaII and MspI recognize the same restriction site (5′-CCGG) but differ in sensitivity to cytosine methylation. HpaII is sensitive to methylation of the internal cytosine on both strands, whereas MspI is sensitive to methylation of the external cytosine. Fragments present in both EcoRI/HpaII and EcoRI/MspI digests were classified as type I (non-methylated). Fragments presented only in EcoRI/MspI digests were classified as type II (fully methylated internal cytosines). Fragments present only in EcoRI/HpaII digests were classified as type III (hemimethylated). Fragments absent in both digests were classified as type IV (fully methylated) [17].
AFLP and MSAP fragments were scored using Saga™ Automated AFLP Analysis Software version 3.3 (LI-COR, Inc.) and verified by visual inspection. Bands were scored as binary characters: present (1) or absent (0). Fragments showing differences in intensity or presence/absence between EcoRI/HpaII and EcoRI/MspI digests were treated as methylation-sensitive polymorphisms following Cervera et al. [18]. Fragment types (I–IV) were annotated for each genotype.
AFLP and MSAP binary matrices were analyzed separately and in combination to assess clustering stability and consistency. Because many AFLP markers were autapomorphic and could produce long-branch artifacts, distance-based Neighbor-Joining analyses using Nei–Li distances were performed in PAUP* 4.0b10 [19]. Monomorphic bands were excluded. Aphelandra squarrosa was used as the outgroup to root the trees. Bootstrap support was evaluated using 50,000 replicates.
Bayesian inference was performed using MrBaryes 3 [20,21] to estimate support for clustering patterns. The restriction-site (binary) model was used with the default Markov chain Monte Carlo (MCMC) settings. Analyses were run for 1,000,000 generations, with trees sampled every 1000 generations. Convergence was evaluated using Tracer v1.6 [22], and the first 15% of sampled trees were discarded as burn-in after confirming stabilization of log-likelihood values.

2.4. Cytological Analysis

2.4.1. Chromosome Analysis

Root tips were collected from plants in the morning (08:30–09:00 h) and pre-treated with 2.0 mM 8-hydroxyquinoline for 3 h at room temperature. Samples were fixed in a 1:3 (v/v) mixture of glacial acetic acid and absolute ethanol for 2 h at 4 °C and then stored in 70% ethanol at −20 °C. Root tips were softened by hydrolysis in 1 N HCl at 60 °C for 5 min, briefly rinsed in distilled water, and stained with 2% aceto-orcein (Carolina Biological Supply Co. Burlington, NC, USA) for approximately 15 min.
Stained root tips were mounted on glass slides and gently macerated into small fragments using fine needles with a fresh drop of stain. Coverslips were applied and briefly warmed over an alcohol lamp. Preparations were gently tapped and squashed. Chromosome numbers were determined from 5 to 10 well-spread mitotic metaphase cells using a Nikon Optiphot Pol microscope (Nikon Instruments Inc., Melville, NY, USA). Images were captured with a Canon digital camera (Canon Inc., Tokyo, Japan).

2.4.2. Flow Cytometry Analysis

The nuclear DNA content of Fittonia cultivars was determined using a Partec PAS flow cytometer (Partec, Münster, Germany) according to the manufacturer’s protocol with minor modifications. Young leaf tissue (0.2–0.5 cm2) of pea (Pisum sativum ‘Ctirad’) was used as an internal reference standard. Leaf tissues of the standard and each Fittonia sample were chopped together in individual plastic Petri dishes containing 0.5 mL extraction buffer (CyStain® PI Absolute P kit, Partec, Munster, Germany) using a razor blade.
The homogenate was incubated for 0.5–1 min at room temperature and filtered through a 50 μm nylon mesh to remove debris. Two mL of staining buffer containing RNase and propidium iodide (PI) were added to the nuclei suspension, which was incubated for at least 30 min at room temperature to allow complete staining. Fluorescence intensities were measured using a flow cytometer equipped with a 488 nm argon laser and long-pass filter (Partec). Ploidy level and nuclear DNA content were estimated following Cui et al. [23]. Each sample was analyzed in three independent replicates.

2.5. Anatomical Analysis

The fourth fully expanded leaf from the shoot apex of each cultivar was sampled. Two 2 × 2 cm segments were excised from each leaf, one from the central region adjacent to the primary vein and the other from the marginal region. The segments were fixed in FAA (formalin: glacial acetic acid: 70% ethanol, 5:5:90, v/v). Samples were dehydrated through an ethanol–xylol series, processed using standard paraffin-embedding procedures, and embedded in Paraplast tissue embedding medium (Leica Biosystems Richmond, Inc., Richmond, IL, USA), which has a melting point of 56–58 °C.
Transverse leaf sections (7–8 µm thick) were stained with safranin–fast green. Petiole samples (0.5 cm in length) were collected from the midpoint of the petiole, and stem samples were taken from the internode between the third and fourth leaves. Petiole and stem sections were prepared following the same procedures used for leaf sections.
Cuticle, stomatal, and venation preparations followed the protocols of Stace [24,25], and leaf architecture samples were prepared following Luo and Zhou [26]. Stomatal density was determined as the mean number of stomata per unit area from five randomly selected fields under a 10× ocular lens and 10× objective lens. All transverse sections, epidermal preparations, and leaf architecture samples were examined using a Nikon OPTIPHOT microscope (Nikon Instruments Inc.) and photographed with a Canon S3 IS digital camera (Canon Inc.). All permanent slides were deposited at MREC. Anatomical terminology followed Hickey [27], Ahmad [9], Stace [28], and the Leaf Architecture Working Group [29].

2.6. Morphological Analysis

Five commonly used morphological characters in traditional taxonomy: (1) plant habit, (2) size of inflorescence bracteoles, (3) petiole length, (4) leaf venation color, and (5) bracteole shape, were measured from five pots of each Fittonia cultivar. Because bracteole size and petiole length decrease gradually from the apex to the base of the plant, only basal bracteoles and petioles from basal leaves were measured.
Character state delimitation and comparisons were based on current observations and previous studies (Table S3). Morphological character states were coded as absent (0) or present (1). Character state transitions were reconstructed on the AFLP/MSAP phylogram using MESQUITE version 2.75 [30]. These characters were used for comparative purposes to evaluate their consistency with molecular clustering patterns, rather than for formal taxonomic delimitation.

3. Results

3.1. Genetic Relationships Among Fittonia Cultivars

The 12 AFLP primer-pair combinations generated 549 clear fragments, of which 292 (53.1%) were polymorphic. In the MSAP analysis, 667 fragments were obtained from 12 primer-pair combinations, including 212 polymorphic fragments (31.8%) from EcoRI/MspI and 265 polymorphic fragments (38.4%) from EcoRI/HpaII. The total number of fragments and polymorphic loci detected by AFLP and MSAP is summarized in Table 1.
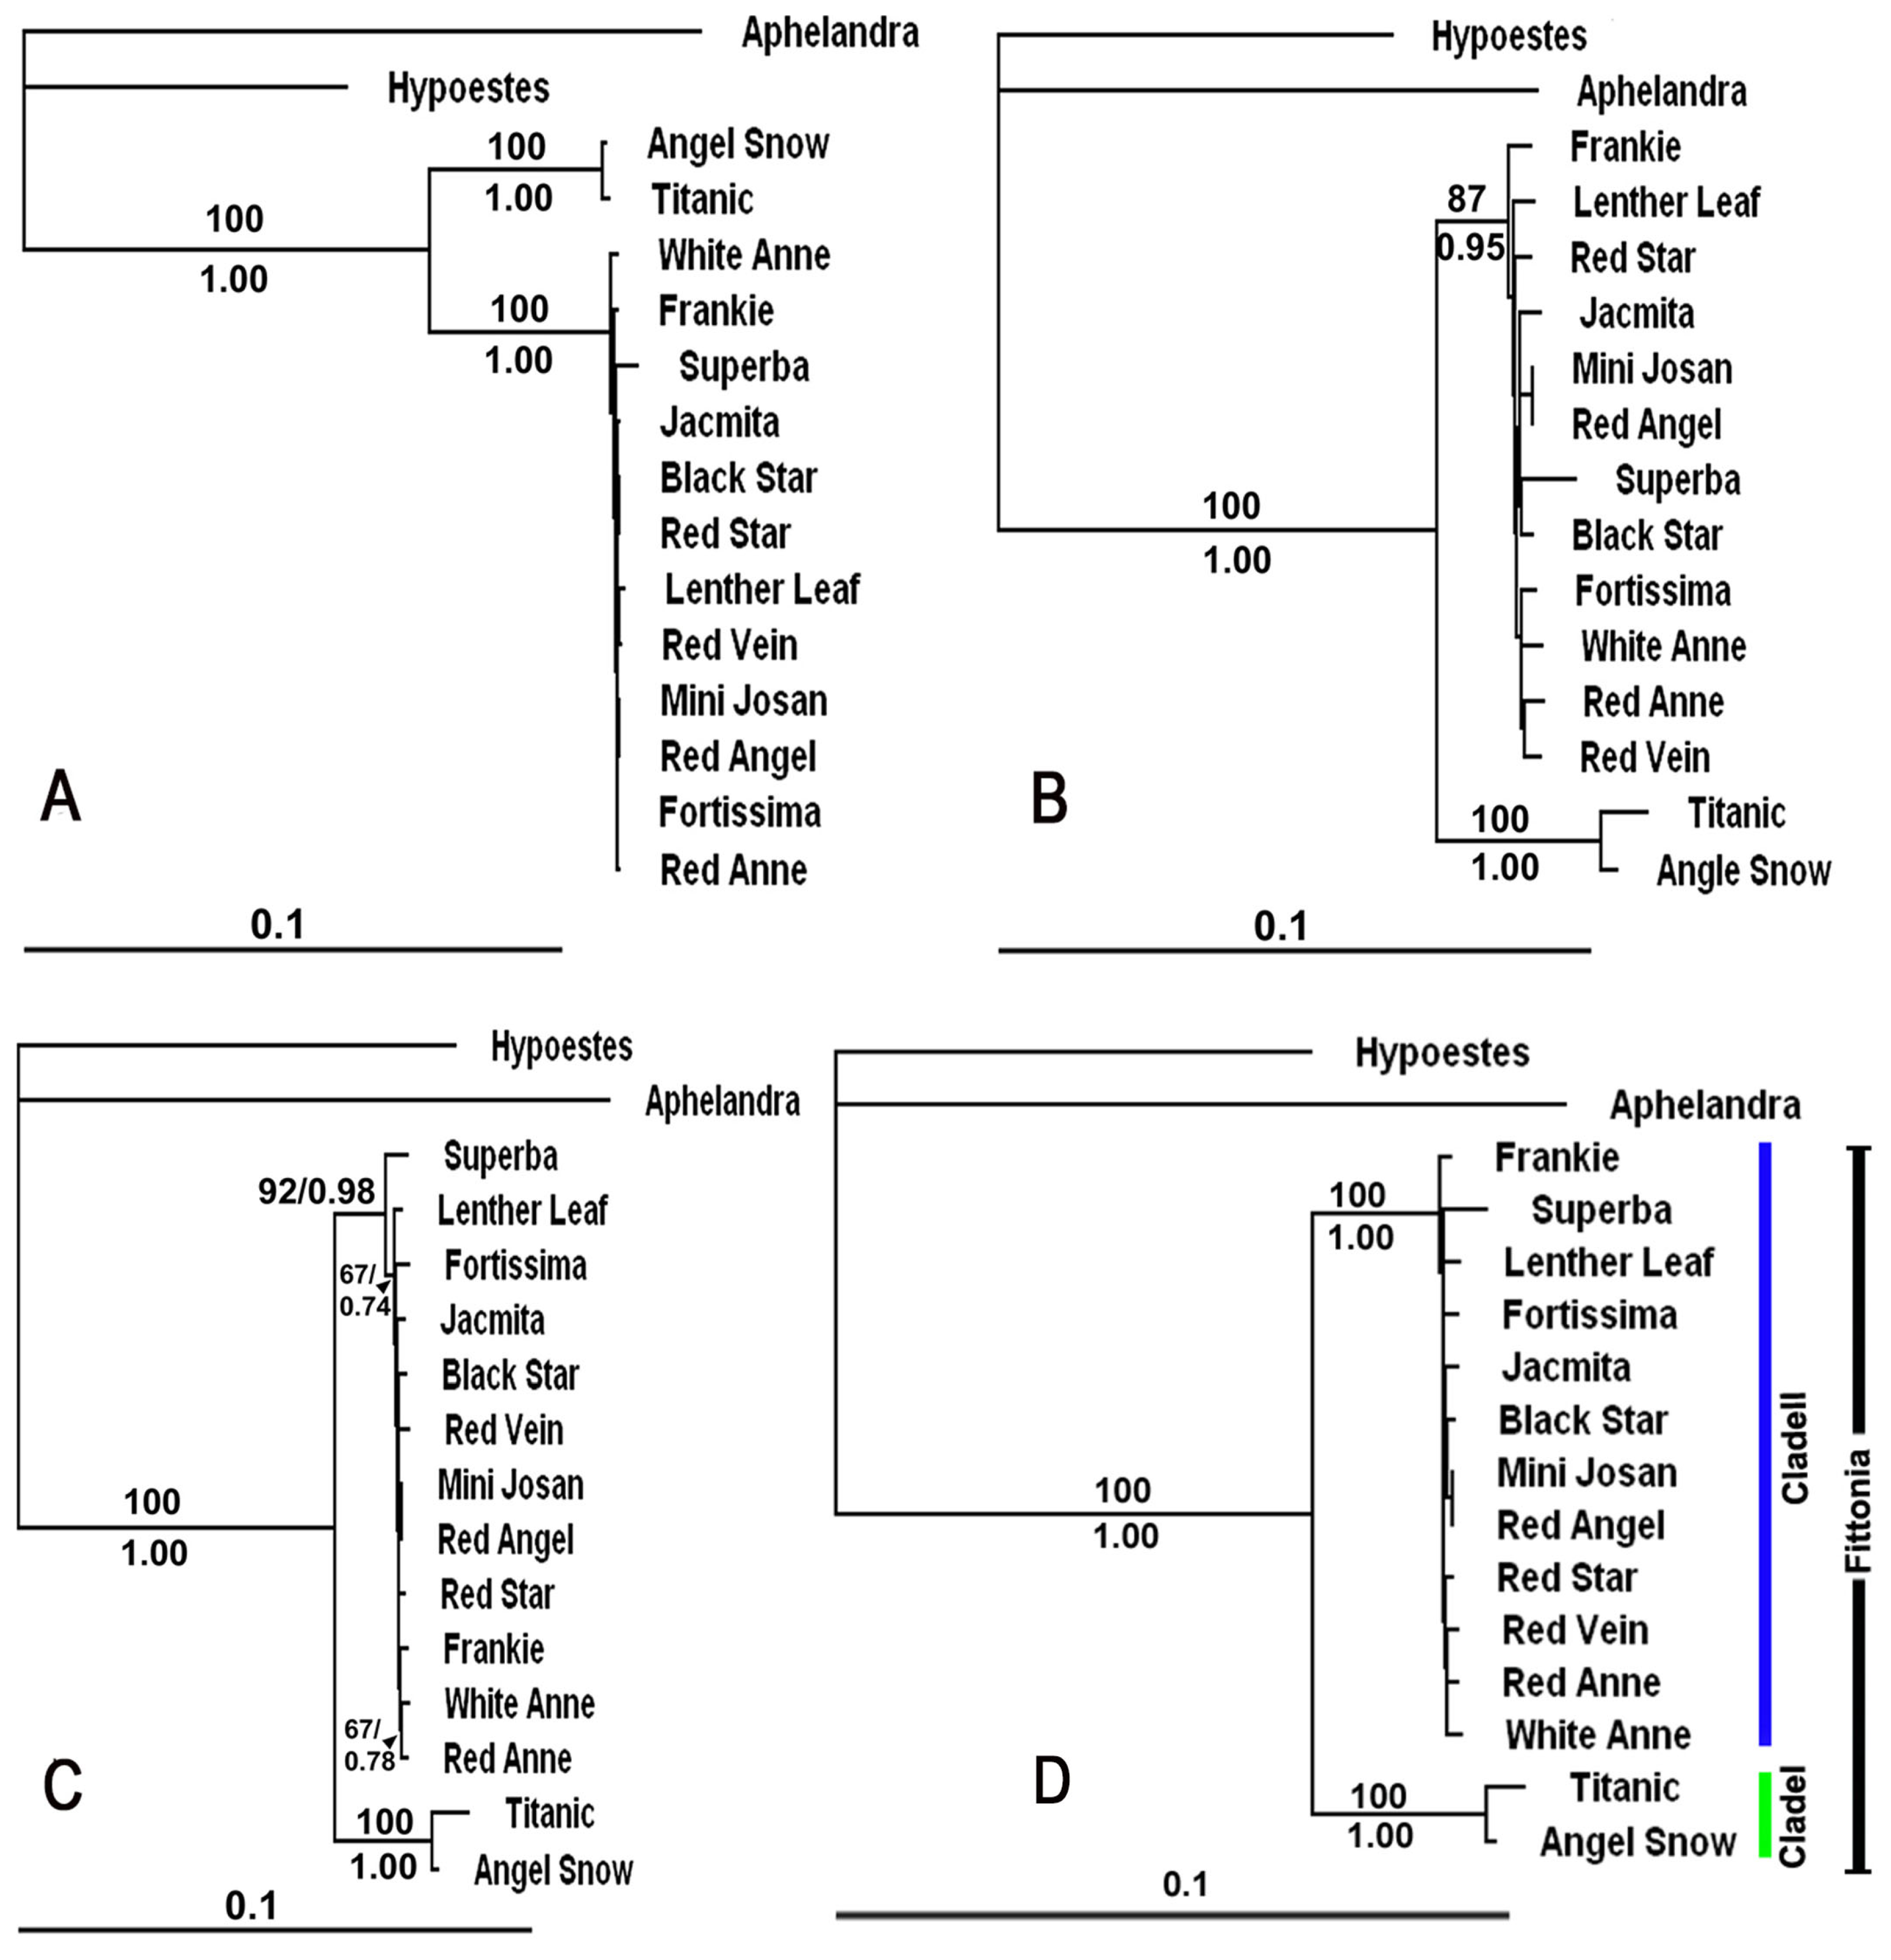
Neighbor-joining analysis based on Nei–Li genetic distances produced an AFLP tree with a total branch length of 0.50760 (Figure 1A), an MspI-MSAP tree with a total branch length of 0.32075 (Figure 1B), and an HpaII-MSAP tree with a total branch length of 0.32282 (Figure 1C). The topologies of these three trees were highly congruent. The monophyly of the sampled Fittonia cultivars was strongly supported (100% bootstrap). Two major clusters were consistently recovered: Clade I, comprising ‘Titanic’ and ‘Angel Snow’, supported by 100% bootstrap, and Clade II, including the remaining 12 cultivars, supported by 87–100% bootstrap values. Within Clade II, no internal nodes were supported by bootstrap values > 80% in either the AFLP or HpaII-MSAP analyses, and only two weakly supported nodes (< 80%) were observed in the MspI-MSAP phylogram.
Combined analysis of the three datasets produced a tree topology (Figure 1D) similar to those derived from AFLP and MSAP alone, with strong support (100% bootstrap) for the monophyly of Fittonia and for the separation into two major clusters within the cultivated material examined. However, no stable substructure within Clade II was supported (Figure 1C).

3.1.1. MSAP Analysis

A total of 667 MSAP fragments were detected and classified into four fragment types (Figure S1). Type I fragments ranged from 200 to 221 across cultivars, of which approximately 30–47% were methylation-sensitive. Type II fragments (internal cytosine methylation) ranged from 181 to 216, Type III fragments (hemi-methylated cytosine) from 144 to 164, and Type IV fragments (fully methylated cytosines on both strands) from 84 to 134. The relative proportions of the four fragment types differed among cultivars (Table 2). ‘Superba’ exhibited the highest overall methylation level (82.78%), whereas ‘Angel Snow’ had the lowest (76.76%). ‘Titanic’ showed the highest proportion of fully methylated fragments (47.31%), while the lowest proportion of full methylation was observed in ‘Fortissima’ (44.46%).
Many methylated and non-methylated fragments were shared across cultivars, indicating similar patterns (Table 2). A total of 116 Type I, 84 Type II, and 77 Type III fragments were shared by all cultivars. Among polymorphic fragments, 23% of the variation was associated with the differentiation of ‘Titanic’ and ‘Angel Snow’ from the remaining cultivars. Thirty-nine Type I fragments (21.6% of all Type I fragments) were unique to ‘Titanic’ and ‘Angel Snow’, whereas 51 Type I fragments (27.2%) were present only in the remaining 11 cultivars. Similarly, 39 and 51 Type I fragments, 20 and 22 Type II fragments, and 21 and 25 Type III fragments were shared by Clade I and Clade II, respectively.

3.1.2. Genome Size and Cytology of Fittonia Cultivars

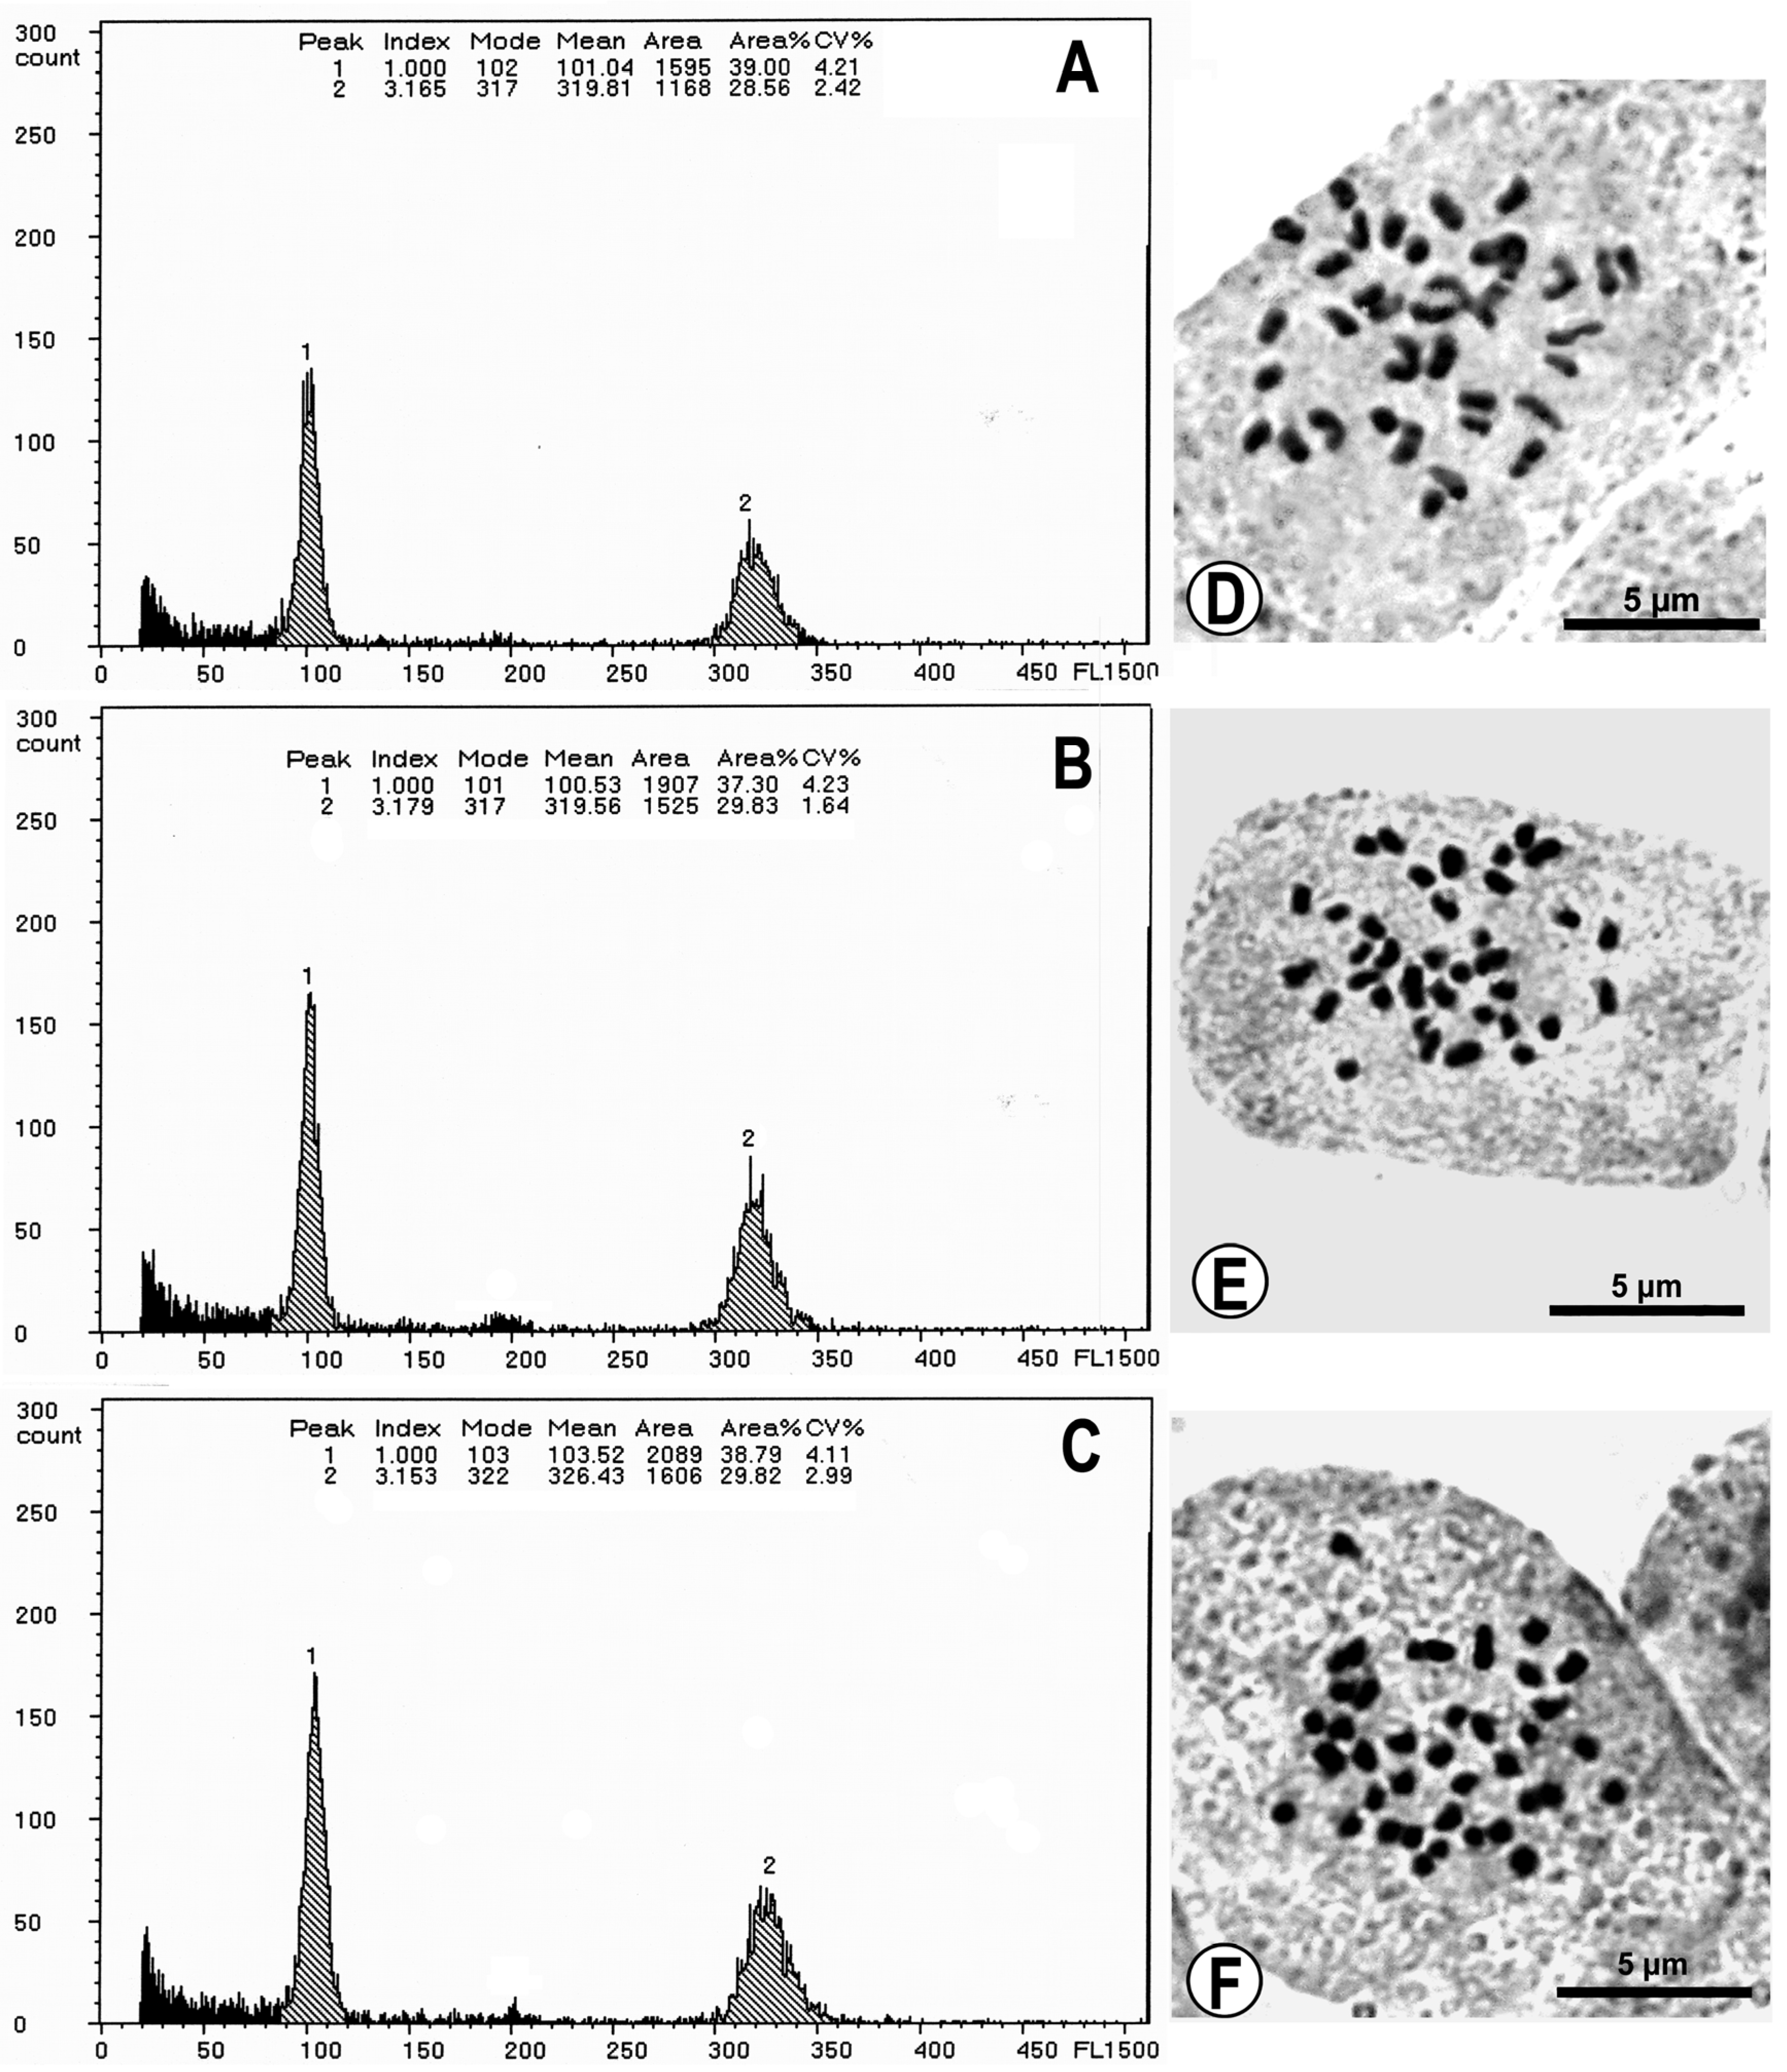
Flow cytometric profiles of all Fittonia cultivars exhibited distinct and consistent fluorescence peaks (Figure 2A–C). Genome size estimates, calculated relative to the internal standard (Pisum sativum ‘Ctirad’), are presented in Table 3. Statistical analysis indicated no significant differences in nuclear DNA content among the cultivars. Chromosome counts revealed that all cultivars were diploid with 2n = 36. Chromosomes were small, generally less than 5 µm in length (Figure 2D–F).

3.2. Comparative Anatomy

3.2.1. Leaf Microanatomy

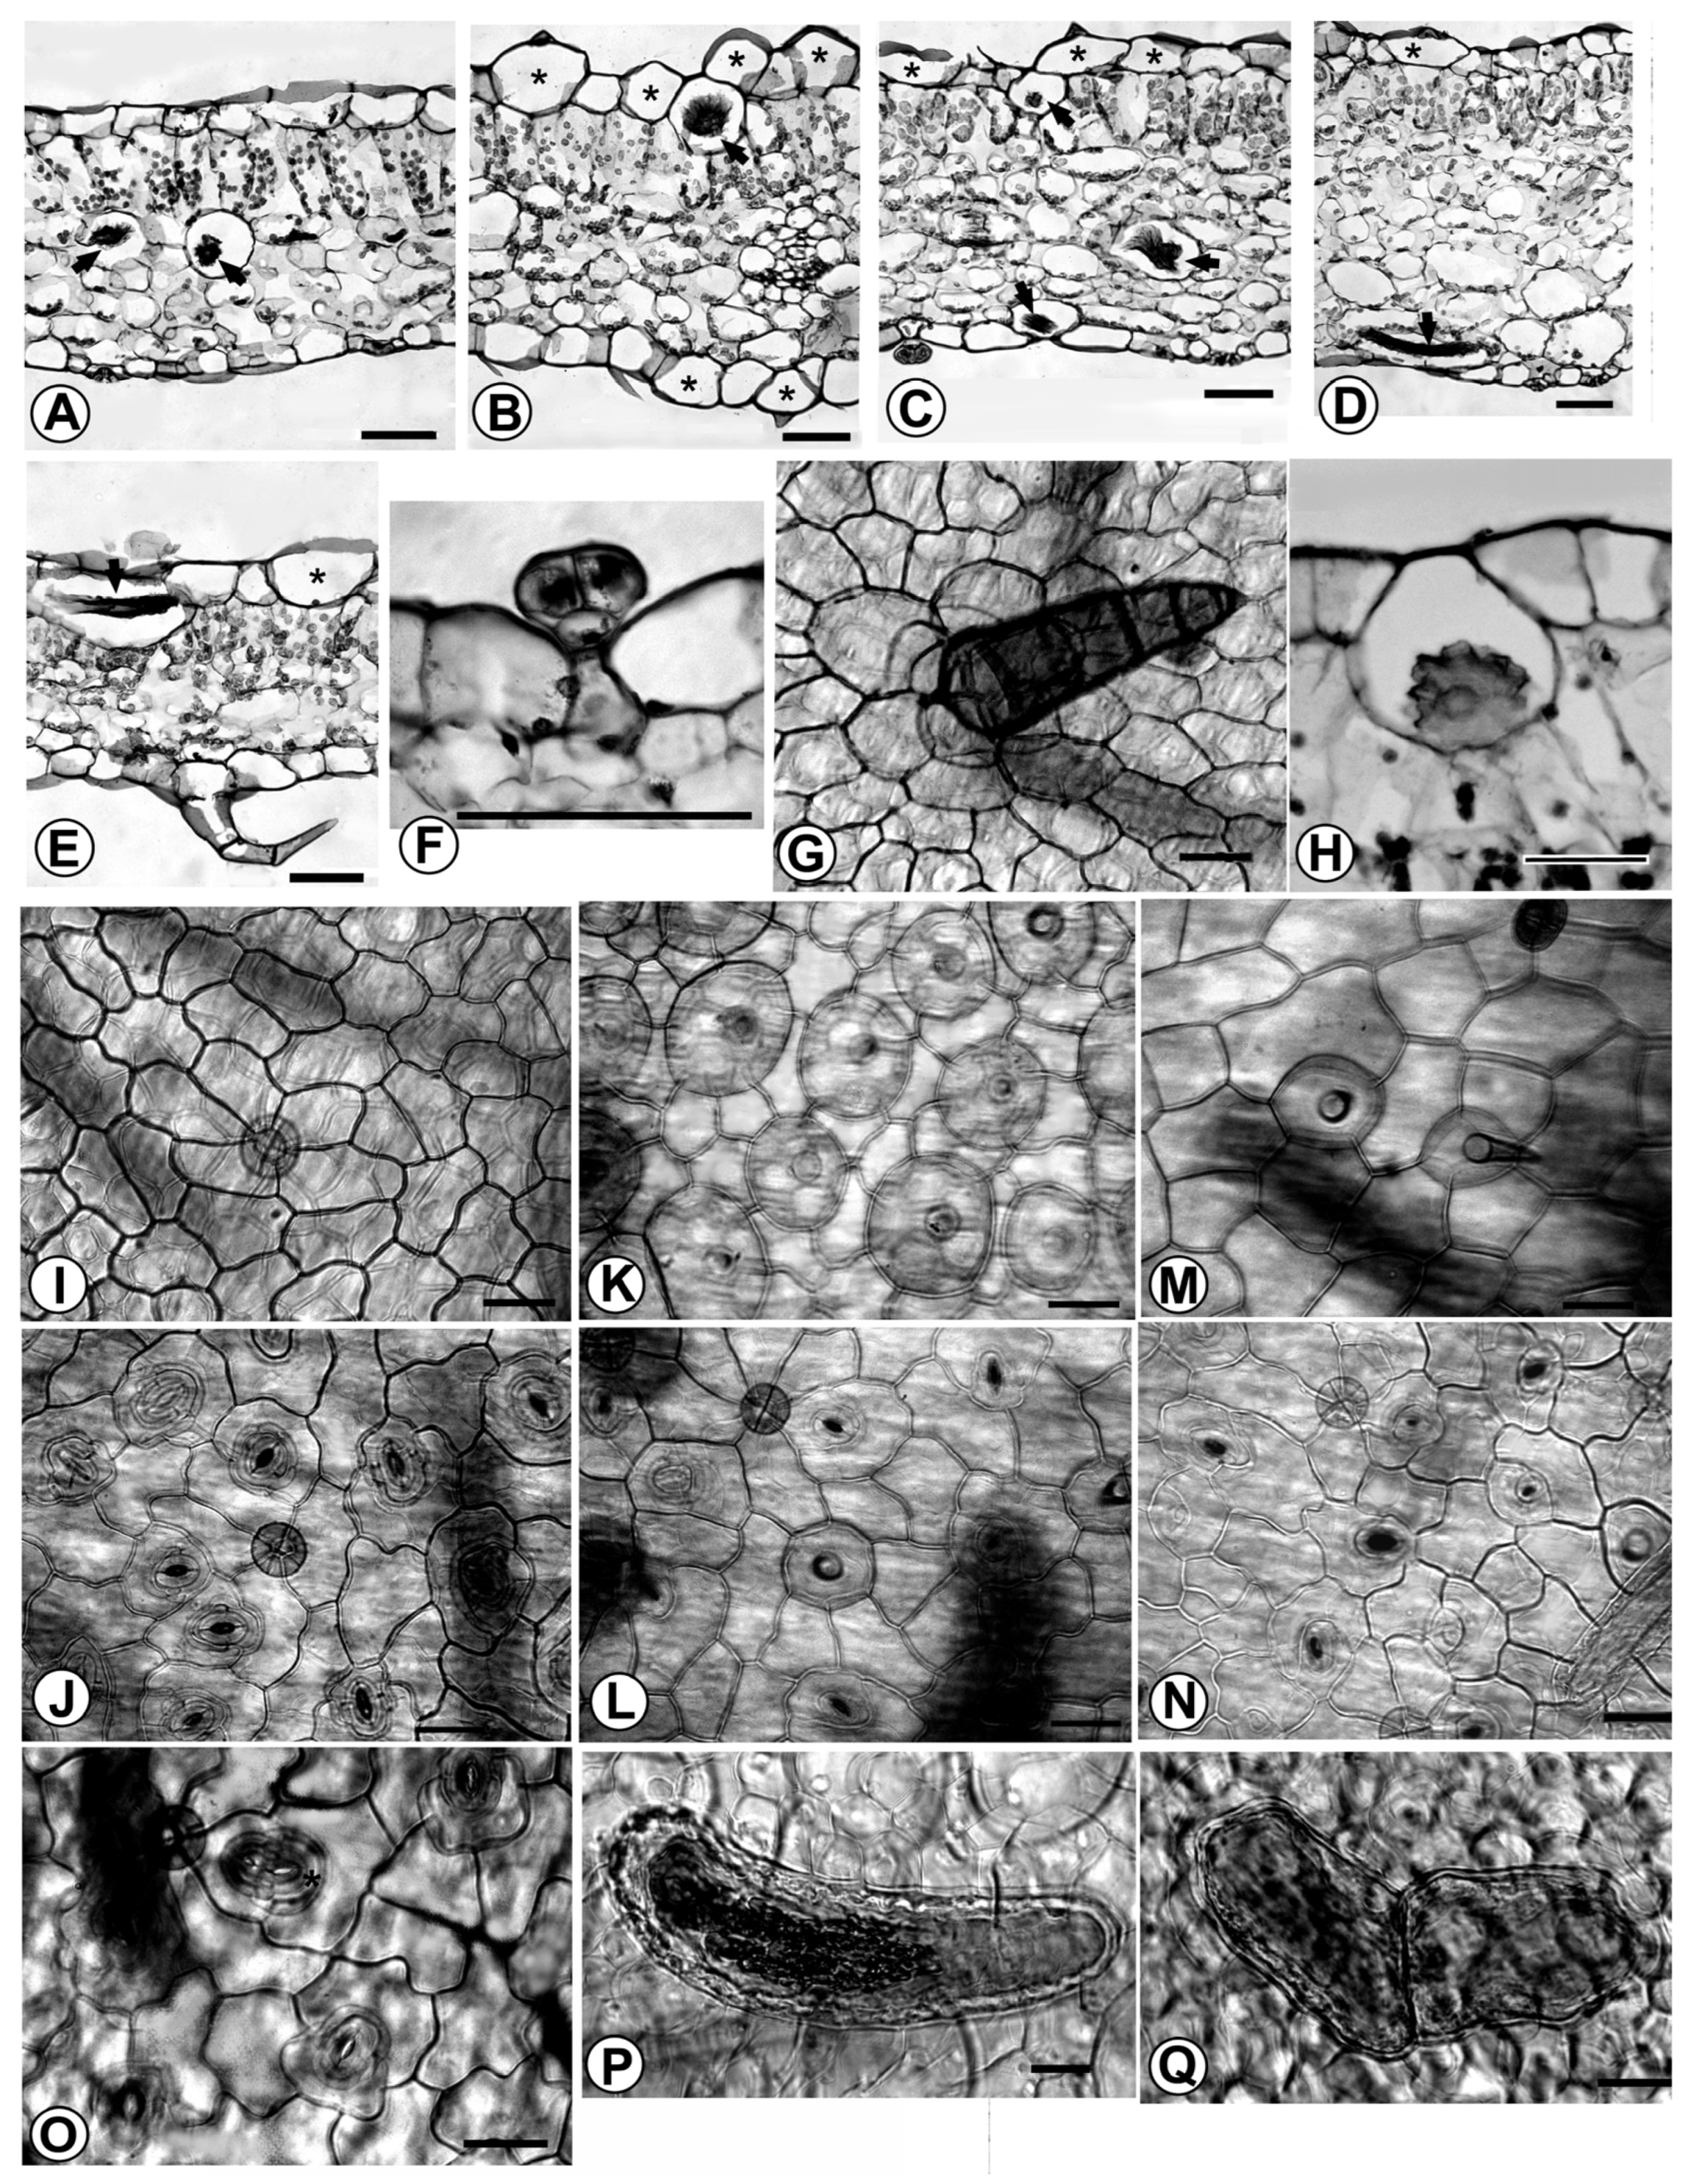
Leaf anatomical characters provided useful information for interpreting variation patterns at low taxonomic levels [24,25]. All Fittonia cultivars shared several features: leaves were typical C3 leaves with well-developed palisade and spongy mesophyll layers (Figure 3A–E).

3.2.2. Leaf Epidermis

The epidermis of all cultivars consisted of a single layer of thin-walled, irregularly shaped cells lacking chloroplasts, except in the guard cells (Figure 3A–E). Intercostal epidermal cells on both surfaces were irregularly polygonal, with straight to sinuous anticlinal walls (Figure 3I–N).
Marked variation in cuticular cell morphology was observed. ‘Titanic’ and ‘Angel Snow’ exhibited flat, irregular polygonal cuticle cells (Figure 3A,I,J). In contrast, the remaining cultivars possessed distinctive, large, globose bubble-like epidermal cells scattered among flat epidermal cells. These convex cells were either obtuse or bore a small beak composed of one to three stacked cells (Figure 3B–E,K–N). Bubble-like cells were primarily distributed on the adaxial epidermis, with only sparse occurrence on the abaxial surface (Figure 3L,N). However, in ‘Superba’, ‘Red Star’, and ‘Red Angel’, numerous bubble-like cells were also present on the abaxial epidermis.
Bubble-like cells ranged from 45.5 to 101.3 µm in diameter (Figure 3K). Their density on the adaxial surface varied widely among cultivars, typically from 50 to 90 cells mm−2. Extreme values included as few as 18 cells mm−2 in ‘Frankie’ and ‘Jacmita’ and as many as 114 cells mm−2 in ‘White Anne’.

3.2.3. Stomata

All stomata were of the diacytic type and were predominantly confined to the abaxial epidermis, with only occasional stomata on the adaxial surface. Stomatal size ranged from 12.2–23.3 to 23–30 µm (Figure 3J,L,M). Stomatal densities were highest in ‘Titanic’ (104 mm−2) and ‘Angel Snow’ (94 mm−2), whereas the remaining cultivars exhibited lower densities ranging from 45 to 87 mm−2 (Table S3).
Abnormal stomata were observed in ‘Frankie’, Red Anne’, ‘Red Vein’, ‘White Anne’, ‘Leather Leaf’, ‘Superba’, and ‘Jacmita’, including stomata with only one or poorly developed guard cells and occasional pairs of contiguous stomata joined at the polar ends (Figure 3O).

3.2.4. Trichomes

Four types of trichomes were identified. (1) Acicular hairs were uniseriate, multicellular, and nonsecretory (Figure 3E). They occurred mainly along the leaf margins and costal regions, and their bases consisted of one or two cells. (2) Capitate glandular hairs consisted of a two-celled stalk, a four- to eight-celled head, and a single-celled base (Figure 3F), and were distributed randomly on both leaf surfaces. (3) Coniform hairs were thick, multicellular, uniseriate structures, usually composed of four to six cells. They were highly lignified, ornamented with dense spines, and had a compound base attached to five to seven surrounding epidermal cells (Figure 3G). (4) Papillae or beak-like hairs consisted of one to three stacked cells and were restricted to the apex of bubble-like epidermal cells (Figure 3B–D,K–N); they were occasionally observed at the junctions between adjacent bubble cells. Capitate glandular hairs and acicular hairs were present in all cultivars. Coniform hairs were observed only in ‘Titanic’ and ‘Angel Snow’, whereas papillae or beak-like hairs occurred in all other cultivars but were absent from ‘Titanic’ and ‘Angel Snow’.

3.2.5. Cystoliths

Cystoliths were generally located in intercostal regions of the leaf. Their shapes varied from oval and oblong to curved, virgulate forms. In ‘Titanic’ and ‘Angel Snow’, most cystoliths were curved virgulate (Figure 3P). In the remaining cultivars, cystolith morphology was more variable. Double cystoliths were occasionally observed in ‘Red Vein’, ‘Red Angel’, ‘Leather Leaf’, ‘Jacmita’, ‘Superba’, ‘Black Star’, and ‘Frankie’ (Figure 3Q). In ‘Titanic’ and ‘Angel Snow’, cystoliths were restricted to the region between the palisade and spongy mesophyll layers (Figure 3A). In contrast, in the remaining cultivars, cystoliths were distributed between the palisade and spongy layers and also occurred in both epidermal layers (Figure 3B–E,H).

3.3. Leaf Architecture

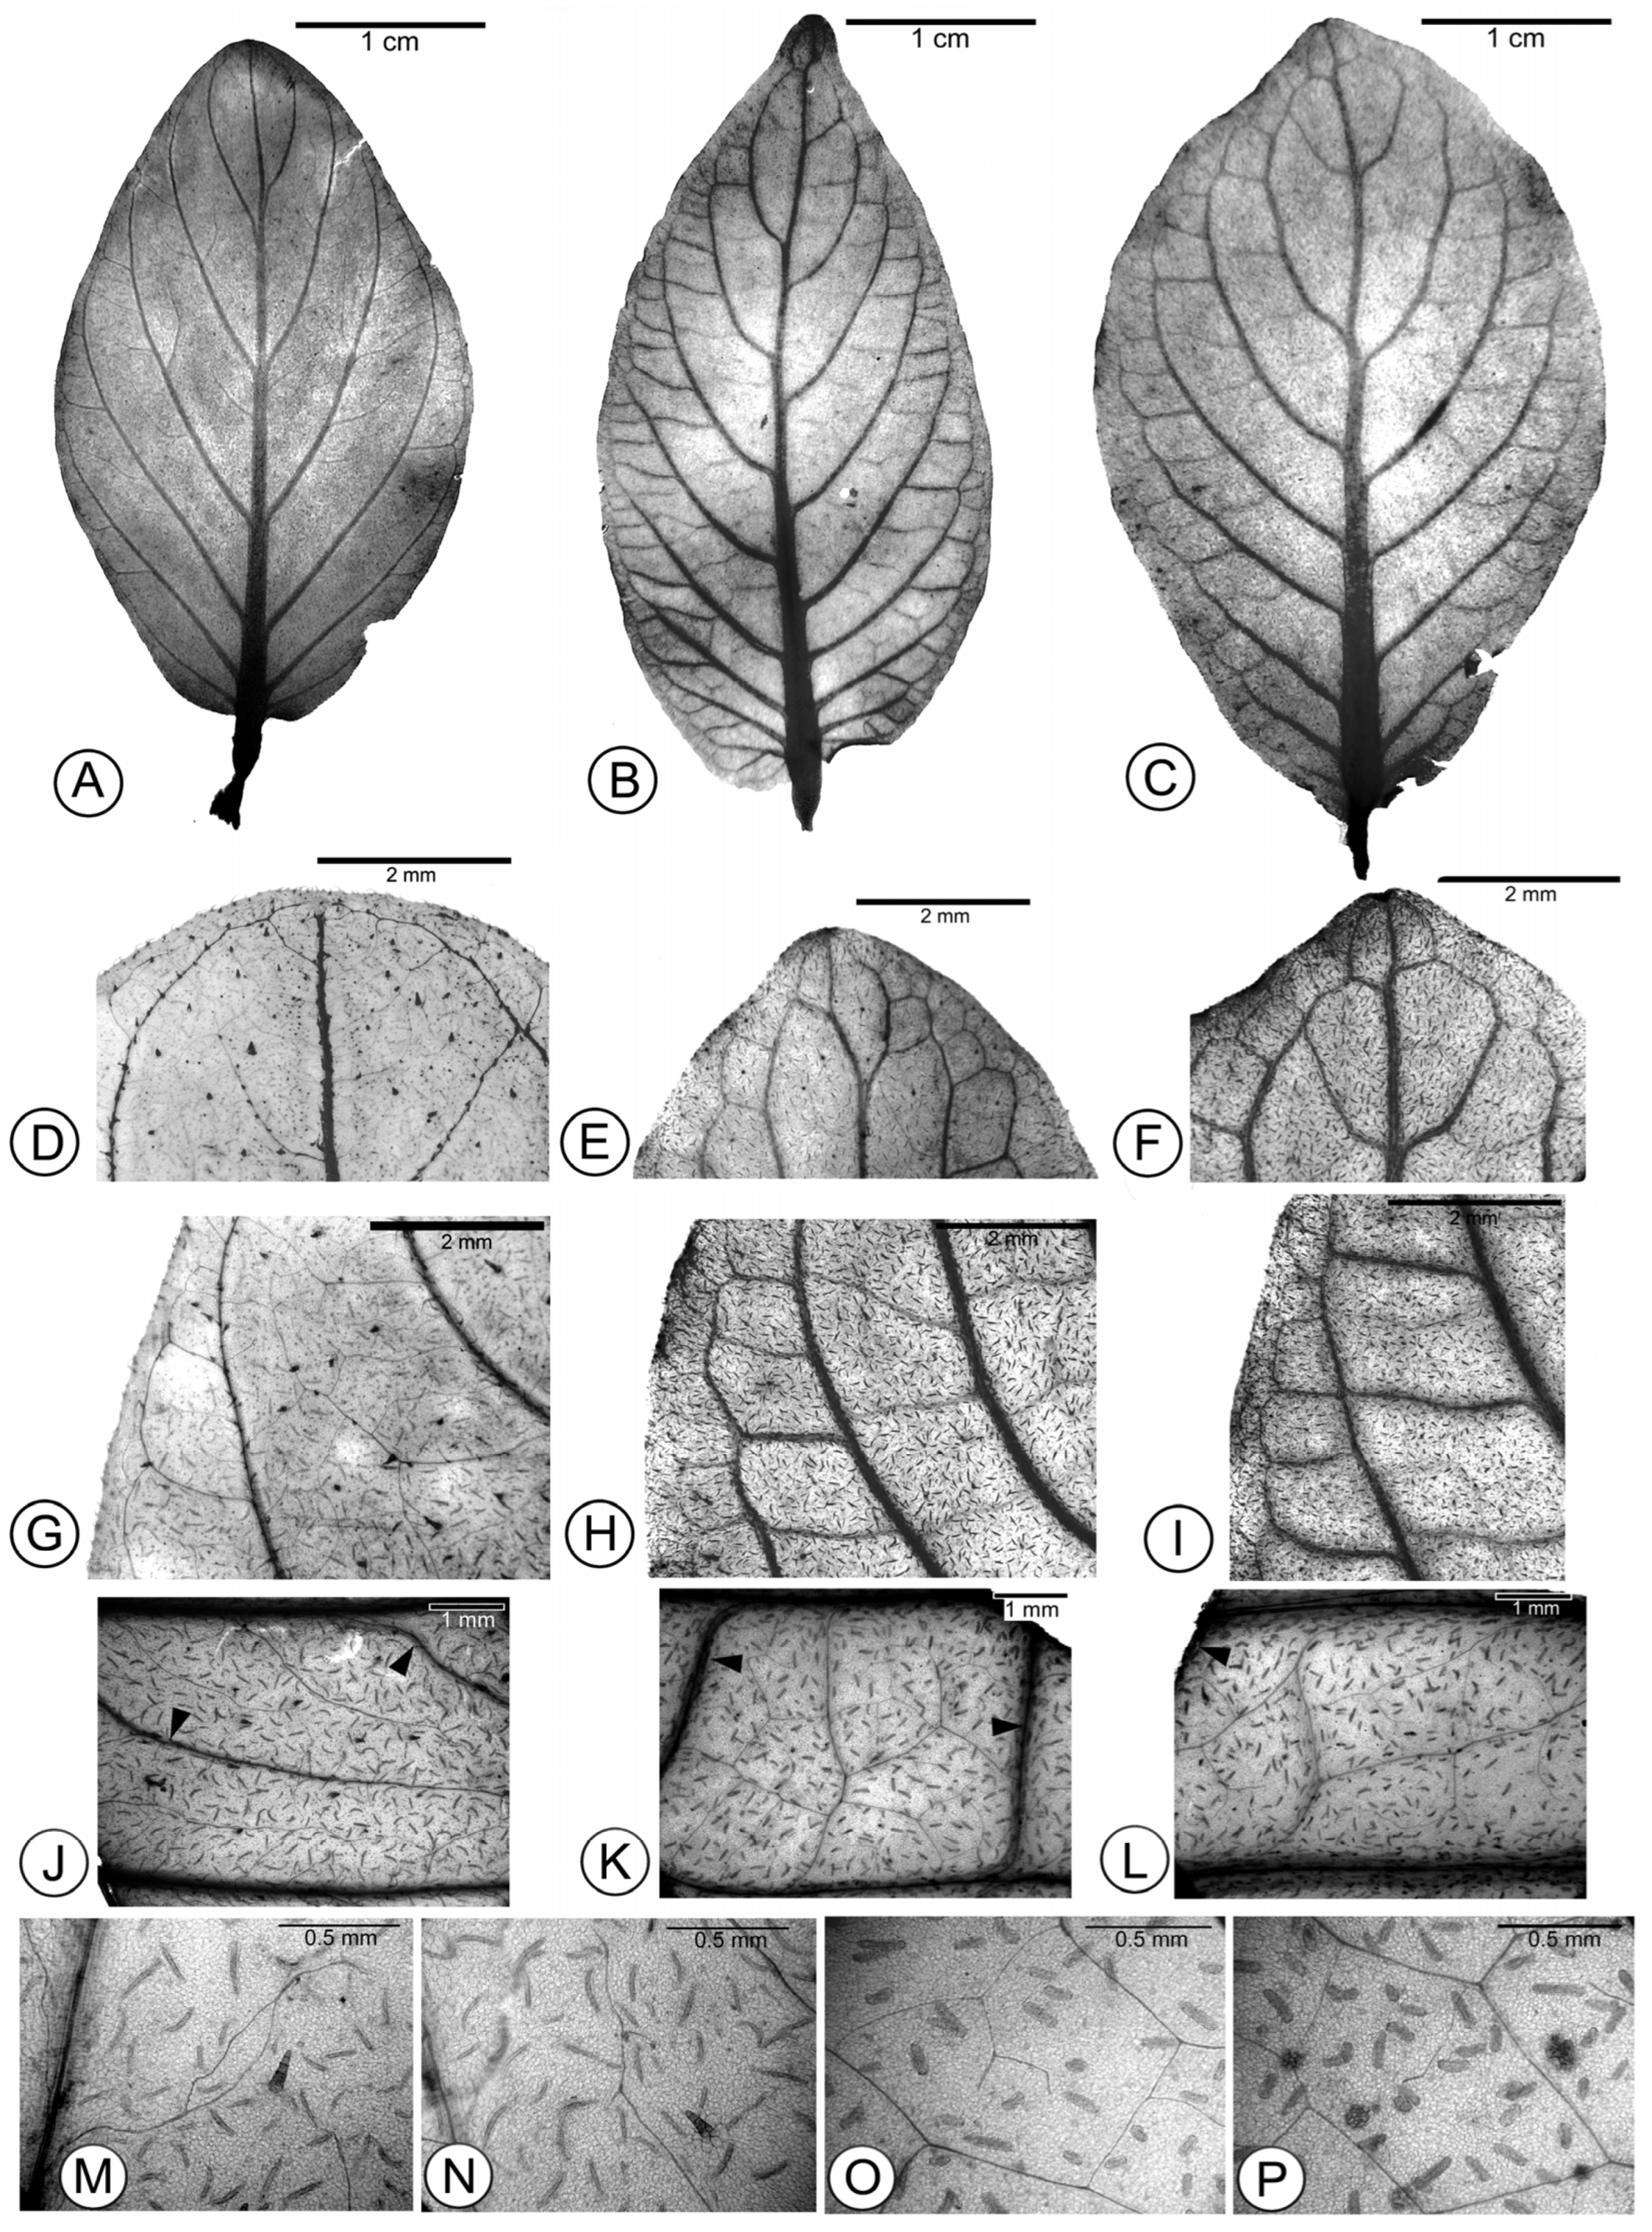
Leaves of Fittonia cultivars were decussate. Leaf shape was lanceolate, elliptic, or ovate (Figure 4A–C). Except for the rounded, convex leaf apex in ‘Titanic’ (Figure 4D) and ‘Angel Snow’, the leaf apex of the remaining cultivars was broadly acute with a shallow retuse (Figure 4D–F). The leaf base was shallowly cordate, truncate, or obtuse, and the leaf margin was entire or pleated.
Venation in Fittonia was pinnate eucamptodromous (Figure 4A–C,G–I). Secondary veins were usually alternate (Figure 4B,C) and rarely opposite (only in ‘Titanic’ [Figure 4A] and ‘Angel Snow’). Secondary vein spacing decreased toward the base or was irregular (Figure 4A–C).
In ‘Titanic’ and ‘Angel Snow’, tertiary veins were extremely slender and formed a random reticulate pattern toward the leaf margin. Tertiary veins rejoined other tertiary or secondary veins at variable angles. Their course and angle were highly variable and ramified (Figure 4G,J), resulting in absent or rare areolation (Figure 4M,N).
In contrast, the tertiary veins in the remaining Fittonia cultivars were prominent and crossed directly between adjacent secondary veins (Figure 4H,I), corresponding to the opposite percurrent type. The angles of the tertiary veins became increasingly obtuse away from the midrib (Figure 4B,C). Fourth-order veins branched freely and conformed to the dichotomizing type (Figure 4K,L). Due to the frequent presence of prominent tertiary veins, areolation was moderately developed (Figure 4K,L). Unbranched or once-branched freely ending ultimate veins (FEVs) were commonly observed in these cultivars, except in ‘Titanic’ and ‘Angel Snow’ (Figure 4O,P).

3.4. Stem and Petiole Anatomy

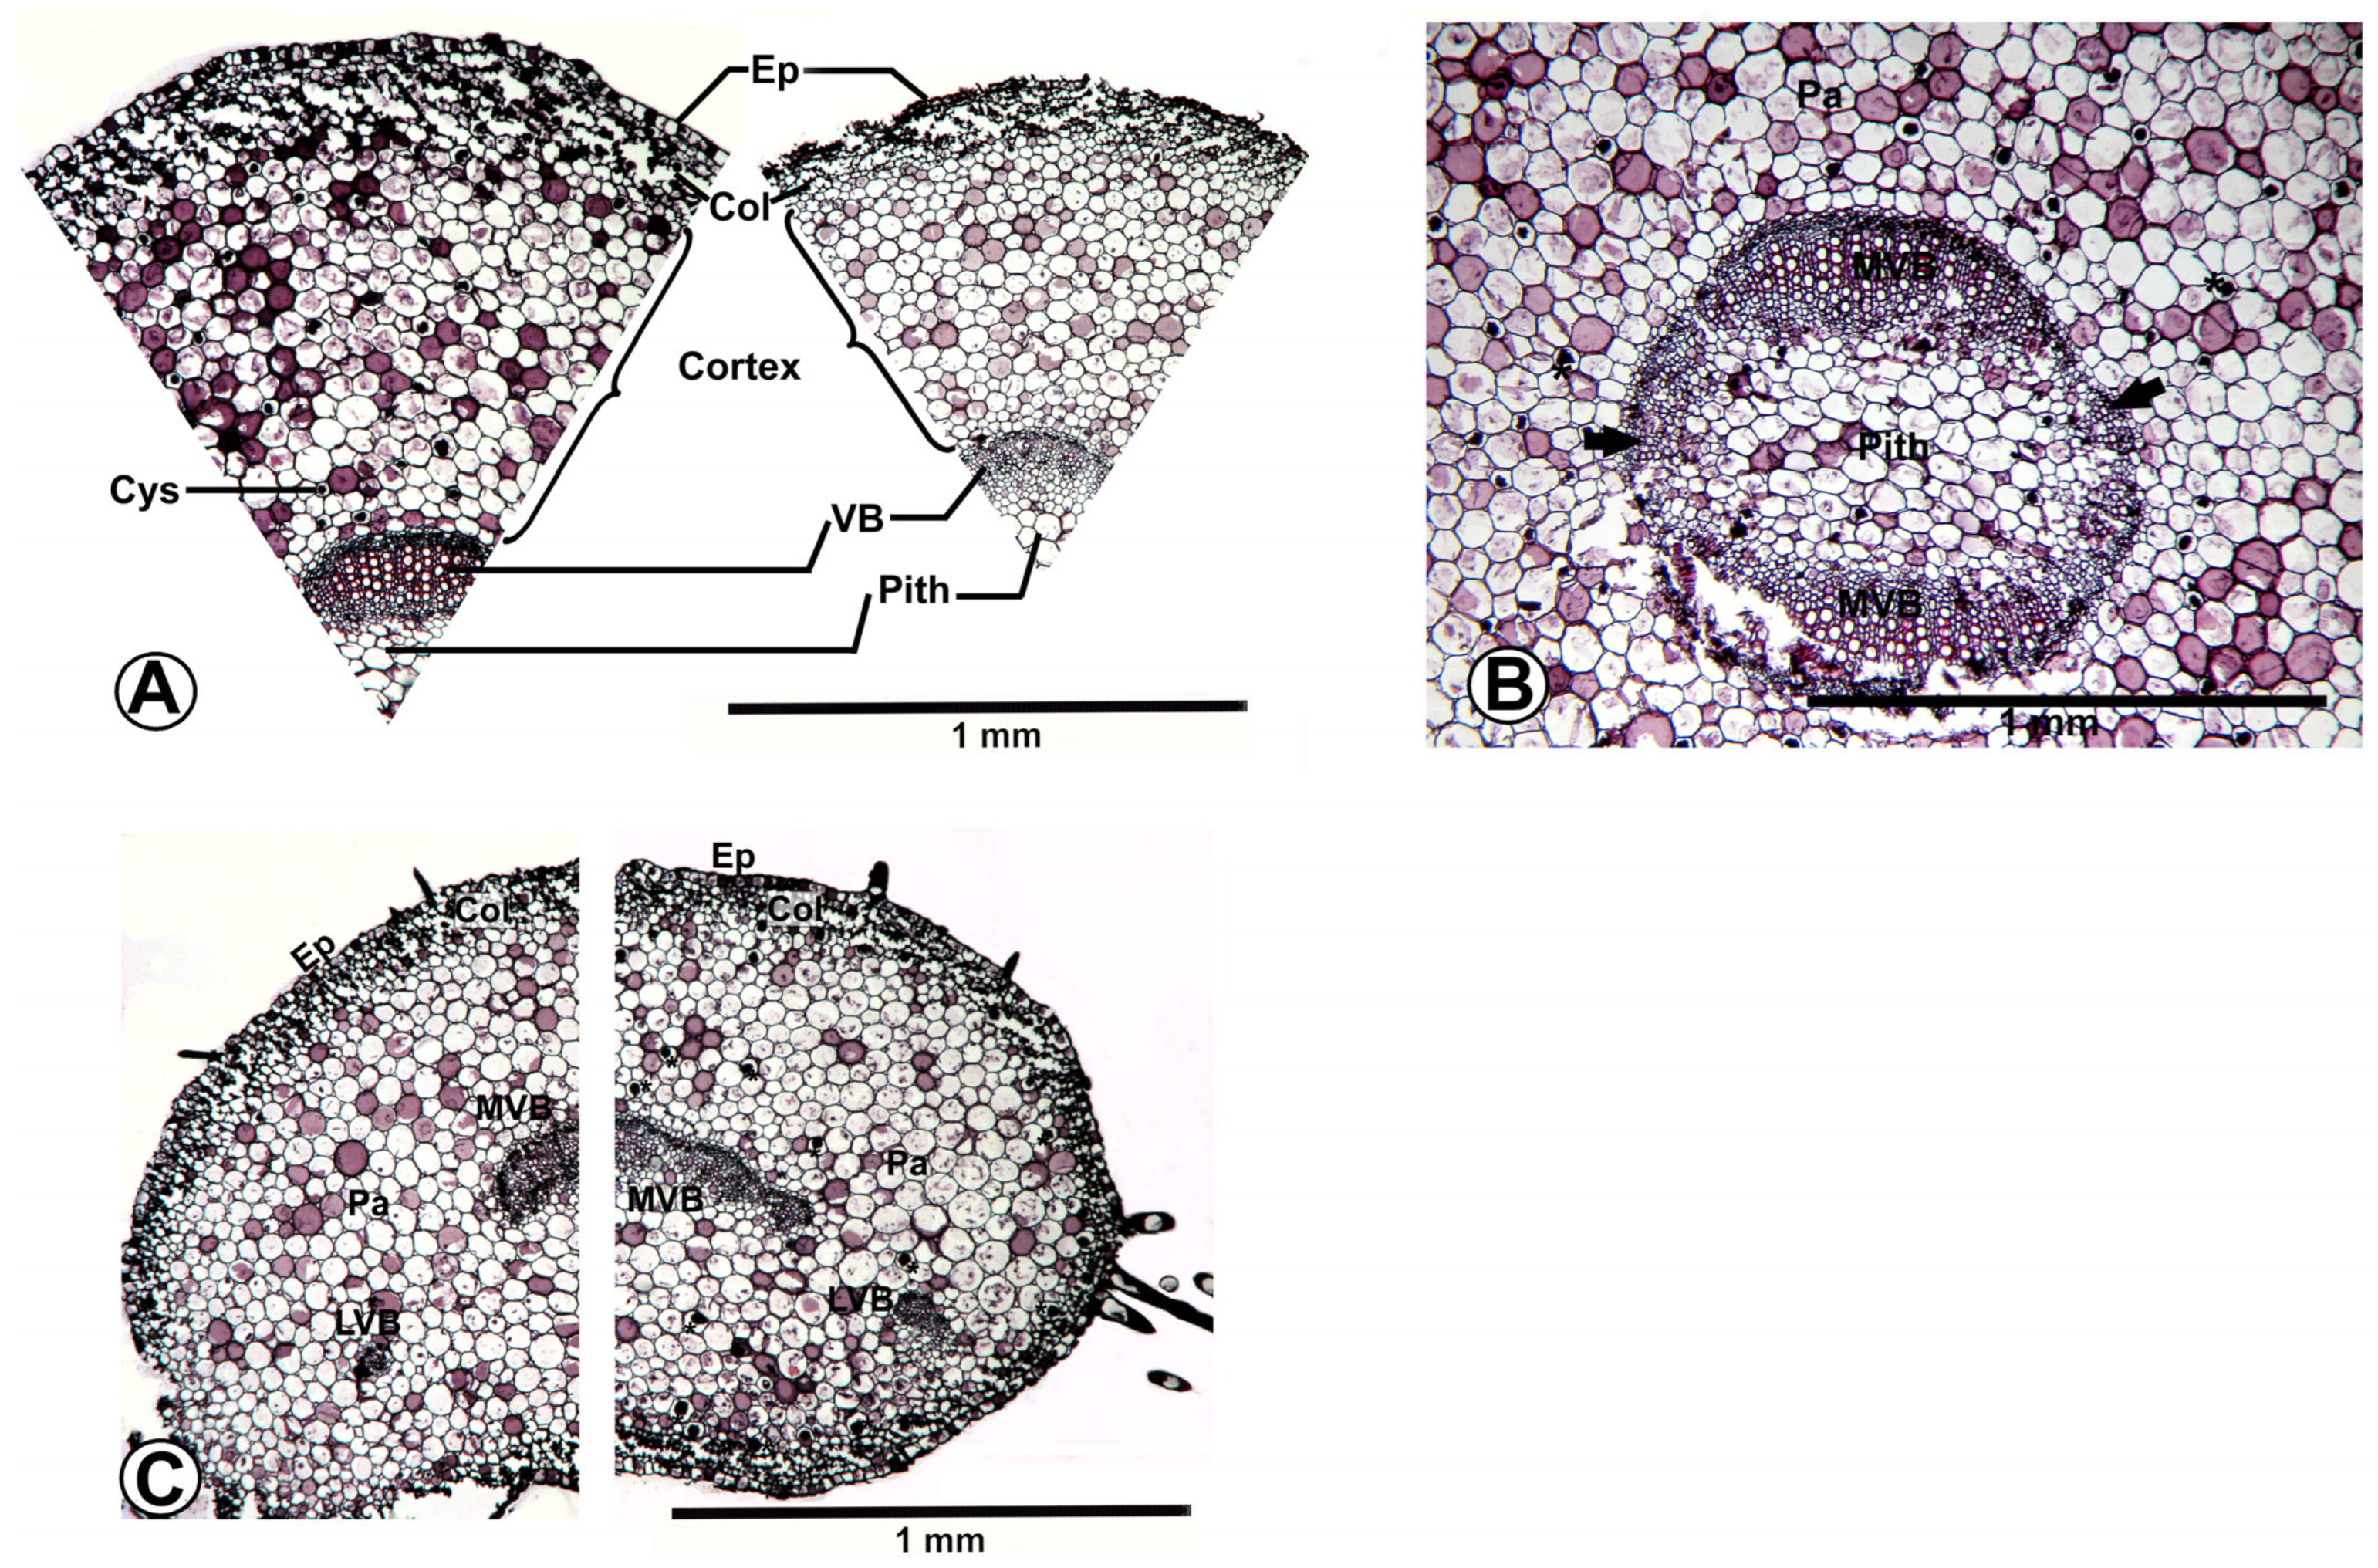
Stems of Fittonia were not typical dicotyledonous stems (Figure 5A). A layer of collenchyma was located immediately beneath the epidermis. Inside the collenchyma, a well-developed cortex occupied most of the stem. The vascular bundles formed a distinct ring surrounding a central pith (Figure 5A,B).
The arrangement of the vascular bundle ring showed some variation. In ‘Red Angel’, ‘Mini-Josan’, ‘Titanic’, and ‘Angel Snow’, the vascular bundle ring was polarized, with two main vascular bundles formed oppositely and poorly developed vascular bundles in other parts of the ring. In large-leaved cultivars (e.g., Red Vein’, ‘Red Anne’, ‘White Anne’, ‘Superba’, and ‘Leather Leaf’), vascular bundles were well developed throughout the ring. Another notable feature was the distribution of cystoliths in the stem. Cystoliths were commonly observed in cultivated Fittonia, except in ‘Titanic’ and ‘Angel Snow’ (Figure 5C).

3.5. Diagnostic Morphological Characters Used in Traditional Taxonomy

The shape and size of inflorescence bracteoles, leaf venation color, petiole length, and plant habit are commonly used diagnostic characters in the taxonomy of Fittonia. Bracteoles were generally roundish, ovate, or oblong-ovate, except in ‘Angel Snow’, in which they were lanceolate. Inflorescences were not observed in ‘Titanic’ in this study. Bracteole size varied from 7 to 11 mm in length and 5 to 9 mm in width. Petiole length ranged from 0.5 to 6.2 cm, and leaf blade size ranged from 1.4 to 4.8 cm in width and 2.5 to 8.5 cm in length. Variation in bracteole size, petiole length, and leaf blade size was continuous among cultivars, without clear discontinuities.
Venation color and leaf margin type showed marked diversification. Red venation occurred in ‘Red Angel’, ‘Red Star’, ‘Red Anne’, ‘Leather Leaf’, and ‘Black Star’; white venation in ‘Titanic’, ‘Angel Snow’, ‘White Anne’, and ‘Superba’; and pink venation in ‘Frankie’, ‘Mini-Josan’, and ‘Jacmita’. Flat leaf margins occurred in ‘Titanic’, ‘Angel Snow’, ‘Red Angel’, and ‘Mini-Josan’, whereas pleated margins were typical of ‘Frankie’, ‘Red Anne’, and ‘White Anne’. Both venation color and leaf margin type were biform in ‘Red Anne’, ‘Red Star’, ‘White Anne’, and ‘Superba’. All anatomical features and traditional morphological diagnostic characters are summarized in Table S3.

3.6. Evolutionary Pattern of Morphological Traits

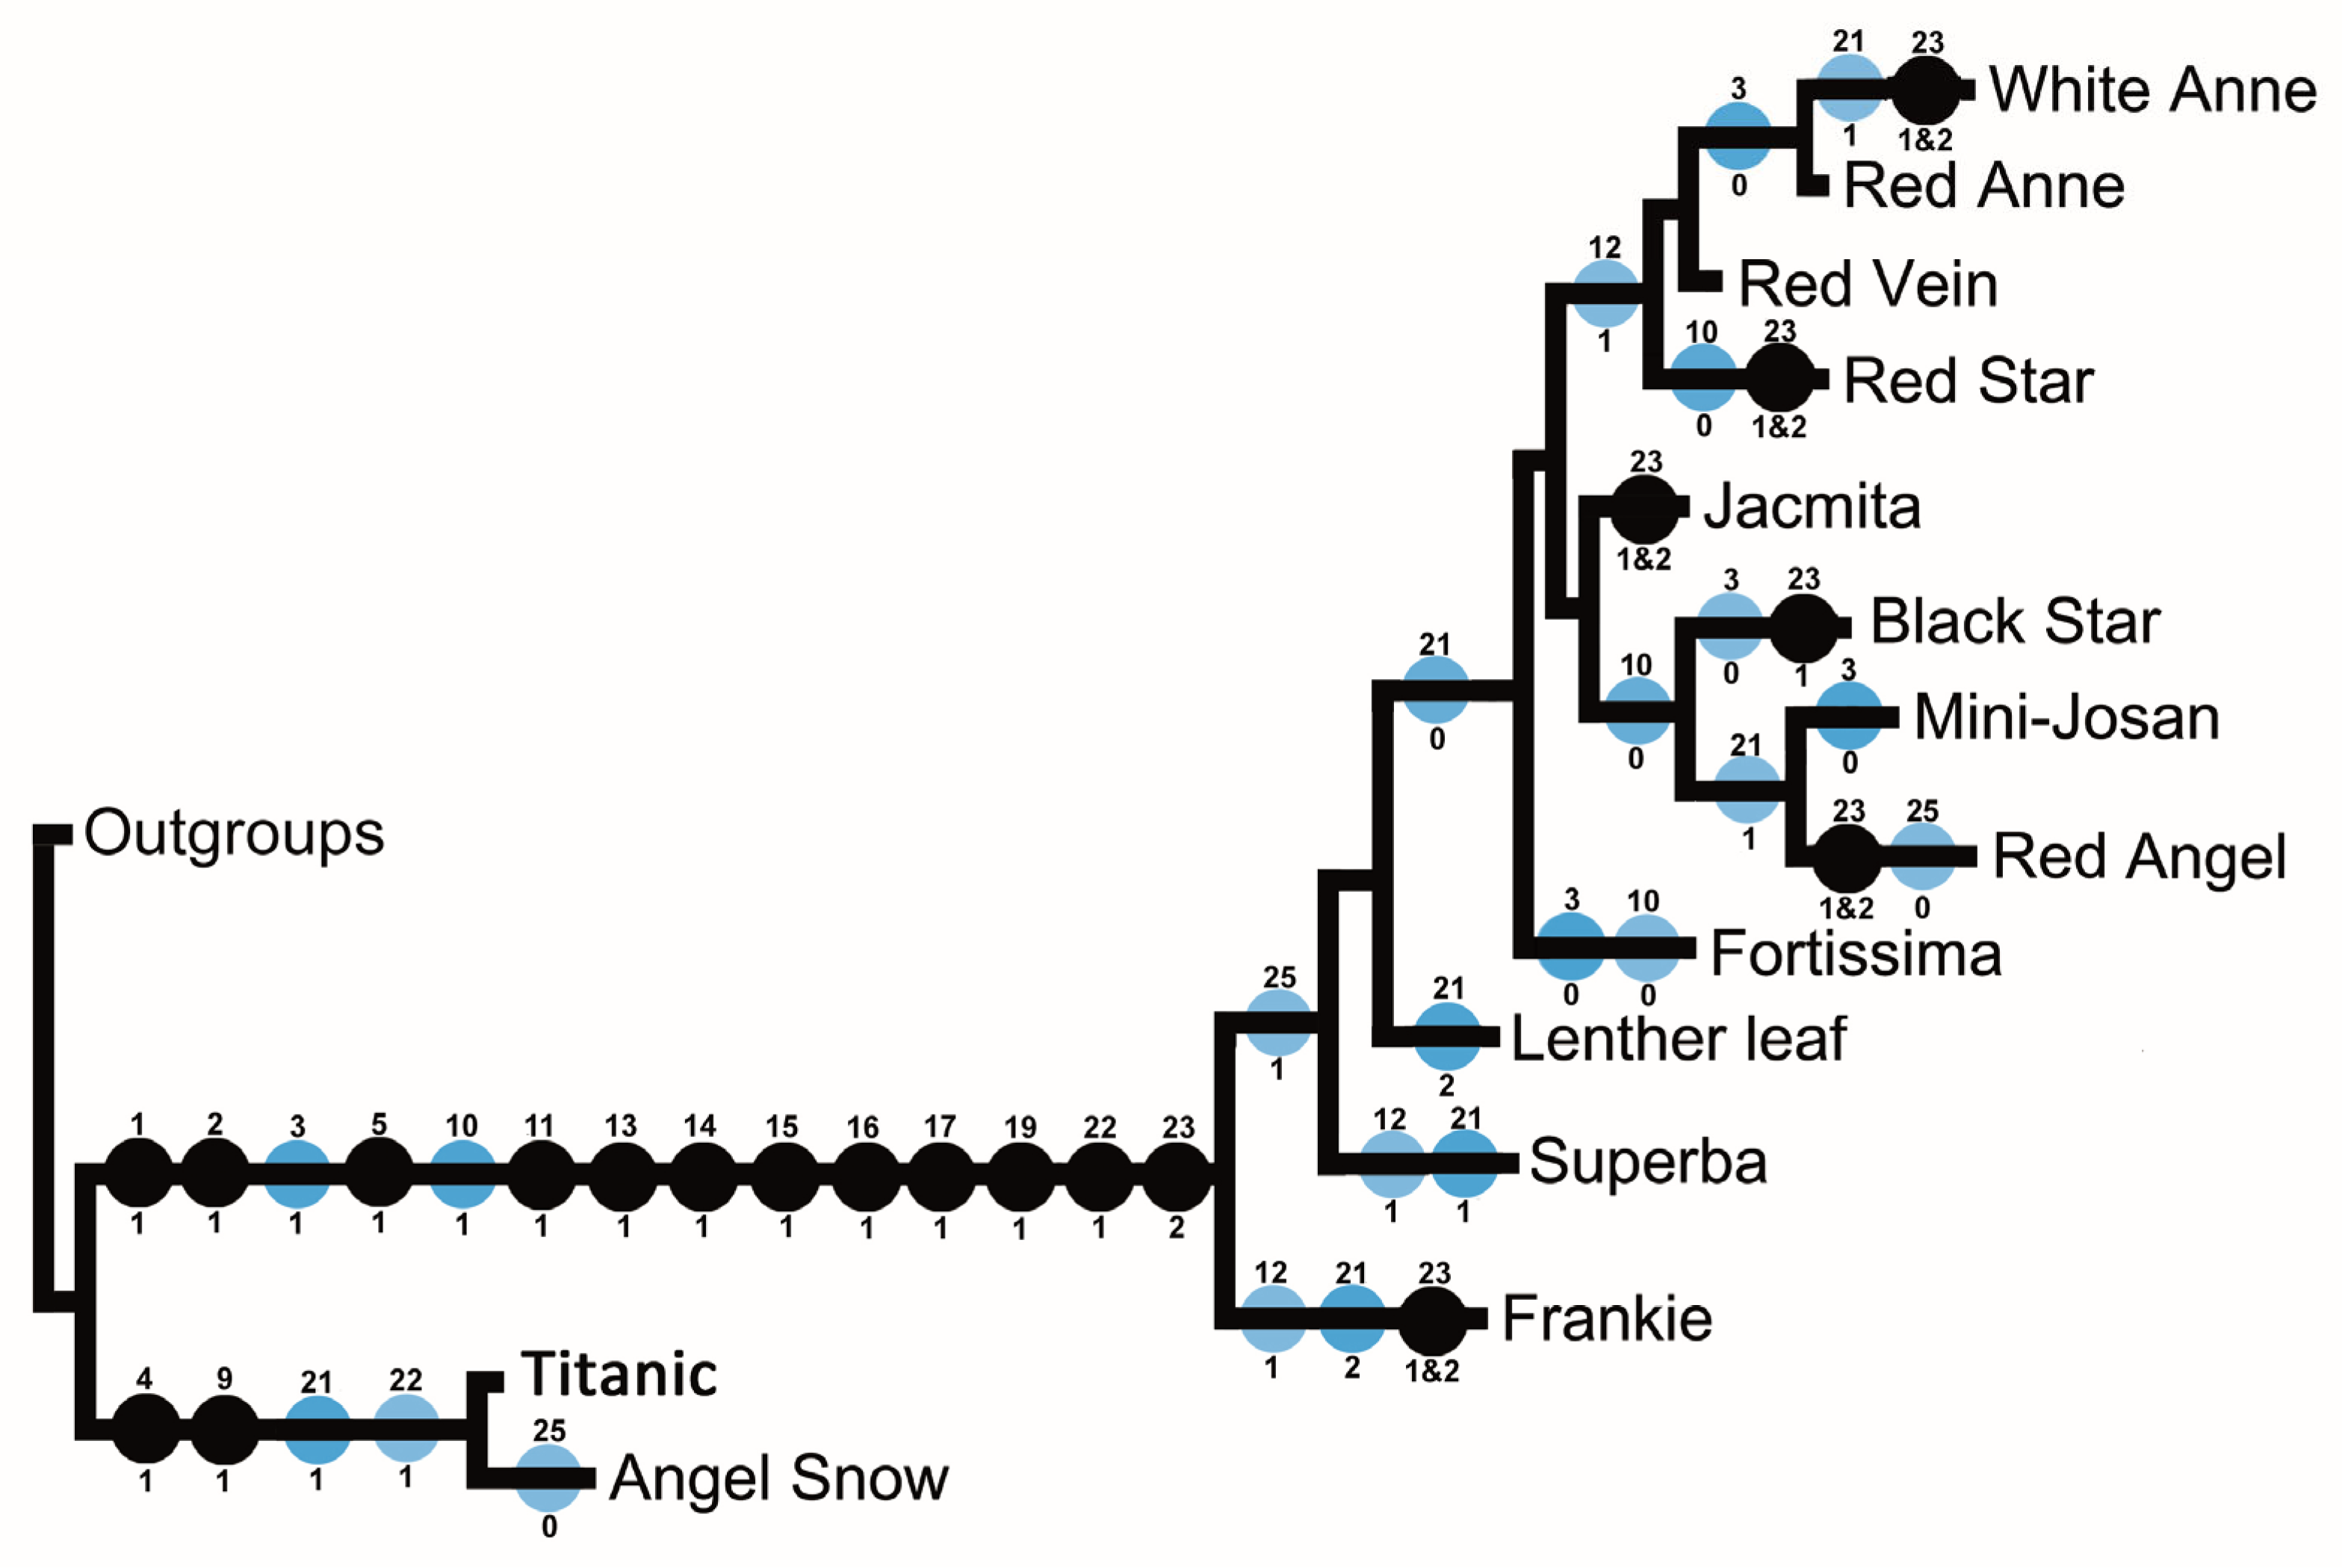
We compared 25 characters (Table S3) among 14 cultivated Fittonia cultivars. Features invariant across Acanthaceae and fragmented characters were excluded. Twenty characters were amenable to character-state delimitation and were mapped onto the AFLP and MSAP clustering tree using parsimony criteria (Figure 6). A total of 68 steps were required. Putative synapomorphies for Clade I (‘Titanic’ + ‘Angel Snow’) included characters 4 and 9: coniform hairs and high stomatal density. Eleven anatomical characters (1, 2, 5, 11, 13, 14, 15, 16, 17, 19, and 22) and one macromorphological character (23, plant shape) were consistent features associated with Clade II (the remaining 12 cultivars). Characters 3 and 10 (presence of double cystoliths and contiguous stomata), as well as traditional taxonomic characters 12, 21, 22, 23, and 25 (leaf margin, leaf venation color, petiole length, and bracteole size), were homoplastic.

4. Discussion

Fittonia has gained substantial horticultural importance because of its attractive foliar variegation, ease of propagation, and adaptability to interior environments [4,31]. Yet, despite its commercial prominence, the systematic relationships among cultivated forms have remained poorly resolved. The principal obstacle has been the long-standing reliance on conspicuous ornamental traits, such as leaf vein color, leaf size, and petiole length, which are likely evolutionarily labile and subject to repeated selection. Our results show that this reliance has obscured a deeper and more biologically meaningful pattern of differentiation within cultivated Fittonia.
A central outcome of this study is the consistent recovery of two strongly supported clusters among the 14 cultivars examined: Clade I, comprising ‘Titanic’ and ‘Angel Snow’, and Clade II, comprising the remaining 12 cultivars. The substantial AFLP band divergence between these clades indicates broad genomic differentiation, while the corresponding separation in MSAP profiles suggests that lineage divergence also extends to epigenetic patterning. Taken together, these data indicate that cultivated Fittonia does not constitute a single homogeneous gene pool but rather comprises two well-differentiated clusters.
Although the use of AFLP in phylogenetic inference has been debated due to potential issues of homology and homoplasy, AFLP remains highly informative for closely related taxa, recent radiation, and species complexes when large numbers of fragments are analyzed [32,33,34]. In the present study, the large number of fragments generated and the strong congruence between AFLP and MSAP topologies increase confidence that the observed pattern reflects genuine genetic and epigenetic differentiation rather than analytical artifact. More importantly, the molecular groupings are independently corroborated by a suite of stable anatomical characters, which provides a mechanistic bridge between genomic divergence and phenotype.
The anatomical differences between the two clades are not superficial. Clade I is characterized by flat cuticle cells, restricted cystolith distribution between palisade and spongy mesophyll, coniform hairs, decreasing secondary vein spacing toward the leaf base, slender, randomly reticulate tertiary veins near the margin, poorly developed or absent areolation, and absence of stem cystoliths. In contrast, Clade II possesses bubble-like epidermal cells, a broader distribution of cystoliths in leaves, papillae or beak-shaped hairs, irregular spacing of secondary veins toward the leaf base, prominent tertiary veins that cross directly between adjacent secondary veins, more developed areolation, and scattered stem cystoliths. These characters involve epidermal differentiation, mineral body deposition, trichome ontogeny, and venation architecture, all of which are developmentally integrated aspects of leaf and stem construction. Because such traits arise through coordinated developmental programs rather than simple surface variation, their concordance with the molecular clusters suggests that the observed group reflects stable biological differentiation rather than environmentally induced phenotypic plasticity alone.
This point is important for interpreting taxonomic patterns. Traditional classifications in Fittonia emphasize leaf venation color, petiole length, blade size, and bracteole dimensions. Our character-mapping analysis shows that these conspicuous features are homoplastic, paraphyletic, or continuously varying. Mechanistically, that pattern is plausible: venation color and foliage variegation are likely controlled by relatively few regulatory pathways affecting pigment accumulation, chlorophyll distribution, or epidermal visibility of vascular tissues, and such pathways can evolve repeatedly or be strongly modified by horticultural selection. Similarly, organ size traits such as leaf dimensions and petiole length are quantitative and developmentally plastic, making them especially vulnerable to convergence under cultivation. In contrast, micromorphological and architectural traits, including trichome morphology and tertiary venation pattern, areolation, and cystolith placement, appear to be more developmentally canalized and therefore more reliable indicators of shared ancestry.
The results also clarify why previous taxonomic treatments have been difficult to reconcile. Brummitt’s [3] separation of the “Argyroneura” and “Verschaffeltii” groups was largely based on venation color, but our data show that venation color cuts across deeper lineage structure. Likewise, Ahmad’s [9] report that bubble-like epidermal cells were restricted to var. pearsei conflicts with our observation that this feature is shared across all examined members of Clade II despite wide variation in vein coloration. This suggests that earlier taxonomies may have grouped cultivars by conspicuous ornamental phenotype while overlooking anatomically conserved characters that better reflect evolutionary relationships.
At the same time, our data do not allow unequivocal assignment of the two clusters to currently recognized species, particularly given that our sampling is restricted to cultivated materials. This is not because the clades are weakly differentiated, but because the historical species circumscriptions themselves appear unstable and partly inconsistent with the character combinations observed here. ‘Titanic’ and ‘Angel Snow’ share some traits with descriptions of F. gigantea or var. argyroneura, whereas Clade II shares certain features with concepts associated with var. pearsei or verschaffeltii. However, none of these matches is complete. For example, the previously reported triploid chromosome number for ‘Pearcei’ conflicts with the universal diploidy observed in the present study, and reported trichome characters do not fully align with our results. These inconsistencies suggest that the current nomenclatural framework may be based on taxonomic entities that were incompletely circumscribed, horticulturally mixed, or historically interpreted through different sets of characters.
The cytological results help refine this interpretation. All 14 cultivars were diploid (2n = 36) and had relatively similar genome sizes, indicating that the two clades are not separated by gross ploidy differences or major genome expansion. This suggests that the divergence between clades is more likely attributable to structural genomic differentiation, allelic divergence, and regulatory change than to polyploidization. The relatively narrow range of genome size also supports the view that cultivated Fittonia has a constrained genomic background despite considerable visible phenotypic diversity.
That contrast between limited cytological variation and pronounced foliar diversity is particularly noteworthy. One explanation is that a substantial proportion of cultivar differentiation is driven by relatively small genomic changes that disproportionately affect visible leaf traits. AFLP indicates appreciable DNA-level variation, whereas MSAP profiles point to differences in methylation status among cultivars and between clades. Because DNA methylation can alter gene expression without altering coding sequences, epigenetic divergence provides a plausible mechanistic basis for the observed diversification patterns in vein pigmentation, variegation, leaf texture, and related ornamental traits. Transposable element dynamics may further contribute to this process by generating both sequence polymorphism and methylation-associated regulatory variation. In a clonally propagated ornamental genus such as Fittonia, where sports and somatic variants can be fixed and maintained, these mechanisms could readily produce substantial phenotypic diversification from a relatively narrow underlying genome pool.
The combination of narrow genome size variation, universal diploidy, substantial AFLP, and clade-associated MSAP patterns therefore suggests a hierarchical model of divergence in cultivated Fittonia. At one level, two distinct diploid clusters are present, reflected in stable microanatomical and architectural characters. At another level, within-lineage diversification in ornamental phenotype appears to be amplified by smaller-scale genomic and epigenetic variation, likely reinforced through clonal propagation and horticultural selection. This model explains why cultivated Fittonia can display marked differences in leaf coloration, margin type, and variegation while retaining relatively limited cytological divergence.
Overall, our findings indicate that the current taxonomy of Fittonia does not adequately capture the biological structure of cultivated material. The two clusters recovered here represent consistently supported patterns of differentiation. Yet, their relationship to named taxa remains unresolved because traditional classifications rely heavily on characters that do not track lineage history. Resolving this problem will require direct comparison with herbarium specimens, original descriptions, and—most critically—sampling of wild populations across the native range. Only then will it be possible to determine whether the cultivated clades correspond to existing species, infraspecific taxa, previously overlooked lineages, or horticultural derivatives of more complex ancestry.

5. Conclusions

This study provides integrative evidence that cultivated Fittonia comprises two distinct and well-supported diploid clusters rather than a single morphologically variable taxon. AFLP and MSAP analyses consistently separated ‘Titanic’ + ‘Angel Snow’ from the other 12 cultivars, and this molecular and epigenetic divergence was mirrored by stable differences in leaf and stem anatomy. The congruence among genomic, epigenetic, anatomical, and cytological datasets indicates that the observed clusters reflect consistent underlying differentiation rather than superficial horticultural variation.
Our results also show that many of the characters historically used to classify Fittonia, including leaf venation color, petiole length, and bracteole size, are homoplastic, continuously varying, or strongly influenced by parallel selection on ornamental phenotype. In contrast, less conspicuous but more developmentally integrated traits, such as trichome morphology, cystolith distribution, tertiary venation architecture, areolation, and growth habit, appear to provide a more reliable basis for taxonomic interpretation. Mechanistically, these traits likely reflect conserved developmental programs and therefore track shared ancestry more faithfully than highly selectable pigmentation and size-related characters.
All cultivars examined were diploid and exhibited only limited variation in genome size, indicating that major cytological shifts have not been the primary driver of diversification in cultivated Fittonia. Instead, the pronounced foliar diversity observed among cultivars likely results from a combination of modest genomic divergence and regulatory variation, with DNA methylation potentially playing an important role in generating or stabilizing ornamental phenotypes. In a clonally propagated crop, such epigenetic and developmental variation could be readily captured and maintained through horticultural selection.
Although the two clusters identified here are clearly distinct, they cannot yet be assigned with confidence to any currently recognized species within Fittonia. This inability reflects not weak evidence, but rather instability in the existing taxonomy itself. Future work should integrate wild and cultivated sampling, herbarium-based taxonomic reassessment, and additional molecular datasets to determine how these cultivated lineages relate to named species and to revise species boundaries within the genus on a more robust systematic basis.

Supplementary Materials

The following supporting information can be downloaded at: https://www.mdpi.com/article/10.3390/plants15091391/s1, Table S1. Plant materials used in AFLP, MSAP, cytological, and leaf anatomical analyses. The vouchers were kept in FLAS. Table S2. The sequences of adapters used for AFLP and MSAP analyses. Table S3. Comparison of Leaf anatomical features and traditional taxonomy features of Fittonia cultivars (the character status was scored for AFLP cladogram-based character mapping). Figure S1. DNA-methylation profiles using the primer combination of H/M-AAC + E-AAC.

Author Contributions

M.D. and J.C. conceptualized the research. J.C. obtained the plant materials and provided laboratory support. M.D. and Q.L. conducted the experiments. M.D. performed the data analyses and prepared the manuscript. All authors have read and agreed to the published version of the manuscript.

Funding

This research received no external funding.

Data Availability Statement

All data generated or analyzed during this study are included in this published article.

Acknowledgments

We are grateful to Hermann Engelmann Greenhouses, Inc., in Apopka, Florida, for providing the Fittonia materials used in this study. This study was partially supported by the Florida Experiment Station hatch fund.

Conflicts of Interest

The authors declare that they have no known competing financial interests or personal relationships that could have appeared to influence the work reported in this paper.

References

  1. DeWolf, G.P. The genus Fittonia (Acanthaceae). Baileya 1970, 17, 34–37. [Google Scholar]
  2. Brummitt, R.K. Proposal (447) to conserve the name 8069 Fittonia Coemans over Adelaster Lindley ex Veitch (Acanthaceae). Taxon 1978, 27, 307–309. [Google Scholar] [CrossRef]
  3. Brummitt, R.K. Fittonia albivenis. Bot. Mag. 1980, 182, 156–168. [Google Scholar]
  4. Chen, J.; McConnell, D.B.; Norman, D.J.; Henny, R.J. The foliage plant industry. Hortic. Rev. 2005, 31, 45–110. [Google Scholar]
  5. Li, X.; Huang, G.; Zhu, L.; Hao, C.; Sui, S.F.; Qin, X. Structure of the red-shifted Fittonia albivenis photosystem I. Nat. Commun. 2024, 15, 6325. [Google Scholar] [CrossRef] [PubMed]
  6. Hao, C.; Zhu, L.; Li, X.; Wang, L.; Song, J.; Zhao, X.Q. Utilising far-red light: Photosynthetic and physiological adaptations in shade-tolerant Fittonia albivenis. Plant Cell Environ. 2025, 48, 8161–8176. [Google Scholar] [CrossRef] [PubMed]
  7. Wang, L.; Jia, K.H.; Zhang, R.G.; Hao, C.; Qin, X. A nearly complete haplotype-phased genome assembly of nerve plant (Fittonia albivenis) provides insights into leaf color evolution. Hortic. Res. 2025, 12, uhaf154. [Google Scholar] [CrossRef]
  8. Bailey, L.H.; Bailey, E.Z. Hortus Third: A Concise Dictionary of Plants Cultivated in the United States and Canada; Macmillan Publishing Co., Inc.: New York, NY, USA, 1976; p. 480. [Google Scholar]
  9. Ahmad, K.J. Epidermal studies in Fittonia (Acanthaceae). Feddes Repert. 1978, 89, 369–374. [Google Scholar] [CrossRef]
  10. Grant, W.F. A cytogenetic study in the Acanthaceae. Brittonia 1955, 8, 121–149. [Google Scholar] [CrossRef]
  11. Takizawa, Y. The structure of the pachytene chromosomes of some Acanthaceae, as well as a series of newly determined chromosome numbers. Cytologia 1957, 22, 118–126. [Google Scholar] [CrossRef][Green Version]
  12. Chen, J.; Devenand, P.S.; Norman, D.J.; Henny, R.J.; Chao, C.T. Genetic relationships of Aglaonema species and cultivars inferred from AFLP markers. Ann. Bot. 2004, 93, 157–166. [Google Scholar] [CrossRef] [PubMed]
  13. Bousquet, J.; Simon, L.; Lalonde, M. DNA amplification from vegetative and sexual tissues of trees using polymerase chain reaction. Can. J. For. Res. 1990, 20, 254–257. [Google Scholar] [CrossRef]
  14. Vos, P.; Hogers, R.; Bleeker, M.; Reijans, M.; van de Lee, T.; Hornes, M.; Frijters, A.; Pot, J.; Peleman, J.; Kuiper, M.; et al. AFLP: A new technique for DNA fingerprinting. Nucleic Acids Res. 1995, 23, 4407–4414. [Google Scholar] [CrossRef] [PubMed]
  15. Salmon, A.; Ainouche, M.L.; Wendel, J.F. Genetic and epigenetic consequences of recent hybridization and polyploidy in Spartina (Poaceae). Mol. Ecol. 2005, 14, 1163–1175. [Google Scholar] [CrossRef]
  16. Salmon, A.; Clotault, J.; Jenczewski, E.; Chable, V.; Manzanares-Dauleux, M.J. Brassica oleracea displays a high level of DNA methylation polymorphism. Plant Sci. 2008, 174, 61–70. [Google Scholar] [CrossRef]
  17. Xiong, L.Z.; Xu, C.G.; Saghai Maroof, M.A.; Zhang, Q. Patterns of cytosine methylation in an elite rice hybrid and its parental lines, detected by a methylation-sensitive amplification polymorphism technique. Mol. Gen. Genet. 1999, 261, 439–446. [Google Scholar] [CrossRef]
  18. Cervera, M.T.; Ruiz-García, L.; Martínez-Zapater, J.M. Analysis of DNA methylation in Arabidopsis thaliana based on methylation-sensitive AFLP markers. Mol. Genet. Genom. 2002, 268, 543–552. [Google Scholar] [CrossRef]
  19. Swofford, D.L. PAUP: Phylogenetic Analysis Using Parsimony (and Other Methods), Version 4.0b10; Sinauer Associates: Sunderland, MA, USA, 2002. [Google Scholar]
  20. Huelsenbeck, J.P.; Ronquist, F. MRBAYES: Bayesian inference of phylogenetic trees. Bioinformatics 2001, 17, 754–755. [Google Scholar] [CrossRef]
  21. Ronquist, F.; Huelsenbeck, J.P. MrBayes 3: Bayesian phylogenetic inference under mixed models. Bioinformatics 2003, 19, 1572–1574. [Google Scholar] [CrossRef] [PubMed]
  22. Rambaut, A.; Suchard, M.A.; Xie, D.; Drummond, A.J. Tracer v1.6. Available online: http://tree.bio.ed.ac.uk/software/tracer/ (accessed on 10 April 2007).
  23. Cui, J.; Chen, J.; Henny, R.J. Regeneration of Aeschynanthus radicans via direct somatic embryogenesis and analysis of regenerants with flow cytometry. Vitr. Cell. Dev. Biol. Plant 2009, 45, 34–43. [Google Scholar] [CrossRef]
  24. Stace, C.A. Cuticular studies as an aid to plant taxonomy. Bull. Br. Mus. (Nat. Hist.) Bot. 1965, 4, 1–78. [Google Scholar]
  25. Stace, C.A. The use of epidermal characters in phylogenetic considerations. New Phytol. 1966, 65, 304–318. [Google Scholar] [CrossRef]
  26. Luo, Y.; Zhou, Z.K. Leaf architecture in Quercus subgenus Cyclobalanopsis (Fagaceae) from China. Bot. J. Linn. Soc. 2002, 140, 283–295. [Google Scholar] [CrossRef]
  27. Hickey, L.J. Classification of the architecture of dicotyledonous leaves. Am. J. Bot. 1973, 60, 17–33. [Google Scholar]
  28. Stace, C.A. The taxonomic importance of the leaf surface. In Current Concepts in Plant Taxonomy; Heywood, V.H., Moore, D.M., Eds.; Academic Press: London, UK, 1984; pp. 67–94. [Google Scholar]
  29. Leaf Architecture Working Group. Manual of Leaf Architecture: Morphological Description and Categorization of Dicotyledonous and Net-Veined Monocotyledonous Angiosperms; Smithsonian Institution: Washington, DC, USA, 1999. [Google Scholar]
  30. Maddison, W.P.; Maddison, D.R. Mesquite: A Modular System for Evolutionary Analysis, Version 1.12. 2006. Available online: http://mesquiteproject.org (accessed on 10 April 2007).
  31. Yang, D.S.; Pennisi, S.V.; Son, K.; Kays, S.J. Screening indoor plants for volatile organic pollutant removal efficiency. HortScience 2009, 44, 1377–1381. [Google Scholar] [CrossRef]
  32. Vekemans, X.; Beauwens, T.; Lemaire, M.; Roldán-Ruiz, I. Data from amplified fragment length polymorphism (AFLP) markers show indication of size homoplasy and of a relationship between degree of homoplasy and fragment size. Mol. Ecol. 2002, 11, 139–151. [Google Scholar] [CrossRef] [PubMed]
  33. Meudt, H.M.; Clarke, A.C. Almost forgotten or latest practice? AFLP applications, analyses and advances. Trends Plant Sci. 2007, 12, 106–117. [Google Scholar] [CrossRef]
  34. Chen, J.; Henny, R.J.; Devanand, P.S.; Chao, C.T. AFLP analysis of nephthytis (Syngonium podophyllum Schott) selected from somaclonal variants. Plant Cell Rep. 2006, 24, 743–749. [Google Scholar] [CrossRef]
Figure 1. Phylogram of 14 Fittonia cultivars constructed according to AFLP, MSAP, and combined datasets. The constructions used the Neighbor-Joining Method with Nei-Li distances. Aphelandra squarrosa was used as the outgroup to root the tree. Values above the branch (or before the slash) indicate bootstrap support based on 10,000 nonparametric replicates calculated by PAUP 4.0b [19]. Values below branches (or after the slash) represent posterior probabilities inferred using MrBaryes 3 [21] from 1,000,000 generations. (A). AFLP phylogram (total branch length = 0.50760). (B). MspI-based MSAP phylogram (total branch length = 0.32075). (C). HpaII-based MSAP phylogram (total branch length = 0.32282). (D). Combined AFLP and MSAP phylogram (total branch length = 0.32616).
Plants 15 01391 g001
Figure 2. Fluorescent intensities by flow cytometry and chromosome spreads of three Fittonia cultivars: (A,D). Cultivar Red Anne; (B,E). Cultivar Leather Leaf; (C,F). Cultivar Titanic. (AC). Peak 1 indicates Fittonia cultivars, peak 2 indicates Pisum sativum ‘Ctirad’. All the cultivars were diploid, with a chromosome number of 2n = 36.
Plants 15 01391 g002
Figure 3. Leaf anatomy of Fittonia cultivars. Scale bar = 50 μm. (AE) Transverse sections (TS) of leaves; asterisks indicate bubble cells and arrows indicate cystoliths. (A) Cultivar Titanic, showing flat epidermal cells and cystoliths located between the palisade and spongy mesophyll. (BE) Leaf transverse sections of cultivars White Anne (B), Red Vein (C), Fortissima (D), and Black Star (E). (F) Capitate hairs of ‘Mini-Josan’. (G) Coniform hairs of ‘Angel Snow’, showing a complex trichome base. (H) Cystolith of ‘Red Star’, showing the internal cystolith crystal. (I,J) Upper and lower epidermis of ‘Titanic’, showing flat epidermal cells. (K,L) Upper and lower epidermis of ‘White Anne’, showing dense bubble cells on the upper cuticle and scattered bubble cells on the lower cuticle. (M,N) Upper and lower cuticle of ‘Jocmita’. (O) Lower cuticle of ‘Frankie’; the asterisk indicates contiguous stomata. (P) Simple cystolith of ‘Red Anne’. (Q) Double cystolith of ‘Leather Leaf’.
Plants 15 01391 g003
Figure 4. Leaf venation of Fittonia cultivars. (AC) Whole-leaf venation patterns of cultivars ‘Titanic’ (A), ‘Black Star’ (B), and ‘White Anne’ (C). (DF) Leaf apices of cultivars ‘Titanic’ (D), ‘Black Star’ (E), and ‘White Anne’ (F). (GI) Eucamptodromous venation in Fittonia cultivars. (G) Cultivar ‘Titanic’; the arrow indicates an extremely slender, curved, randomly branched tertiary vein. (H,I) Cultivars ‘Black Star’ and ‘White Anne’, respectively; arrows indicate thick tertiary veins extending across two adjacent secondary veins. (JP) Higher magnification of leaf venation. (J) Cultivar ‘Titanic’; the arrow indicates a tertiary vein extending toward the leaf margin and branching randomly into quaternary veins. (K,L) Cultivars ‘Black Star’ and ‘White Anne’, respectively; arrows indicate cross-connecting tertiary veins. In the center, quaternary veins branch irregularly to form the areolation. (M) Poorly developed areolation in ‘Titanic’. (N) Randomly branched tertiary veins in ‘Titanic’. (O,P) Areoles of ‘Black Star’, showing an unbranched veinlet (O) and a once-branched veinlet (P), respectively.
Plants 15 01391 g004
Figure 5. Stem and petiole transverse sections (TS) of cultivated Fittonia. (A) Stem transverse sections. Left: cultivar ‘Leather Leaf’; right: cultivar ‘Angel Snow’. Ep, epidermis; Col, collenchyma; Cys, cystolith; VB, vascular bundle. (B) Stem transverse section of cultivar ‘Red Anne’, showing a concentric ring of vascular bundles with two main well-developed vascular bundles (MVB) and smaller lateral vascular bundles (arrows). Cystoliths (asterisks) are scattered in the cortical and pith parenchyma. (C) Petiole transverse sections. Left: cultivar ‘Titanic’; right: cultivar ‘Mini-Josan’. Ep, epidermis; Col, collenchyma; Pa, cortical parenchyma; MVB, main vascular bundle; LVB, lateral vascular bundle.
Plants 15 01391 g005
Figure 6. Fourteen anatomical characters observed in this study and four taxonomical characters used by DeWolf [1] and Brummitt [2,3] were mapped onto an AFLP/MSAP-based tree using Mesquite 2.75 [30]. Black solid circles indicate the plesimorphism/synapomorphism/autapomorphism; Blue transparent circles indicate the paraphyletic status of those features.
Plants 15 01391 g006
Table 1. Number of fragments generated by each primer pair combination and percentage of polymorphic fragments detected in 14 Fittonia cultivars.
Primer Pair CombinationsNo. of Fragments GeneratedVariable FragmentsPrimer CombinationsNo. of Fragments GeneratedVariable Fragments
EcoRI + AAG/MseI + CAC5332EcoRI + AAC/MseI + CTA4013
EcoRI + AGC/MseI + CAC5837EcoRI + ACC/MseI + CTA3220
EcoRI + ACA/MseI + CAG5423EcoRI + ACT/MseI + CTA5331
EcoRI + ACT/MseI + CAG4427EcoRI + AGG/MseI + CTA4426
EcoRI + ACC/MseI + CAT9454EcoRI + AAC/MseI + CTT194
EcoRI + AGC/MseI + CAT3624EcoRI + AGG/MseI + CTT221
Total fragments: 549 and total variable fragments: 292
MSAPHpaII/MspIHpaII/MspI HpaII/MspIHpaII/MspI
EcoRI + ACA/HpaII/MspI + ACT8034/14EcoRI + AAC/HpaII/MspI + AAC4019/19
EcoRI + ACC/HpaII/MspI + ACT5849/47EcoRI + ACG/HpaII/MspI + AAC3024/26
EcoRI + ACT/HpaII/MspI + ACT8060/77EcoRI + AAC/HpaII/MspI + AAT5018/22
EcoRI + AGG/HpaII/MspI + ACT6023/10EcoRI + ACA/HpaII/MspI + AAT6022/23
EcoRI + AAC/HpaII/MspI + ACT4129/20EcoRI + ACG/HpaII/MspI + AAT7045/34
EcoRI + ACG/HpaII/MspI + ACT3418/32EcoRI + ACT/HpaII/MspI + AAT6423/50
Total fragments: 667 and total HpaII/MspI: 265/212
Table 2. Types of MSAP bands in 14 Fittonia cultivars.
CodeCultivarsType IType IIType IIIType IVTotal Amplified BandsTotal Methylated BandsMSAP
%
Full Methylated BandsFully Methylated Ratio%
TotalMethylation
Sensitive
1Frankie2131012101559066855683.2330044.91
2Titanic2086818114413566852879.0431647.31
3White Anne207922131499966855382.7831246.71
4Red Anne213902111578766854581.5929844.61
5Fortissima207922021649566855382.7829744.46
6Angel Snow2216619414410866751276.7630245.28
7Red Star204882161549466855282.6331046.41
8Black Star203872151589266855282.6330745.96
9Red Vein211902131598566854781.8929844.61
10Mini-Josan210942101579166855282.6330145.06
11Leather Leaf211992121578766755583.2129944.83
12Jacmita208962121519866955683.2331046.34
13Red Angel210932091569166852879.0430145.06
14Superba2009520915610466955382.7831346.79
Note: Total methylated bands = Methylation sensitive (Type I) + Type II + Type III + Type IV. MSAP% = total methylated bands/Total Amplified bands. Fully methylated Ratio% = Type IV/Total Amplified Bands. The codes denote the cultivars included in the initial collection.
Table 3. Nuclear DNA contents determined by flow cytometry analysis of 14 Fittonia cultivars.
CodeCultivar Name2C-Value ± S.D. (pg)DNA Index1C Genome Size (Mbp)Ploidy Level
9Red Anne2.92 ± 0.060.3214282
11Leather Leaf2.89 ± 0.080.3214132
5Fortissima2.88 ± 0.060.3214112
13Red Angel2.86 ± 0.040.3113982
10Mini Josan2.89 ± 0.040.3214142
14Superba2.85 ± 0.060.3113952
12Jacmita2.86 ± 0.010.3114002
8Black Star2.94 ± 0.050.3214402
7Red Star2.88 ± 0.040.3214102
3White Anne2.87 ± 0.030.3214042
1Frankie2.91 ± 0.040.3214222
4Red Vein2.86 ± 0.050.3113972
2Titanic2.74 ± 0.020.3013402
6Angel Snow2.73 ± 0.030.3013362
The codes denote the cultivars included in the initial collection.
Disclaimer/Publisher’s Note: The statements, opinions and data contained in all publications are solely those of the individual author(s) and contributor(s) and not of MDPI and/or the editor(s). MDPI and/or the editor(s) disclaim responsibility for any injury to people or property resulting from any ideas, methods, instructions or products referred to in the content.