Article

Genome-Wide Identification of the Soybean GH5 Gene Family and Functional Analysis of GmGH5-22 in Salt Tolerance


1
Crop Stress Molecular Biology Laboratory, College of Agriculture, Heilongjiang Bayi Agricultural University, Daqing 163319, China
2
Beidahuang Kenfeng Seed Co., Ltd., Harbin 150030, China
3
College of Agriculture, Northeast Agricultural University, Harbin 150030, China
*
Author to whom correspondence should be addressed.
These authors contributed equally to this work.
Plants 2026, 15(17), 2700; https://doi.org/10.3390/plants15172700
Submission received: 17 July 2026 / Revised: 28 August 2026 / Accepted: 29 August 2026 / Published: 2 September 2026

Abstract

Plant GH5 family genes function in both cell wall biosynthesis and stress responses. However, comprehensive studies on GH5 genes in the soybean remain limited. Here, we identified 28 GmGH5 genes from the soybean genome. Phylogenetic analysis assigned these genes to three subfamilies (I–III), with no representatives in subfamily IV. The GmGH5 family harbors 15 conserved motifs, which are largely similar within subfamilies but differ across subfamilies. Additionally, exon–intron structures (2–7 introns) exhibit clade-specific patterns, with members within the same clade sharing similar intron numbers and lengths, whereas distinct clades show some variation. The promoter regions of GmGH5 genes contained various cis-acting regulatory elements associated with stress responses and developmental processes. Transcriptome-based expression profiling revealed distinct tissue-specific expression patterns of GmGH5 genes. RT-qPCR further confirmed their differential expression under salt, alkaline, cold, and drought stresses, especially a significant increase in GmGH5-22 expression under salt stress (approximately 22-fold at 6 h, **** p < 0.0001). Furthermore, GmGH5-22 was highly expressed in roots, and transient expression in tobacco leaves showed its peripheral localization, which aligns with its predicted extracellular localization, suggesting that GmGH5-22 is highly likely localized to the cell wall. Overexpression of GmGH5-22 in soybean hairy roots significantly improved tolerance to salt stress. These findings establish a foundation for functional characterization of GmGH5 genes and provide viable targets for molecular breeding to enhance salt tolerance in soybeans.

1. Introduction

Soil salinization represents a primary abiotic stress factor that undermines global agricultural sustainability and food security. According to the global assessment report released by the Food and Agriculture Organization (FAO) in 2024 [1], approximately 1.38 billion hectares, accounting for nearly 10.7% of the total land area worldwide, are currently affected by salinization, with an additional one billion hectares at risk from the climate crisis and inappropriate anthropogenic management. Salinization has already compromised approximately 20% of irrigated croplands globally, and in severely impacted areas, yield reductions for sensitive crops such as rice and legumes can reach up to 70%.
The soybean (Glycine max (L.) Merr) is an important source of vegetable oil and protein worldwide [2]. However, its productivity and cultivation are severely constrained by soil salinization [3]. Salt stress triggers a cascade of interconnected physiological disturbances in soybeans, including osmotic imbalance, ionic toxicity from excess Na+ accumulation, and oxidative damage from reactive oxygen species (ROS) bursts [4,5]. Together, these impairments inhibit both vegetative growth and reproductive development, culminating in substantial yield reductions under saline conditions [6,7]. Salt tolerance in soybeans operates through ion homeostasis, osmotic adjustment, and ROS scavenging, executed by ion transporters, compatible solutes, and antioxidant enzymes [3,4,5].
Beyond ion homeostasis, osmotic adjustment, and ROS scavenging, the plant cell wall has emerged as a key determinant of stress adaptation [8,9]. Serving as the first barrier sensing environmental cues, the cell wall undergoes dynamic remodeling of its composition and architecture to maintain cellular integrity under adverse conditions [10,11,12,13]. Glycoside hydrolases (GHs) have emerged as pivotal regulators that orchestrate this dynamic remodeling, a process fundamental to growth, development, and stress responses [14,15,16,17]. Among the various GH families, Glycoside hydrolase family 5 (GH5) is one of the most functionally diverse [18]. GH5 comprises enzymes that share a conserved (β/α)8 barrel catalytic domain, yet they display considerable functional diversity, including β-mannanase, β-glucanase, and β-glucosidase activities [18,19]. GH5 enzymes hydrolyze glycosidic bonds in cell wall polysaccharides, releasing oligosaccharide fragments that are perceived as damage-associated molecular patterns (DAMPs) to activate stress signaling [20,21]. Under salt stress, this hydrolysis promotes cell wall remodeling by loosening wall architecture to sustain root growth, while simultaneously releasing soluble sugars that contribute to osmotic adjustment and bolster antioxidant defense [22]. Thus, GH5 enzymes bridge physical cell wall modification with systemic stress responses, positioning them as key players in salt tolerance. Although the family is phylogenetically subdivided into multiple lineages, many GH5 members have been functionally linked to plant cell wall metabolism and stress responses. In rice, a stress-inducible GH5 β-glucosidase carrying a fascin-like domain was identified, suggesting a possible role in carbohydrate binding or sensory functions [23]. Other rice GH5 genes have been associated with seed development and endosperm traits [24]. Genome-wide surveys in foxtail millet and grape have further documented the presence and differential expression of GH5 members, indicating their evolutionary conservation across monocots and dicots [25,26]. At the structural level, a recently characterized soybean GH5 β-mannanase has provided detailed insights into substrate recognition and acidophilic catalysis [27]. Together, these findings highlight GH5 enzymes as versatile players in cell wall remodeling, reproductive development, and stress responses.
Despite the recognized importance of GH5 family members in plant growth and abiotic stress responses, their functional roles in the soybean remain largely elusive, particularly under salt stress. In this study, genome-wide identification of the soybean GmGH5 gene family revealed GmGH5-22 as a positive regulator of salt stress response. GmGH5 members are evolutionarily conserved with tissue-specific and stress-inducible expression. Overexpression of GmGH5-22 in soybean hairy roots enhanced salt tolerance. These findings provide a basis for elucidating the regulatory mechanism of GmGH5-22 in stress responses and highlight its potential as a candidate gene for improving stress tolerance in the soybean.

2. Results

2.1. Identification of the GmGH5 Family in the Soybean

Through systematic genome-wide analysis using HMMER3.0, a total of 28 non-redundant GH5 genes were identified in the soybean genome. These genes were designated as GmGH5-1 through GmGH5-28 according to their chromosomal order. The complete coding sequences (CDSs) of the GmGH5 genes span 1209 to 1728 base pairs. The physicochemical characteristics of the 28 GmGH5 proteins were then systematically characterized. Table 1 summarizes the essential features of the GmGH5 family. The lengths of sequences range from 402 (GmGH5-15) to 575 (GmGH5-12) amino acids, and their molecular weights extend from 46.058 (GmGH5-15) to 63.148 (GmGH5-5) kDa, indicating considerable structural differences, potentially associated with genome size and species evolution. The isoelectric point falls within the range of 5.24 (GmGH5-13) to 9.54 (GmGH5-16). Among these, 20 of the 28 GmGH5 proteins (71.4%) had a pI below 7, suggesting that most GmGH5 members are rich in acidic amino acids. Protein architecture analysis revealed that 23 GmGH5 members featured an N-terminal signal peptide, whereas five members (GmGH5-6/9/19/20/23) lacked this feature but contained transmembrane domains (9–35 aa). GmGH5-12 and GmGH5-17 additionally carried an RICIN (R-type lectin) domain, pointing to a modular secretory glycoside hydrolase organization potentially associated with cell wall polysaccharide binding.
Subcellular localization prediction revealed diverse compartmental distributions among the 28 GmGH5 members (Table 1). Among these, 16 showed cytoplasmic localization (14 exclusively and 2 with additional localizations), whereas 10 were localized to the cell wall (6 exclusively and 4 with additional localizations), and the remaining 2 were solely nuclear-localized.

2.2. Chromosomal Location and Phylogenetic Analysis of the GmGH5 Genes in the Soybean

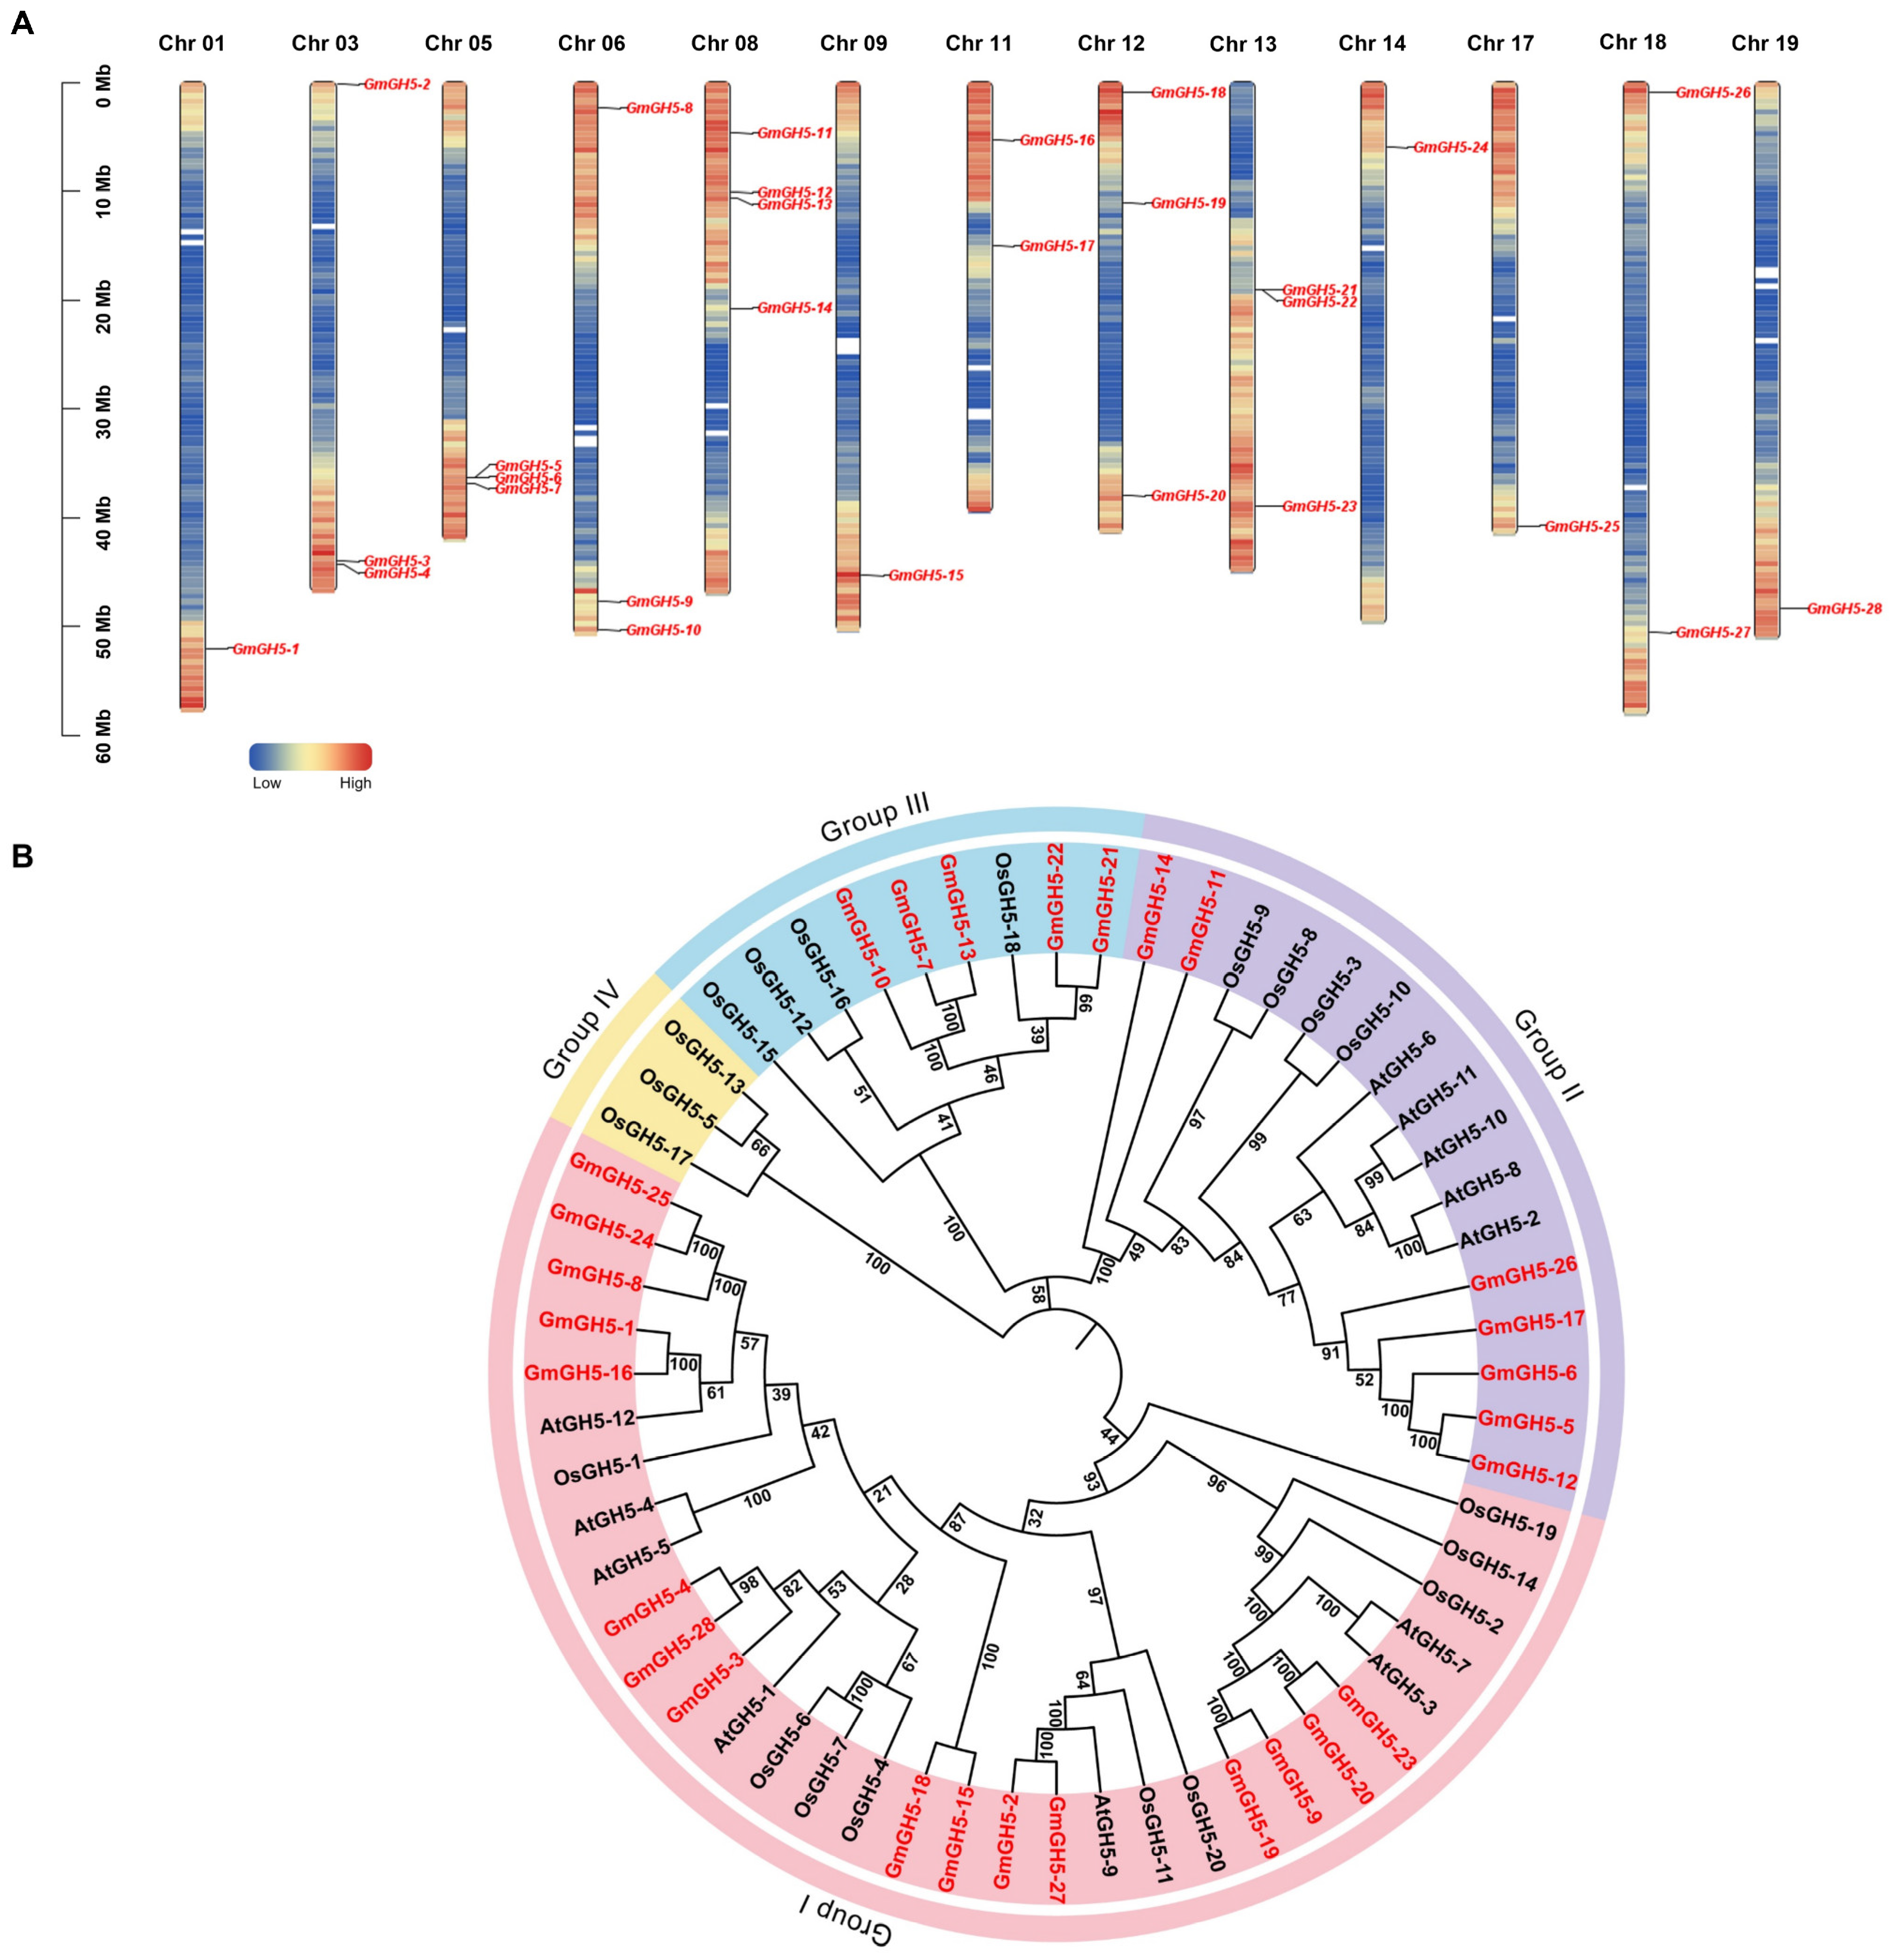
These genes were distributed across 13 of the 20 soybean chromosomes (Chr 01, 03, 05, 06, 08, 09, 11, 12, 13, 14, 17, 18, and 19) (Figure 1A). Chromosome 8 harbored the highest number of GmGH5 genes (4 members). Chromosomes 03, 05, 06, 12, and 13 each contained 3 members, while the remaining chromosomes carried 1–2 members. Most GmGH5 genes were located near the distal ends of chromosomes, with only a few positioned in the central regions. Several GmGH5 members were arranged in tandem or tight clusters on the same chromosome (e.g., GmGH5-3 and GmGH5-4 on Chr03; GmGH5-5, GmGH5-6, and GmGH5-7 on Chr05).
Phylogenetic analysis of 60 GH5 proteins from three species of different affinities was performed, including 28 from Glycine max, 12 from Arabidopsis thaliana, and 20 from Oryza sativa (Figure 1B). The results of the phylogenetic analysis indicated that these GH5 proteins were classified into four distinct subgroups (Group I–IV). The 28 soybean GH5 genes were distributed unevenly among Groups I–III, with no soybean member in Group IV. Specifically, Group I contained the largest number of GmGH5 genes (16 members, accounting for 57.1% of all GmGH5s), followed by Group II (7 members) and Group III (5 members). In Arabidopsis thaliana, only Group I and Group II members were identified, with no homologs in Group III or Group IV. These findings indicate that the four-group topology predates the monocot–dicot divergence, with Group IV retained in monocots but lost in dicots, and Group III also absent in Arabidopsis. The expansion of Group I in the soybean (16/28) further suggests a dicot-specific functional divergence of this subgroup.

2.3. Synteny Analysis of the GmGH5 Gene Family

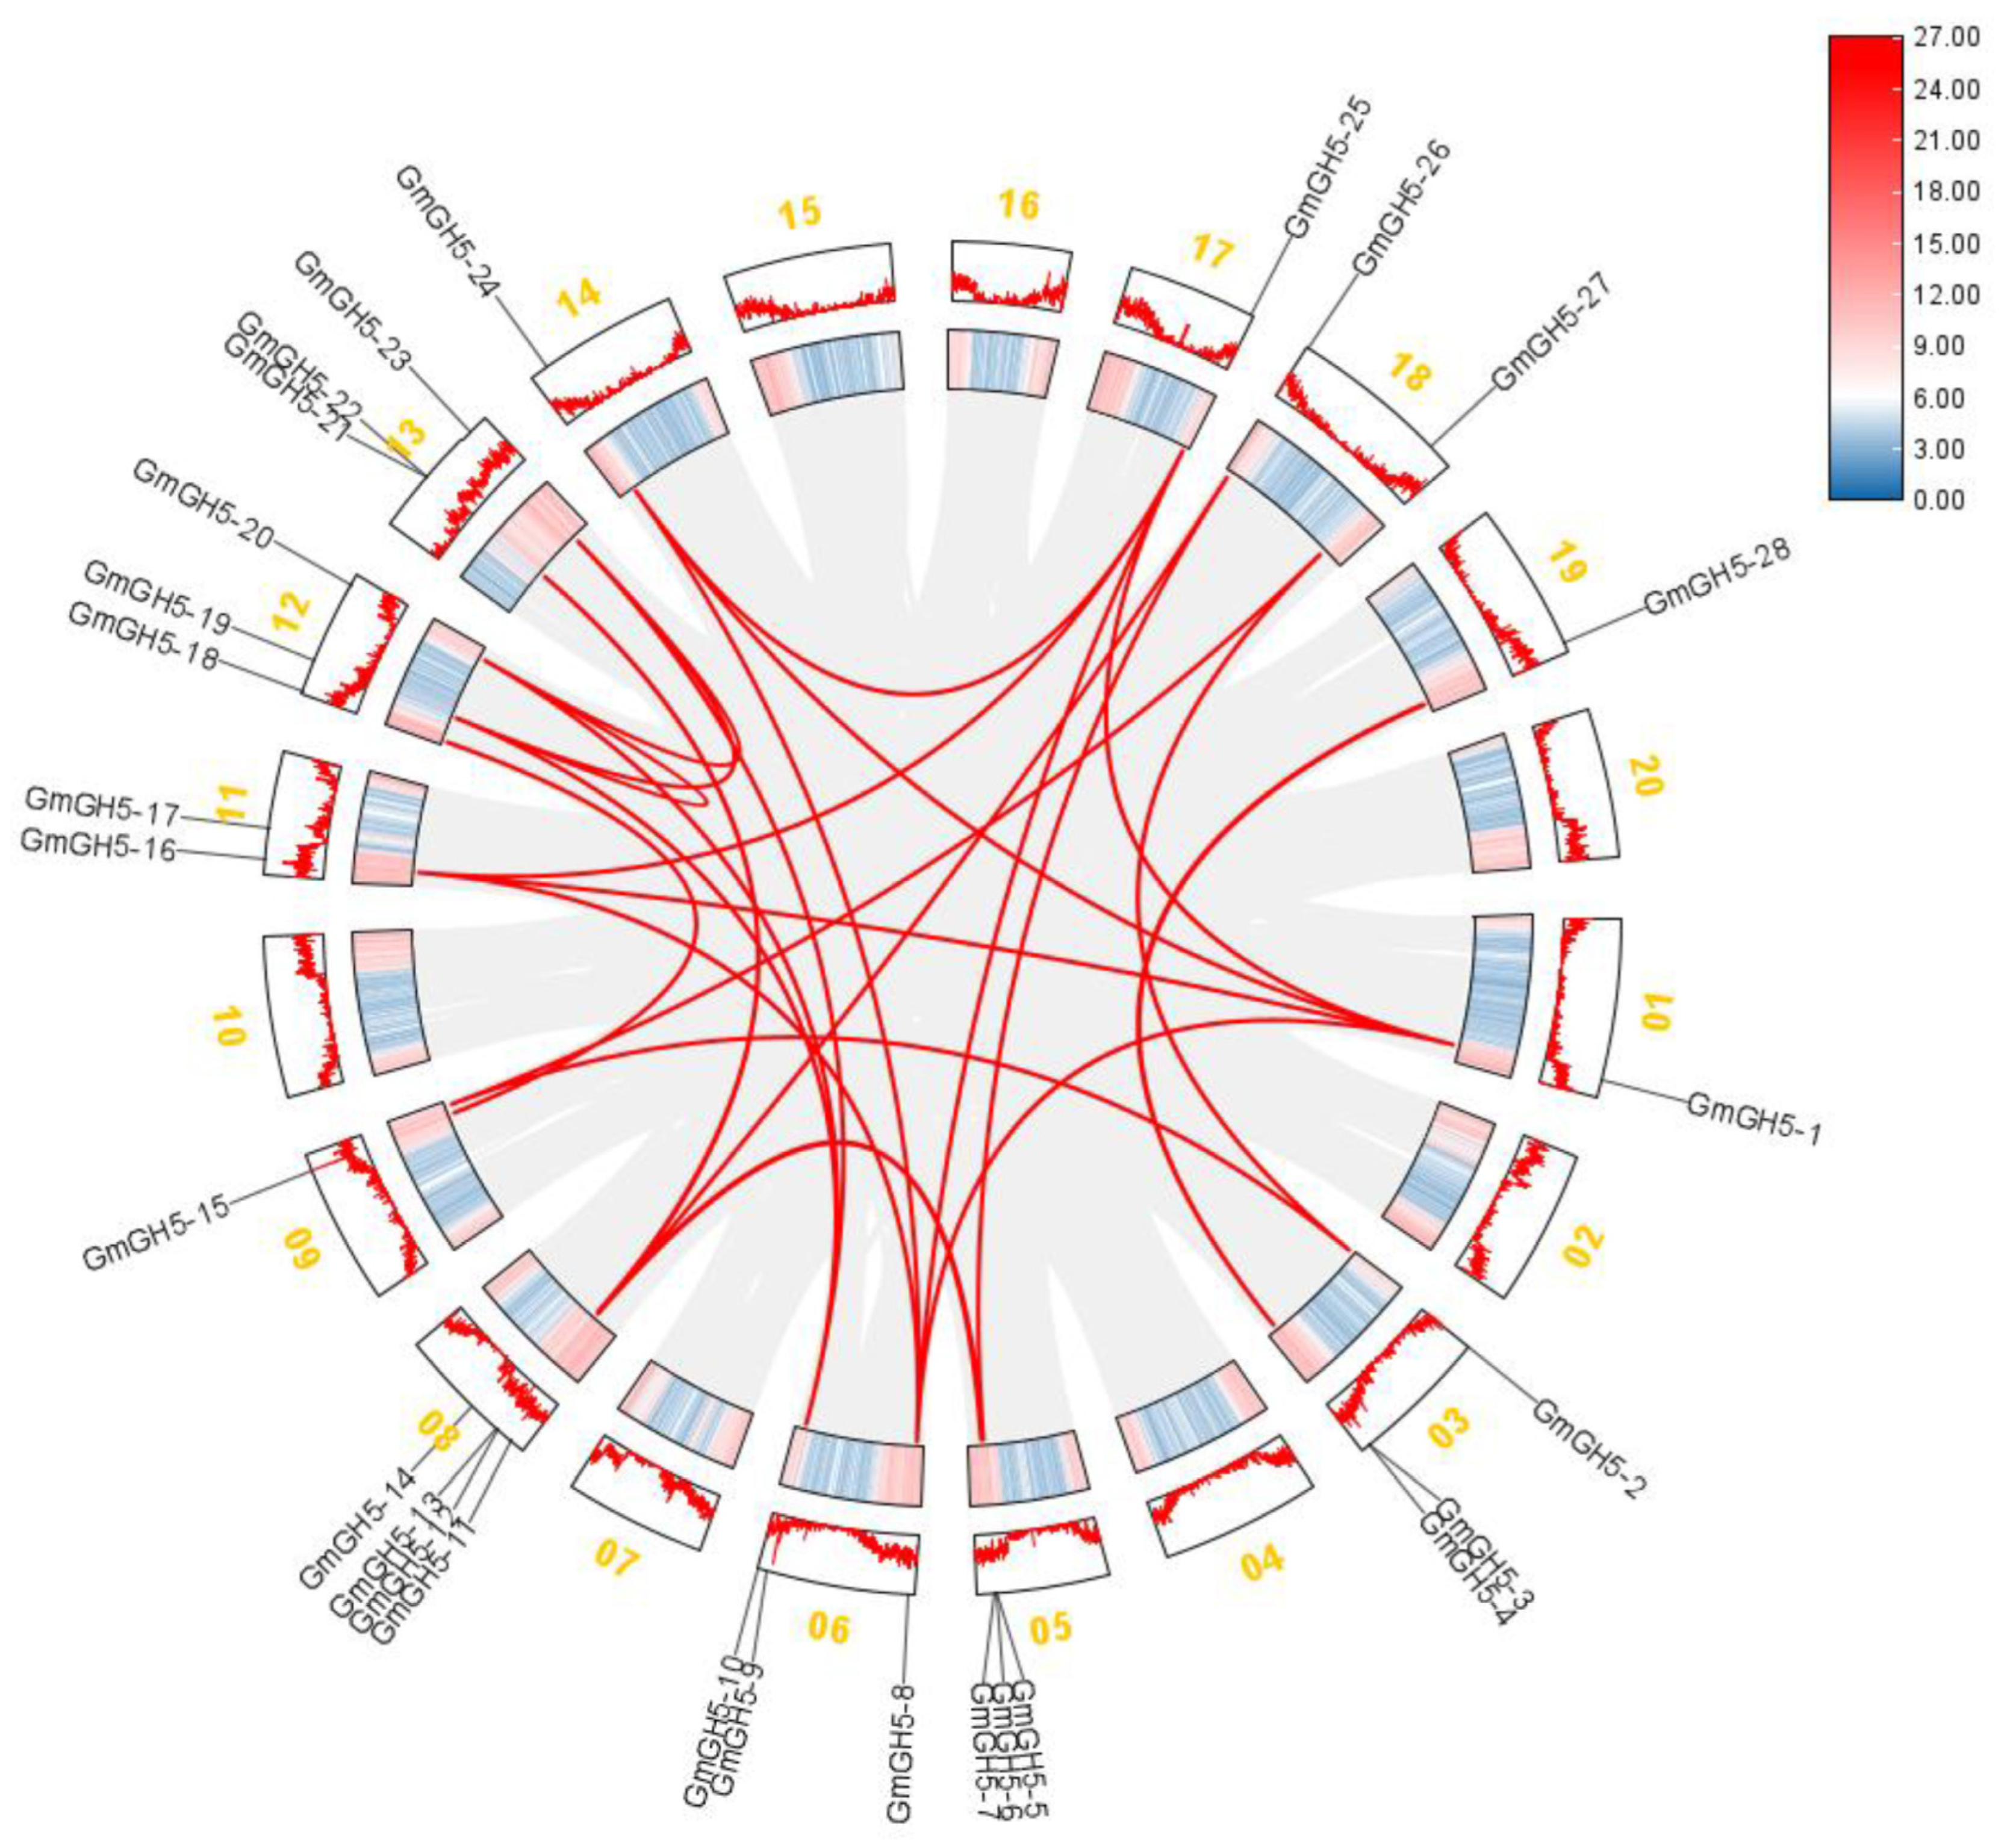
To investigate the evolutionary mechanisms underlying the expansion of the GmGH5 family, we performed a synteny analysis and identified 24 segmental duplication gene pairs across the soybean genome. These pairs were distributed on 13 chromosomes, suggesting that segmental duplications have played a substantial role in the expansion of this family (Figure 2). For instance, robust duplication pairs were detected between GmGH5-1 (Chr 01) and GmGH5-16 (Chr 11), as well as between GmGH5-2 (Chr 03) and GmGH5-27 (Chr 18). Additionally, interconnected gene modules were also identified, such as a cluster linking GmGH5-1 (Chr 01), GmGH5-8 (Chr 06), GmGH5-16 (Chr 11), GmGH5-24 (Chr 14), and GmGH5-25 (Chr 17), further supporting the retention of duplicated genes following whole-genome duplication (WGD) events. Taken together, these results indicate that inter-chromosomal segmental duplications, rather than intra-chromosomal events, served as the primary driving force for the expansion of the GmGH5 family.

2.4. Analysis of Gene Structure and Protein Motif

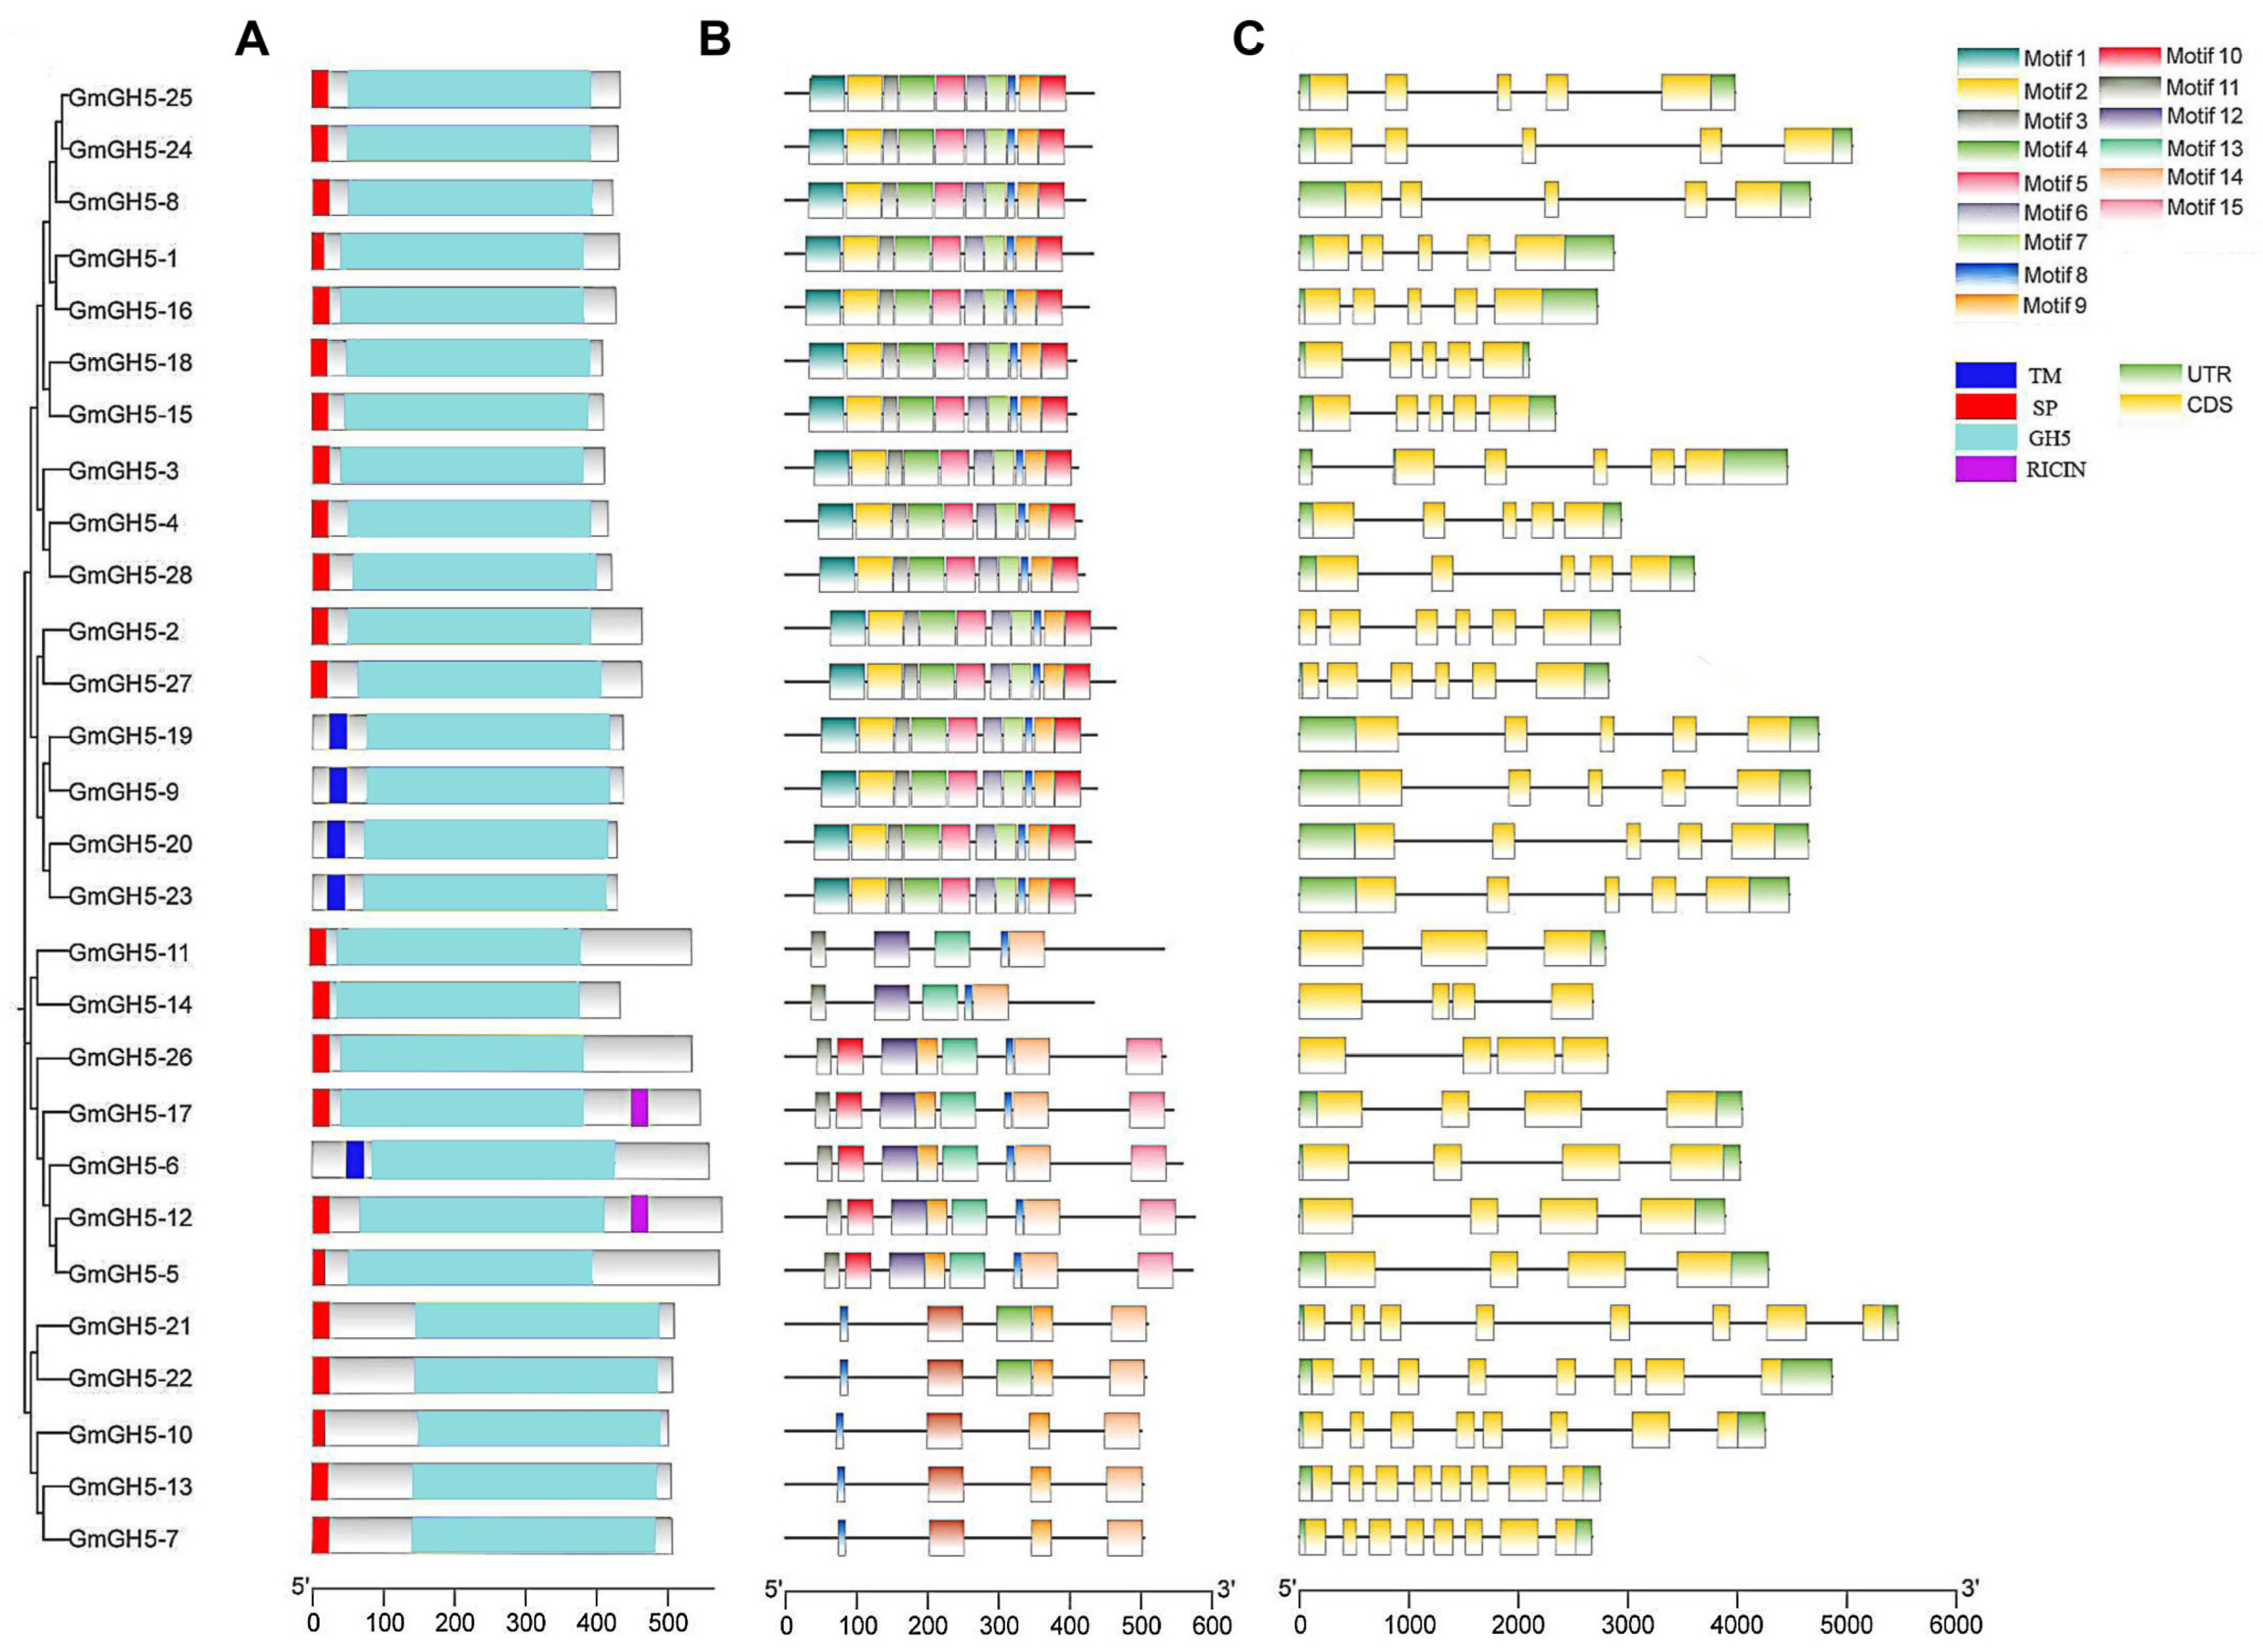
To investigate the evolutionary diversity of the GmGH5 gene family, we analyzed conserved motifs using the MEME website and constructed an integrated diagram of conserved domains, gene structures, and motif distributions for the 28 GmGH5 proteins using TBtools-II, Version 128 (Windows-x64) (Figure 3). All members contained a complete GH5 catalytic domain. Most members contained an N-terminal signal peptide, whereas GmGH5-19, GmGH5-9, GmGH5-20, GmGH5-23, and GmGH5-6 harbored transmembrane domains instead. GmGH5-12, and GmGH5-17 contained an additional C-terminal RICIN domain (Figure 3A). MEME analysis predicted 15 conserved motifs (Motif 1–15). Members within the same clade shared similar motif compositions, whereas distinct subclades exhibited clear motif variations, suggesting that members of the same subclade may perform similar functions (Figure 3B). The GmGH5 genes contained 2 to 7 introns, with notable variation in both intron number and length. However, this variation was largely subfamily-dependent, genes within the same subfamily shared similar intron structures, whereas those from different subfamilies exhibited marked differences (Figure 3C). Taken together, the observed variations in gene structure, motif composition, and domain distribution suggest functional divergence during the evolution of the GmGH5 family, implying that different subgroups may assume distinct biological roles in planta.

2.5. Analysis of Cis-Acting Components

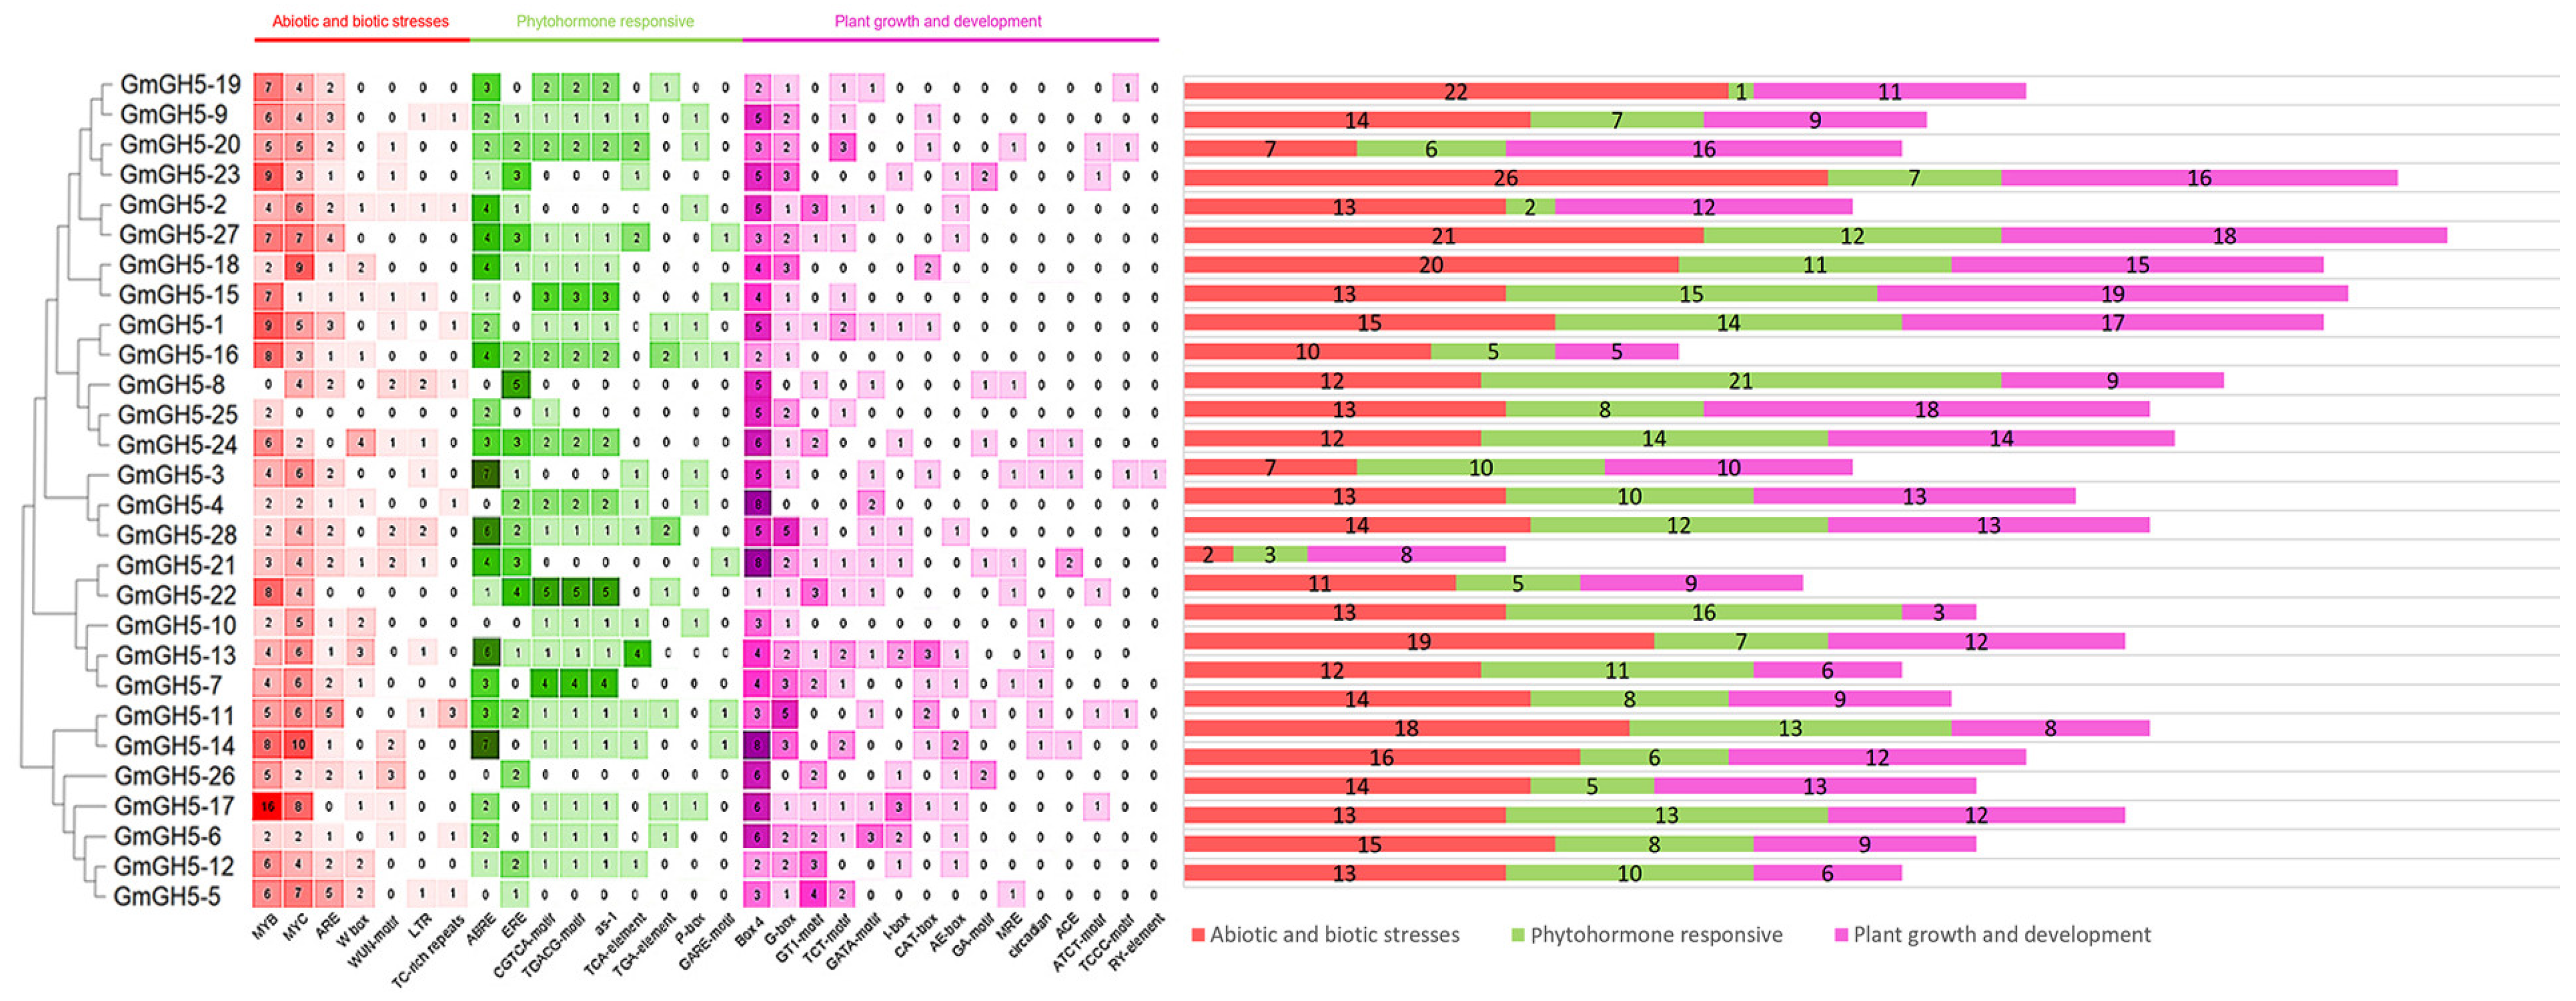
Promoter analysis of 28 GmGH5 genes identified three major categories of cis-acting elements: stress-responsive elements (377 copies) were the most abundant, followed by plant growth-related elements (301 copies) and phytohormone-responsive elements (246 copies) (Figure 4). Further analysis revealed that among the stress-responsive elements, MYB, MYC, and anaerobic response elements (AREs) showed the greatest enrichment. In terms of hormonal regulation, most GmGH5 promoters contained three types of hormone-responsive elements: ABRE, ERE, and the CGTCA-motif. In addition, all GmGH5 genes possessed the growth and development-associated element Box4 (ATTAAT). The observed distribution of cis-elements suggests that GmGH5 genes may be involved in complex biological processes by integrating stress signals, hormonal regulation, and developmental programs.

2.6. Spatiotemporal Expression Patterns of GmGH5 Genes Across Different Developmental Stages in the Soybean

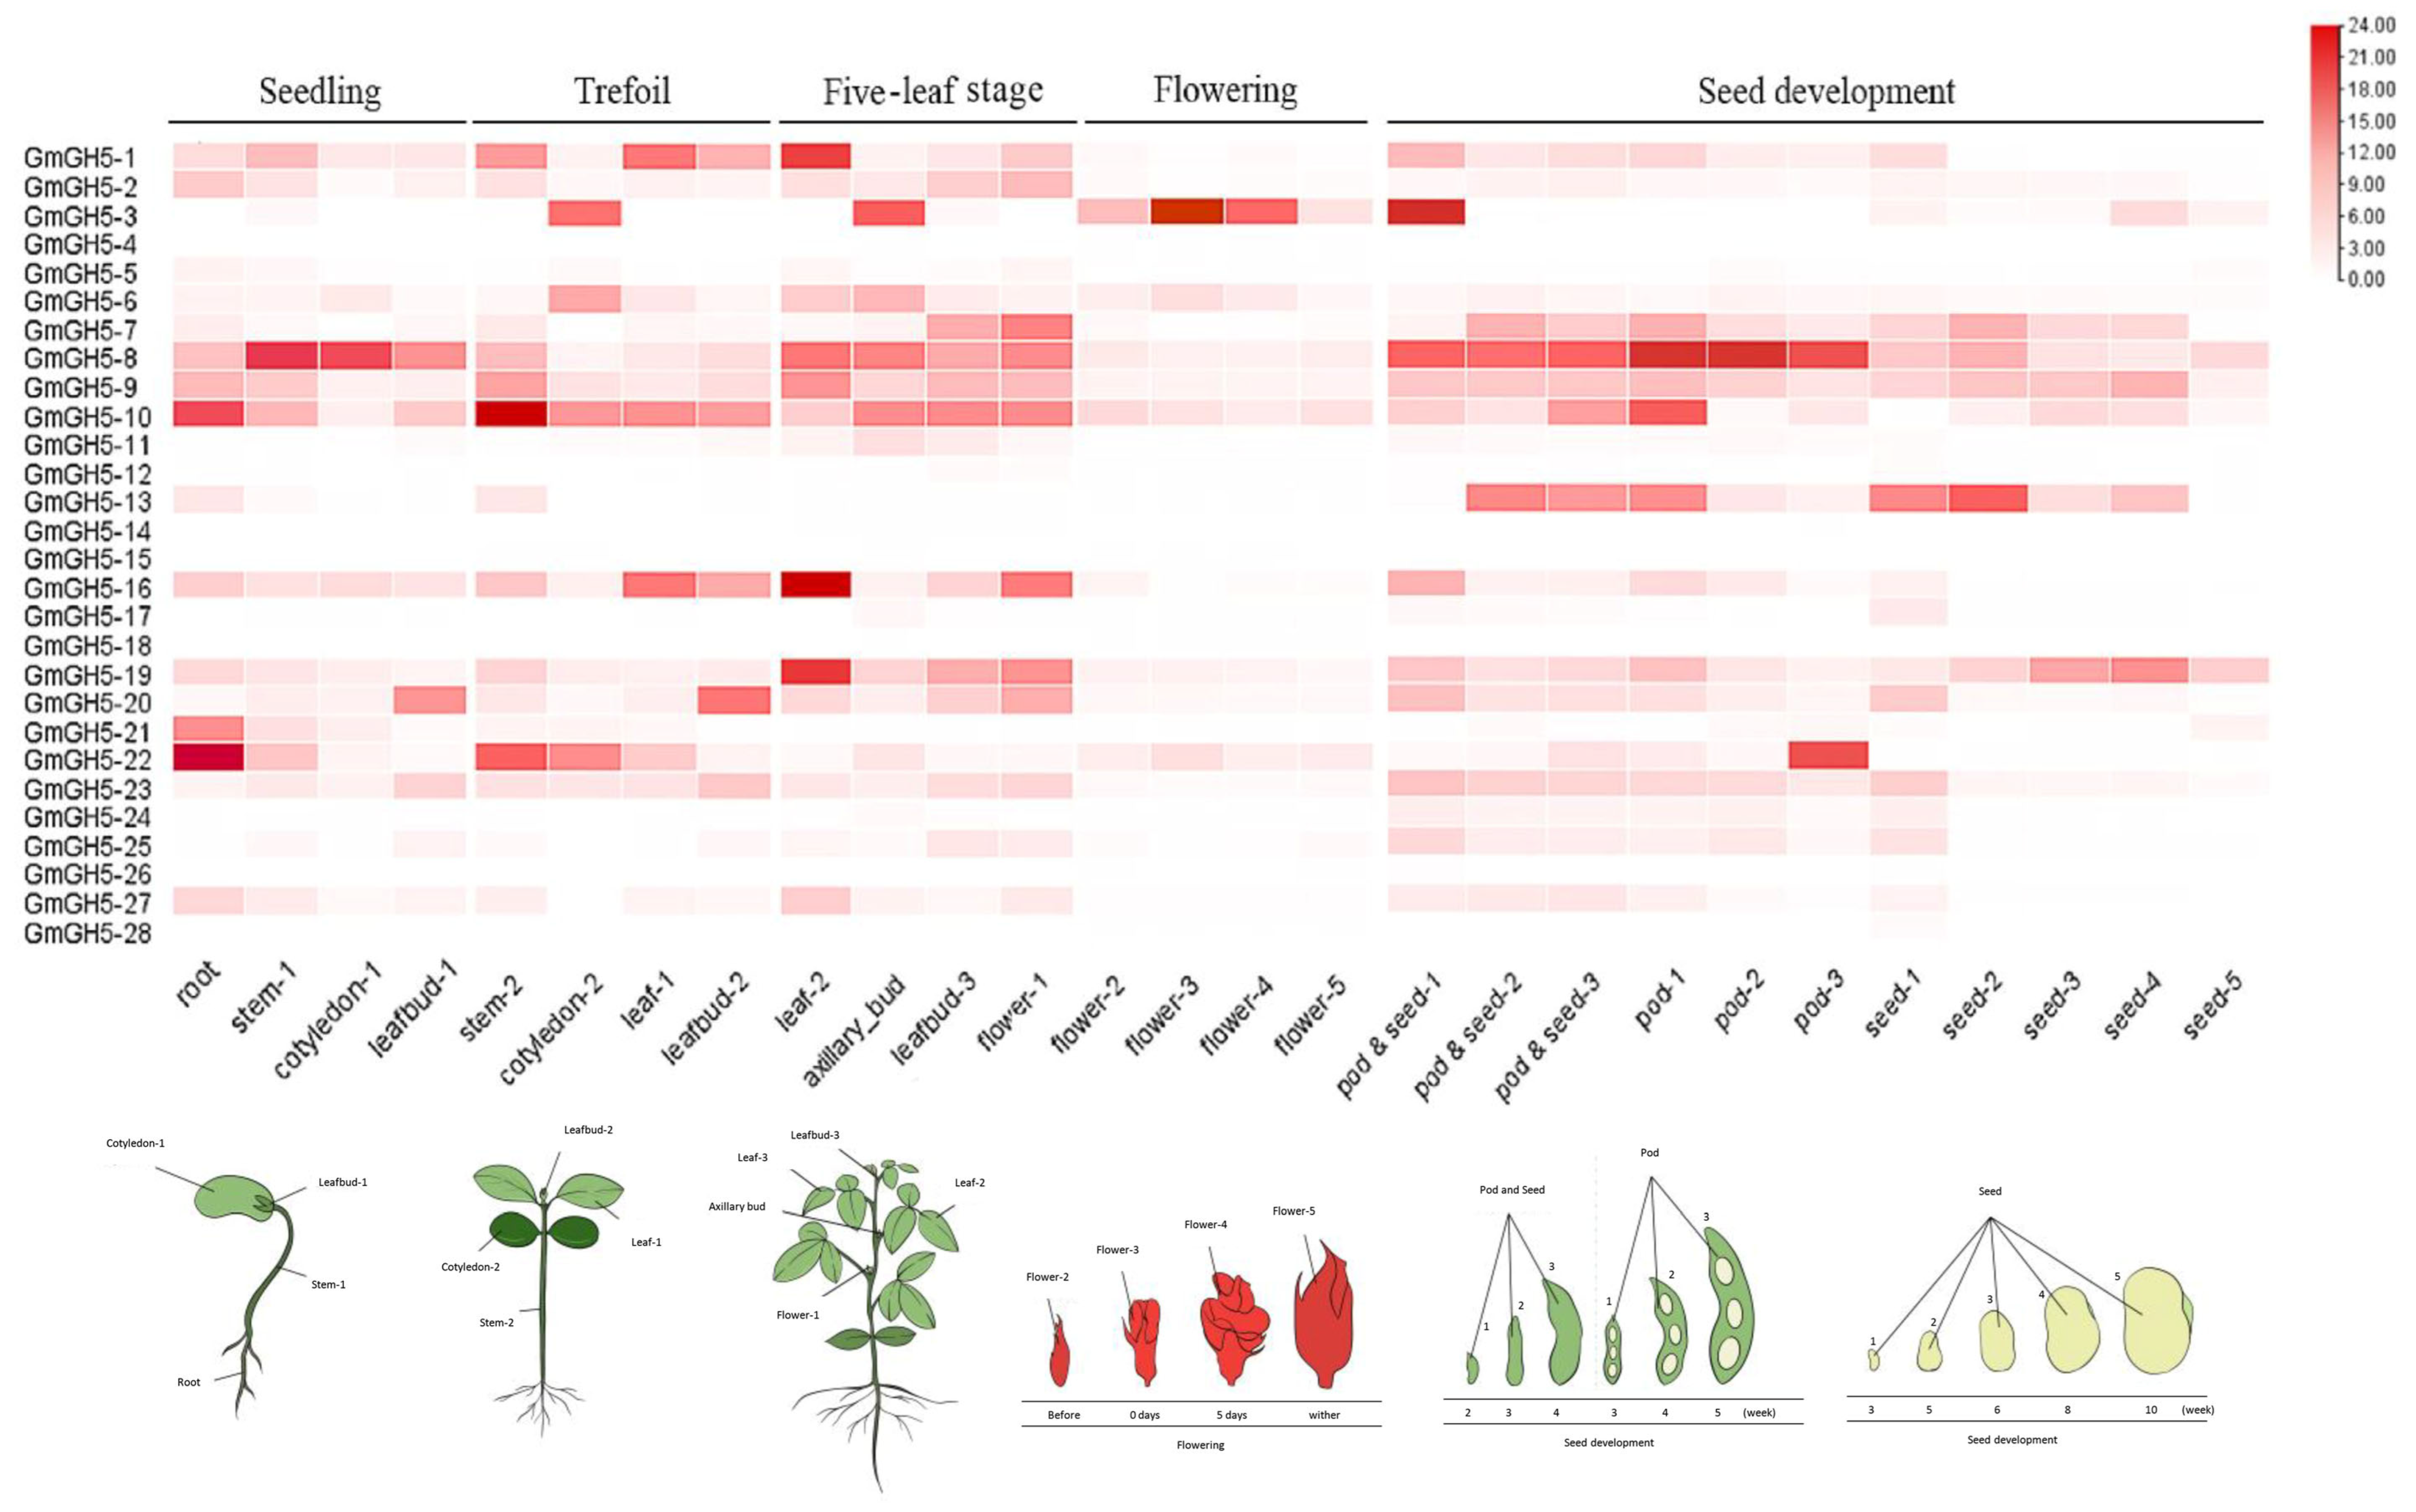
To elucidate the potential functions of the GmGH5 gene family during soybean development, we analyzed the expression profiles of 28 members across 27 tissues/developmental stages using the SoyOmics database (Figure 5). The heatmap revealed highly tissue-specific spatiotemporal expression patterns among the family members. At the seedling stage, expression exhibited distinct organ specificity: GmGH5-22 was preferentially enriched in roots, exhibiting the highest expression level among all tissues in this stage, whereas GmGH5-8 showed peak expression in stems and cotyledons. Upon entering the trefoil stage, GmGH5-10 was significantly upregulated in stems. At the five-leaf stage (vegetative growth), GmGH5-1, GmGH5-16, and GmGH5-19 were predominantly enriched in the leaf. During the reproductive stage, the expression profiles underwent significant reprogramming. At the flowering stage, GmGH5-3 was markedly induced. During seed development, expression patterns further diverged: the specific enrichment of GmGH5-3 shifted from flowers to pods and early seeds (pod & seed-1); GmGH5-8 exhibited sustained high expression in pods (pod-1 to -3) and early seeds (seed-1 to -3); and GmGH5-22 showed transient high expression in pods (pod-3). Among these, GmGH5-22 displayed tissue-specific enrichment in roots at the seedling stage and in pods (pod-3) during late reproduction. This pattern suggests its involvement in root abiotic stress responses and reproductive development.

2.7. Expression Patterns of GmGH5s Under Abiotic Stresses

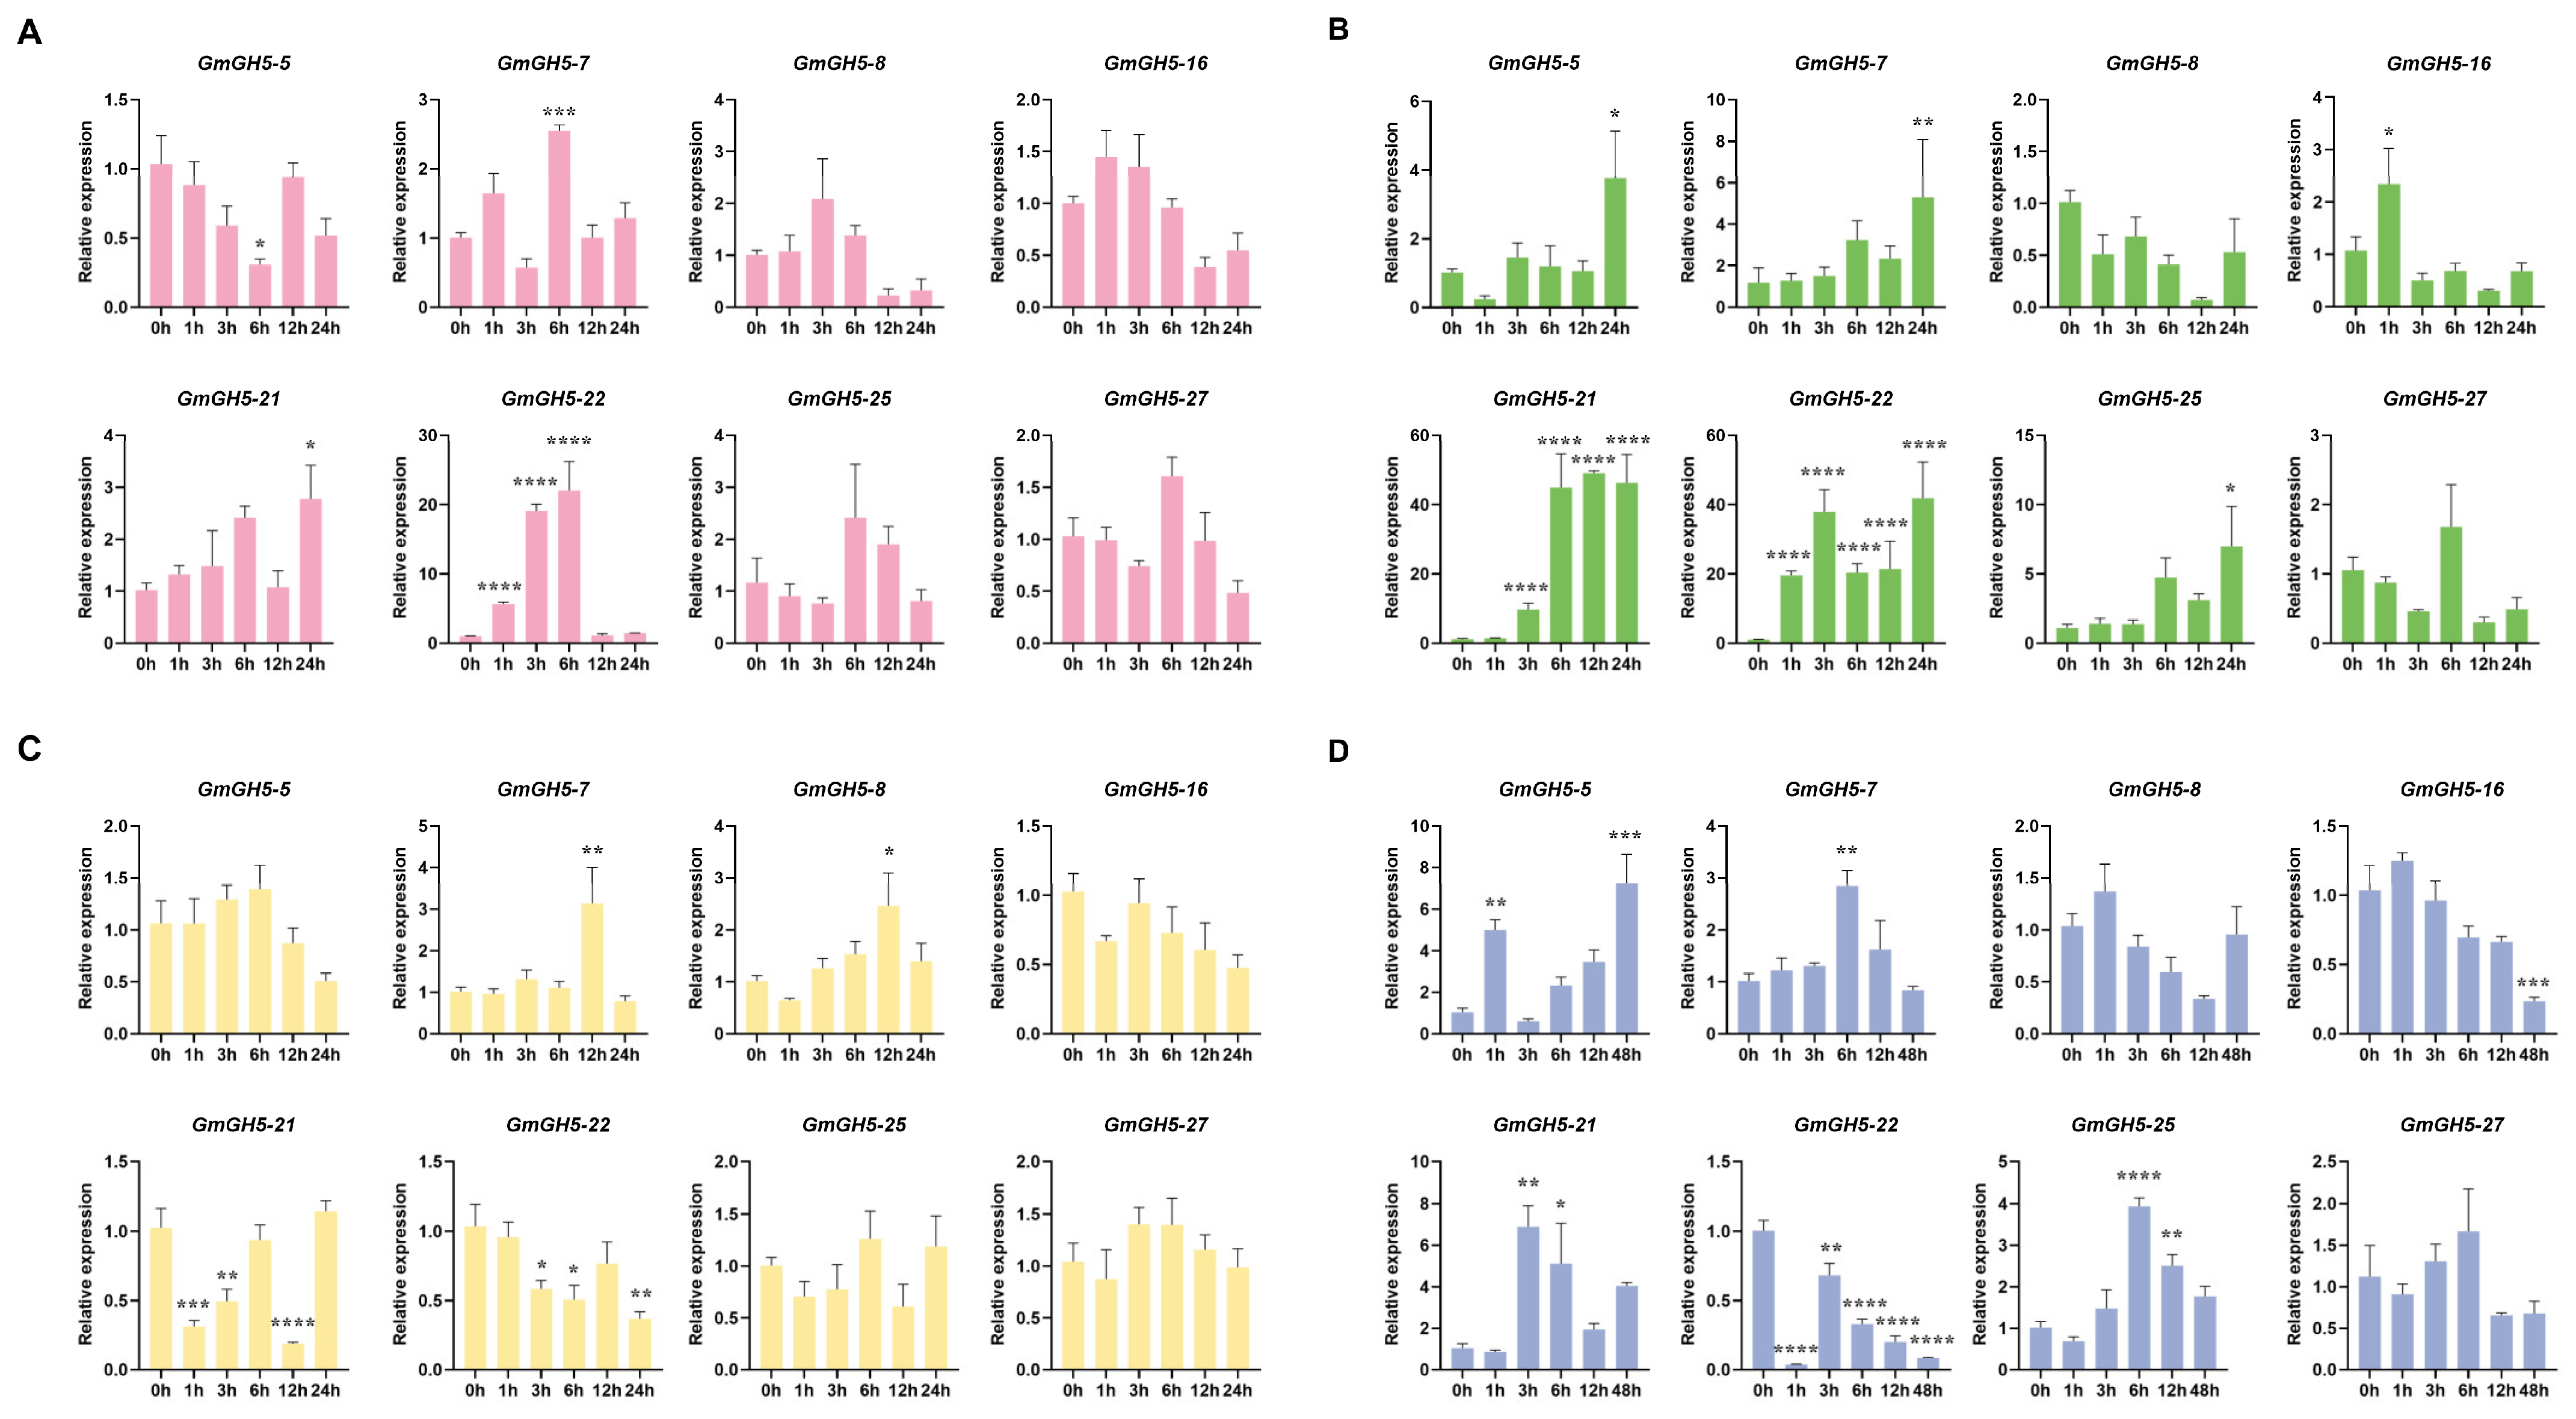
Combining tissue-specific expression data with phylogenetic analysis, eight GmGH5 genes distributed across three distinct subgroups were chosen for further validation, and their relative transcript levels under salt, alkaline, cold, and drought stresses were determined by RT-qPCR (Figure 6). Under salt stress, GmGH5-7, GmGH5-21, and GmGH5-22 were all up-regulated, with GmGH5-22 showing the most pronounced increases. By contrast, GmGH5-8, GmGH5-16, GmGH5-25, and GmGH5-27 showed no significant changes (Figure 6A). Under alkaline stress, most GmGH5 genes in roots were up-regulated except GmGH5-8 (Figure 6B). GmGH5-21 and GmGH5-22 exhibited the most pronounced increases, whereas GmGH5-27 showed no significant changes. Under cold stress, GmGH5-7 and GmGH5-8 were up-regulated, whereas GmGH5-21 and GmGH5-22 were down-regulated (Figure 6C). Under drought stress, GmGH5-5, GmGH5-7, GmGH5-21, and GmGH5-25 were up-regulated, while GmGH5-22 was significantly down-regulated (Figure 6D). In summary, expression pattern analysis revealed the potential involvement of GmGH5s, particularly GmGH5-22 in salt and alkaline stress responses.

2.8. Subcellular Localization of GmGH5-22

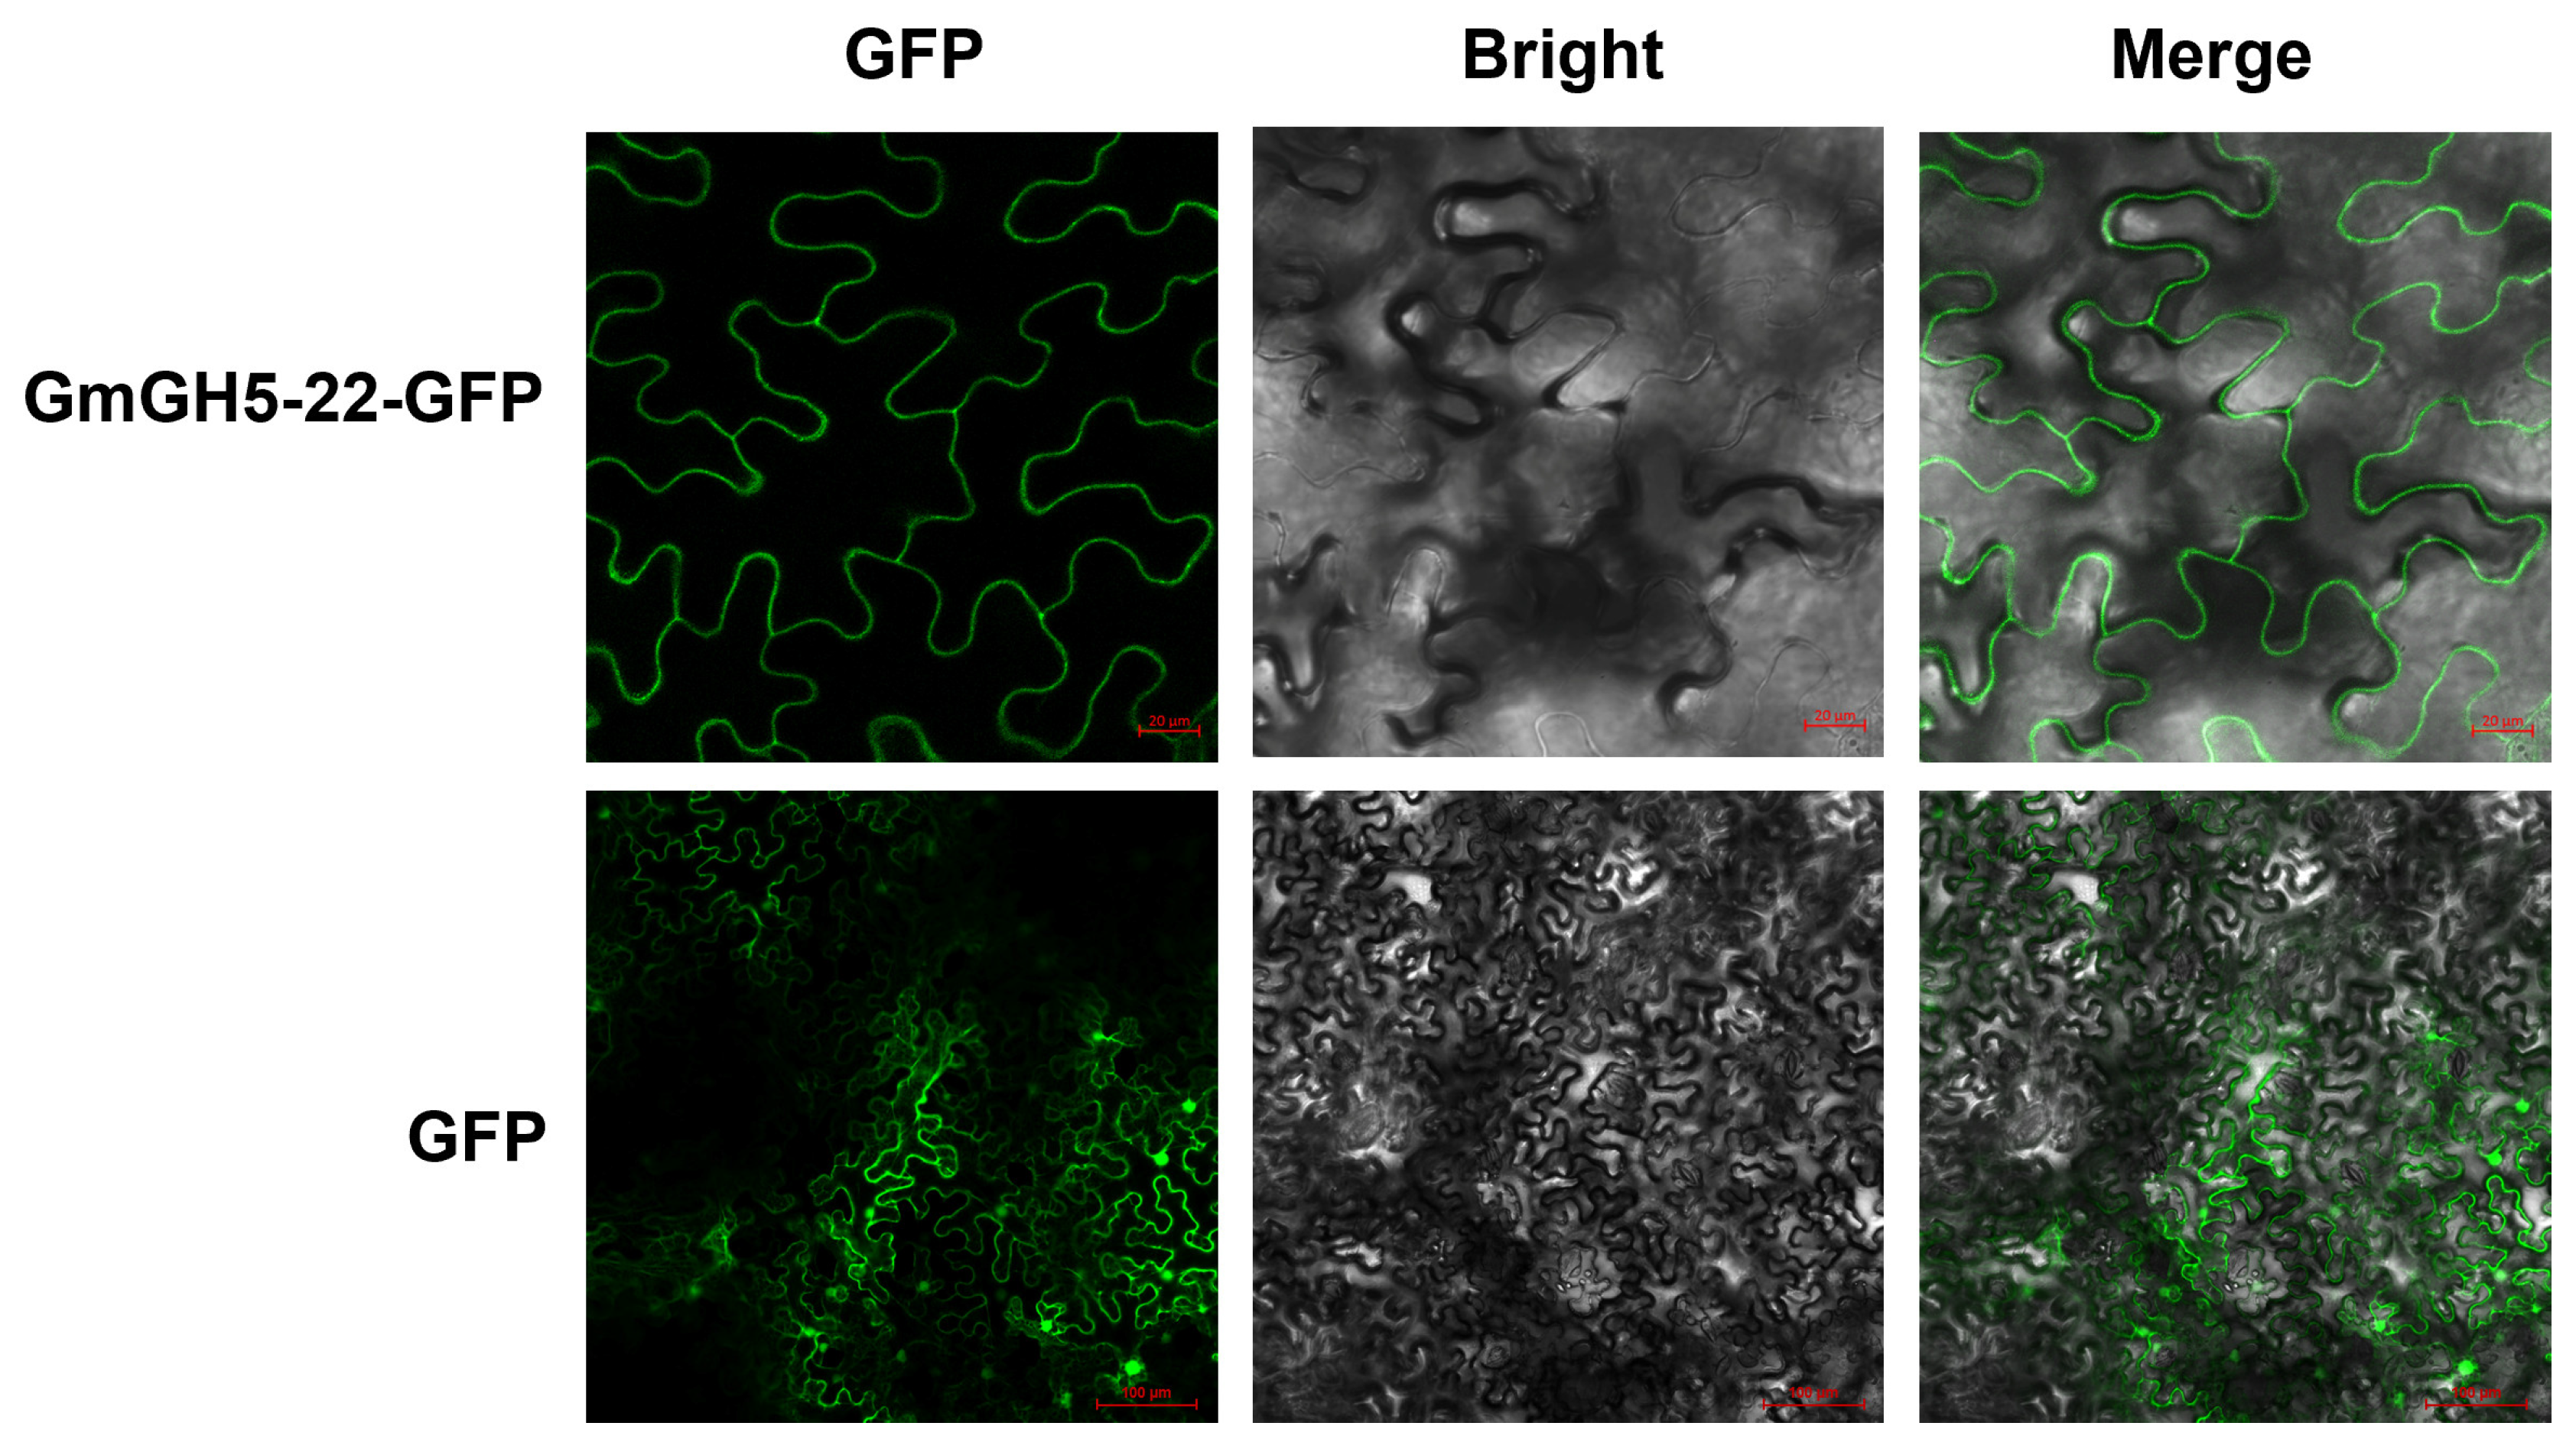
In silico analyses using SignalP 6.0 for signal peptide prediction, together with DeepLoc, CELLO, and Novopro for subcellular localization, predicted that GmGH5-22 possesses an N-terminal signal peptide and is targeted to the extracellular space (Figure S1), suggesting its potential role as a cell wall-associated protein. To further investigate its subcellular localization, a GmGH5-22-GFP fusion construct was transiently expressed in Nicotiana benthamiana leaves. Confocal microscopy revealed that GmGH5-22-GFP fluorescence was predominantly localized to the cell periphery (Figure 7). Taken together, these complementary results indicate that GmGH5-22 is highly likely a cell wall/extracellular protein.

2.9. GmGH5-22 Positively Regulates Salt Stress Tolerance

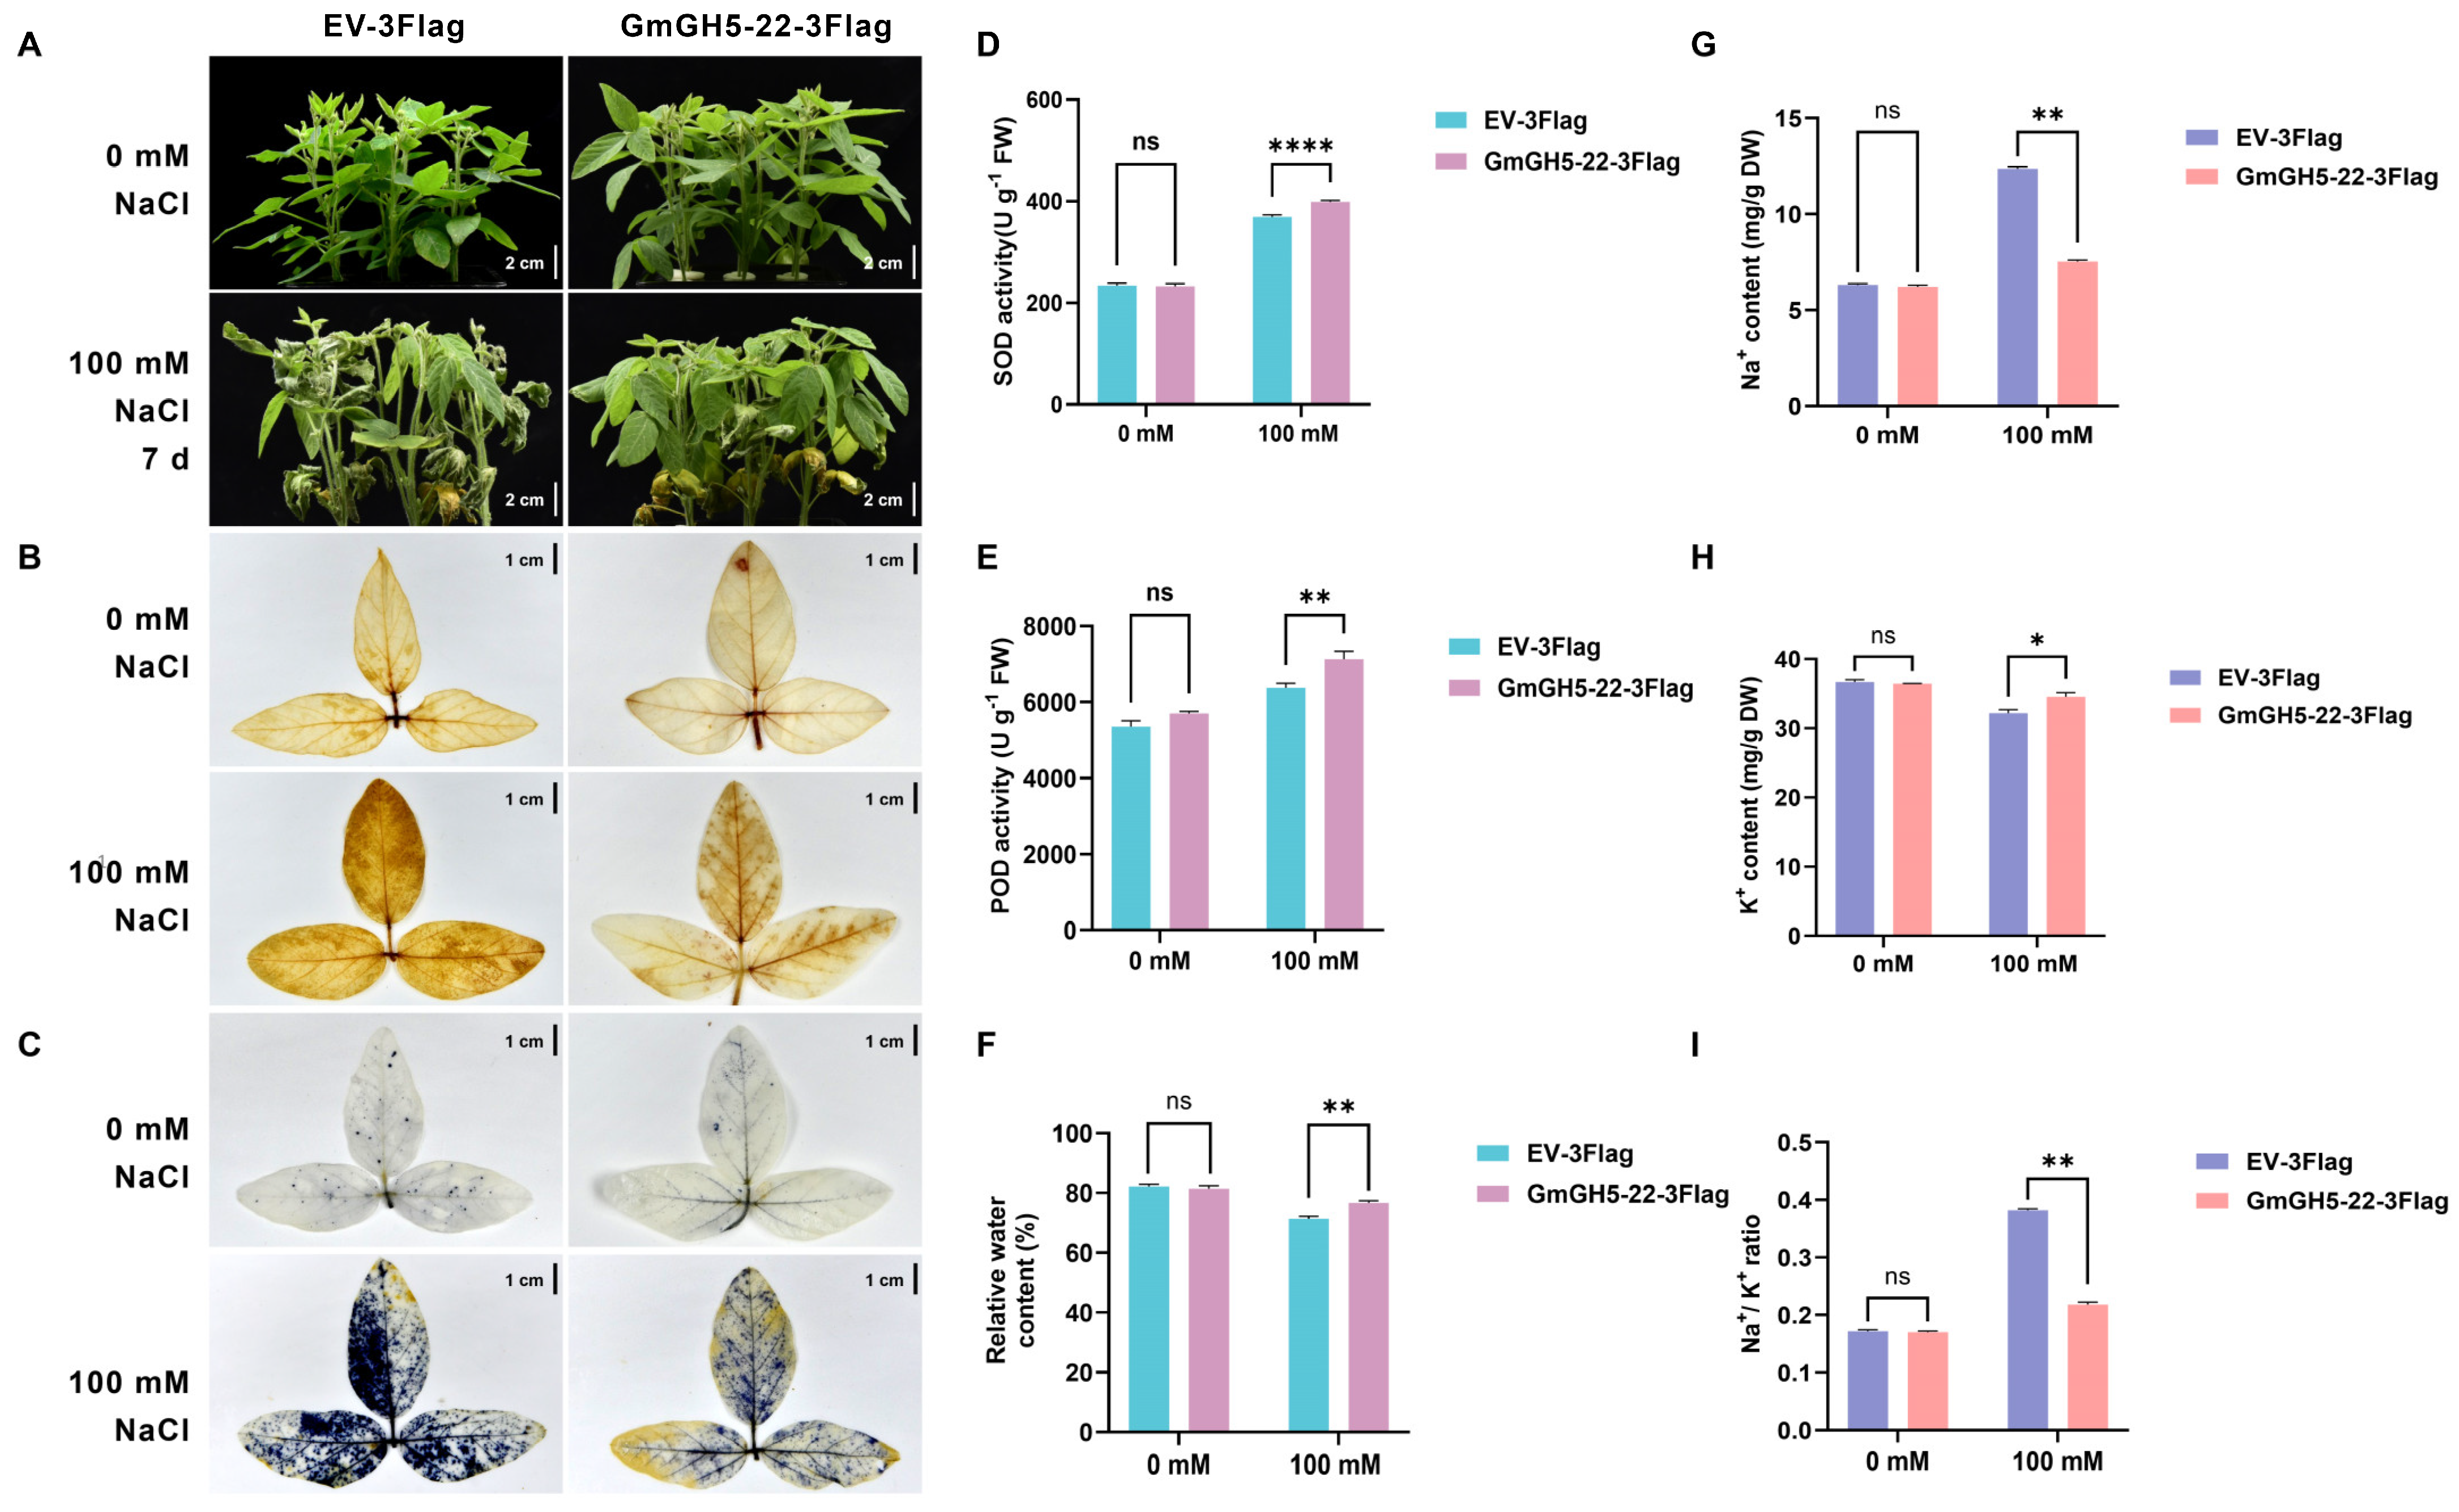
To elucidate the role of GmGH5-22 in salt stress responses, we generated soybean hairy root composite plants transformed with either GmGH5-22-3Flag or the empty vector control (EV-3Flag) and compared their phenotypes under salt stress. The GmGH5-22-3Flag composite plants were confirmed to be transgenic positive by PCR and RT-qPCR (Figure S2). As shown in Figure 8A, following 7 days of 100 mM NaCl treatment, GmGH5-22-3Flag composite plants exhibited significantly less severe leaf wilting and chlorosis than the EV-3Flag. DAB and NBT staining revealed lower accumulation of H2O2 and O2 in leaves of GmGH5-22-3Flag composite plants compared with EV-3Flag (Figure 8B,C). Moreover, GmGH5-22-3Flag composite plants exhibited significantly higher SOD and POD activities than EV-3Flag (Figure 8D,E). In addition, GmGH5-22-3Flag plants showed a significant increase in shoot RWC relative to EV-3Flag under salt stress (Figure 8F). Furthermore, ion content analysis in roots revealed that GmGH5-22-3Flag hairy roots accumulated significantly less Na+ and maintained higher K+ levels than EV-3Flag under salt stress, resulting in a substantially lower Na+/K+ ratio (Figure 8G–I). Consistent with the shoot phenotype, GmGH5-22-3Flag composite plants exhibited better root morphology under salt stress (Figure S3A) and significantly higher SOD and POD activities in roots than the EV-3Flag (Figure S3B,C). Our results showed that GmGH5-22 overexpression enhanced salt tolerance.

3. Discussion

The GH5 gene family, characterized by the conserved GH5 domain, has been implicated in various biological processes, including plant growth, development, and abiotic stress responses [23,24]. In this study, a genome-wide analysis identified 28 GH5 genes in the soybean. We further characterized GmGH5-22 as a positive regulator of salt tolerance, as its overexpression significantly enhanced plant resistance to salt stress. This study not only elucidates the evolutionary landscape of the GmGH5 family but also provides a promising candidate gene for improving crop salinity tolerance.
To provide evolutionary context for the GH5 family in the soybean, the GH5 family in the soybean (this study) is compared with those in rice and Arabidopsis based on previous reports. Soybean contains 28 GH5 genes, versus 17 in rice [24] and 8 in Arabidopsis, suggesting a striking lineage-specific expansion in the paleopolyploid soybean genome [28]. The four-group topology (Groups I–IV) is fully retained in rice, but Groups III and IV are absent in Arabidopsis, and Group IV is also lost in the soybean, suggesting that the four-group structure predates monocot–dicot divergence, followed by independent dicot losses. Group I contains the majority of soybean GH5 members (16/28, 57.1%) and has expanded prominently in the Glycine lineage. In this study, soybean GH5 genes displayed diverse tissue-specific expression patterns, with several members (e.g., GmGH5-22) showing notable root enrichment. In rice, individual GH5 members have been reported to be expressed in shoots, leaf sheaths, anthers, and seeds [23,24,29]. In Arabidopsis, individual GH5 members have been shown to be expressed in roots, stems, leaves, seeds, and inflorescences [30,31,32], although systematic expression profiling across the entire family is lacking. We further examined the potential involvement of GH5 members in stress responses at the transcriptional level. In this study, several soybean GH5 members exhibited transcriptional changes under salt, alkaline, cold, and drought stresses. In rice, both a stress-inducible GH5 β-glucosidase (GH5BG) and GH5_11 subfamily genes have been shown to be transcriptionally regulated by multiple abiotic stresses [23,33]. In Arabidopsis, GH5_11 subfamily members have been reported to be transcriptionally regulated by multiple abiotic stresses [33], while heterologous expression of the GH5 mannanase gene MirMAN from Mirabilis jalapa in Arabidopsis enhanced root development and salt tolerance, suggesting a functional role for GH5 enzymes in abiotic stress adaptation [22]. Collectively, these findings set the stage for a detailed analysis of the expression, evolution, and potential stress-related functions of the GmGH5 members.
The 28 GmGH5 proteins exhibit striking diversity in protein length, domain architecture, and physicochemical properties, suggesting potential functional divergence. This diversity is further reflected in their protein targeting features. Specifically, 23 members possessed N-terminal signal peptides, whereas the remaining five, which lacked signal peptides, all contained transmembrane domains (9–35 aa), suggesting that most GmGH5 proteins are targeted to the secretory pathway, either as secreted proteins or as membrane-anchored forms, a hallmark of the plant secretome [34]. Two members, GmGH5-12 and GmGH5-17, additionally harbored an RICIN (R-type lectin) domain, indicating a modular architecture potentially involved in carbohydrate recognition. Similar two-domain proteins composed of a glycoside hydrolase and a ricinB lectin domain have been identified as a novel class of plant proteins with synergistic catalytic and binding activities [35]. Consistent with this notion, subcellular localization predictions revealed that GmGH5 members are predominantly distributed in the cytoplasm (16 members) and the cell wall (10 members), with only a few members predicted to localize to the nucleus (2 members). Notably, several members showed dual or even triple localization predictions, involving the chloroplast, vacuole, plasma membrane, and Golgi apparatus, indicating that a subset of GmGH5 proteins may function in multiple compartments. This heterogeneous compartmental distribution suggests functional divergence among GmGH5 paralogs, consistent with the view that plant glycosyl hydrolases have undergone extensive subcellular retargeting during evolution [36].
The subgroup classification was further corroborated by analyses of conserved motifs and gene structures. MEME analysis predicted 15 conserved motifs (Motif 1–15), which were largely shared among members of the same clade but varied markedly between subclades. Likewise, the GmGH5 genes contained 2 to 7 introns, with intron number and length exhibiting subfamily-dependent variation: genes within the same subfamily shared similar intron structures, whereas those from different subfamilies diverged substantially. Taken together, this clade-specific conservation at both the motif and exon–intron levels provides independent support for the phylogenetic grouping and implies that members of the same subclade are likely to perform similar biological functions. The 28 GmGH5 genes were non-randomly distributed across 13 chromosomes, with tandem arrays observed at several loci (e.g., GmGH5-3/GmGH5-4 and GmGH5-5/GmGH5-6/GmGH5-7). However, synteny analysis identified 24 segmental duplication gene pairs, substantially outnumbering tandem events, indicating that inter-chromosomal segmental duplications served as the primary driver of GmGH5 family expansion, a pattern consistent with findings in numerous soybean gene families [37,38]. The presence of interconnected gene modules across multiple chromosomes, such as the cluster linking GmGH5-1 (Chr01), GmGH5-8 (Chr06), GmGH5-16 (Chr11), GmGH5-24 (Chr14), and GmGH5-25 (Chr17), further supports the retention of duplicates following whole-genome duplication events, which is consistent with the well-documented WGD history of soybeans that has experienced at least two rounds of polyploidization [39]. Robust duplication pairs on homeologous chromosomes, including GmGH5-1/GmGH5-16 and GmGH5-2/GmGH5-27, reinforce the scenario that large-scale genomic duplications have substantially shaped the current GmGH5 gene repertoire.
The promoters of GmGH5 genes harbour diverse cis-regulatory elements associated with stress responsiveness (e.g., MYB, MYC, AREs), hormone signalling (ABRE, ERE, CGTCA-motif), and development (Box4). This arrangement suggests that GmGH5 genes may function as regulatory hubs integrating environmental cues with endogenous developmental programmes, a feature commonly observed in gene families involved in cell wall metabolism [8]. The GmGH5 members showed highly tissue-specific expression patterns. GmGH5-22 was predominantly expressed in roots, whereas GmGH5-1/19/16 were enriched in leaves, and GmGH5-3/8 in pods and seeds. This expression divergence suggests the possibility that segmental duplications, followed by subfunctionalization or neofunctionalization, may have partitioned ancestral functions among duplicated copies [40,41], although direct evidence for such functional partitioning awaits enzymatic and transgenic assays. Stress-dependent expression profiling of eight selected members was consistent with this functional diversification. Salt and alkaline stresses induced an overlapping set of genes including GmGH5-22, suggesting their involvement in ionic stress responses. Cold and drought, however, triggered opposing patterns, with GmGH5-22 being repressed under these conditions. This stress-specific regulatory logic may be partly explained by the differential distribution of ABRE, DRE [42,43] and MYB elements in individual promoters, although these predictions require experimental validation to confirm their actual contribution to stress-responsive regulation. Collectively, the promoter architecture and expression divergence are consistent with the functional diversification of the GmGH5 family, wherein distinct paralogs appear to have acquired specialized roles in both development and stress adaptation. Among the stress-inducible members, GmGH5-22 was prioritized for functional characterization based on its sustained upregulation under salt and alkaline stresses and its root-preferential expression.
The salt tolerance of GmGH5-22-overexpressing hairy roots was correlated with multiple physiological improvements. These observations establish GmGH5-22 as a functional positive regulator of salt tolerance in this transient system. Regarding the underlying mechanism, as a putative glycoside hydrolase, GmGH5-22 may participate in cell wall remodelling. One possible model is that this process releases oligosaccharides into the apoplast, where they are recognized as DAMPs by membrane-localized receptors, which in turn elicit downstream defence signalling, including the upregulation of antioxidant systems [44,45]. This hypothesis finds indirect support from earlier studies: the salt-inducible rice GH5 β-glucosidase GH5BG is secreted to the apoplast and exhibits broad substrate specificity toward various β-linked oligosaccharides [23]; similarly, heterologous expression of the GH5 β-mannanase MirMAN in Arabidopsis enhanced salt tolerance with elevated SOD, POD, and CAT activities and reduced ROS accumulation [22]. Consistent with these reports, our observations of elevated SOD and POD activities in GmGH5-22-overexpressing hairy roots suggest that a conserved role for certain GH5 enzymes in reinforcing antioxidant capacity may operate across species. These findings suggest that GmGH5-22 may play a role in abiotic stress tolerance and that cell wall-derived signalling may be involved in salt stress responses in crops. Nevertheless, because the present study was conducted using a transient hairy root transformation system, the observed phenotypes await confirmation in stable transgenic lines, and the molecular mechanism, particularly the proposed DAMP-mediated signalling, remains speculative and requires further investigation.

4. Materials and Methods

4.1. GmGH5 Identification and Physicochemical Properties Analysis

The Hidden Markov Model (HMM) profile of the GH5 family (Pfam accession: PF00150) was retrieved from the Pfam database (http://pfam.xfam.org/) (accessed on 2 February 2025) [46]. Using HMMER3.0 [47], the HMM profile was employed to search against the soybean proteome to identify candidate GH5 genes. Candidate sequences were further validated by analyzing the presence of GH5-specific catalytic domains using SMART [48] and CDD [49]. Signal peptides were predicted using SignalP-5.0 (http://www.cbs.dtu.dk/services/SignalP/) (accessed on 4 March 2025). Transmembrane domains were predicted using TMHMM-2.0 (http://www.cbs.dtu.dk/services/TMHMM/) (accessed on 19 March 2025). Biochemical characteristics of GmGH5 proteins, including protein length, molecular weight (MW) and theoretical isoelectric point (pI), were computed using TBtools [50] with default settings. Subcellular localization of soybean GH5 family members was predicted using Plant-mPloc [51] (http://www.csbio.sjtu.edu.cn/bioinf/) (accessed on 22 March 2025). To further characterize GmGH5-22, its signal peptide and subcellular localization were predicted using SignalP 6.0 (https://services.healthtech.dtu.dk/services/SignalP-6.0/) (accessed on 4 April 2025), DeepLoc 2.0 (https://services.healthtech.dtu.dk/services/DeepLoc-2.0/) (accessed on 20 April 2026), CELLO (http://cello.life.nctu.edu.tw/) (accessed on 2 June 2026), and the Novopro protein localization tool (https://www.novopro.cn/tools/protein-localization.html) (accessed on 2 June 2026).

4.2. Chromosomal Localization and Phylogenetic Analysis

Chromosomal localization was performed using the GTF/GFF feature of TBtools software, based on the genome annotation file of the soybean. Gene density along the chromosome was calculated using the Gene Density Profile tool (TBtools-II, Version 128, Windows-x64).
The protein sequences of GH5s from Glycine max (Wm82.a4.v1), Oryza sativa (MSU v7.0), and Arabidopsis thaliana (TAIR10) were retrieved from the Phytozome database (https://data.jgi.doe.gov/refine-download/phytozome) (accessed on 4 January 2025). The neighbor-joining (NJ) algorithm was adopted to construct an unrooted phylogenetic tree. The bootstrap test was performed with 1000 replicates. All other parameters were kept at default settings.

4.3. Collinearity Analysis of GmGH5s

Collinearity analysis of soybean GH5 genes was performed using Matrix MCScanX (TBtools-II, Version 128, Windows-x64), and the results were visualized using TBtools-II [50].

4.4. Analysis of Cis-Acting Elements

The 2000 bp genomic sequences upstream of the transcription start site (TSS) of each gene were retrieved from the soybean genome using TBtools software [50]. Cis-acting regulatory elements located in these promoter regions were predicted and characterized using the PlantCARE online tool (https://bioinformatics.psb.ugent.be/webtools/plantcare/html/) (accessed on 21 June 2025) [52]. The resulting annotations were visualized using TBtools-II [50].

4.5. Analysis of Tissue-Specific Gene Expression

Raw expression data of GmGH5s in different tissues were downloaded from the SoyOmics online database (accession number: CRA008947; https://ngdc.cncb.ac.cn/soyomics/index) (accessed on 29 June 2025). This dataset comprises multiple soybean accessions, including the reference cultivars ZH13 and Wm82, as well as accessions classified as Cultivar (SoyC01–SoyC14), Landrace (SoyL01–SoyL09), and Wild (SoyW01–SoyW03 and W05) in the database. Gene expression heatmaps were drawn using TBtools-II [50].

4.6. Plant Materials and Stress Treatments

Seeds of soybean cultivar DN50 were surface-sterilized with 10% NaClO for 3–5 min, rinsed with distilled water, and germinated for 1–3 days. The germinated seeds were then transplanted into vermiculite and cultured until cotyledon expansion. Subsequently, soybean seedlings were transferred to 1/4 Hoagland nutrient solution and grown hydroponically until the V2 stage. The V2 growth stage was defined as the stage at which the second trifoliate leaf on the third node was fully expanded [53]. Under our growth conditions, plants reached this stage at 16 days after sowing. Uniform V2-stage soybean seedlings were exposed to salt (200 mM NaCl), alkaline (50 mM NaHCO3), drought (20% PEG 6000), or cold (4 °C). Stress initiations were staggered so that roots corresponding to the 0, 1, 3, 6, 12, and 24 h post-treatment time points were harvested simultaneously (0 h = untreated control). All samples were snap-frozen in liquid nitrogen and stored at −80 °C. Three biological replicates and three technical replicates were included for each time point.

4.7. RNA Extraction and RT-qPCR

Total RNA was isolated via the TRIzol method [54], and the concentration and integrity were evaluated with a NanoDrop spectrophotometer (GE Healthcare, Little Chalfont, UK). RNA integrity was detected by 1.2% agarose gel electrophoresis. cDNA was synthesized using 5× HiScript III RT SuperMix (Vazyme Biotech Co., Ltd., Nanjing, China). RT-qPCR was performed using gene-specific primers with Tubulin as the internal reference gene (listed in Table S1). RT-qPCR was performed using SYBR Green qPCR Mix (Thermo Fisher Scientific, Waltham, MA, USA), with 30 cycles set. The amplification efficiency and specificity for each primer set were confirmed by amplification curve and melting curve analysis, respectively (see representative image in Figure S4). Gene expression was measured by the 2−∆∆Ct method. Three independent biological replicates were analyzed, each with three technical replicates, and the results were expressed as the mean of three biological replicates. Statistical significance was analyzed using GraphPad Prism 10 software, and differences were considered significant at p < 0.05.

4.8. Subcellular Localization Analysis of GmGH5-22

The full-length coding region of GmGH5-22 without the stop codon was cloned and inserted into the pGreen II-62-SK-GFP vector to express the GmGH5-22-GFP fusion proteins. The empty GFP was used as a control. The indicated constructs were introduced into the Agrobacterium tumefaciens GV3101 + p19, which was then infiltrated into Nicotiana benthamiana leaves for 3 d. Fluorescence was collected using the confocal laser-scanning microscope (Leica SP8, Wetzlar, Germany), with an excitation wavelength of 488 nm and an emission wavelength of 514 nm.

4.9. Plasmid Construction and Soybean Hairy Root Transformation

The coding sequence of GmGH5-22 was amplified from DN50 soybean cDNA using KOD-Plus-Neo (TOYOBO Co., Ltd., Osaka, Japan) with the primers listed in Table S1. The amplicon was cloned into the plant expression vector pCAMBIA3301-3Flag, and the resulting construct (pCAMBIA3301-GmGH5-22-3Flag) was verified by sequencing at Sangon Biotech (Shanghai) Co., Ltd, Shanghai, China. The verified recombinant plasmid and the empty vector control were introduced into Agrobacterium rhizogenes strain K599 via freeze–thaw transformation. DN50 soybean seeds were grown in vermiculite for five days, after which the main roots were excised. For Agrobacterium-mediated transformation, bacterial cells were harvested and resuspended in infection buffer (1 mmol·L−1 MgCl2, 0.5 mmol·L−1 MES, and 100 μmol·L−1 acetosyringone) to an OD600 of 1.2, and the suspension was injected into the hypocotyl near the cotyledonary node. After infection, the seedlings were transplanted into vermiculite and cultured in a growth chamber with 70% relative humidity under a 16 h light/8 h dark photoperiod at 25 °C. Three weeks post-transformation, positive hairy roots were identified by PCR using GmGH5-22-F and NOS-R (Table S1) and then used for RT-qPCR to quantify target gene expression as described above.

4.10. Salt Stress Tolerance Assays of GmGH5-22-Overexpressing Soybean Hairy Roots

To evaluate the role of GmGH5-22 in salt stress tolerance, transgenic soybean hairy root composite plants overexpressing GmGH5-22 and empty-vector control plants were generated as described above. For stress treatment, plants were grown in 1/4 Hoagland solution for 1 d and then shifted to 1/4 Hoagland solution containing 100 mM NaCl. Each hydroponic box held 12 seedlings, with six boxes per construct and treatment. The new compound leaves were detached from hairy root composite soybean plants on the fourth day of treatment and subjected to nitro blue tetrazolium (NBT) and 3,3′-diaminobenzidine (DAB) staining according to the published protocol [55].
Superoxide dismutase (SOD) activity was assayed by the NBT photoreduction inhibition method [56]. Leaf samples (50 mg) were homogenized in 0.05 M PBS (pH 7.8) to obtain the enzyme extract. The extract was mixed with reaction solution containing 13 mM methionine, 75 μM NBT, 10 μM EDTA-Na2, and 2 μM riboflavin. After incubation at 25 °C for 25 min under light, absorbance was read at 560 nm. One unit of SOD is defined as the amount of enzyme causing 50% inhibition of NBT reduction.
Peroxidase (POD) activity was determined by the 2-methoxyphenol method [57]. Leaf samples (50 mg) were homogenized in 0.05 M PBS (pH 7.8) to prepare the enzyme extract. The extract was mixed with 0.4% H2O2 and 0.01 M 2-methoxyphenol. POD catalyzes the oxidation to 4-o-methylphenol, monitored at 470 nm. One unit of POD is defined as a 0.01 increase in absorbance per minute.
For relative water content (RWC) measurement, shoot fresh weight (FW) was recorded immediately after excision. Samples were then oven-dried at 105 °C for 30 min, followed by drying at 80 °C until constant weight to obtain dry weight (DW). RWC was calculated as RWC (%) = [(FW − DW)/FW] × 100.
For Na+ and K+ content measurement, the soybean hairy roots of GmGH5-22-3Flag and EV-3Flag composite plants were harvested after 24 h of 100 mM NaCl treatment. Root samples were washed three times with deionized water, subjected to 100 °C for 20 min to deactivate enzymes, dried at 65 °C for 24 h, and ground to a fine powder. The Na+ and K+ concentrations were determined by Nanjing Weibairui Testing Technology Co., Ltd. using a flame photometer. The Na+/K+ ratio was calculated accordingly. Three independent biological replicates were performed for each genotype.

4.11. Data Analysis

All statistical analyses were performed using GraphPad Prism 10 Software. Data are presented as means ± SE from at least three independent biological replicates. For experiments involving a single independent variable, one way analysis of variance (ANOVA) was applied. For experiments involving two independent variables (e.g., construct and treatment), comparisons between two groups (GmGH5-22-3Flag vs. EV-3Flag) were performed using Student’s t-test under each condition. In both cases, a p-value < 0.05 was considered statistically significant, with significance levels denoted as p < 0.05 (*), p < 0.01 (**), p < 0.001 (***), and p < 0.0001 (****), while p ≥ 0.05 was regarded as not significant (ns).

5. Conclusions

This study identified 28 GmGH5 family genes in the soybean through genome-wide analysis, and phylogenetic analysis grouped them into three subfamilies. Analysis of the exon–intron organization, conserved domains and motifs, gene duplication events and protein sequence identity suggested conservation of the GmGH5 family within the soybean. Expression analysis revealed the possible involvement of GmGH5s, especially GmGH5-22, in soybean responses to salt stresses. GmGH5-22 was highly expressed in roots, and was highly likely to be localized to the cell wall/extracellular space. Overexpression of GmGH5-22 in soybean hairy roots enhanced tolerance to salt stresses. Taken together, these findings establish a foundation for elucidating the roles and regulatory mechanisms of GmGH5s, particularly GmGH5-22, in response to salt stresses.

Supplementary Materials

The following supporting information can be downloaded at https://www.mdpi.com/article/10.3390/plants15172700/s1. Table S1. The primers used in this study. Figure S1. In silico prediction of the subcellular localization and signal peptide of GmGH5-22. (A–C) Subcellular localization of GmGH5-22 predicted by DeepLoc 2.0 (A), CELLO (B), and Novopro (C), respectively. All three independent tools consistently predicted GmGH5-22 to be localized to the extracellular space. (D) Signal peptide prediction using SignalP 6.0. The red line represents the signal peptide probability (n-score), the yellow line represents the hydrophobic region (h-score), and the green vertical dashed line indicates the predicted cleavage site (CS). Figure S2. Verification of GmGH5-22-overexpressing soybean hairy roots. (A) PCR identification of GmGH5-22-positive transgenic hairy roots. (B) RT-qPCR analysis of the relative expression of GmGH5-22 in GmGH5-22-3Flag and EV-3Flag soybean hairy roots. Figure S3. Overexpression of GmGH5-22 enhances salt tolerance in soybean hairy root composite plants (root phenotypes and antioxidant enzyme activities). (A) Root phenotypes of EV-3Flag and GmGH5-22-3Flag hairy root composite plants under control (0 mM) and 100 mM NaCl treatment for 7 days. (B,C) SOD activity (B) and POD activity (C) in the roots of EV-3Flag and GmGH5-22-3Flag composite plants under control and 100 mM NaCl treatment. Figure S4. Representative amplification curve and melting curve for RT-qPCR primers. (A) Amplification curves. (B) Melting curves.

Author Contributions

Conceptualization, X.C., L.R., and N.M.; methodology, L.R., N.M., X.G., W.L., B.J., and J.L.; software, X.C., L.R., N.M., X.G., W.L., and B.J.; formal analysis, J.L., Y.S., Y.W., and X.S.; data curation, X.C., L.R., and N.M.; writing—original draft preparation, X.C., and L.R.; writing—review and editing, M.S. All authors have read and agreed to the published version of the manuscript.

Funding

This study was supported by the Natural Science Foundation of Heilongjiang Province (LH2024C080); China Postdoctoral Science Foundation (2023MD73175); Postdoctoral Science Foundation of Heilongjiang Province (LBH-TZ2401); Startup Foundation of Heilongjiang Bayi Agricultural University (XYB202101); Heilongjiang Bayi Agricultural University Support Program for San Heng San Zong (ZRCPY202201); Open Project of Key Laboratory of Soybean Biology of Chinese Education Ministry (SBKF24-04); Project of Collaborative Innovation Achievements of “Double First-Class” Disciplines in Heilongjiang Province (LJGXCG2024-F20).

Data Availability Statement

The data that support the findings of this study are avail-able from the corresponding authors upon reasonable request due to privacy.

Conflicts of Interest

Author Mingzhe Sun was a post-doc of the company Beidahuang Kenfeng Seed Co., Ltd. The remaining authors declare that the research was conducted in the absence of any commercial or financial relationships that could be construed as a potential conflict of interest.

References

  1. FAO. Global Status of Salt-Affected Soils; Food and Agriculture Organization of the United Nations: Rome, Italy, 2024. [Google Scholar]
  2. Shi, Q.; Mo, W.; Zheng, X.; Zhao, X.; Chen, X.; Zhang, L.; Qin, J.; Yang, Z.; Zuo, Z. Balancing act: Progress and prospects in breeding soybean varieties with high oil and seed protein content. Front. Plant Sci. 2025, 16, 1560845. [Google Scholar] [CrossRef] [Scilit]
  3. Feng, C.; Gao, H.; Zhou, Y.; Jing, Y.; Li, S.; Yan, Z.; Xu, K.; Zhou, F.; Zhang, W.; Yang, X.; et al. Unfolding molecular switches for salt stress resilience in soybean: Recent advances and prospects for salt-tolerant smart plant production. Front. Plant Sci. 2023, 14, 1162014. [Google Scholar] [CrossRef] [Scilit]
  4. Dong, T.; Yan, L.; Wang, J.; Niu, Y.; Wang, L. Salt tolerance in soybean (Glycine max L.): A comprehensive review of molecular mechanisms, key regulators, and future perspectives for saline soil utilization. Plants 2025, 14, 3668. [Google Scholar] [CrossRef] [Scilit]
  5. Shelke, D.B.; Chambhare, M.R.; Nikalje, G.C. Wild and Cultivated Soybean: Mechanisms of Salt Tolerance and Agricultural Applications; IntechOpen: London, UK, 2026; Volume 67. [Google Scholar]
  6. Nasution, S.N.; Ghulamahdi, M.; Melati, M. Impact of salinity stress on soybean growth and yield under saturated soil culture in tidal lands: A comparative study of tolerant varieties. J. Trop. Crop Sci. 2024, 11, 287–298. [Google Scholar] [CrossRef] [Scilit]
  7. Hasanuzzaman, M.; Parvin, K.; Anee, T.I.; Masud, A.A.C.; Nowroz, F. Salt stress responses and tolerance in soybean. In Plant Stress Physiology-Perspectives in Agriculture; IntechOpen: London, UK, 2022; pp. 47–82. [Google Scholar]
  8. Le Gall, H.; Philippe, F.; Domon, J.M.; Gillet, F.; Pelloux, J.; Rayon, C. Cell wall metabolism in response to abiotic stress. Plants 2015, 4, 112–166. [Google Scholar] [CrossRef] [Scilit]
  9. Hu, Y.N.; Hu, Y.J.; Gao, S.; Luan, Z.; Zhang, T.; Guo, J.; Shi, L. Enhanced lignin and cellulose metabolism promote cell wall synthesis and growth of wild soybean HRA under alkali stress. Ann. Bot. 2025, 136, 1295–1311. [Google Scholar] [CrossRef] [Scilit]
  10. Tenhaken, R. Cell wall remodeling under abiotic stress. Front. Plant Sci. 2015, 5, 771. [Google Scholar] [CrossRef] [Scilit]
  11. Wolf, S. Cell wall signaling in plant development and defense. Annu. Rev. Plant Biol. 2022, 73, 323–353. [Google Scholar] [CrossRef] [Scilit]
  12. Debnath, J.; Morton, R.N.; Engelsdorf, T.; Gigli-Bisceglia, N. Plant cell wall remodeling and peptide signaling under abiotic and biotic stress. Plant Commun. 2026, 7, 101741. [Google Scholar] [CrossRef] [Scilit]
  13. Tariq, F.; Ma, C.; Zhao, S. Integrative dynamics of cell wall architecture and plant growth under salt stress. Front. Plant Sci. 2025, 16, 1644412. [Google Scholar] [CrossRef] [Scilit]
  14. Anderson, C.T.; Kieber, J.J. Dynamic construction, perception, and remodeling of plant cell walls. Annu. Rev. Plant Biol. 2020, 71, 39–69. [Google Scholar] [CrossRef] [Scilit]
  15. Jacobson, T.; Edwards, M.; Voiniciuc, C. Sharp solutions to cleave plant fibers. Curr. Opin. Biotechnol. 2024, 90, 103219. [Google Scholar] [CrossRef] [Scilit]
  16. Perrot, T.; Pauly, M.; Ramírez, V. Emerging roles of β-glucanases in plant development and adaptative responses. Plants 2022, 11, 1119. [Google Scholar] [CrossRef] [Scilit]
  17. Minic, Z. Physiological roles of plant glycoside hydrolases. Planta 2008, 227, 723–740. [Google Scholar] [CrossRef] [Scilit]
  18. Lombard, V.; Golaconda Ramulu, H.; Drula, E.; Coutinho, P.M.; Henrissat, B. The carbohydrate-active enzymes database (CAZy) in 2013. Nucleic Acids Res. 2014, 42, D490–D495. [Google Scholar] [CrossRef] [Scilit]
  19. Aspeborg, H.; Coutinho, P.M.; Wang, Y.; Brumer, H., III; Henrissat, B. Evolution, substrate specificity and subfamily classification of glycoside hydrolase family 5 (GH5). BMC Evol. Biol. 2012, 12, 186. [Google Scholar] [CrossRef] [Scilit]
  20. Hou, S.; Liu, Z.; Shen, H.; Wu, D. Damage-associated molecular pattern-triggered immunity in plants. Front. Plant Sci. 2019, 10, 646. [Google Scholar] [CrossRef] [Scilit]
  21. Zang, H.; Xie, S.; Zhu, B.; Yang, X.; Gu, C.; Hu, B.; Gao, T.; Chen, Y.; Gao, X. Mannan oligosaccharides trigger multiple defence responses in rice and tobacco as a novel danger-associated molecular pattern. Mol. Plant Pathol. 2019, 20, 1067–1079. [Google Scholar] [CrossRef] [Scilit]
  22. Xu, J.; Yang, C.; Ji, S.; Ma, H.; Lin, J.; Li, H.; Chen, S.; Xu, H.; Zhong, M. Heterologous expression of MirMAN enhances root development and salt tolerance in Arabidopsis. Front. Plant Sci. 2023, 14, 1118548. [Google Scholar] [CrossRef] [Scilit]
  23. Opassiri, R.; Pomthong, B.; Akiyama, T.; Nakphaichit, M.; Onkoksoong, T.; Ketudat Cairns, M.; Ketudat Cairns, J.R. A stress-induced rice (Oryza sativa L.) beta-glucosidase represents a new subfamily of glycosyl hydrolase family 5 containing a fascin-like domain. Biochem. J. 2007, 408, 241–249. [Google Scholar] [CrossRef] [Scilit]
  24. Gistelinck, K.; Madder, Z.; Verbeke, I.; Van Damme, E.J.M. Characterization of a rice GH5_11 gene associated with endosperm and seed traits. Plants 2025, 14, 3428. [Google Scholar] [CrossRef] [Scilit]
  25. Meng, Y.X.; Sun, Y.Q.; Zhao, X.M.; Wang, Y.; Li, X.Y.; Zhang, H.H.; Li, J.D.; Liu, Y.L. Genome-wide identification and expression analysis of GH5 gene family in foxtail millet (Setaria italica L.). Acta Agron. Sin. 2021, 47, 2151–2165. [Google Scholar]
  26. Li, L.; Nie, H.F.; Ye, W.X.; Zhao, Q.F.; Ji, W. Whole genome identification and bioinformatics analysis of grape GH5 gene family. Plant Physiol. J. 2023, 59, 909–922. [Google Scholar]
  27. Lin, C.J.; Cho, C.C.; Chen, S.C.; Lin, G.M.; Huang, C.Y.; Hsu, C.H. Unveiling the structural and biochemical characteristics of an acidophilic β-mannanase from soybean (Glycine max). J. Agric. Food Chem. 2025, 73, 25479–25490. [Google Scholar] [CrossRef] [Scilit]
  28. Roulin, A.; Auer, P.L.; Libault, M.; Schlueter, J.; Farmer, A.; May, G.; Stacey, G.; Doerge, R.W.; Jackson, S.A. The fate of duplicated genes in a polyploid plant genome. Plant J. 2013, 73, 143–153. [Google Scholar] [CrossRef] [Scilit]
  29. Xiang, X.; Zhang, P.; Yu, P.; Zhang, Y.; Yang, Z.; Sun, L.; Wu, W.; Khan, R.M.; Abbas, A.; Cheng, S.; et al. LSSR1 facilitates seed setting rate by promoting fertilization in rice. Rice 2019, 12, 31. [Google Scholar] [CrossRef] [Scilit]
  30. Wang, Y.; Vilaplana, F.; Brumer, H.; Aspeborg, H. Enzymatic characterization of a glycoside hydrolase family 5 subfamily 7 (GH5_7) mannanase from Arabidopsis thaliana. Planta 2014, 239, 653–665. [Google Scholar] [CrossRef] [Scilit]
  31. Wang, Y.; Azhar, S.; Gandini, R.; Divne, C.; Ezcurra, I.; Aspeborg, H. Biochemical characterization of the novel endo-β-mannanase AtMan5-2 from Arabidopsis thaliana. Plant Sci. 2015, 241, 151–163. [Google Scholar] [CrossRef] [Scilit]
  32. Iglesias-Fernández, R.; Rodríguez-Gacio, M.C.; Barrero-Sicilia, C.; Carbonero, P.; Matilla, A.J. Three endo-β-mannanase genes expressed in the micropylar endosperm and in the radicle influence germination of Arabidopsis thaliana seeds. Planta 2011, 233, 25–36. [Google Scholar] [CrossRef] [Scilit]
  33. Chen, R.; Yao, Y.; Fang, H.; Zhang, E.; Li, P.; Xu, Y.; Yin, S.; Huangfu, L.; Sun, G.; Xu, C.; et al. Origin, evolution and functional characterization of the land plant glycoside hydrolase subfamily GH5_11. Mol. Phylogenet. Evol. 2019, 138, 205–218. [Google Scholar] [CrossRef] [Scilit]
  34. Agrawal, G.K.; Jwa, N.S.; Lebrun, M.H.; Job, D.; Rakwal, R. Plant secretome: Unlocking secrets of the secreted proteins. Proteomics 2010, 10, 799–827. [Google Scholar] [CrossRef] [Scilit]
  35. Van Holle, S.; De Schutter, K.; Eggermont, L.; Tsaneva, M.; Dang, L.; Van Damme, E.J.M. Comparative study of lectin domains in model species: New insights into evolutionary dynamics. Int. J. Mol. Sci. 2017, 18, 1136. [Google Scholar]
  36. Kfoury, B.; Rodrigues, W.F.C.; Kim, S.J.; Brandizzi, F.; Del-Bem, L.E. Multiple horizontal gene transfer events have shaped plant glycosyl hydrolase diversity and function. New Phytol. 2024, 242, 809–824. [Google Scholar] [CrossRef] [Scilit]
  37. Sangi, S.; Araújo, P.M.; Coelho, F.S.; Gazara, R.K.; Almeida-Silva, F.; Venancio, T.M.; Grativol, C. Genome-wide analysis of the COBRA-Like gene family supports gene expansion through whole-genome duplication in soybean (Glycine max). Plants 2021, 10, 167. [Google Scholar] [CrossRef] [Scilit]
  38. Li, H.; Zhang, X.; Yang, Q.; Shangguan, X.; Ma, Y. Genome-wide identification and tissue expression pattern analysis of TPS gene family in soybean (Glycine max). Front. Plant Sci. 2024, 15, 1487092. [Google Scholar] [CrossRef] [Scilit]
  39. Schmutz, J.; Cannon, S.B.; Schlueter, J.; Ma, J.; Mitros, T.; Nelson, W.; Hyten, D.L.; Song, Q.; Thelen, J.J.; Cheng, J.; et al. Genome sequence of the palaeopolyploid soybean. Nature 2010, 463, 178–183. [Google Scholar] [CrossRef] [Scilit]
  40. Panchy, N.; Lehti-Shiu, M.; Shiu, S.H. Evolution of Gene Duplication in Plants. Plant Physiol. 2016, 171, 2294–2316. [Google Scholar] [CrossRef] [Scilit]
  41. Lynch, M.; Conery, J.S. The evolutionary fate and consequences of duplicate genes. Science 2000, 290, 1151–1155. [Google Scholar] [CrossRef] [Scilit] [PubMed]
  42. Narusaka, Y.; Nakashima, K.; Shinwari, Z.K.; Sakuma, Y.; Furihata, T.; Abe, H.; Narusaka, M.; Shinozaki, K.; Yamaguchi-Shinozaki, K. Interaction between two cis-acting elements, ABRE and DRE, in ABA-dependent expression of Arabidopsis rd29A gene in response to dehydration and high-salinity stresses. Plant J. 2003, 34, 137148. [Google Scholar] [CrossRef] [Scilit]
  43. Nakashima, K.; Yamaguchi-Shinozaki, K. Regulons involved in osmotic stress-responsive and cold stress-responsive gene expression in plants. Physiol. Plant. 2006, 126, 62–71. [Google Scholar] [CrossRef] [Scilit]
  44. Ferrari, S.; Savatin, D.V.; Sicilia, F.; Gramegna, G.; Cervone, F.; Lorenzo, G.D. Oligogalacturonides: Plant damage-associated molecular patterns and regulators of growth and development. Front. Plant Sci. 2013, 4, 49. [Google Scholar] [CrossRef] [Scilit]
  45. Molina, A.; Jordá, L.; Torres, M.Á.; Martín-Dacal, M.; Berlanga, D.J.; Fernández-Calvo, P.; Gómez-Rubio, E.; Martín-Santamaría, S. Plant cell wall-mediated disease resistance: Current understanding and future perspectives. Mol. Plant 2024, 17, 699–724. [Google Scholar] [CrossRef] [Scilit]
  46. Mistry, J.; Chuguransky, S.; Williams, L.; Qureshi, M.; Salazar, G.A.; Sonnhammer, E.L.L.; Tosatto, S.C.E.; Paladin, L.; Raj, S.; Richardson, L.J.; et al. Pfam: The protein families database in 2021. Nucleic Acids Res. 2021, 49, D412–D419. [Google Scholar] [CrossRef] [Scilit] [PubMed]
  47. Majoros, W.H.; Pertea, M.; Delcher, A.L.; Salzberg, S.L. Efficient decoding algorithms for generalized hidden Markov model gene finders. BMC Bioinform. 2005, 6, 16. [Google Scholar] [CrossRef] [Scilit]
  48. Letunic, I.; Khedkar, S.; Bork, P. SMART: Recent updates, new developments and status in 2020. Nucleic Acids Res. 2021, 49, D458–D460. [Google Scholar] [CrossRef] [Scilit]
  49. Lu, S.; Wang, J.; Chitsaz, F.; Derbyshire, M.K.; Geer, R.C.; Gonzales, N.R.; Gwadz, M.; Hurwitz, D.I.; Marchler, G.H.; Song, J.S.; et al. CDD/SPARCLE: The conserved domain database in 2020. Nucleic Acids Res. 2020, 48, D265–D268. [Google Scholar] [CrossRef] [Scilit]
  50. Chen, C.; Chen, H.; Zhang, Y.; Thomas, H.R.; Frank, M.H.; He, Y.; Xia, R. TBtools: An integrative toolkit developed for interactive analyses of big biological data. Mol. Plant 2020, 13, 1194–1202. [Google Scholar] [CrossRef] [Scilit]
  51. Chou, K.C.; Shen, H.B. Plant-mPLoc: A top-down strategy to augment the power for predicting plant protein subcellular localization. PLoS ONE 2010, 5, e11335. [Google Scholar] [CrossRef] [Scilit]
  52. Lescot, M.; Déhais, P.; Thijs, G.; Marchal, K.; Moreau, Y.; Van de Peer, Y.; Rouzé, P.; Rombauts, S. PlantCARE, a database of plant cis-acting regulatory elements and a portal to tools for in silico analysis of promoter sequences. Nucleic Acids Res. 2002, 30, 325–327. [Google Scholar] [CrossRef] [Scilit]
  53. Fehr, W.R.; Caviness, C.E.; Burmood, D.T.; Pennington, J.S. Stage of development descriptions for soybeans, Glycine max (L.) Merrill. Crop Sci. 1971, 11, 929–931. [Google Scholar] [CrossRef] [Scilit]
  54. Huang, C.; Wu, M.; Wang, L.; Ke, B.; Peng, R.; Lu, Y.; Peng, J.; Rao, S.; Wu, G.; Wu, J.; et al. First report of citrus leaf blotch virus infecting Forsythia viridissima in China. Plant Dis. 2024, 108, 1900. [Google Scholar] [CrossRef] [Scilit]
  55. Kaur, N.; Sharma, I.; Kirat, K.; Pati, P.K. Detection of reactive oxygen species in Oryza sativa L. (rice). Bio-Protocol 2016, 6, e2061. [Google Scholar] [CrossRef] [Scilit]
  56. Giannopolitis, C.N.; Ries, S.K. Superoxide dismutases: I. Occurrence in higher plants. Plant Physiol. 1977, 59, 309–314. [Google Scholar]
  57. Bestwick, C.S.; Brown, I.R.; Mansfield, J.W. Localized changes in peroxidase activity accompany hydrogen peroxide generation during the development of a nonhost hypersensitive reaction in lettuce. Plant Physiol. 1998, 118, 1067–1078. [Google Scholar] [CrossRef] [Scilit]
Figure 1. Chromosomal localization and phylogenetic analysis of GmGH5 genes. (A) Chromosome localization of 28 GmGH5 genes in the soybean (Glycine max) genome. The left vertical scale indicates chromosome lengths in megabases (Mb), and chromosome numbers are shown above each chromosome bar. (B) Phylogenetic tree of GmGH5 proteins from Arabidopsis thaliana (12), Oryza sativa (20), and Glycine max (28), constructed using the neighbor-joining (NJ) method based on full-length protein sequences. Red font indicates soybean GH5 gene family members.
Plants 15 02700 g001
Figure 2. Collinearity analysis of GH5 genes in the soybean genome. The outermost ring (with red markers) indicates the physical loci of the GmGH5 genes. The inner concentric track displays the gene density along each chromosome, represented by a line chart and a color scale ranging from blue (0.00) to red (27.00). In the center of the plot, gray lines represent collinear blocks between chromosomes, while red lines indicate segmentally duplicated gene pairs.
Plants 15 02700 g002
Figure 3. Conserved domains, gene structures, and conserved motifs of GmGH5s. (A) Conserved domain architectures. (B) Conserved motifs of GmGH5s, with black lines denoting the length of the protein sequences. (C) The genetic structure of GmGH5s. The UTR (untranslated region), CDS (coding sequence or exons), and introns are symbolized by green rectangles, yellow rectangles, and black lines, respectively.
Plants 15 02700 g003
Figure 4. Predicted cis-elements in the promoters of GmGH5 genes. The types and numbers of cis-elements are indicated.
Plants 15 02700 g004
Figure 5. Expression patterns of GmGH5 genes across different organs and developmental stages. The heatmap displays transcript levels (in TPM) obtained from public RNA-seq datasets and was visualized using TBtools. The analysis covers vegetative and reproductive organs (root, stem, leaf, flower, and pod) collected from seedling to maturity. RNA-seq data used for this heatmap were obtained from the soybean cultivar Williams 82.
Plants 15 02700 g005
Figure 6. Expression patterns of eight GmGH5 genes under salt (A), alkaline (B), cold (C), and drought (D) stresses. Relative transcript levels at each time point, normalized to Tubulin and expressed as fold changes relative to the 0 h control. Error bars represent the standard error of three biological replicates; specifically, error bars at 0 h indicate the biological variation among the independent control replicates, not the variation of the normalized value. Asterisks indicate statistically significant differences compared with the 0 h control (one-way ANOVA, * p < 0.05, ** p < 0.01, *** p < 0.001, **** p < 0.0001).
Plants 15 02700 g006
Figure 7. Subcellular localization of GmGH5-22-GFP proteins. The indicated constructs were transiently expressed in tobacco leaves, and fluorescence signals were detected after 3 d.
Plants 15 02700 g007
Figure 8. Overexpression of GmGH5-22 enhances salt tolerance in soybean hairy root composite plants. (A) Phenotypes of empty vector (EV-3Flag) and GmGH5-22-overexpressing (GmGH5-22-3Flag) hairy root composite plants under control (0 mM) and 100 mM NaCl treatment for 7 days. (B,C) Histochemical detection of superoxide (NBT staining, (B)) and H2O2 (DAB staining, (C)) in leaves of EV-3Flag and GmGH5-22-3Flag composite plants after 4 days of 100 mM NaCl treatment. (D,E) SOD activity (D) and POD activity (E) in the shoots of EV-3Flag and GmGH5-22-3Flag composite plants under control and 100 mM NaCl treatment. At least ten leaves were detached from individual seedlings for each staining assay. (F) Relative water content (RWC) in shoots of EV-3Flag and GmGH5-22-3Flag composite plants under control and 100 mM NaCl treatment. (GI) Ion contents in hairy roots of soybean composite plants after 24 h salt treatment (100 mM NaCl). The ion content of normal and NaCl-treated root samples was analyzed. The values of Na+ (G) and K+ (H) content together with the ratio of Na+/K+ (I) are presented. DW, dry weight. Data are presented as means ± standard error (SE) from at least three independent biological replicates, each with three technical replicates. Statistical significance was determined by Student’s t-test. Asterisks indicate significant differences versus the corresponding control (* p < 0.05, ** p < 0.01, **** p < 0.0001).
Plants 15 02700 g008
Table 1. Predicted physicochemical properties, transmembrane regions, and subcellular localization of GmGH5 proteins.
NameAccession IDProtein Length/aaMW/kDapISP/aaTMD/aaSubcellular Localization
GmGH5-1Glyma.01G17190043149.289739.441–20-Cytoplasm
GmGH5-2Glyma.03G00210046352.630435.721–27-Chloroplast/Cytoplasm
GmGH5-3Glyma.03G22600041046.094287.771–28-Cytoplasm
GmGH5-4Glyma.03G22910041547.542836.871–23-Cytoplasm
GmGH5-5Glyma.05G17330057163.148075.641–17-Cell wall
GmGH5-6Glyma.05G17340055761.917026.32-9~28Cell wall
GmGH5-7Glyma.05G18070050357.11925.711–27-Cell wall
GmGH5-8Glyma.06G03050042047.426367.11–20-Cytoplasm
GmGH5-9Glyma.06G29240043650.476637.11-13~35Cytoplasm
GmGH5-10Glyma.06G31946050056.237935.491–16-Cell wall
GmGH5-11Glyma.08G06070053259.793966.331–22-Nucleus
GmGH5-12Glyma.08G13060057563.115975.531–32-Cell wall
GmGH5-13Glyma.08G13830050356.748765.241–23-Cell wall/Vacuole
GmGH5-14Glyma.08G24220043348.352256.931–23-Nucleus
GmGH5-15Glyma.09G22450040246.058275.451–25-Cytoplasm
GmGH5-16Glyma.11G07130042648.873329.541–20-Cytoplasm
GmGH5-17Glyma.11G17970054560.849036.711–29-Cell wall/Nucleus
GmGH5-18Glyma.12G01250040846.228435.651–25-Cytoplasm
GmGH5-19Glyma.12G11340043750.336497.14-13~35Cytoplasm
GmGH5-20Glyma.12G20470042949.106675.97-7~26Cytoplasm
GmGH5-21Glyma.13G08740050957.422358.151–28-Plasma membrane/Cell wall/Golgi apparatus
GmGH5-22Glyma.13G08750050757.014477.731–27-Cell wall
GmGH5-23Glyma.13G29660042949.107675.79-7~26Cytoplasm
GmGH5-24Glyma.14G07260043048.635885.951–28-Chloroplast/Cytoplasm
GmGH5-25Glyma.17G25240043348.978125.481–28-Cytoplasm
GmGH5-26Glyma.18G01290053459.233926.411–31-Plasma membrane/Cell wall
GmGH5-27Glyma.18G21560046352.490365.591–23-Cytoplasm
GmGH5-28Glyma.19G22630041947.656125.961~19-Cytoplasm
Disclaimer/Publisher’s Note: The statements, opinions and data contained in all publications are solely those of the individual author(s) and contributor(s) and not of MDPI and/or the editor(s). MDPI and/or the editor(s) disclaim responsibility for any injury to people or property resulting from any ideas, methods, instructions or products referred to in the content.