Article

Growth Traits and Electrophysiological Responses of Cardamine violifolia to Selenium Biofortification Under Various Selenomethionine Levels

1
Hubei Key Laboratory of Selenium Resources Research and Biological Application, Hubei Minzu University, Enshi 445000, China
2
School of Chemistry and Environmental Engineering, Hubei Minzu University, Enshi 445000, China
*
Authors to whom correspondence should be addressed.
Plants 2026, 15(17), 2680; https://doi.org/10.3390/plants15172680
Submission received: 28 July 2026 / Revised: 14 August 2026 / Accepted: 24 August 2026 / Published: 31 August 2026

Abstract

Selenomethionine (SeMet) is essential for selenium fortification in the hyper-selenophilous plant, Cardamine violifolia (Cv). However, there is currently a lack of real-time monitoring techniques to investigate SeMetfortification in Cv. In this study, we employed a time-course experiment (0–10 days) under different concentrations of SeMet (0–300 mg/L). Based on the growth characteristics of Cv, SeMet supplementation was most effective on day 4 at 100 mg/L. Compared with CK, the fresh weight of the roots, stems, and leaves, as well as the total chlorophyll and total nitrogen content, increased by only 2.7–32.9%. Furthermore, based on electrophysiological water metabolism and nutrient translocation in Cv leaves, an electrophysiological indicator, ESR, was used to evaluate selenium biofortification with SeMet. We found that electrophysiological responses are more sensitive than growth traits; the intrinsic capacitance (ICp) of S2 is 173% higher than that of CK, whilst IR, IZ, IXC and IXL are reduced from 44.4% to 73.68%. Intracellular water-holding capacity (IWHC), water transfer rate (WTR), nutrient translocation rate (NTR), and electrophysiological metabolic activity (MA) increased by 144–264%, enhancing SeMet enrichment efficiency. However, when SeMet > 100 mg/L (S3–S6), intracellular water metabolism and active nutrient transport were reduced, leading to the IWHC of S6 being 32.8% lower than CK. Moreover, although the ESR of S6 is higher than CK, the total SeMet transport capacity (STC) of Cv is reduced, promoting the efflux of SeMet (ES2) to inhibit high SeMet stress. Correlation analysis indicated that the electrophysiological selenium-enhancing rate (ESR) is significantly positively correlated with Cv biomass (R2 = 0.89, p ≤ 0.05) and leaf area (R2 = 0.85, p ≤ 0.05), showing that it served as an electrophysiological factor of selenium biofortification. Hence, plant electrophysiological technology enables real-time monitoring of different SeMet biofortification in Cv, and ESR can provide a useful reference for assessing selenium biofortification in hyperaccumulators.

1. Introduction

Most regions in China suffer from a scarcity of selenium resources, and the population generally has an inadequate selenium intake of 43.3 μg/day, which is less than the recommended daily intake of 60 μg/day. Consequently, plant-based foods are a key strategy for alleviating selenium deficiency in humans [1]. Cardamine violifolia (Cv), a hyper-selenophilous plant native to Enshi (E 109°04′–109°58′, N 29°50′–30°39′, Hubei province, China), has a selenium accumulation capacity of up to 7816 mg/kg, making it the most potent selenium-accumulating plant around the world [2], with biologically selenium forms, such as selenomethionine (C5H11NO2Se), selenocysteine (C3H7NO2Se), and L-selenomethylselenocysteine (C4H9NO2Se), which offer significant economic and health benefits [3]. To optimize the efficient utilization of bio-organic selenium in Cv and enhance its medicinal and dietary value, exogenous selenium fortification is a key method for improving selenium bioavailability in Cv. It is also crucial to the sustainable development of the selenium-enriched industry [4].
Selenomethionine (SeMet), a commonly used exogenous selenium fortifier, offers the advantages of high biological activity and high absorption rates in humans; it can be directly absorbed and utilized by the body via the amino acid transport system. It significantly increases the bioavailable selenium content and health benefits of Cv, offering considerable selenium supplementation effects [5]. At the same time, SeMet at an appropriate concentration can not only activate the antioxidant enzyme system [6] and alleviate oxidative stress [7], but it can also promote selenium–cadmium (or other heavy metals) antagonism [8], thereby supporting healthy cultivation of Cv. By promoting healthy cultivation of Cv, the above research has laid a solid foundation for monitoring the effectiveness of selenium fortification in Cv. However, there is a lack of research on real-time monitoring techniques for SeMet fortification in Cv.
Studies have shown that electrical signals in plants are key indicators of their real-time physiological responses, attributed to capacitive, inductive, and resistive properties of cells, which can convert energy under the growth of plant species [9]. Therefore, scientists believe that electrical signals in plants accompany physiological processes. For example, during H+ transport, the current and potential gradients generated by the H+-ATPase proton pump, along with ATP synthesis, are used to characterize real-time H+ transport dynamics [10]. Since then, scholars have used patch-clamp [11] and microneedle electrodes [12] to measure physiological resistances of plant electrical signals. However, all of the above methods disrupt tissues and cells, making it difficult to reflect the real-time electrical signals of plant species accurately. Consequently, it is vital to refine a real-time electrophysiological monitoring technique and accurately measure dynamic growth traits of plant species.
Compared with other traditional technologies, the electrophysiological monitoring technique is a fast, real-time, and lossless method to record dynamic electrophysiological parameters. Based on non-damaging microelectrodes, it uses LCR testers to measure the real-time capacitance (Cp), resistance (R), and impedance (Z) of leaves under different clamping forces (F). Subsequently, based on the Nernst equation, Gibbs free energy, and thermodynamic principles, we constructed an electrophysiological model to quantify electrophysiological water metabolism, nutrient transport, and energy metabolism [13]. It not only enables plant dynamic metabolism, such as water metabolism and nutrient transport [10], but also adaptability to environmental stresses such as drought [9], low temperature [14], and high Na+ stress [15]. Importantly, we made considerable progress in exploring exogenous selenium effects by electrophysiological monitoring techniques. In previous studies, we found that HCO3− cooperates with Se4+ to promote electrophysiological water and active nutrients, alleviating cadmium stress in Cv [16]. In addition, under non-flooding conditions, silicate (Si4+) synergizes with Se4+ to promote the active electrophysiological nutrient transport of Yixiangyou 876 rice, improving selenium–cadmium antagonism [16]. Consequently, plant electrophysiological monitoring techniques served as a reliable method to track selenium biofortification traits of Cv under various SeMet levels.
In this study, Cv was selected as the experimental material. Following the safety threshold for SeMet enhancement in cruciferous plants pecies [17], we set up a time period with various SeMet levels to treat Cv seedlings. Based on Cv’s growth characteristics, we determined the optimal application time of SeMet. Subsequently, using plant electrophysiological technology, we assessed leaf electrophysiological water metabolism, nutrient transport, and metabolic activities to identify the most suitable SeMet level for Cv. Finally, based on dynamic electrophysiological water metabolism and nutrient transport traits, we constructed the electrophysiological selenium enhancement rate (ESR) to provide a new real-time method for precision selenium biofortification of Cv. This study provides a reliable electrophysiological evaluation method for Cardamine violifolia SeMet adaptation and further facilitates the sustainable development of selenium-biofortified agriculture.

2. Materials and Methods

2.1. Experimental Materials

In this study, healthy Cv seedlings were collected in the industrial park of the Academy of Agricultural Sciences of Enshi Tujia and Miao Autonomous Prefecture (E 109°49′, N 30°32′), stored in foam boxes at low temperature, and transported to the laboratory for backup. Subsequent seedling cultivation and the full set of SeMet treatment experiments were conducted under controlled laboratory conditions. Prior to the application of SeMet, seedlings of uniform age, plant height, leaf number and vigor and free from visible damage were selected and randomly allocated to each treatment group to minimize initial individual variation as far as possible. Throughout the experiment, all treatments were cultivated synchronously, and samples were collected at the same time points to eliminate environmental interference caused by outdoor weather fluctuations. Even after rigorous homogenization screening, the inherent biological heterogeneity of individual seedlings could not be completely eliminated, which may have resulted in significant inter-group differences in the parameters measured on Day 0. Non-destructive physiological indicators (SPAD and electrophysiological indicators) were measured repeatedly on the same seedling at each sampling time point; for destructive sampling of biomass, separate replicate plants were used to avoid interference caused by the sampling procedure.
Despite careful morphological homogenization, significant inter-group differences at Day 0 may stem from hidden biological variation. Root-system characteristics, pre-sampling micro-environmental effects and internal nitrogen partitioning differ among visually similar seedlings, generating baseline divergence in SPAD and total nitrogen values. Subsequent SeMet-induced responses were evaluated based on temporal changes relative to each group’s initial condition, minimizing the influence of this baseline variation on treatment comparisons.

2.2. Experimental Treatment

2.2.1. Adaptive Culture of Cv

Substrate culture (volume ratio of peat:vermiculite = 2:1) was used to carry out Cv adaptive culture experiments, and Cv seedlings were irrigated with a 1/2 concentration of Hoagland nutrient solution, formulated as: KNO3: 2.5 mM, NH4H2PO4: 1.0 mM, Ca(NO3)2·4H2O: 2.5 mM, MgSO4·7H2O: 1.0 mM, H3BO3: 23.1 µM, CuSO4·5 H2O: 0.16 µM, ZnSO4·7H2O: 0.38 µM, MnCl2·4H2O: 4.55 µM, Na2MoO4·2H2O: 0.19 µM, and Fe-EDTA: 50 µM. The processing period was 21 days [18].

2.2.2. Different SeMet Selenium Enhancement Treatments

Root application was selected, and Cv seedlings at the 2–3 cotyledon stage were treated with different SeMet levels (analytical purity ≥ 98%): Ck—0 mg/L, S1—50 mg/L, S2—100 mg/L, S3—150 mg/L, S4—200 mg/L, S5—250 mg/L, and S6—300 mg/L SeMet. Each group was set with 3 biological replicates (n = 3) for 10 days [18]. During the treatment period, the pH of the nutrient solution remained stable, consistent with the experimental background conditions.

2.3. Growth Characteristics

2.3.1. Determination of Total Chlorophyll and Total Nitrogen Content

According to method [19], we used a chlorophyll meter (0–99.9 SPAD, IN-YL03, Shandong Laiyin Photoelectric Technology Co., Ltd., Weifang, China) to measure total chlorophyll and total nitrogen content of Cv leaves. For SPAD determination, multiple measurement points on different mature leaves were recorded for each biological replicate, and the mean value was calculated to minimize measurement variability arising from leaf structural heterogeneity.

2.3.2. Biomass

After harvest, following method [20], we collected the roots, stems, and leaves of Cv treated with different SeMet levels, and the fresh weight (FW, g/plant) was measured using a balance (AR124CN analytical balance (readability 0.0001 g), OHAUS Corporation, Shanghai, China).

2.4. Leaf Intrinsic Electrophysiological Characteristics

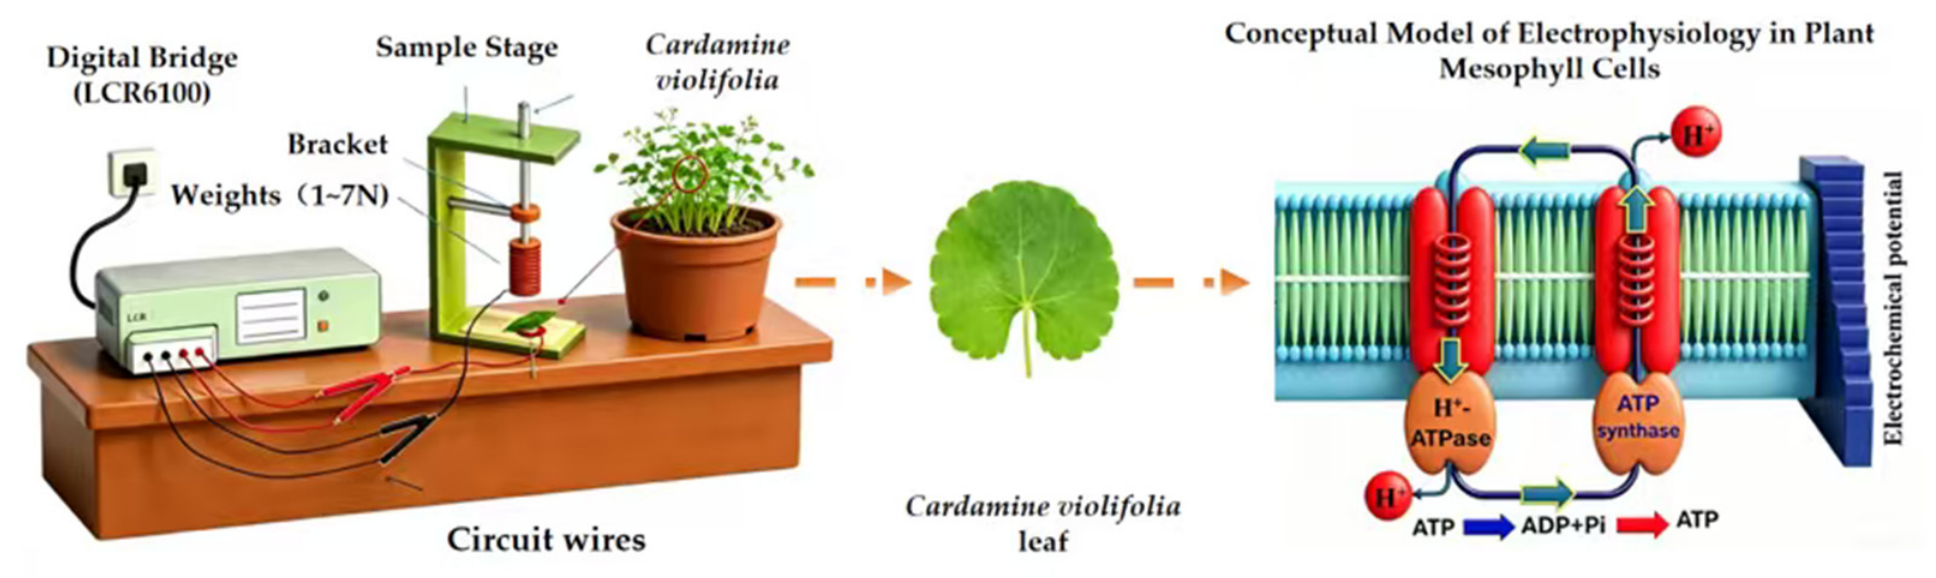
According to method [21], we measured the capacitance (Cp, capacitance), resistance (R, resistance), and impedance (Z, impedance) of the Cv leaves (Figure 1). We constructed the electrophysiological models with different clamping forces (F, force, F = 1–7 N, every 1N measured once) in Equations (1)–(4), where F is the clamping force, and the unit is N; M is the iron block, m is the total mass of the plastic rod of the electrode sheet, and the unit is kg. g is the acceleration of gravity, taking 9.8 N/kg; x0, y0 and p0 are the intercepts of Cp, R and Z, respectively. h, k1 and k2 are the independent variables of Cp, R and Z, respectively. b1 and b2 are the power exponent coefficients of Cp, R and Z, respectively.
F = M + m g
Cp = x 0 + hF
R = y 0 + k 1 e b 1 F
Z = p 0 + k 2 e b 2 F
According to method [22], we determined the capacitive reactance (Xc) and the relationship between Xc and F, as shown in Equations (5) and (6). According to Z, R, and Xc of Cv leaves, we calculated the inductive reactance (XL) of Cv leaves and the change in XL in Equations (7) and (8), where π = 3.1416; U= 1.5 V; q0, k3, and b3 are the intercept, independent variable coefficient, and power exponent coefficient of Xc and F, respectively; and a0, k4, and b4 are the intercept, independent variable coefficient, and power exponent coefficient of XL and F, respectively.
X c = 1 2 π fCp
Xc = q 0 + k 3 e b 3 F
1 X L = 1 Z 1 R 1 Xc
X L = a 0 + k 4 e b 4 F
When F = 0, we derived the intrinsic capacitance (ICp), intrinsic resistance (IR), intrinsic capacitive reactance (IXC), intrinsic inductive reactance (IXL), and intrinsic impedance (IZ); see Equations (9)–(13).
ICp = 1 2 π fI X L
IR = y 0 + k 1
IXc = q 0 + k 3
I X L = a 0 + k 4
1 IZ = 1 IR + 1 IXc 1 I X L

2.5. Leaf Electrophysiological Water Metabolism

According to method [23], we calculated the leaf intracellular water-holding capacity (IWHC), effective thickness (d), intracellular water use efficiency (IWUE), intracellular water-holding time (IWHT), and water transfer rate (WTR); see Equations (14)–(18). Among them, U is 1.5 V; d is the specific effective thickness of Cv leaves; and h is the independent variable coefficient for Cp and F.
IWHC = IC p 3
d = U 2 h 2
IWUE = d IWHC
IWHT = C × Z
WTR = IWHC IWHT

2.6. Leaf Electrophysiological Nutrient Transport

According to method [24], we calculated the Cv leaf nutrient flux per unit area (UNF), nutrient translocation rate (NTR), nutrient translocation capacity (NTC), active transport flow of nutrient (UAF), and nutrient active translocation capacity (NAC); see Equations (19)–(23), respectively.
UNF = R IXc + R I X L
NTR = IWHC IWHT
NTC = UNF × NTR
UAF = I X C I X L
NAC = UAF × NTR

2.7. Leaf Electrophysiological Metabolic Activity

According to method [13], we calculated the leaf electrophysiological relative metabolic flux (MF), relative metabolic rate (MR), and relative metabolic activity (MA) in Equations (24)–(26).
MF = 1 IR × IZ × I X C × I X L
MR = WRT × NAC
MA = MF × MR 6

2.8. Selenium Fortification Based on Electrophysiological Water Metabolism and Nutrient Transport in Leaves

Referring to method [25], we calculated the selenium enhancement factors based on leaf electrophysiological water metabolism and nutrient transport characteristics, leaf electrophysiological selenium excretion capacity (ES1), selenium dilution capacity (ES2), selenium ultrafiltration capacity (ES3), selenium total transport capacity (STC), and selenium enhancement capacity (ESR) in Equations (27)–(31).
STC = UNF × WTR
ES1 = 0.25 × (IR + IZ + IXC + IXL)
ES2 = 0.25 × (Icp + d + IWHC + STC)
ES3 = 0.25 × (IWUE + IWHT + UNF + WTR)
ESR = ES1 + ES2 + ES3 3

2.9. Statistical Analysis

SigmaPlot 15.0 was used to fit the electrophysiological equation of Cv leaves; SPSS 27.0 was used to analyze data differences and significance. Different letters (a–f) indicated significant differences, and the results are expressed as “mean ± standard deviation”. SPSS 21 was used to perform one-way analysis of variance (ANOVA) and the least significant difference test (LSD, p < 0.05), and Origin 2025 was used to finish plots.

3. Results

3.1. Growth Characteristics

To eliminate the influence of significant baseline differences among groups at Day 0, values measured at each sampling day were normalized to their corresponding Day-0 value to calculate relative proportional changes. This normalization approach was applied to evaluate the true regulatory effects of SeMet on seedling growth, independent of initial growth variation.
Table 1 and Table 2 show the relative proportional changes in total chlorophyll (SPAD value) content and total nitrogen (TN) content of Cardamine violifolia (Cv) seedlings over a 10-day period under different SeMet levels. The results showed that the SPAD and TN both reached their maximum on day 4, indicating that day 4 is the optimal time for SeMet application. Accordingly, growth traits and electrophysiological characteristics measured on day 4 were selected for further analysis.
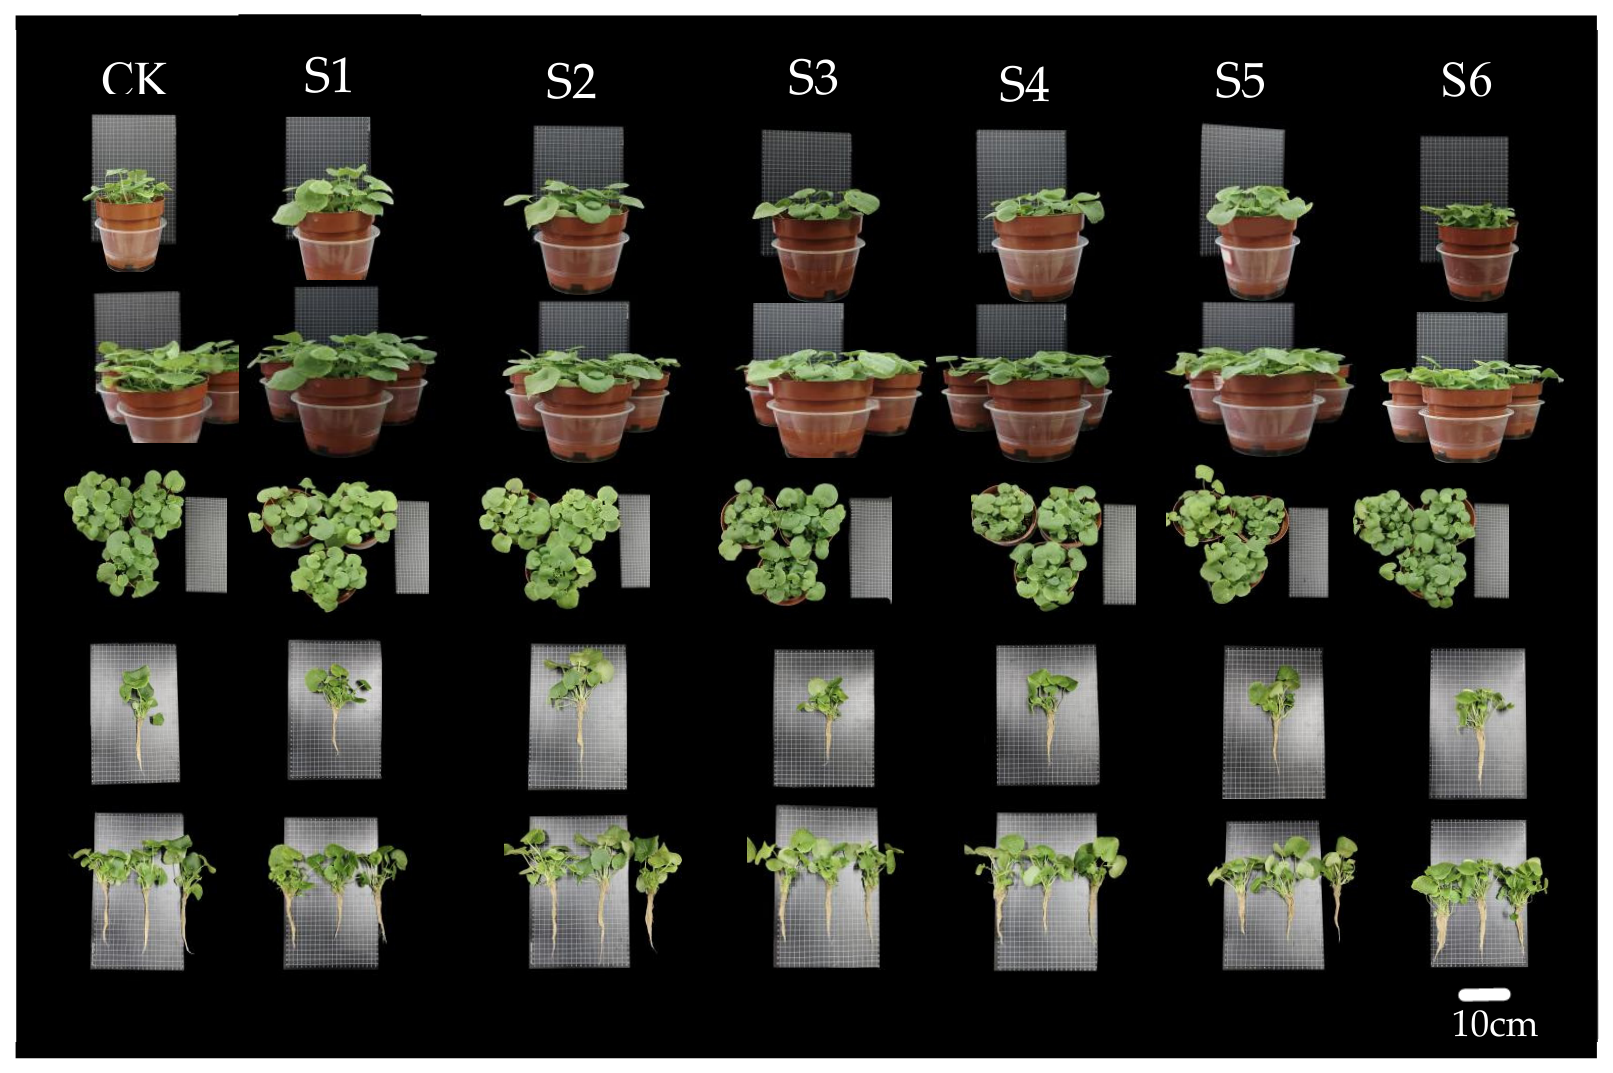
Table 3 shows that relative changes in root, stem, and leaf fresh weight differed substantially among SeMet levels at day 4. Compared to CK, only S2 promoted the fresh-weight of all organs. By contrast, S1 and S3–S6 inhibited fresh-weight accumulation in roots, stems, and leaves. Table 4 and Figure 2 show the plant height, leaf area, SPAD, TN and growth traits of Cv leaves at day 4. The results showed S2 exhibited the greatest growth traits, with increases of 18.91% and 23.96% compared with CK, which is consistent with its superior growth performance. Nevertheless, these growth traits cannot accurately distinguish the fine differences across other treaments (Table 3 and Table 4).

3.2. Leaf Electrophysiological Fitting Equation

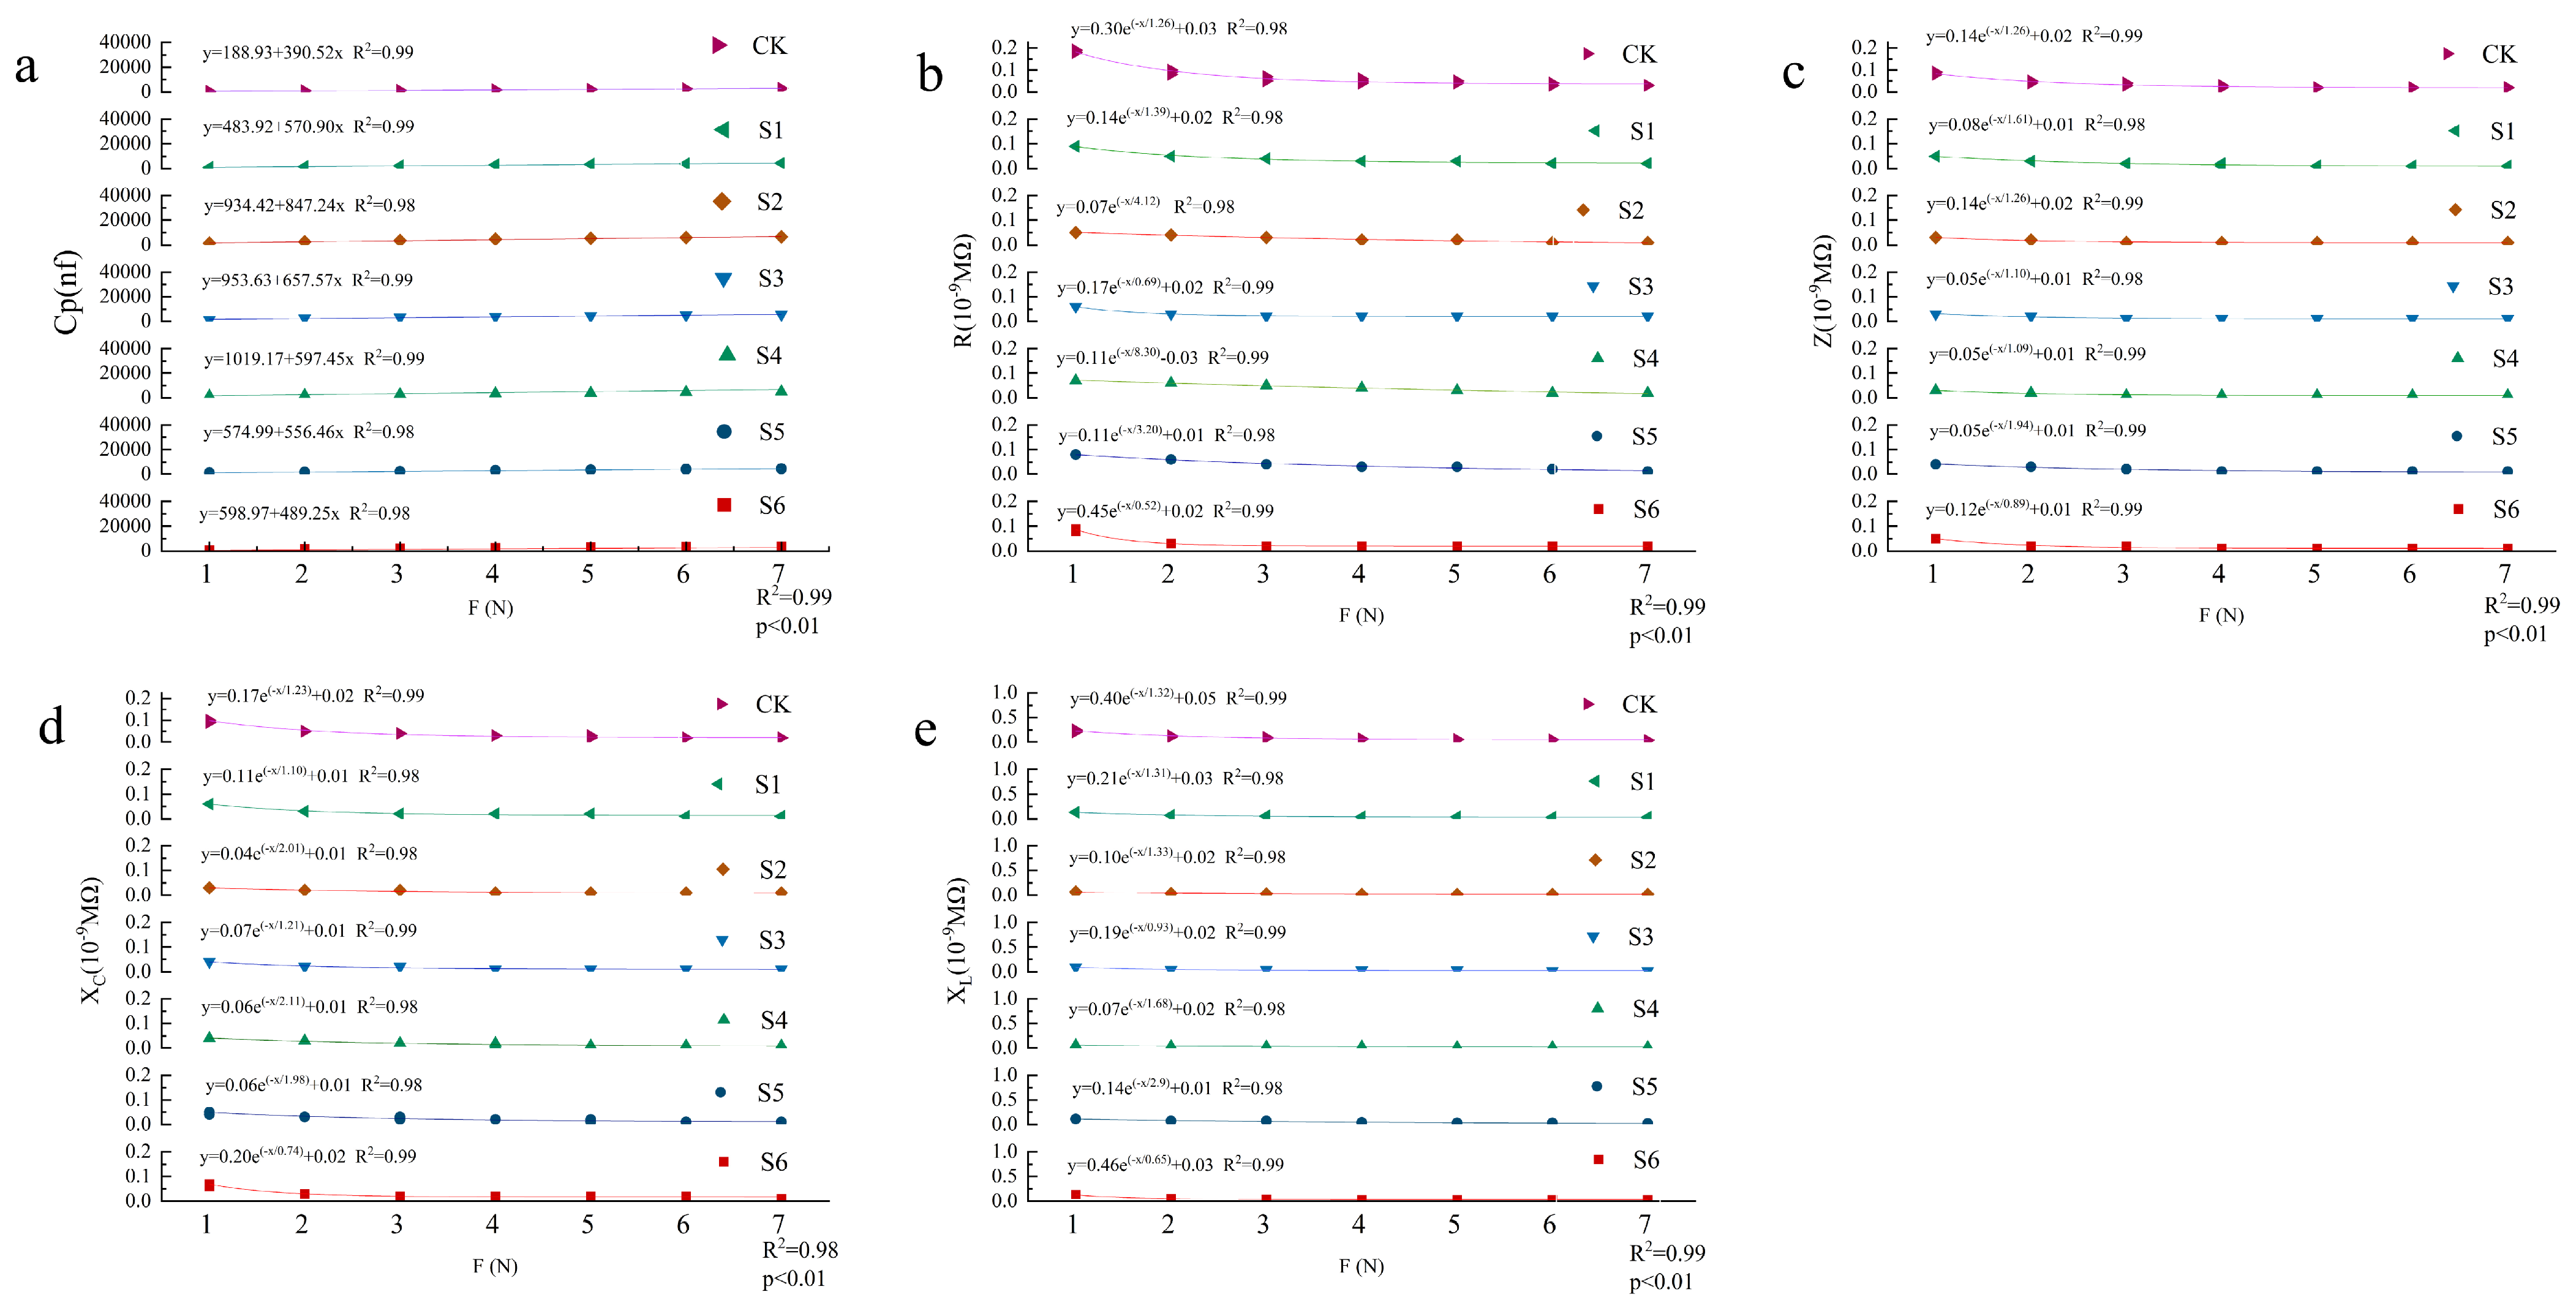
Figure 3 shows the electrophysiological equations of leaf capacitance (Cp, Figure 3a), resistance (R, Figure 3b), impedance (Z, Figure 3c), inductive reactance (XC, Figure 3d), and capacitive reactance (XL, Figure 3e) with different clamping forces F (1–7 N) under different SeMet levels. The results showed that the electrophysiological equations for Cp, R, Z, XC, and XL were significantly correlated with F (R2 = 0.98–0.99), whereas all treatments (CK-S5) were significantly different in Cv leaves (p < 0.01).

3.3. Leaf Intrinsic Electrophysiological Parameters

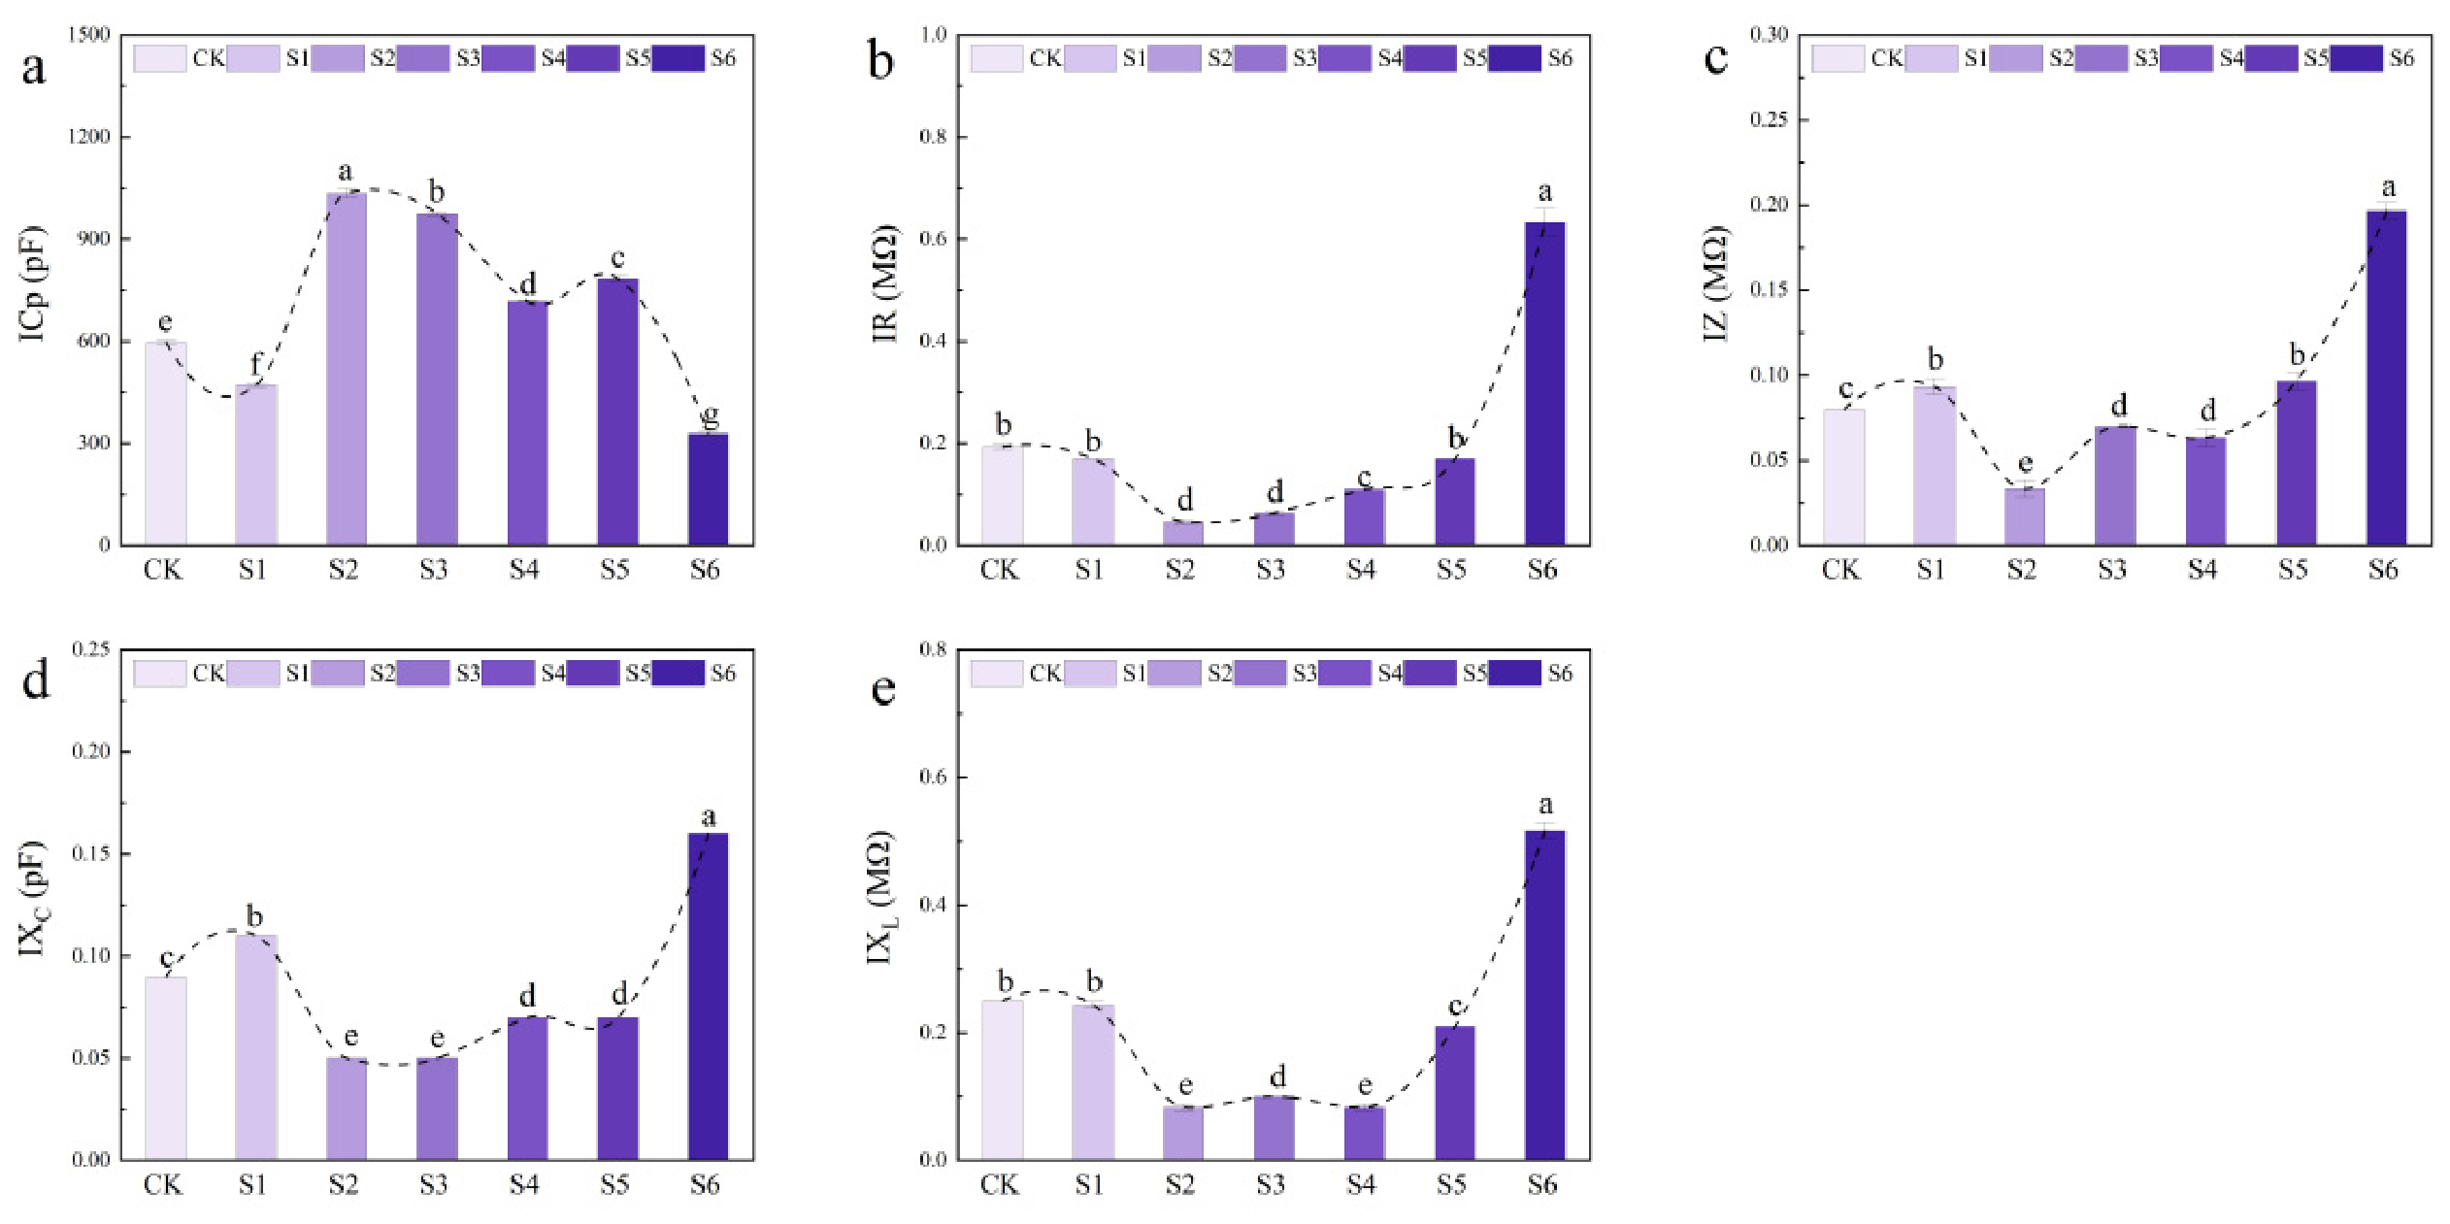
Figure 4 represents Cv leaf intrinsic electrophysiological parameters, including ICp (Figure 4a), IR (Figure 4b), IZ (Figure 4c), IXC (Figure 4d), and IXL (Figure 4e). The results showed that S2-S5 promoted ICp, but inhibited IR, IZ, IXC, and IXL. Compared with CK, the ICp of S2 was increased by 1.73-fold, but the IR, IZ, IXC, and IXL of S2 were increased by 73.68%, 62.5%, 44.4%, and 68%, respectively, compared with CK.

3.4. Leaf Electrophysiological Water Metabolism and Nutrient Transport

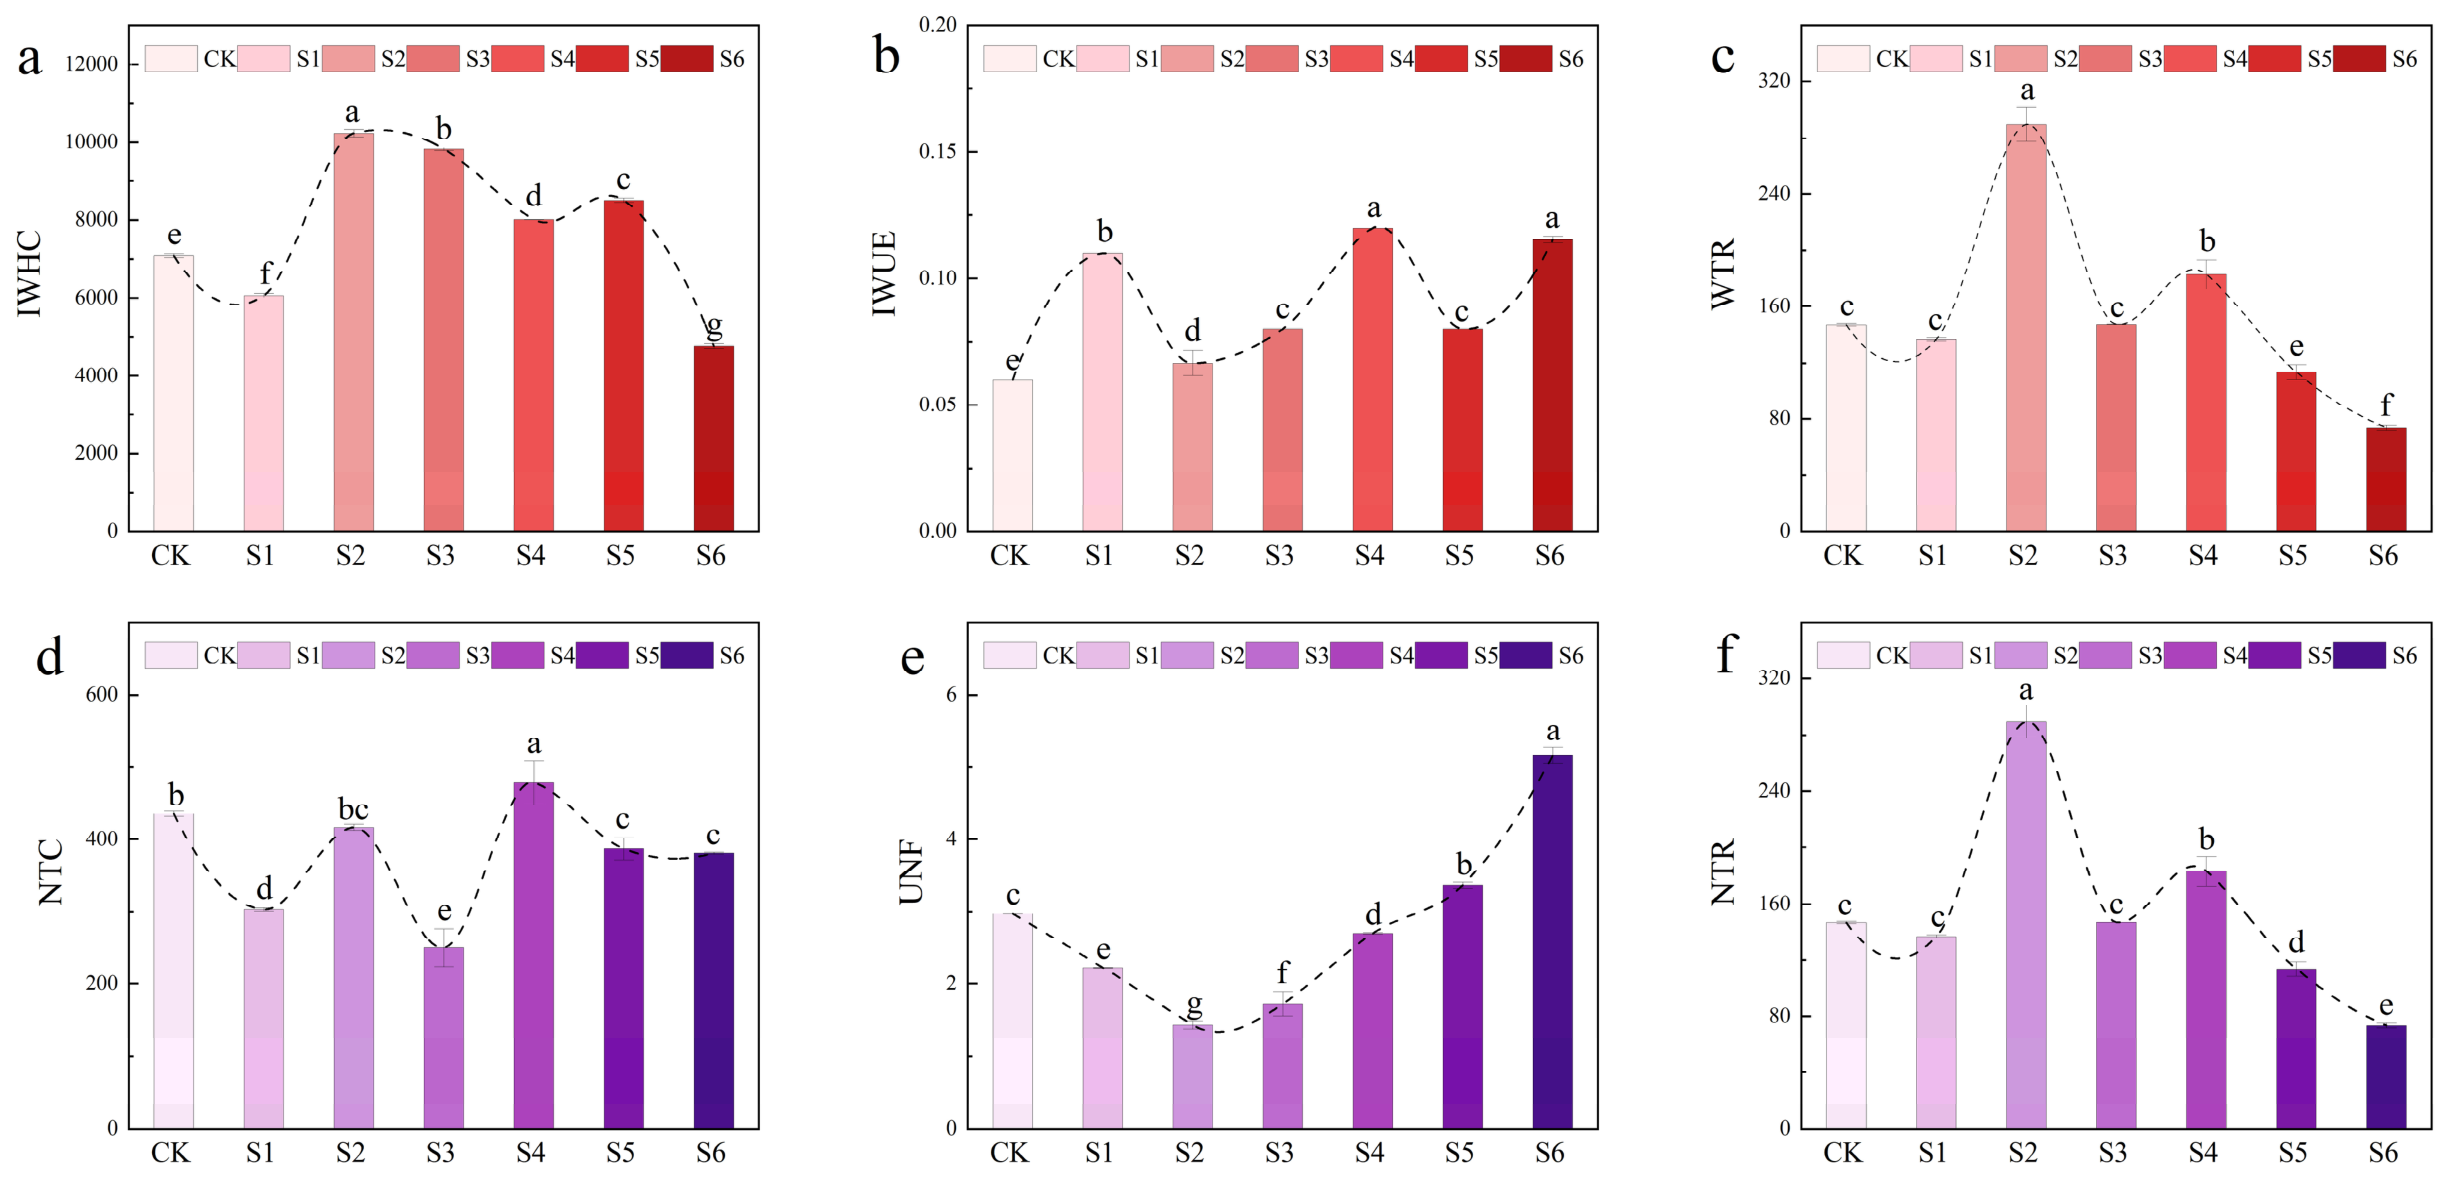
Figure 5 shows the electrophysiological water metabolism and nutrient transport of Cv leaves under different SeMet. Figure 5a–c show the electrophysiological water metabolism of Cv leaves, including IWHC, IWUE, and WTR. Figure 5d–f show the electrophysiological nutrient transport of Cv leaves, including NTC, UNF, and NTR. With increasing SeMet levels, IWHC, IWUE, and WTR showed a sequential trend in electrophysiological water metabolism. The IWHC and WTR of S2 were the largest, at 1.44 and 1.93 times those of CK, respectively. The IWHC of S6 was the smallest, 32.8% lower than that of CK. In electrophysiological nutrient transport, NTC, UNF, and NTR showed a sequential trend. The NTR of S2 was the largest, 1.97-fold larger than CK. The UNF of S2 was the smallest, 50.17% lower than that of CK.

3.5. Leaf Electrophysiological Metabolic Activities

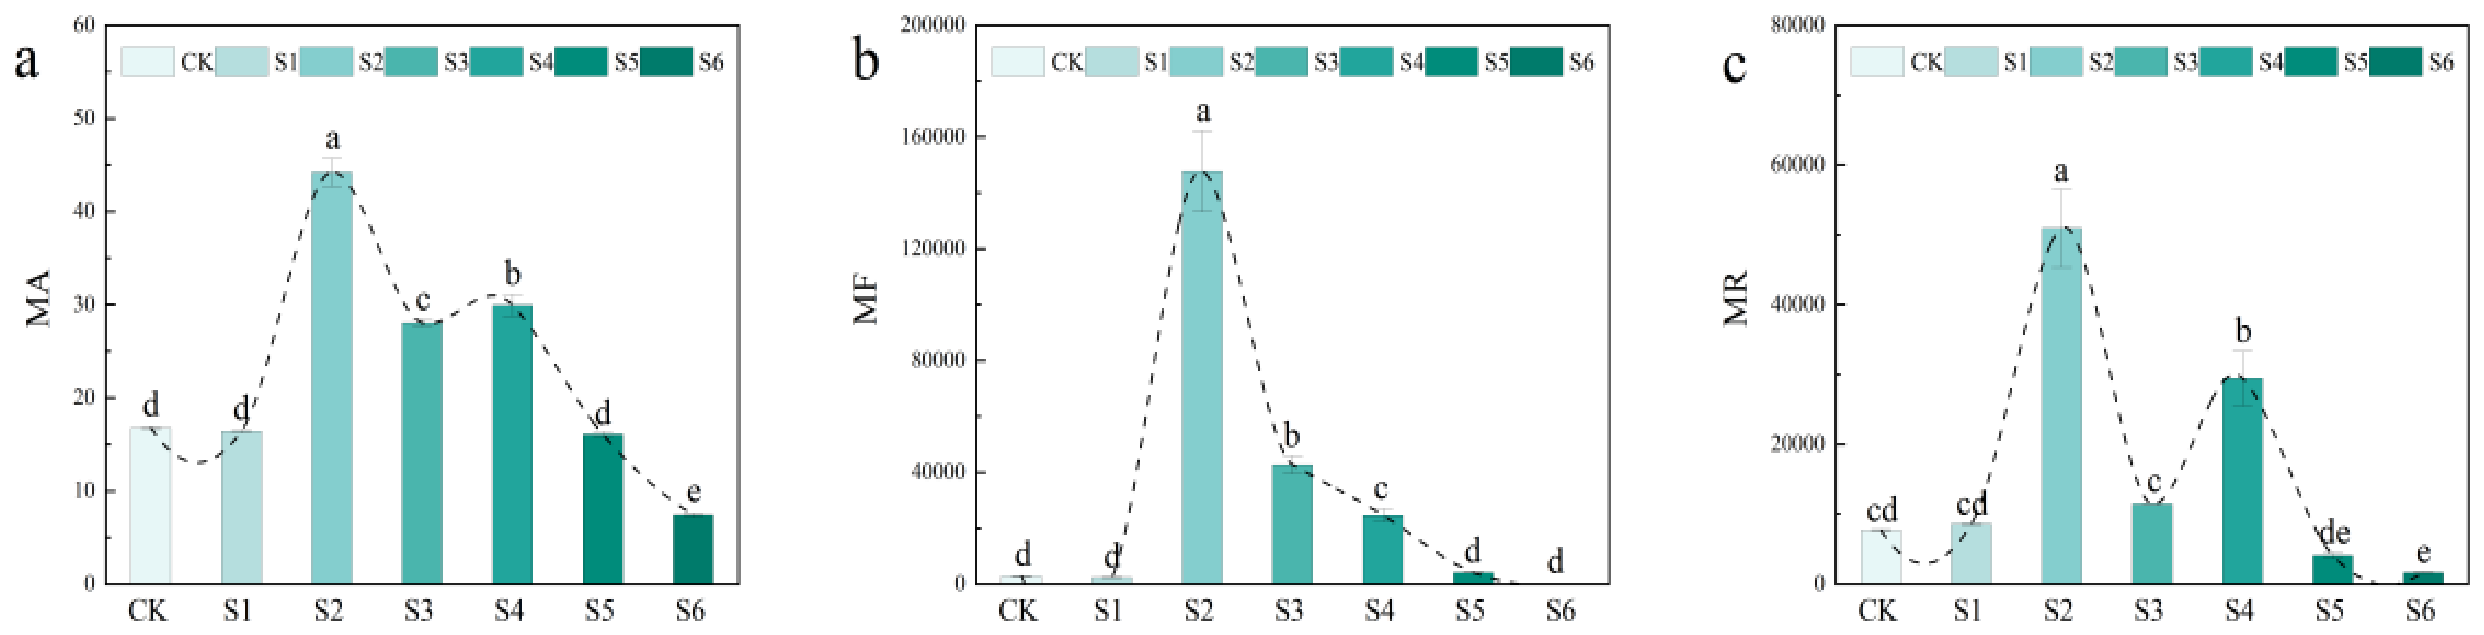
Figure 6 shows the electrophysiological and metabolic activities of Cv leaves under different SeMet levels. With SeMet increasing, MF, MR, and MA showed a sequential trend from CK to S6. The MF and MA of S2 were the largest, increasing by 51.27-fold and 2.64-fold compared to CK, respectively.

3.6. Electrophysiological Selenium Enhancement Characteristics of Cv Leaves

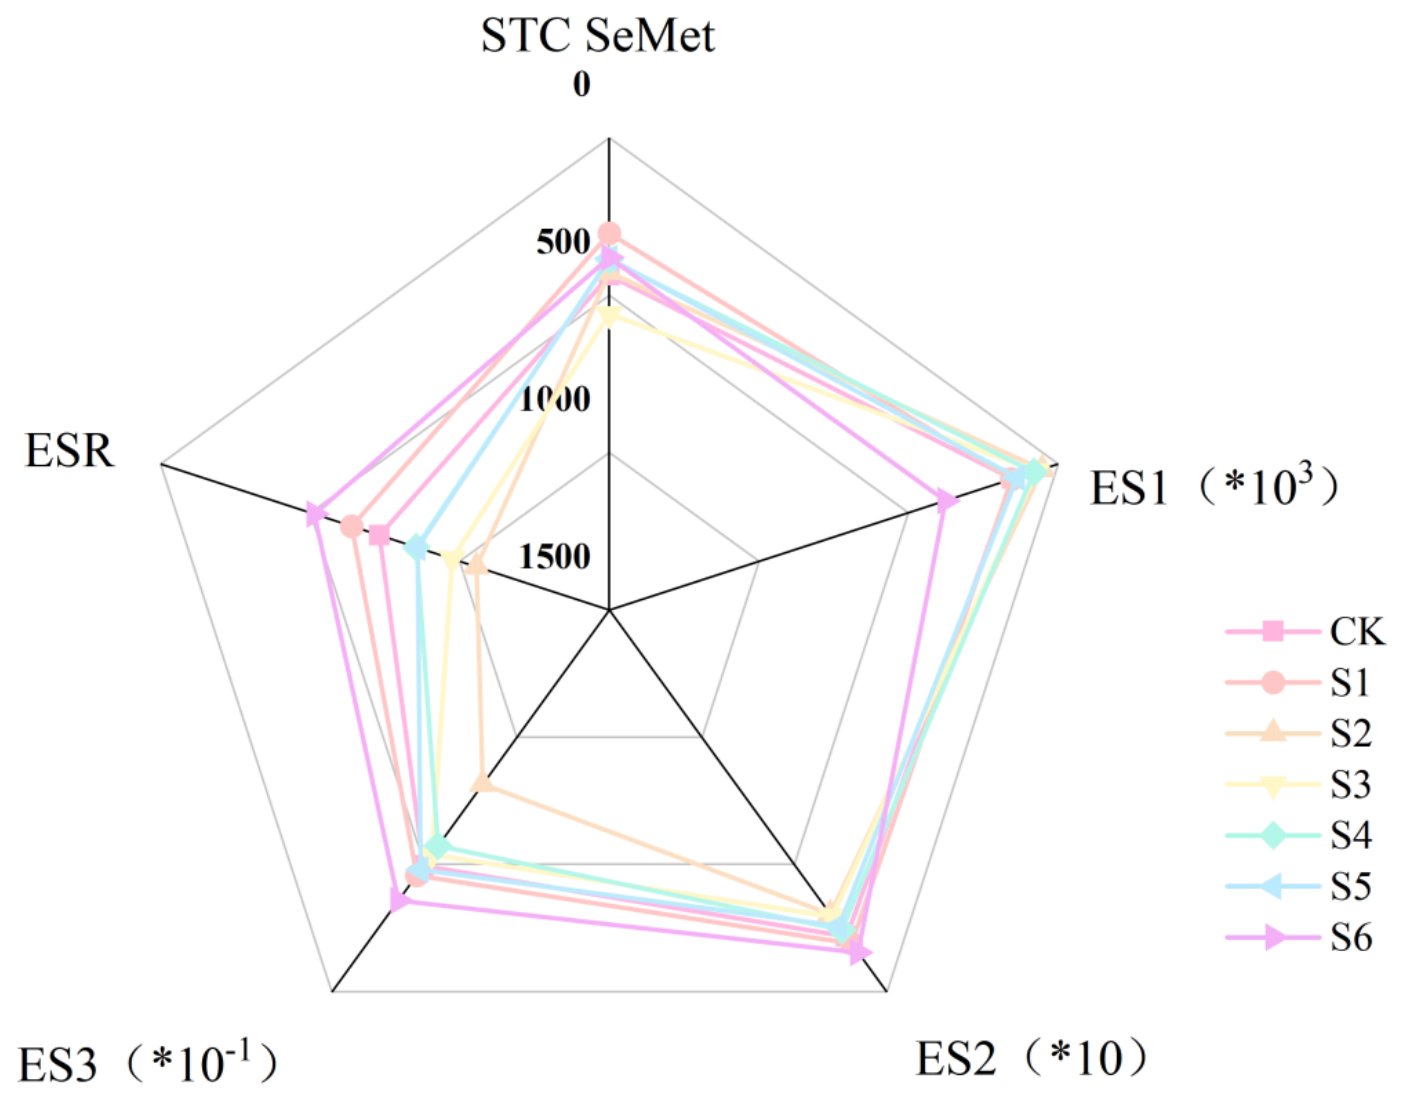
Figure 7 shows the electrophysiological selenium enhancement characteristics of Cv leaves under different SeMet levels. The results showed that ESR in S2 was the highest, increasing by 29.06% compared to CK, with increases of 28.15% (STC SeMet), 2.24% (ES1), 40.42% (ES2), and 64.70% (ES3).

3.7. Correlation Analysis

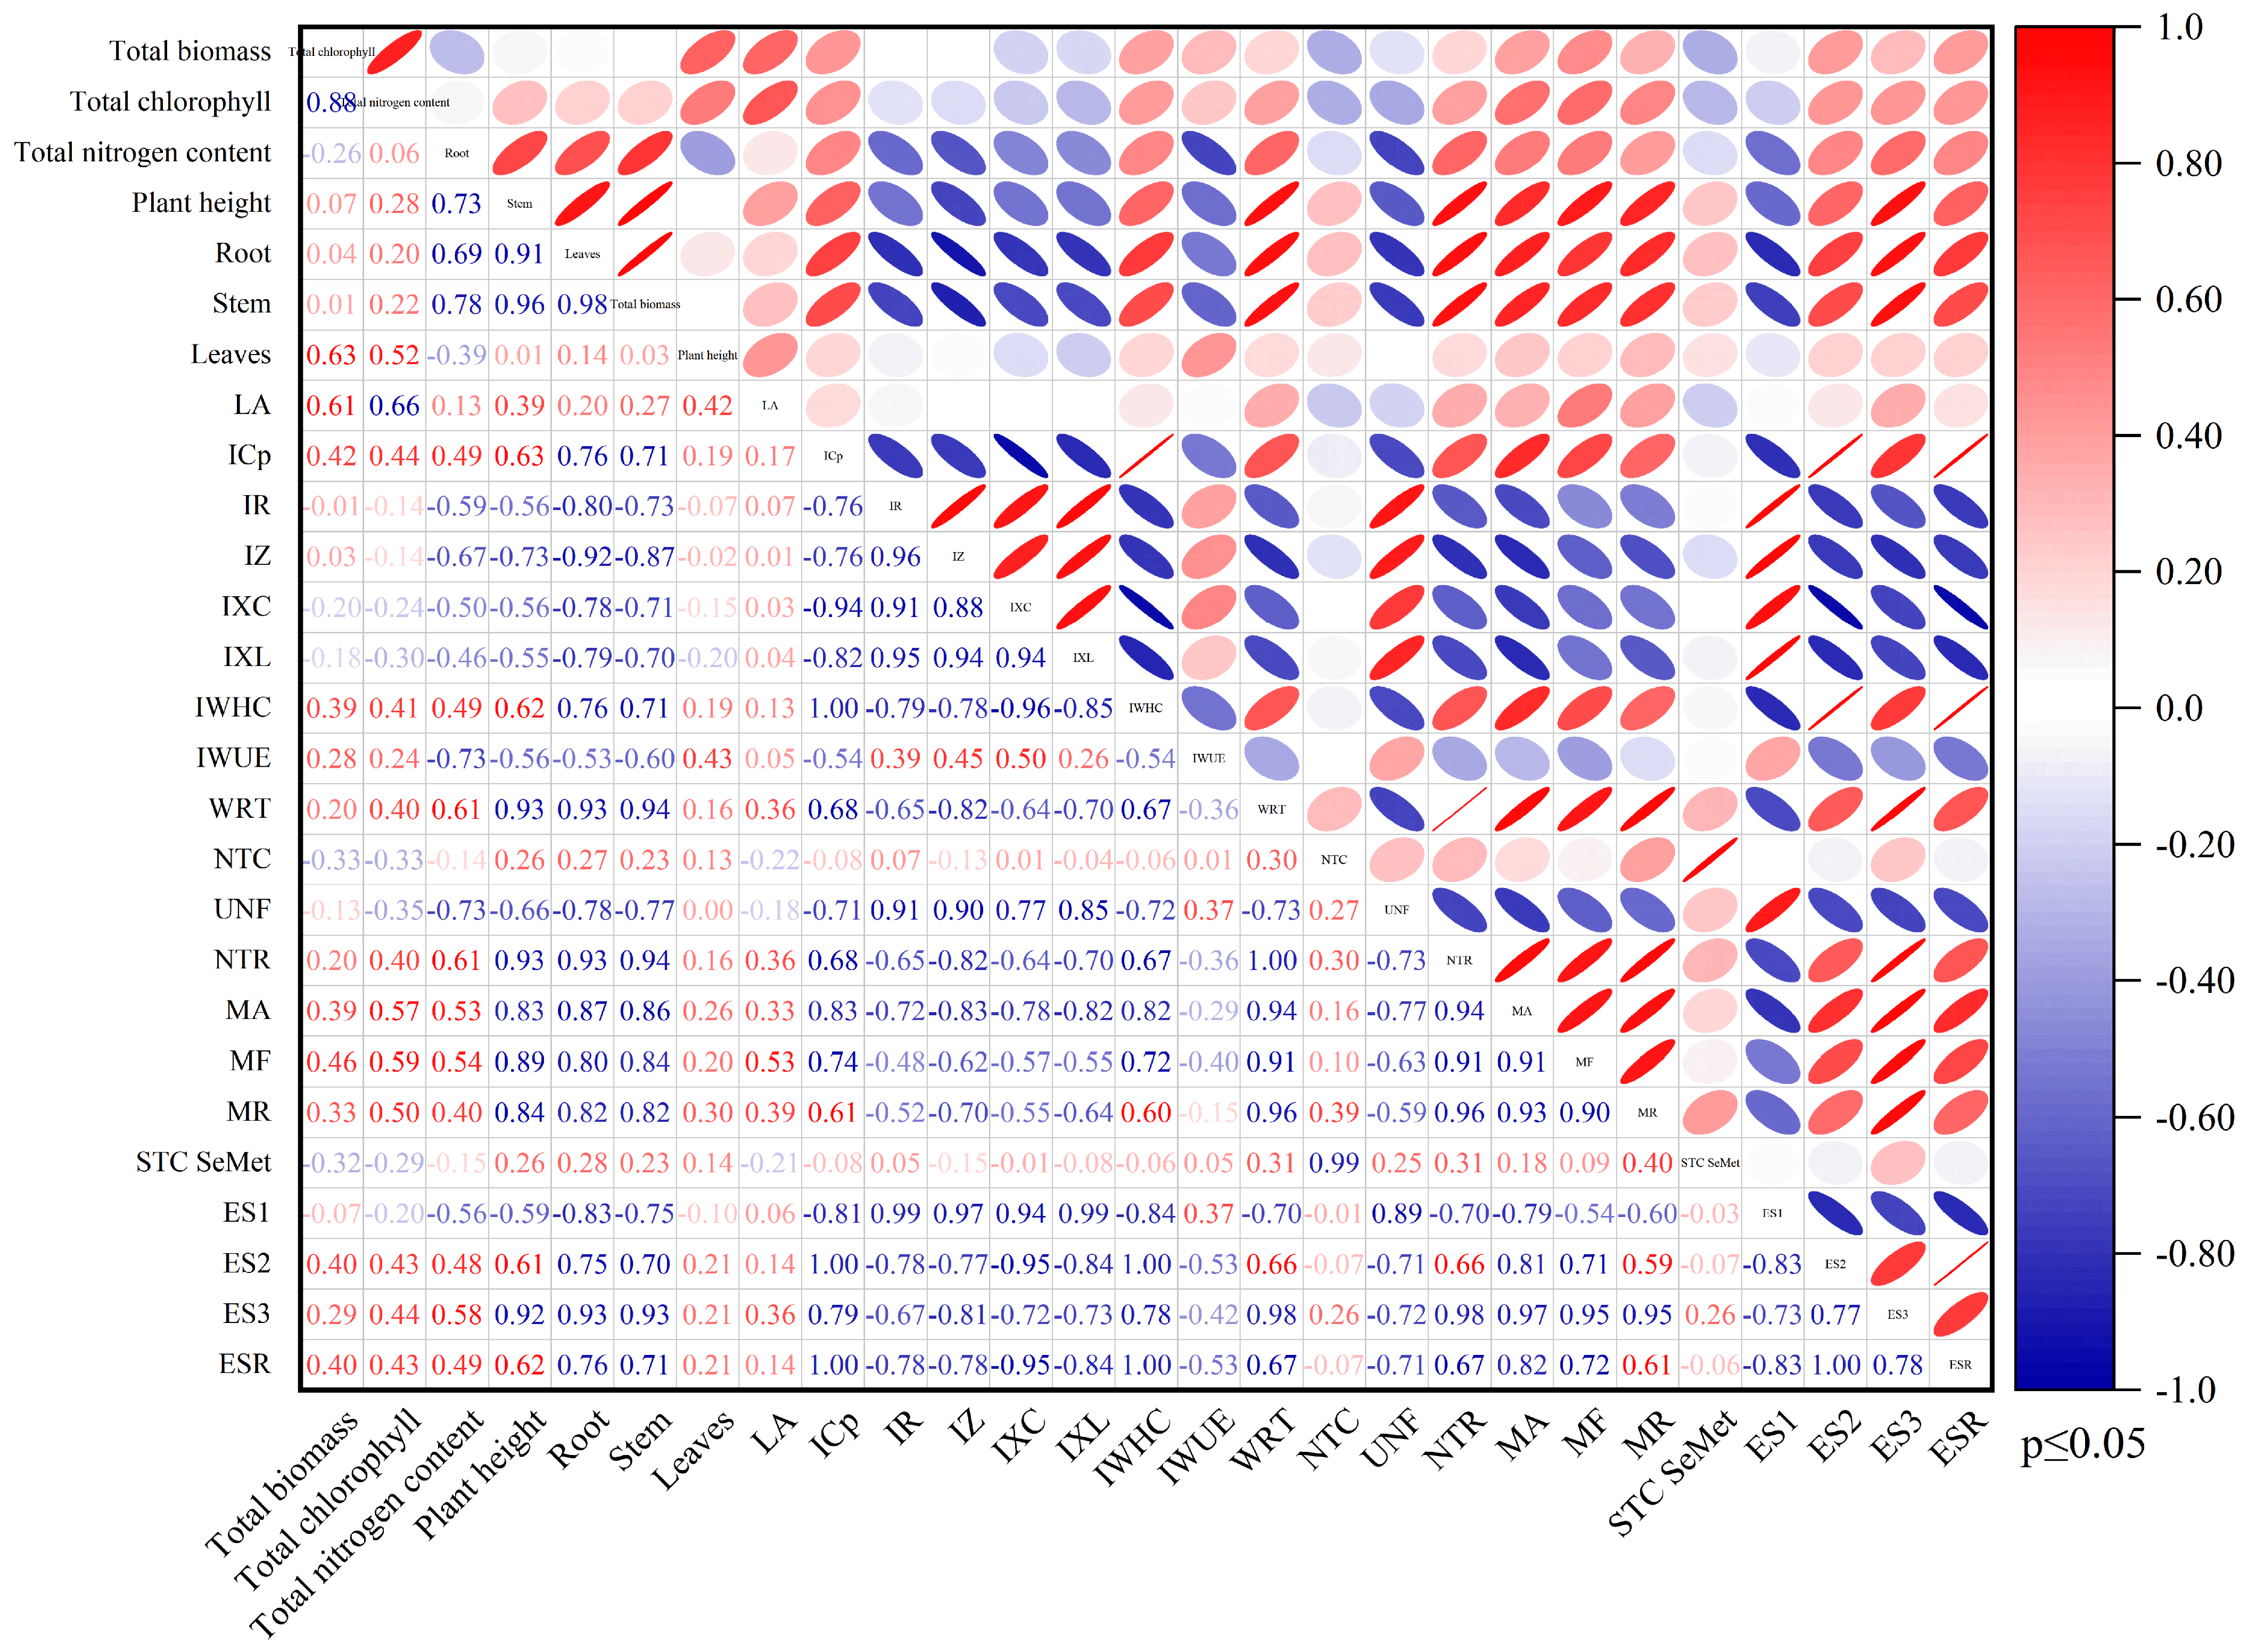
Figure 8 presents a correlation analysis based on growth traits and electrophysiological characteristics of Cv leaves under different SeMet levels. It showed ESR was significantly positively correlated with total biomass (R2 = 0.89, p ≤ 0.01) and leaf area (R2 = 0.85, p ≤ 0.05). S2 had the highest ESR, consistent with the maximum biomass and chlorophyll content. Conversely, ES1 was significantly elevated in the S4–S6 treatments. ES2 was positively correlated with plant height (R2 = 0.78, p ≤ 0.05) and total nitrogen content (R2 = 0.82, p ≤ 0.05). Otherwise, there was a negative correlation between ES3 and root biomass (r = −0.74, p ≤ 0.05).

4. Discussion

4.1. Limitations of Growth Traits to Characterize Selenium Biofortification Capacity of Cv

Based on the growth traits of Cv, we found that the plant height, leaf area, total biomass, and chlorophyll content (Table 3 and Table 4) of Cv were highest on day 4, indicating that SeMet enhances carbon assimilation capacity by promoting the synthesis of photosynthetic pigment (chlorophyll) to enhance the growth of Cv [25]. Moreover, we found growth traits to characterize the selenium biofortification capacity of Cv. In this study, compared with S2, S3-S6 showed no significant difference in chlorophyll and total nitrogen content (Table 1 and Table 2). However, root, stem, and leaf biomass decreased significantly (Table 3) due to an accumulation of reactive oxygen induced by high SeMet levels. However, chlorophyll levels were maintained in the short term, and high SeMet levels inhibited dry matter accumulation in Cv [23]. In addition, this study confirms the decoupling of Cv growth and physiological metabolism, demonstrating asynchronous changes between biomass and physiological metabolism under different SeMet levels. These results are attributed to endogenous regulation of growth [18], energy allocation strategies [13], and environmental interactions of Cv, rather than to biomass accumulation alone [26]. Consequently, on day 4, there were no significant changes in the growth traits of S2 and S3, including no changes in biomass, plant height, leaf area, total chlorophyll content, or total nitrogen content, indicating that measuring growth traits alone cannot accurately reflect the SeMet formulations of Cv. To address this shortcoming, we further examined the electrophysiological water metabolism and nutrient transport of Cv leaves under different SeMet levels on day 4 (see Section 4.2).

4.2. Electrophysiological Water Metabolism, Nutrient Transport, and Metabolic Activities of Cv Leaves Under Different Semet Conditions

In this study, based on the electrical signals of Cv leaves, including leaf Cp, R, Z, Xc and XL of Cv, an electrophysiological model was constructed to relate the above electrical signals to different gripping forces (Fs) [13] (R2 = 0.99, p < 0.05, Figure 3), and to quantify the water metabolism, nutrient transport, and metabolic activities of Cv leaves under different SeMet levels. It showed that the ICp of S2 increased significantly (Figure 4a), suggesting that vacuoles increased in volume at S2, which facilitated nutrient absorption in the cells [27]. Moreover, the IR and IZ of S2 decreased (Figure 4b–c), which facilitated the transport of SeMet and also the uptake of nutrients, such as K+ and NO3 [9]. This result is consistent with the significant increase in SPAD (Table 1) and TN (Table 2) in S2. Importantly, we found that when the SeMet level increased, the IWHC (Figure 5a) and WTR (Figure 5c) of S3–S6 were significantly reduced, resulting in a reduction in active nutrient transport capacity (NTR, Figure 5f). At the same time, the IWUE (Figure 5b) of Cv increased significantly, leading to an increase in its passive transport capacity (NTC and UNF, Figure 5d,e). It has been shown that high SeMet levels induced membrane lipid peroxidation, leading to the inhibition of aquaporin (AQP) activity [28], water transport, and nutrient transport in plant species [27], thereby inhibiting the growth of Cv. Furthermore, we found that MA, MF and MR increased significantly in S2, whilst MA, MF and MR decreased significantly in S3–S6 (Figure 6). This indicated that S2 had the highest metabolic activities of Cv. However, with the increase in SeMet levels, the MA, MF and MR of S3–S6 decreased, which was attributed to high SeMet levels inhibiting the electrophysiologically active nutrient transport of Cv, leading to a reduction in nutrient store capacity in the vacuole [29]. In summary, S2 is the optimal SeMet level for Cv.

4.3. Establishment of Electrophysiological Selenium Enhancement Characteristics of Cv

Based on the electrophysiological water metabolism, nutrient transport, and metabolic activity of Cv leaves, we established the electrophysiological selenium enhancement characteristics and constructed five electrophysiological factors (Figure 7), including: electrophysiological efflux capacity (ES1), dilution capacity (ES2), ultrafiltration capacity (ES3), total SeMet transport capacity (STC), and enhancement capacity (ESR). In particular, ES1 represents the efficiency of transmembrane SeMet efflux, and it is negatively correlated with IR and IZ. ES2 represents the ability of SeMet to dilute and compartmentalize within cells, and it is significantly positively correlated with ICp and IWHC. ES3 represents the ultrafiltration retention capacity of the cell wall or vacuole of SeMet, and it is significantly negatively correlated with IXc. STC shows a significant positive correlation with electrophysiological nutrient transport; ESR is the weighted average of E1–E3, and it is used to characterize electrophysiological selenium enhancement characteristics of Cv. Correlation analysis shows (Figure 8) that ESR was significantly positively correlated with total biomass (R2 = 0.89, p ≤ 0.01) and leaf area (R2 = 0.85, p ≤ 0.05). S2 had the highest ESR, consistent with the maximum biomass and SPAD. Conversely, ES1 was significantly elevated in S4–S6, suggesting that high SeMet levels may induce a forced selenium-excreting metabolic pathway of Cv [30]. IR, IZ, IXC, and IXL of S6 increased, suggesting that high SeMet levels caused membrane lipid peroxidation and water metabolism reduction [22], leading to the biomass of S6 dropping to the lowest level. Furthermore, ES2 was positively correlated with plant height (R2 = 0.78, p ≤ 0.05) and TN (R2 = 0.82, p ≤ 0.05). This indicated that the diluting capacity promoted nitrogen metabolic homeostasis, thereby alleviating high SeMet stress [31]. Otherwise, we found a negative correlation between ES3 and the root biomass of Cv (R2 = −0.74, p ≤ 0.05). This suggests that high SeMet ultrafiltration capacity may inhibit SeMet transport from the roots to the aboveground parts, thereby limiting the efficiency of SeMet fortification [32]. In summary, the electrophysiological selenium enhancement characteristics can clearly distinguish the differential SeMet biofortification of Cv.

4.4. The Coupling Between Growth Traits and Electrophysiological Selenium Enhancement Characteristics

Based on a correlation analysis, we revealed the relationship between the growth traits and electrophysiological selenium enhancement characteristics of Cv (Figure 8). The results showed that ICp was significantly positively correlated with SPAD and TN (p ≤ 0.05), indicating that the cell membrane capacitance is consistent with the photosynthetic function and IR and IZ are negatively correlated with biomass, indicating that low resistance and impedance are conducive to dry matter accumulation [33]. Moreover, we found that electrophysiological parameters responded earlier than growth traits under various SeMet levels. For example, the ICp and IR of S3 showed more significant differences than those of S2 (Figure 5), However, the changes between S2 and S3 were not significant in terms of growth traits (Table 3), indicating that electrophysiological responses more sensitively captured “masked potentiating effects” under various SeMet levels [34], manifested by a significant promotion of electrophysiological responses in S2, as well as enhanced nutrient active transport capacity and metabolic activities in S2. Furthermore, based on electrophysiological water metabolism and nutrient transport of Cv leaves, we found that SeMet may regulate the expression of aquaporins and nutrient ion channels on the membrane, thereby modulating carbon–nitrogen coupling metabolism in Cv. In this study, S2 was the optimal SeMet level of Cv, exhibiting the highest biomass and ICp, indicating S2 prioritized the allocation of energy to growth metabolism, resulting in a higher SeMet enrichment efficiency of Cv. However, we found decoupling in S6, with growth traits showing a high SPAD value but low biomass, indicating that at high SeMet levels, Cv prioritizes the allocation of energy to resist growth stress rather than to support its growth [35]. Consequently, S6 reduces energy expenditure on growth, as indicated by the lowest ICp, IWHC, WTR, and NTR in S6 (high SeMet level). The above results indicate that both growth traits and electrophysiological responses showed high consistency. Hence, ESR could be an electrophysiological indicator to reflect selenium biofortification among plant species.

5. Conclusions

In this study, based on growth traits and electrophysiological characteristics, we found that day 4 was the optimal time, and S2 (100 mg/L) was the optimal level of SeMet utilization. Compared with growth traits, electrophysiological parameters were more sensitive to the selenium biofortification of Cv. This was manifested by the greatest change in ICp in S2, whilst IR, IZ, IXC, and IXL showed opposite trends to ICp. Moreover, the increases in IWHC, WTR, and NTR most strongly promoted MA, thereby enhancing the highest SeMet fortification in S2. However, S3–S6 (>100 mg/L SeMet) inhibited IWHC and NTR in Cv, even though the ESR of S6 was higher than that of CK, while ES2 enhanced STC and ES1 in S6, which was still attributed to greater energy expenditure in counteracting high SeMet stress, leading to growth restriction in Cv at high SeMet levels. Correlation analysis showed ESR was significantly positively correlated with biomass, leaf area, and electrophysiological metabolic activity, suggesting that ESR could be an electrophysiological factor for monitoring selenium biofortification. Hence, plant electrophysiological technology could serve as a new method for analyzing selenium fortification. It holds considerable potential for smart agricultural monitoring, including precise applications and selenium tolerance among selenium hyperaccumulators.

Author Contributions

A.X.: Investigation, validation, formal analysis, writing—original draft, funding acquisition, and correspondence. J.Z.: Resources, supervision. Y.W.: Data curation and analysis. S.C.: Methodology, supervision. K.Z.: Supervision, funding acquisition, and revising. D.X.: Supervision, writing, and editing. All authors have read and agreed to the published version of the manuscript.

Funding

This research was funded by the National Natural Science Foundation of China, No. 22166017, 22366014; Provincial Science and Technology Planning Project, No. 2024BBB082; Hubei Provincial Key Laboratory Open Fund for Selenium Resource Research and Biological Application, No. PT10202404; Prefecture Science and Technology Innovation Project, No. D20230013; Hubei Minzu University Doctoral Research Launch Project, No. BS26031; Hubei Minzu University 2026 Graduate Research and Innovation Project, No. MYK2026041; Hubei Provincial Department of Education Project, No. B2025082.

Data Availability Statement

The original contributions presented in this study are included in the article. Further inquiries can be directed to the corresponding author.

Acknowledgments

In this study, we kindly appreciate the academy of agricultural sciences, Enshi Tujia and Miao autonomous prefecture (Enshi, China) for providing Cardamine violifolia seedlings.

Conflicts of Interest

The authors declare no conflict of interest.

Abbreviations

The following abbreviations are used in this manuscript.
CvCardamine violifolia
SeMetselenomethionine
SPADtotal chlorophyll content
TNtotal nitrogen content
Fclamping force
Cpcapacitance
Rresistance
Zimpedance
XCcapacitive reactance
XLinductive reactance
ICpintrinsic capacitance
IRintrinsic resistance
IXCintrinsic capacitive reactance
IXLintrinsic inductive reactance
IZintrinsic impedance
IWHCintracellular water-holding capacity
deffective thickness
IWUEintracellular water use efficiency
IWHTintracellular water-holding time
WTRwater transfer rate
NTCnutrient translocation capacity
UNFnutrient flux per unit area
NTRnutrient translocation rate
MAmetabolic Activity
MFmembrane Fluidity
MRmembrane Resistance
STCSeMet transport capacity
ES1electrophysiological selenium excretion capacity
ES2selenium dilution capacity
ES3selenium ultrafiltration capacity
ESRelectrophysiological selenium biofortification factor

References

  1. He, Q.; Yang, Y.; Wu, Y.; Bai, F.; Peng, C.; Hou, R.; Sun, Y.; Cai, H. Preparation and analysis of selenium-enriched oleogels: Preliminary evaluation of antioxidant activity and inhibition of fatty acids release. LWT 2023, 186, 115203. [Google Scholar] [CrossRef] [Scilit]
  2. Chao, W.; Rao, S.; Chen, Q.; Zhang, W.; Liao, Y.; Ye, J.; Cheng, S.; Yang, X.; Xu, F. Advances in Research on the Involvement of Selenium in Regulating Plant Ecosystems. Plants 2022, 11, 2712. [Google Scholar] [CrossRef] [Scilit] [PubMed]
  3. White, P.J. Selenium metabolism in plants. Biochim. Biophys. Acta (BBA)—Gen. Subj. 2018, 1862, 2333–2342. [Google Scholar] [CrossRef] [Scilit] [PubMed]
  4. Li, H.; Liu, H.; Tang, X.; Deng, Z.; Li, H. From Soil to Table: A Comprehensive Review of Selenium-Fortified Foods. Compr. Rev. Food Sci. Food Saf. 2025, 24, e70250. [Google Scholar] [CrossRef] [Scilit] [PubMed]
  5. Xiang, R.; Xiao, X.; Liu, J.; Guo, Z.; He, H.; Wang, X.; Wen, X.; Angelo, V.; Han, J. Protective effects of functional Nano-Selenium supplementation on spleen injury through regulation of p38 MAPK and NF-κBproteinexpression. Int. Immunopharmacol. 2024, 130, 111574. [Google Scholar] [CrossRef] [Scilit] [PubMed]
  6. Zhong, H.; Huang, Z.; Li, L.; Chen, X.; Zou, T.; Chen, J.; You, J. Selenomethionine Supplementation Mitigates Liver Dysfunction, Oxidative Injury and Apoptosis through Enhancing Antioxidant Capacity and Inhibiting JNK MAPK Pathway in Piglets Fed Deoxynivalenol-Contaminated Diets. Antioxidants 2024, 13, 295. [Google Scholar] [CrossRef] [Scilit] [PubMed]
  7. Wang, Y.; Zhou, M.; Gao, S.; Li, P.; Zheng, X.; Tu, D.; Yang, L. Selenomethionine Counteracts T-2 Toxin-Induced Liver Injury by Mitigating Oxidative Stress Damage Through the Enhancement of Antioxidant Enzymes. Antioxidants 2025, 14, 866. [Google Scholar] [CrossRef] [Scilit] [PubMed]
  8. Mahmoud, A.E.M.; Battaglia, M.L.; Rady, M.M.; Mohamed, I.A.A.; Alharby, H.F.; Belal, H.E.E.; Desoky, E.-S.M.; Galal, T.M.; Ali, E.F. Alleviation of cadmium toxicity in soybean (Glycine max L.):Up-regulating antioxidant capacity and enzyme gene expressions and down-regulating cadmium uptake by organic or inorganic selenium. Plant Physiol. Biochem. 2024, 215, 109068. [Google Scholar] [CrossRef] [Scilit] [PubMed]
  9. Zhang, C.; Wu, Y.; Su, Y.; Li, H.; Fang, L.; Xing, D. Plant’s electrophysiological information manifests the composition and nutrient transport characteristics of membrane proteins. Plant Signal. Behav. 2021, 16, 1918867. [Google Scholar] [CrossRef] [Scilit] [PubMed]
  10. Sukhova, E.M.; Yudina, L.M.; Sukhov, V.S. Changes in Activity of the Plasma Membrane H+-ATPase as a Link Between Formation of Electrical Signals and Induction of Photosynthetic Responses in Higher Plants. Biochemistry (Moscow) 2023, 88, 1488–1503. [Google Scholar] [CrossRef] [Scilit] [PubMed]
  11. Yuan, D.; Wu, X.-L.; Jiang, X.-Q.; Lan, Z.-W.; Zhao, L.-R.; Wang, Y.-D.; Gao, H.-B. Patch-Clamp- and 15N Isotope Tracer-Based Techniques Reveal the Transport Characteristics of SlGAT1 and the Metabolic Flow of Exogenous GABA Under Salt Stress. Plant Cell Environ. 2025, 48, 6820–6834. [Google Scholar] [CrossRef] [Scilit] [PubMed]
  12. Zhou, J.; Fan, P.; Zhou, S.; Pan, Y.; Ping, J. Machine learning-assisted implantable plant electrophysiology microneedle sensor for plant stress monitoring. Biosens. Bioelectron. 2025, 271, 117062. [Google Scholar] [CrossRef] [Scilit] [PubMed]
  13. Xiao, J.; Xia, A.; Wu, Y.; Wang, D.; Qin, Z.; Xiang, J.; Twagirayezu, G. Plant electrical signals reveal the joint interactions of bicarbonate- selenium on cadmium transport in Cardamine violifolia. Plant Signal. Behav. 2025, 20, 2486075. [Google Scholar] [CrossRef] [Scilit] [PubMed]
  14. Xing, D.; Chen, L.; Wu, Y.; Zwiazek, J.J. Leaf physiological impedance and elasticity modulus in Orychophragmus violaceus seedlings subjected to repeated osmotic stress. Sci. Hortic. 2021, 279, 109763. [Google Scholar] [CrossRef] [Scilit]
  15. Yao, J.; Ling, Y.; Hou, P.; Wang, Z.; Huang, L. A graph neural network model for deciphering the biological mechanisms of plant electrical signal classification. Appl. Soft Comput. 2023, 137, 110153. [Google Scholar] [CrossRef] [Scilit]
  16. Gu, X.; Xia, A.; Wu, Y.; Gratien, T.; Fan, J.; Wang, C.; Xiang, D.; Zhai, K.; Song, X. Electrophysiological sensors reveal silicon–selenium interaction of dynamic leaf intracellular water–nutrient metabolism in rice under cadmium stress. Plant Signal. Behav. 2025, 20, 2547384. [Google Scholar] [CrossRef] [Scilit] [PubMed]
  17. Abdalla, M.A.; Sulieman, S.; Mühling, K.H. Regulation of Selenium/Sulfur Interactions to Enhance Chemopreventive Effects: Lessons to Learn from Brassicaceae. Molecules 2020, 25, 5846. [Google Scholar] [CrossRef] [Scilit] [PubMed]
  18. Rao, S.; Yu, T.; Cong, X.; Lai, X.; Xiang, J.; Cao, J.; Liao, X.; Gou, Y.; Chao, W.; Xue, H.; et al. Transcriptome, proteome, and metabolome reveal the mechanism of tolerance to selenate toxicity in Cardamine violifolia. J. Hazard. Mater. 2021, 406, 124283. [Google Scholar] [CrossRef] [Scilit] [PubMed]
  19. Liu, X.M.; Yuan, Z.G.; Rao, S.; Zhang, W.W.; Ye, J.B.; Cheng, S.Y.; Xu, F. Identification, characterization, and expression analysis of WRKY transcription factors in Cardamine violifolia reveal the key genes involved in regulating selenium accumulation. BMC Plant Biol. 2024, 24, 860. [Google Scholar] [CrossRef] [Scilit] [PubMed]
  20. Vadillo, J.M.; Campillo, C.; Millán, S.; Prieto, H. Evaluation of Nitrogen Nutritional Status in Broccoli, Processing Tomato, and Processing Pepper Under Different Fertilization Regimes in Open Fields in Extremadura. Horticulturae 2025, 11, 733. [Google Scholar] [CrossRef] [Scilit]
  21. Ma, Y.; Yin, J.; Wang, J.; Liu, X.; He, J.; Zhang, R.; Rao, S.; Cong, X.; Xiong, Y.; Wu, M. Selenium speciation and volatile flavor compound profiles in the edible flowers, stems, and leaves of selenium-hyperaccumulating vegetable Cardamine violifolia. Food Chem. 2023, 427, 136710. [Google Scholar] [CrossRef] [Scilit] [PubMed]
  22. Xia, A.; Wu, Y.; Zhai, K.; Xiang, D.; Li, L.; Qin, Z.; Twagirayezu, G. Plant Electrophysiological Parameters Represent Leaf Intracellular Water-Nutrient Metabolism and Immunoregulations in Brassica rapa During Plasmodiophora Infection. Plants 2025, 14, 2337. [Google Scholar] [CrossRef] [Scilit] [PubMed]
  23. Zhang, C.; Su, Y.; Wu, Y.; Li, H.; Zhou, Y.; Xing, D. Comparison on the Nutrient Plunder Capacity of Orychophragmus violaceus and Brassica napus L. Based on Electrophysiological Information. Horticulturae 2021, 7, 206. [Google Scholar] [CrossRef] [Scilit]
  24. Xiong, D.; Flexas, J. Leaf economics spectrum in rice: Leaf anatomical, biochemical, and physiological trait trade-offs. J. Exp. Bot. 2018, 69, 4437–4449. [Google Scholar] [CrossRef] [Scilit] [PubMed]
  25. Takata, N.; Botha, A.; Nomngongo, P.N. Development of a Method for the Determination of Total Selenium in Soil, Maize Plants, and Maize Flour by Inductively Coupled Plasma Tandem Mass Spectrometry (ICP-MS/MS). Anal. Lett. 2023, 56, 2367–2381. [Google Scholar] [CrossRef] [Scilit]
  26. Khan, Z.; Thounaojam, T.C.; Chowdhury, D.; Upadhyaya, H. The role of selenium and nano selenium on physiological responses in plant: A review. Plant Growth Regul. 2023, 100, 409–433. [Google Scholar] [CrossRef] [Scilit] [PubMed]
  27. Takatsuka, H.; Higaki, T.; Ito, M. At the Nexus between Cytoskeleton and Vacuole: How Plant Cytoskeletons Govern the Dynamics of Large Vacuoles. Int. J. Mol. Sci. 2023, 24, 4143. [Google Scholar] [CrossRef] [Scilit] [PubMed]
  28. Rhee, J. Modulation of AtPIP2;5 expression regulates root suberin synthesis and composition. J. Plant Biotechnol. 2025, 52, 323–328. [Google Scholar] [CrossRef] [Scilit]
  29. Kruger, N.J.; Le Lay, P.; Ratcliffe, R.G. Vacuolar compartmentation complicates the steady-state analysis of glucose metabolism and forces reappraisal of sucrose cycling in plants. Phytochemistry 2007, 68, 2189–2196. [Google Scholar] [CrossRef] [Scilit] [PubMed]
  30. Wu, M.; Cong, X.; Li, M.; Rao, S.; Liu, Y.; Guo, J.; Zhu, S.; Chen, S.; Xu, F.; Cheng, S.; et al. Effects of different exogenous selenium on Se accumulation, nutrition quality, elements uptake, and antioxidant response in the hyperaccumulation plant Cardamine violifolia. Ecotoxicol. Environ. Saf. 2020, 204, 111045. [Google Scholar] [CrossRef] [Scilit] [PubMed]
  31. Ismail, M.S.; Elsakhawy, T.; El-Hamdi, K.H.; El-Banna, A.A.; Hegab, R.H. Contributions of nitrogen metabolic enzymes in storage protein assimilation and mineral accumulation regulated by nitrogen and selenium in Triticum aestivum L. Plant Physiol. Biochem. 2025, 221, 109597. [Google Scholar] [CrossRef] [Scilit]
  32. Wang, Q.; Huang, S.; Huang, Q.; Yu, Y.; Li, H.; Wan, Y. Absorption and Biotransformation of Selenomethionine and Selenomethionine-Oxide by Wheat Seedlings (Triticum aestivum L.). Plants 2024, 13, 380. [Google Scholar] [CrossRef] [Scilit] [PubMed]
  33. Xing, D.; Mao, R.; Li, Z.; Wu, Y.; Qin, X.; Fu, W. Leaf Intracellular water transfer rate Based on Physiological Impedance: A Possible Role of Leaf Internal Retained Water in Photosynthesis and Growth of Tomatoes. Front. Plant Sci. 2022, 13, 845628. [Google Scholar] [CrossRef] [Scilit] [PubMed]
  34. Gamarra Reinoso, L.; Majláth, I.; Dernovics, M.; Fábián, A.; Jose, J.; Jampoh, E.A.; Hamow, K.Á.; Soós, V.; Sági, L.; Éva, C. Root-based inorganic carbon uptake increases the growth of Arabidopsis thaliana and changes transporter expression and nitrogen and sulfur metabolism. Front. Plant Sci. 2024, 15, 1448432. [Google Scholar] [CrossRef] [Scilit] [PubMed]
  35. Jiao, R.; He, P.; Bakpa, E.P.; Liao, L.; Li, Q.; Wu, B.; Liu, H. Different shifts in growth-defense tradeoff for above- and belowground of Miscanthus floridulus enhance tolerance to cadmium. Environ. Exp. Bot. 2024, 226, 105951. [Google Scholar] [CrossRef] [Scilit]
Figure 1. Diagram of a plant electrophysiology apparatus.
Plants 15 02680 g001
Figure 2. Morphological performance of Cardamine violifolia seedlings subjected to different SeMet concentrations at day 4. Images were obtained using three shooting modes: eye-level photography of potted plants, top-down canopy imaging, and flat-laid observation of thoroughly washed whole seedlings.
Plants 15 02680 g002
Figure 3. Electrophysiological equations for (a) Inherent capacitance, Cp; (b) inherent resistance, R; (c) inherent impedance, Z; (d) inherent capacitive reactance, Xc; (e) inherent inductive reactance, XL of Cv leaves under different SeMet conditions and for different clamping forces F (1–7 N), p < 0.01.
Plants 15 02680 g003
Figure 4. Intrinsic electrophysiological parameters of Cv leaves under different SeMet levels. Inherent capacitance, ICp (a); inherent resistance, IR (b); inherent impedance, IZ (c); inherent capacitive reactance, IXc (d); inherent inductive reactance, IXL (e). Each value represents the mean ± standard deviation (n = 3). Different lowercase letters indicate significant differences between groups (p < 0.05).
Plants 15 02680 g004
Figure 5. Intracellular electrophysiological water metabolism and nutrient transport of Cv leaves under different SeMet levels. (a) Intracellular water-holding capacity, IWHC; (b) intracellular water-holding time, IWUE; (c) water transfer rate, WTR; (d) unit nutrient transport capacity, NTC; (e) unit nutrient flux, UNF; (f) unit nutrient transport rate, NTR. Each value represents the mean ± standard deviation (n = 3). Different lowercase letters indicate significant differences between groups (p < 0.05).
Plants 15 02680 g005
Figure 6. Electrophysiological metabolic activities of Cv leaves under different SeMet levels. (a) Metabolic activity, MA; (b) membrane fluidity, MF; (c) membrane resistance, MR. Each value represents the mean ± standard deviation (n = 3). Different lowercase letters indicate significant differences between groups (p < 0.05).
Plants 15 02680 g006
Figure 7. Electrophysiological selenium enhancement characteristics of Cv leaves. STC: SeMet transport capacity; ES1: electrophysiological selenium excretion capacity; ES2: selenium dilution capacity; ES3: selenium ultrafiltration capacity; ESR: electrophysiological selenium enhancement characteristic factor. Each value represents the mean ± standard deviation (n = 3).
Plants 15 02680 g007
Figure 8. Correlation analysis based on the growth traits and electrophysiological characteristics of Cv leaves under different SeMet conditions (p ≤ 0.05). All characteristics are defined in the list of abbreviations.
Plants 15 02680 g008
Table 1. Total chlorophyll content (SPAD) of Cv leaves over time under different SeMet levels. (Data in the table represent the relative proportional change compared with Day 0).
Treatment
Days
0246810
CK-03.22%4.60%0−10.29%
S1-26.40%28.08%30.11%21.91%22.01%
S2-40.42%48.35%44.46%42.64%41.20%
S3-27.31%38.08%33.95%29.02%27.93%
S4-33.55%38.77%38.39%35.46%33.93%
S5-14.24%17.46%17.78%13.50%12.54%
S6-25.22%34.25%31.89%24.87%23.55%
Table 2. Total nitrogen content of Cv leaves over time under different SeMet levels. (Data in the table represent the relative proportional change compared with Day 0).
Treatment
Days
0246810
CK-012.37%−1.37%05.09%
S1-13.71%35.39%35.99%14.82%15.68%
S2-27.17%57.64%49.13%34.49%31.75%
S3-24.09%44.65%34.79%14.32%12.05%
S4-28.74%46.60%43.25%22.67%18.50%
S5-12.93%20.21%29.91%7.52%2.43%
S6-21.68%41.13%40.27%10.80%4.54%
Table 3. Root, stem, leaf and total biomass of Cv seedings under different SeMet treatments. Each value represents the mean ± standard deviation (n = 3). Different lowercase letters indicate significant differences between groups (p < 0.05).
TreatmentRoot
(Fw, g/plan)
Stem
(Fw, g/plan)
Leaves
(Fw, g/plan)
Total Biomass
(Fw, g/plan)
CK----
S1−25%−12%−10%−12%
S23%33%33%30%
S3−9%−9%−5%−7%
S4−44%−8%2%−6%
S5−47%−14%−5%−13%
S6−57%−24%−41%−36%
Table 4. Plant height, leaf area, total chlorophyll content and total nitrogen content of Cv under different SeMet treatments. Each value represents the mean ± standard deviation (n = 3). Different lowercase letters indicate significant differences between groups (p < 0.05).
TreatmentPlant Height
(cm)
LA
(cm3)
Chlorophyll
(SPAD)
Totalnitrogen
(mg/g)
CK----
S13.13%9.13%11.84%13.67%
S24.06%16.54%18.91%23.96%
S32.32%7.14%18.60%23.53%
S44.04%2.52%13.40%16.33%
S54.06%3.20%13.80%6.98%
S63.31%11.02%17.23%18.49%
Disclaimer/Publisher’s Note: The statements, opinions and data contained in all publications are solely those of the individual author(s) and contributor(s) and not of MDPI and/or the editor(s). MDPI and/or the editor(s) disclaim responsibility for any injury to people or property resulting from any ideas, methods, instructions or products referred to in the content.