Article

Rhizosphere Bacterial Communities of Two Coastal Halophytes Under Salinity–Flooding Stress

1
School of Grassland Science, Beijing Forestry University, Beijing 100083, China
2
College of Horticulture and Plant Protection, Inner Mongolia Agricultural University, Hohhot 010018, China
3
Department of Biology, Vrije Universiteit Brussel (VUB), 1050 Brussels, Belgium
4
Institute of Entomology, Guizhou University, Guiyang 550025, China
5
Dongying Academy of Agricultural Sciences, Dongying 257000, China
*
Author to whom correspondence should be addressed.
These authors contributed equally to this work.
Plants 2026, 15(17), 2565; https://doi.org/10.3390/plants15172565
Submission received: 9 March 2026 / Revised: 22 May 2026 / Accepted: 26 May 2026 / Published: 24 August 2026

Abstract

Soil salinisation and periodic flooding jointly shape coastal wetland ecosystems, but how coexisting halophytes differ in their rhizosphere bacterial communities under these conditions remains insufficiently understood. Here, we investigated rhizosphere bacterial communities associated with Suaeda glauca Bunge and Tamarix chinensis Lour. in saline–alkaline habitats of the Yellow River Delta, China. Twenty quadrat-level rhizosphere samples were collected across four plant–habitat groups, and near-full-length 16S rRNA gene amplicons were sequenced using Pacific Biosciences single-molecule real-time sequencing. Our analysis revealed that hydrological habitat and plant identity together contributed to differences in rhizosphere bacterial community composition. Across the dataset, 2325 bacterial operational taxonomic units were identified. T. chinensis showed higher Shannon and Gini–Simpson diversity, whereas richness patterns depended on habitat and the metric examined. Meanwhile, exploratory genus-level association networks revealed host- and habitat-dependent differences in node number, network density and average degree. PICRUSt2-based functional prediction suggested contrasting predicted functional response patterns: the S. glauca rhizosphere showed 19 significantly altered predicted pathways between flooded and non-flooded habitats, whereas the T. chinensis rhizosphere showed no significant pathway shifts after multiple-testing correction. These findings suggest that coexisting halophytes are associated with divergent rhizosphere bacterial community patterns under saline–alkaline and flooding-associated habitat conditions.

1. Introduction

Global soil salinisation is a major environmental challenge affecting terrestrial ecosystems in the 21st century, with impacts extending beyond agricultural productivity to ecosystem stability and biogeochemical cycles [1,2,3]. Recent estimates indicate that salt-affected lands cover more than one billion hectares worldwide, and their extent continues to expand across arid, semi-arid and coastal regions [4,5]. The spread of salt-affected soils contributes to ecological degradation, threatening natural ecosystems and agricultural systems that underpin global food security. Climate change, altered precipitation regimes, warming, sea-level rise, intensive irrigation and coastal development can jointly accelerate salinisation across diverse geographical regions. Without effective mitigation, the extent and severity of soil salinisation are expected to increase [2], with consequences for food production, soil health and ecosystem services [1,6].
Coastal saline–alkaline ecosystems are shaped not only by salinity but also by hydrological processes such as tidal flooding, redox fluctuation and nutrient redistribution. Inundation can alter oxygen availability, ion mobility, soil pH, nutrient pools and organic matter turnover, thereby changing the environmental template in which roots and microorganisms interact [7,8]. For native halophytes, flooding may therefore be interpreted as a hydrological and biogeochemical filter rather than as a uniformly detrimental “stress” in the conventional agronomic sense. This distinction is important because halophytes naturally dominate these habitats, whereas their associated rhizosphere microbiomes may still differ in how they assemble under shared environmental filtering [9,10,11].
China contains extensive salt-affected land, and the Yellow River Delta is a representative coastal saline–alkaline region with strong hydrological gradients and severe soil salinisation [12,13,14,15]. Seawater intrusion and evaporation can increase soil salinity, while tidal flooding and waterlogging can modify oxygen availability and soil nutrient dynamics [13,16,17]. Salt exposure can impair plant photosynthesis, membrane stability, ion homeostasis and growth [18,19]. In parallel, flooding may reduce root-zone oxygen availability and influence root respiration and nutrient acquisition [20,21].
These salinity-inundation dynamics can also influence soil and rhizosphere microbial communities. Previous studies have shown that salinity can alter microbial diversity, abundance, metabolism and nutrient cycling in coastal wetlands and saline soils [22,23]. Rhizosphere microorganisms may affect plant performance through nutrient mobilisation, hormone-related regulation, osmotic adjustment, redox buffering and stress mitigation [24,25,26,27,28,29,30]. Under flooding or hypoxia, some plants may be associated with bacterial taxa that help alleviate oxygen-limitation effects, while under salinity, plant-associated microbes may contribute to ion homeostasis and stress tolerance [31,32].
Plant growth-promoting rhizobacteria (PGPRs) further illustrate the applied ecological relevance of rhizosphere microbial ecology. PGPR inoculation has been shown to mitigate saline–alkaline or flooding constraints in some systems, promoting plant growth under adverse soil conditions [33,34,35,36,37]. Experimental studies suggest that PGPRs can regulate plant osmotic balance and ion homeostasis through hormone modulation, gene expression, protein function and metabolite synthesis [38]. They may also enhance antioxidant activity, osmolyte accumulation, salt compartmentalisation, proton transport and nutrient status, thereby helping to alleviate osmotic stress and ion toxicity [39]. Together, these studies support the broader view that rhizosphere microorganisms are important components of plant adaptation in saline environments and provide an ecological rationale for microbiome-informed restoration.
Halophytes such as Suaeda glauca Bunge and Tamarix chinensis Lour. are key species in the Yellow River Delta and provide useful systems for examining plant–microbe interactions under saline–alkaline conditions [40,41]. S. glauca tolerates high salinity through mechanisms including Na+/H+ exchange, vacuolar ion sequestration, and selective root uptake [42,43]. Its root exudates promote the enrichment of beneficial rhizobacteria, such as Gemmata and Gemmatimonas, which contribute to nitrogen fixation, nutrient availability, and soil structure improvement, thereby enhancing plant salt tolerance [44,45]. Similarly, T. chinensis exhibits strong salt tolerance and can influence rhizosphere soil properties and microbial recruitment in saline environments [46,47,48]. Importantly, comparing these two species is not an attempt to treat them as ecologically identical hosts; rather, it provides an explicit host-identity comparison under the same regional salinity–flooding filter. Their contrasting life-history strategies, growth forms, and salt-handling traits make them an ecologically informative pair for examining whether host identity modifies rhizosphere microbiome assembly under shared external conditions. Despite these insights, knowledge gaps remain regarding whether coexisting halophytes maintain similar rhizosphere bacterial communities under flooded and non-flooded saline–alkaline conditions or instead harbour distinct microbiome assembly patterns. High-throughput amplicon sequencing and related bioinformatic approaches now allow detailed characterisation of these communities, providing opportunities to examine microbial community patterns and predicted functional potential in environmental adaptation and ecosystem restoration [49,50].
In this study, we collected rhizosphere soil samples from S. glauca and T. chinensis in flooded and non-flooded saline–alkaline habitats of the Yellow River Delta. We used PacBio single-molecule real-time near-full-length 16S rRNA gene amplicon sequencing to compare bacterial community composition, alpha and beta diversity, taxonomic signatures, predicted functional profiles, exploratory genus-level association networks, biomarker taxa and descriptive phylogenetic patterns. We hypothesised that both hydrological habitat and plant identity would contribute to differences in bacterial community composition. Because the flooded and non-flooded conditions were represented by different field sites, and each treatment group comprised only five biological replicates, we interpret the results as habitat-associated patterns and avoid strong causal attribution to flooding alone. Consequently, the genus-level consensus association networks are regarded as exploratory and hypothesis-generating rather than definitive ecological interaction networks. The findings provide preliminary insights into halophyte-associated microbiomes and their potential relevance for future microbiome-informed saline–alkaline wetland restoration.

2. Results

2.1. Descriptive Differences in Soil Physicochemical Properties Between Flooded and Non-Flooded Rhizosphere Habitats

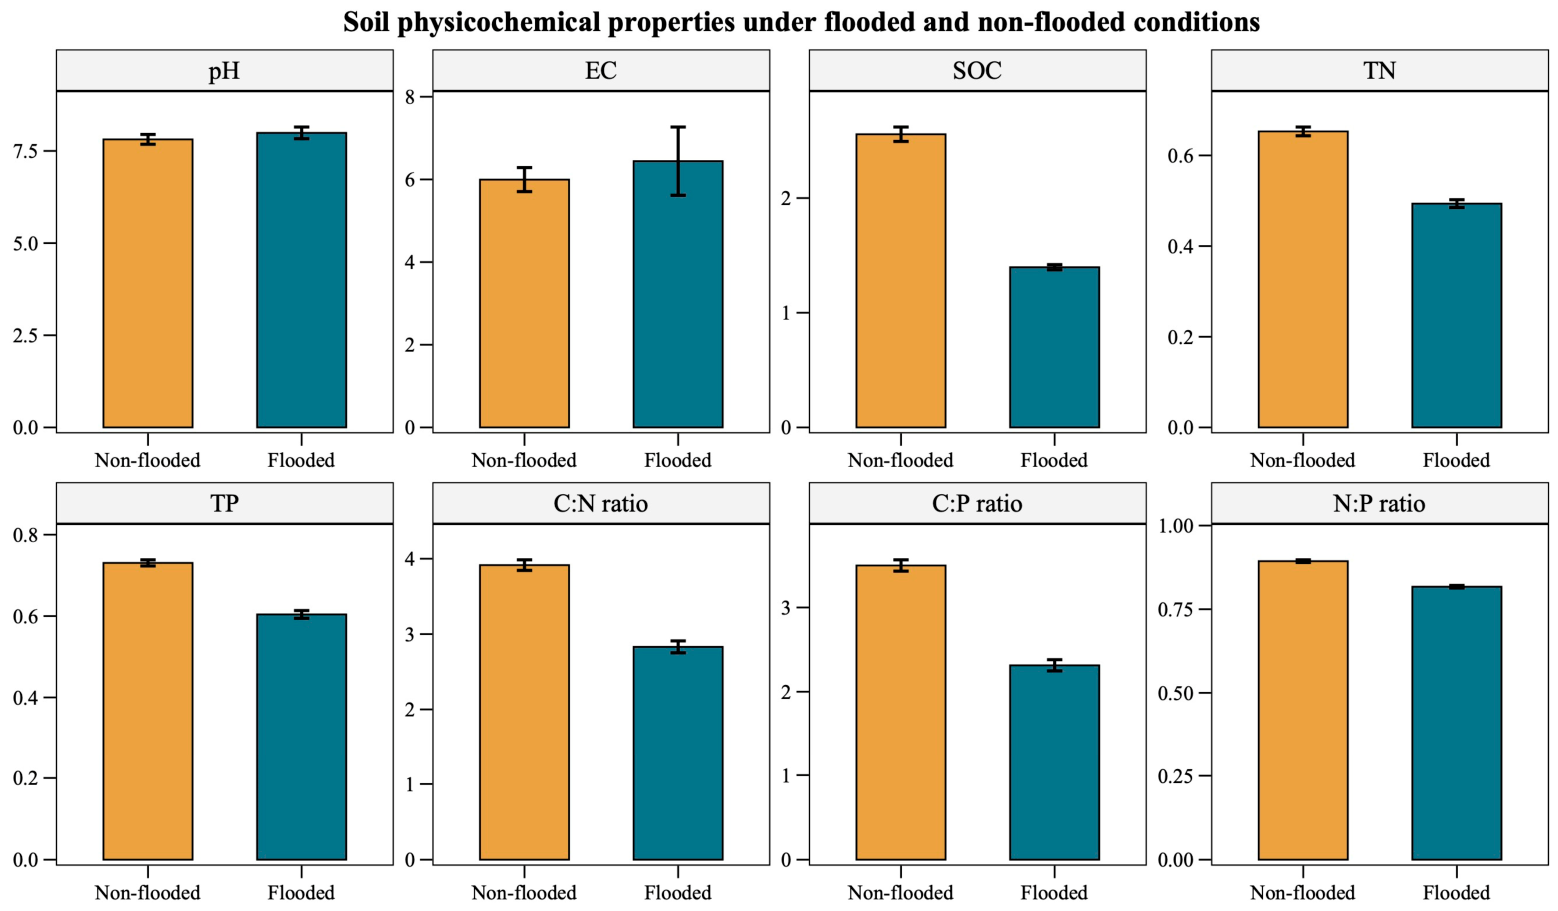
Soil physicochemical properties showed clear descriptive differences between the flooded and non-flooded saline–alkaline rhizosphere habitats (Figure 1). The flooded habitat showed slightly higher pH and EC than the non-flooded habitat. Mean pH was 7.990 ± 0.158 in the flooded habitat and 7.814 ± 0.133 in the non-flooded habitat. Mean EC was 6.442 ± 0.826 mS cm−1 in the flooded habitat and 5.996 ± 0.291 mS cm−1 in the non-flooded habitat. These descriptive patterns indicate that the flooded rhizosphere habitat was characterised by slightly stronger alkalinity and higher soluble salt levels. In contrast, nutrient-related variables were consistently higher in the non-flooded habitat. SOC was 2.557 ± 0.063 g kg−1 in the non-flooded habitat and 1.397 ± 0.023 g kg−1 in the flooded habitat. TN was 0.653 ± 0.010 g kg−1 under non-flooded conditions and 0.494 ± 0.009 g kg−1 under flooded conditions. TP was also higher in the non-flooded habitat, with values of 0.731 ± 0.008 g kg−1 compared with 0.604 ± 0.010 g kg−1 in the flooded habitat.
Stoichiometric ratios displayed a similar descriptive pattern. The non-flooded habitat had higher C:N, C:P, and N:P ratios, with values of 3.915 ± 0.070, 3.499 ± 0.067, and 0.894 ± 0.004, respectively. The corresponding values in the flooded habitat were 2.831 ± 0.079, 2.314 ± 0.067, and 0.817 ± 0.004. These descriptive differences suggest that the sampled non-flooded habitat had higher SOC, TN, and TP contents, as well as higher C:N, C:P, and N:P ratios, than the sampled flooded habitat. Overall, the soil physicochemical data indicate a distinct habitat-associated contrast between flooded and non-flooded saline–alkaline rhizospheres. Detailed soil physicochemical summary statistics are provided in Table S1.

2.2. Plant–Habitat-Associated Variation in Rhizosphere Bacterial Alpha Diversity

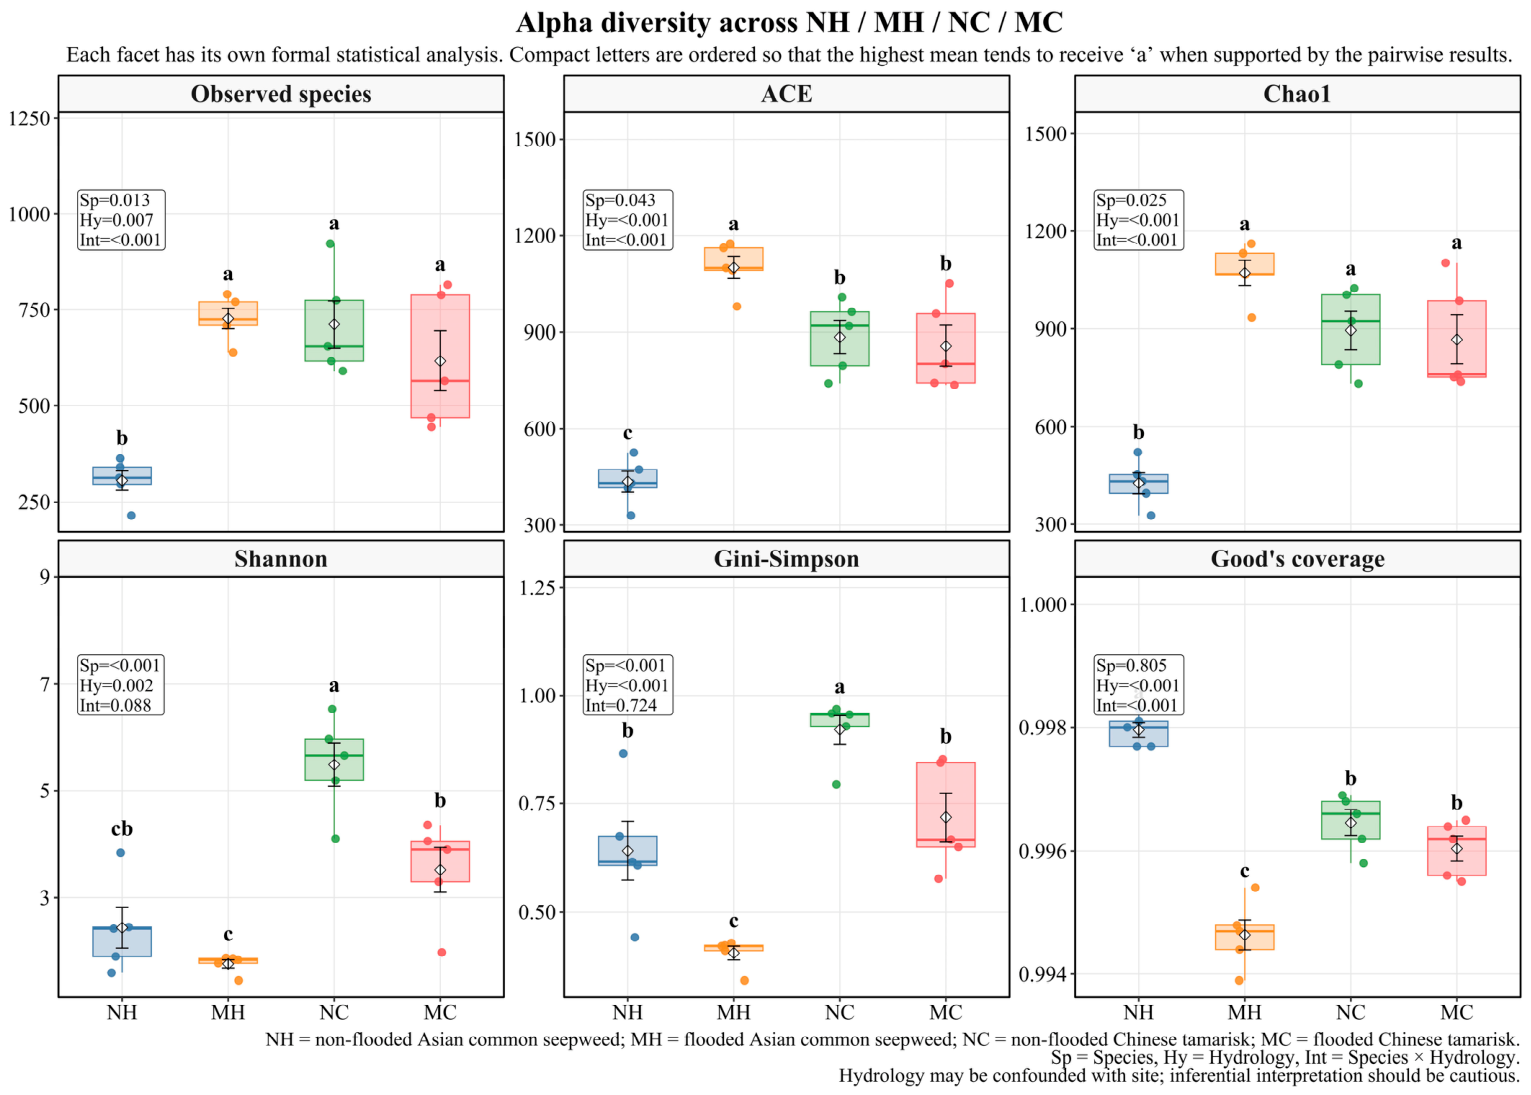
Alpha-diversity analysis showed clear plant–habitat-associated variation in rhizosphere bacterial richness, diversity, and sequencing coverage across NH, MH, NC, and MC (Figure 2). The evaluated metrics included observed species richness, ACE, Chao1, Shannon diversity, Gini–Simpson diversity, and Good’s coverage. Flooded habitats were associated with reduced bacterial diversity across both plant species, but the magnitude of reduction was species-dependent. Under non-flooded conditions, the rhizosphere of T. chinensis supported the highest bacterial diversity (Shannon index: 5.49 ± 0.91; Gini–Simpson index: 0.92 ± 0.07), significantly exceeding that of S. glauca. In contrast, S. glauca displayed the lowest bacterial richness under non-flooded soils (Chao1: 424 ± 71; ACE: 433 ± 72), suggesting a limited bacterial recruitment potential. Under flooding stress, community responses differed markedly between species. While T. chinensis experienced substantial diversity reductions (~35% decrease in Shannon index), it maintained significantly higher diversity than S. glauca. Interestingly, S. glauca exhibited increased richness under flooding (Chao1: 1072 ± 87; ACE: 1102 ± 77), possibly reflecting reduced competitive exclusion or altered niche availability in response to stress. Cross-species comparisons showed that T. chinensis had higher Shannon and Gini–Simpson diversity than S. glauca under the sampled conditions. Across both environmental conditions, T. chinensis showed higher bacterial diversity than S. glauca, whereas differences in estimated richness depended on the hydrological habitat and the diversity metric examined.

2.3. Hydrological Habitat and Plant Identity Jointly Shape Rhizosphere Bacterial Community Composition

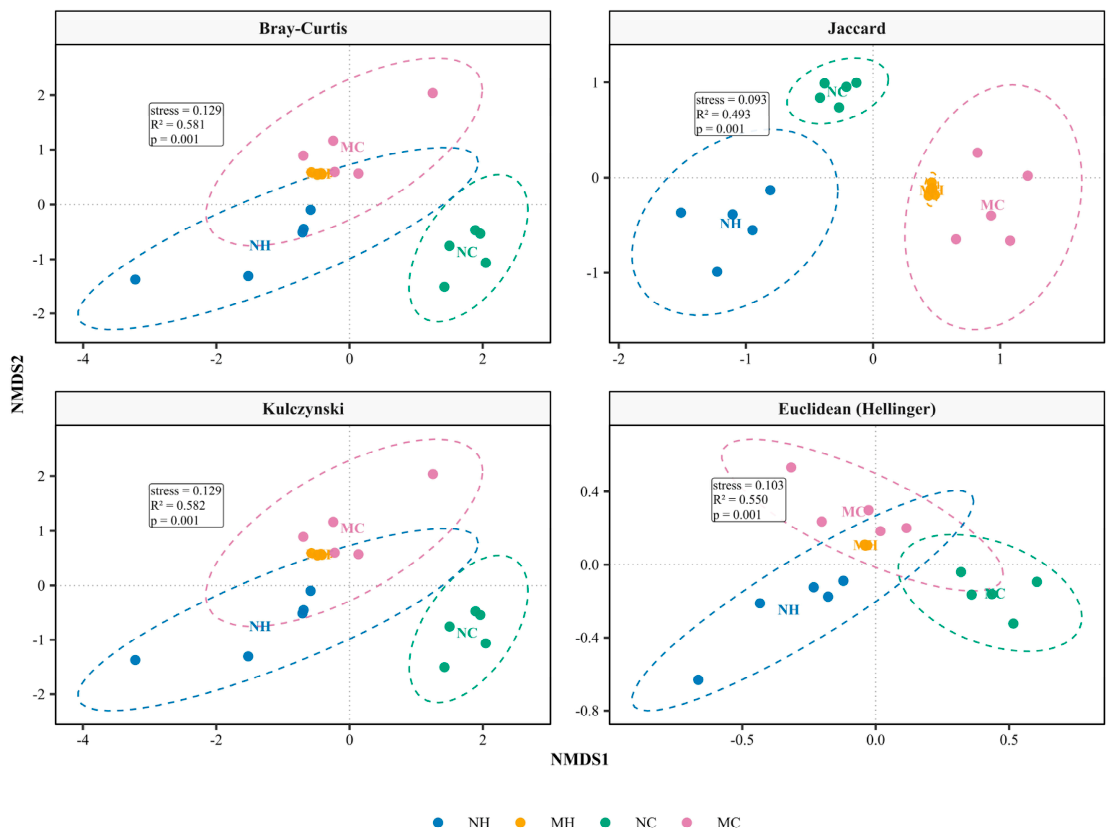
Beta diversity analysis using non-metric multidimensional scaling (NMDS) based on four dissimilarity metrics (Bray–Curtis, Jaccard, Kulczynski, and Euclidean distance after Hellinger transformation) revealed distinct patterns of bacterial community assembly across conditions (Figure 3). PERMANOVA confirmed statistically significant differences in community composition among all condition groups, with both flooding status and plant species identity contributing significantly to variation. Notably, the non-flooded T. chinensis group (NC) occupied the most distinct position in ordination space, exhibiting the greatest compositional divergence from all other conditions. This suggests that in the non-flooded habitat, T. chinensis recruits and maintains a highly specialised bacterial assemblage that differs substantially from communities associated with flooding stress and alternative plant hosts.

2.4. Taxonomic Composition and OTU Overlap Reveal Host- and Habitat-Associated Rhizosphere Bacterial Patterns

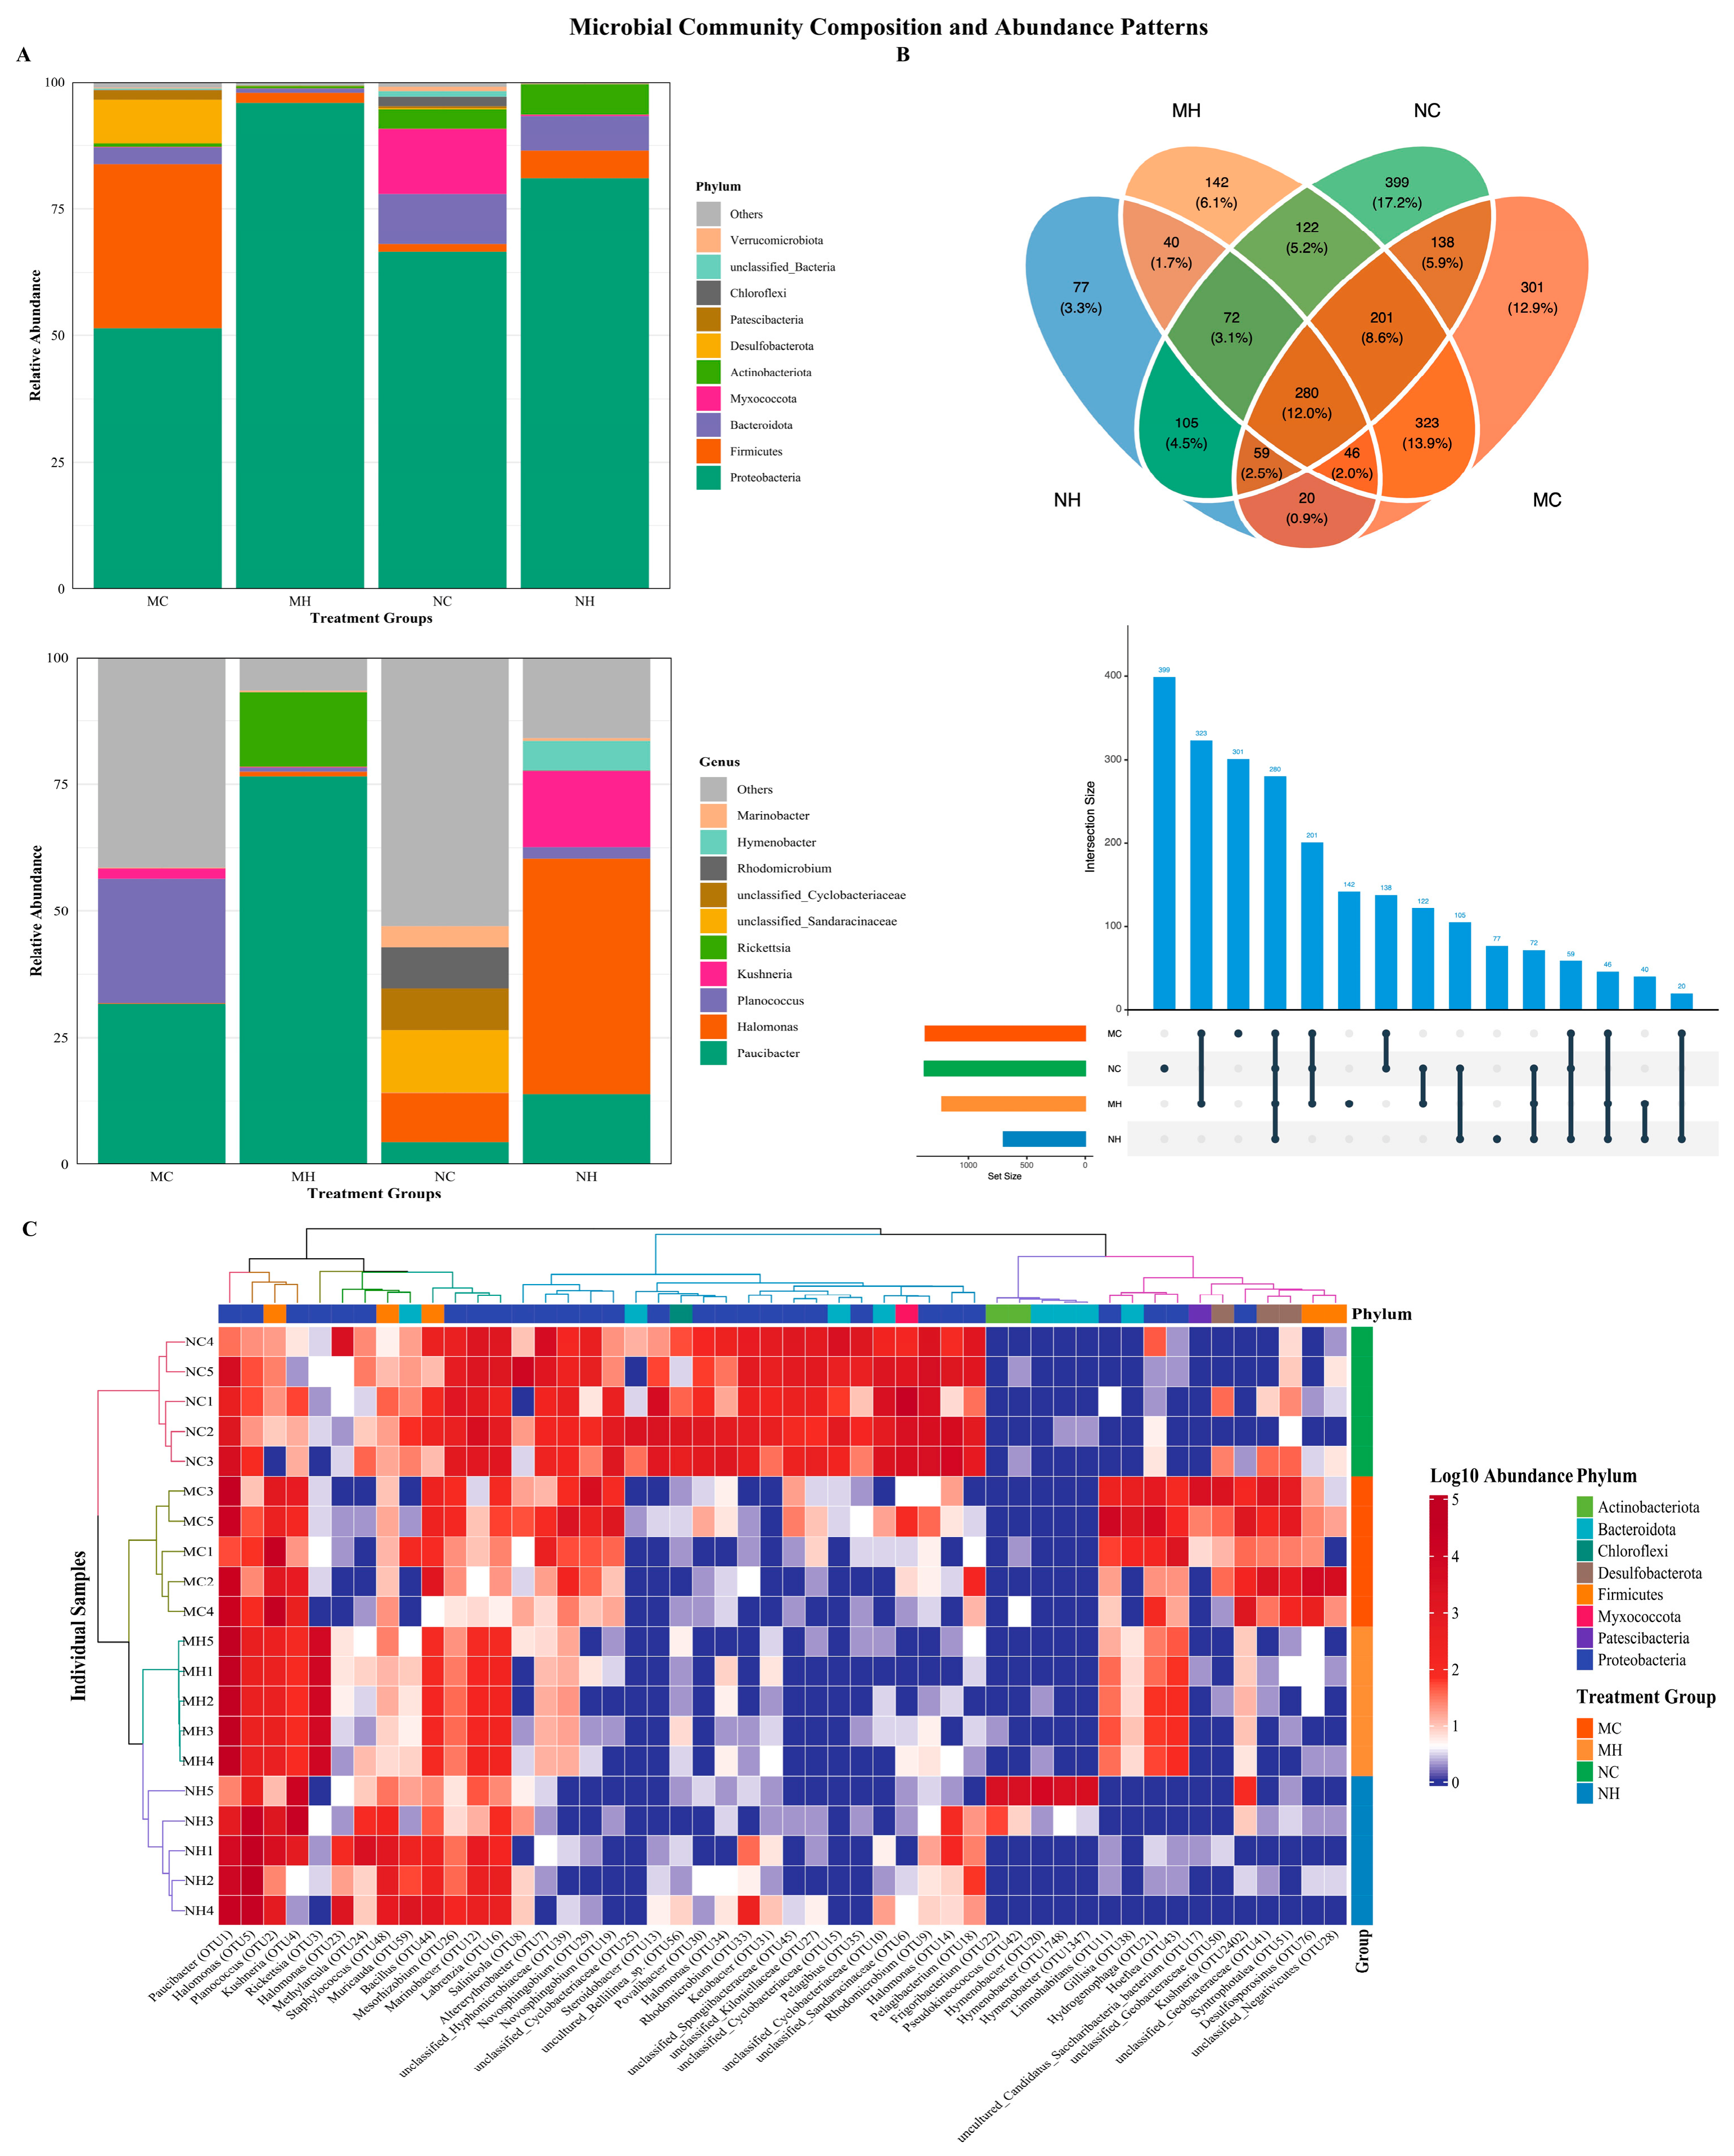
Taxonomic profiling showed clear host- and habitat-associated differences in rhizosphere bacterial community composition across the four plant–habitat groups (Figure 4A). Proteobacteria was the dominant phylum in all groups, with its relative abundance ranging from 51.38% to 95.50%. Under flooding, the S. glauca rhizosphere exhibited extreme Proteobacteria dominance (95.50%), which is a 14.43% increase compared to non-flooded conditions (81.07%). In contrast, T. chinensis showed a decrease in Proteobacteria from 66.49% (non-flooded) to 51.38% (flooded), highlighting species-specific responses to anaerobic stress.
Firmicutes displayed an inverse relationship with flooding across plant species. In T. chinensis, the relative abundance of Firmicutes was higher in the flooded group (32.44%) than in the non-flooded group (1.53%). In S. glauca, Firmicutes accounted for 5.41% and 1.94% of the bacterial communities in the non-flooded and flooded groups, respectively. Actinobacteriota and Bacteroidota accounted for 3.83–6.06% and 6.84–9.88%, respectively, in the non-flooded groups, whereas their relative abundances were lower in the flooded groups.
At the genus level, 187–326 genera were detected per group, and the relative-abundance profiles of dominant taxa differed descriptively among the four plant–habitat groups. S. glauca under flooding exhibited a simplified structure dominated by Paucibacter (76.51%) and Rickettsia (14.74%), together accounting for >90% of total abundance. This abundance pattern indicates that the flooded S. glauca group was dominated by a small number of genera. The flooded T. chinensis rhizosphere communities were more taxonomically diverse, harbouring 14 dominant genera, including Paucibacter (31.73%), Planococcus (24.45%), Desulfosporosinus (3.24%), and Limnohabitans (3.20%).
Under non-flooded conditions, both species supported more equitable genus distributions. S. glauca was dominated by halotolerant genera, including Halomonas (46.45%), Kushneria (14.90%), and Paucibacter (13.91%), reflecting adaptation to saline soils. T. chinensis displayed the highest taxonomic evenness, with 21 dominant genera such as Sandaracinaceae (12.31%), Halomonas (9.96%), Cyclobacteriaceae (8.24%), and Rhodomicrobium (8.13%). Comparative abundance analysis revealed that Paucibacter increased by 62.60 and 27.29 percentage points in the S. glauca and T. chinensis comparisons, respectively, suggesting key adaptive traits for oxygen-limited environments, whereas aerobic-associated taxa such as Halomonas decreased substantially (a decrease of 45.16 percentage points in S. glauca), reflecting sensitivity to redox changes.
Community-level diversity assessed through OTU analysis identified 2,325 OTUs across the dataset (Figure 4B). At the group level, more OTUs were detected in the T. chinensis groups than in the corresponding S. glauca groups under both flooded and non-flooded conditions; however, these cumulative group-level OTU counts should not be interpreted as sample-level richness. Set-overlap analysis showed that 12.0% of the prevalence-filtered OTUs were shared across all four conditions, indicating minimal core microbiome overlap and strong ecological filtering by plant–environment interactions.
Hierarchical clustering of the 50 most abundant genera revealed three distinct assemblages corresponding to plant species and flooding regime (Figure 4C). S. glauca samples clustered together regardless of flooding, indicating strong host-plant control over community assembly. Within-species clustering was further modulated by flooding, forming subclusters characterised by specific biomarker genera, including Marinobacter, Labrenzia, and Rickettsia in S. glauca and Altererythrobacter, Novosphingobium, and Hydrogenophaga in T. chinensis. These results demonstrate that both flooding and plant identity significantly shape rhizosphere bacterial community structure, with T. chinensis consistently supporting greater diversity and taxonomic richness than S. glauca across both environmental conditions.

2.5. Predicted Functional Profiles Differ Between Hydrological Habitats in S. glauca but Not Significantly in T. chinensis

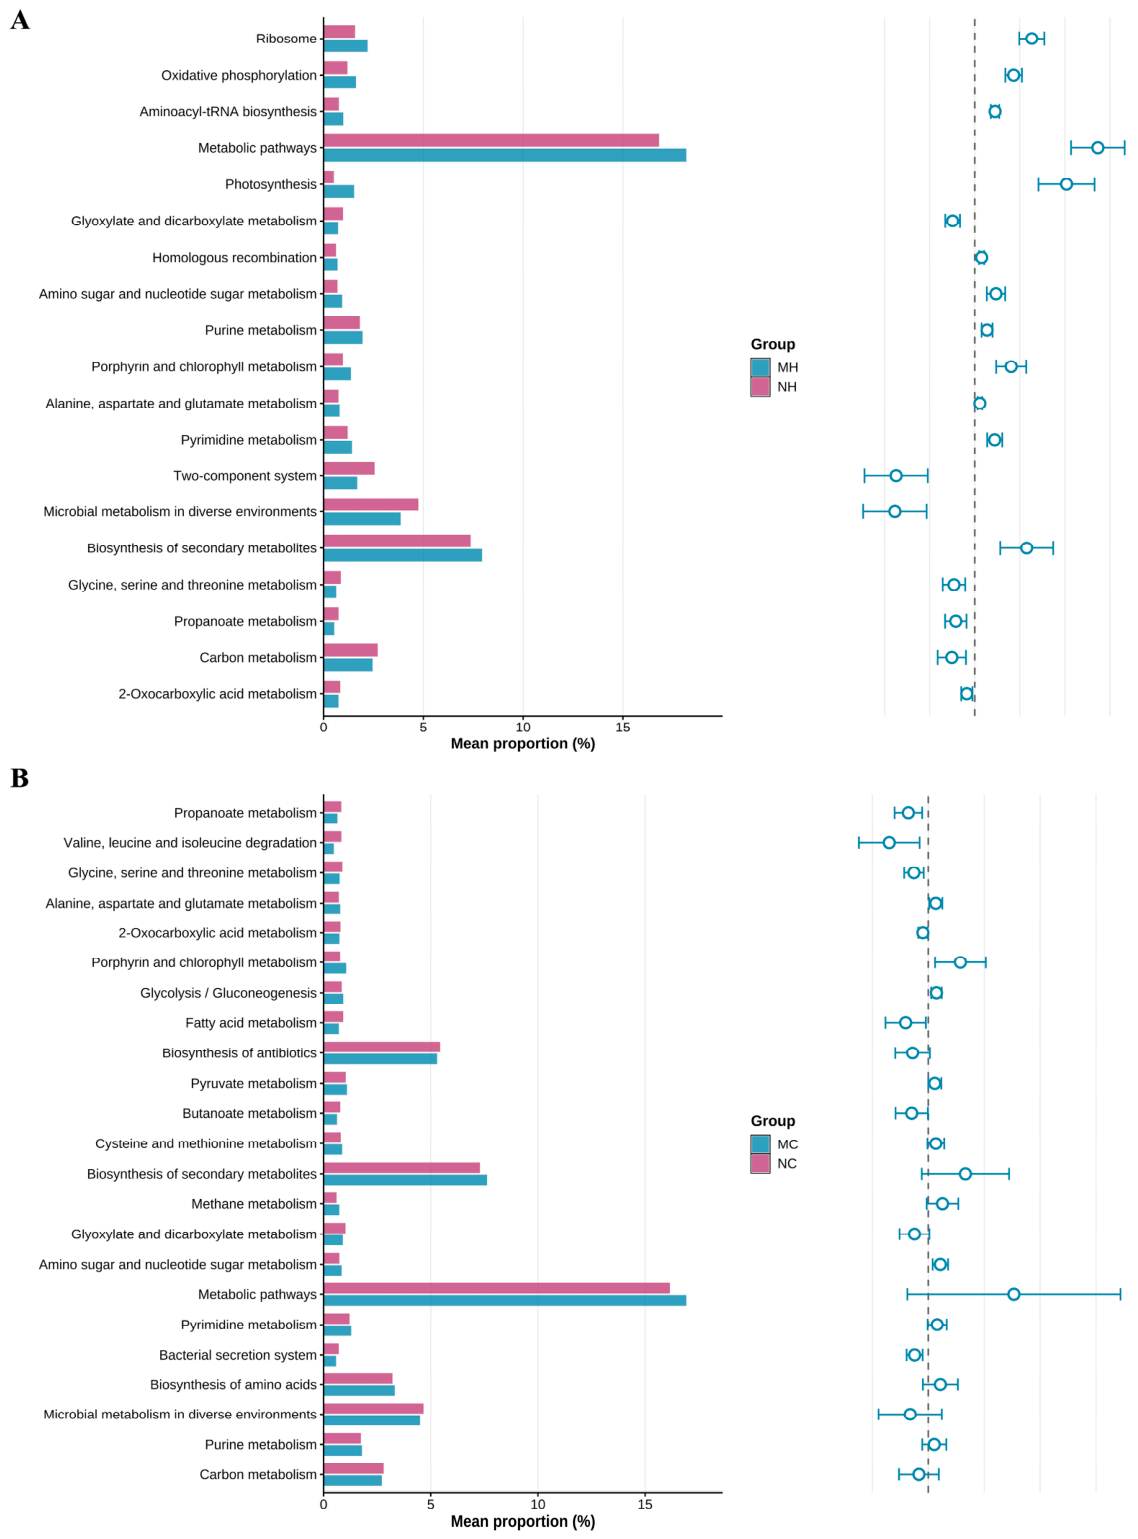
PICRUSt2-based analysis indicated contrasting patterns in predicted functional potential between hydrological habitats for the two halophytes; these predictions do not directly measure metabolic activity. The predicted functional profiles of the S. glauca rhizosphere differed between the non-flooded (NH) and flooded (MH) groups, with 19 predicted pathways showing significant differences in relative abundance after multiple-testing correction (Figure 5A). Several predicted pathways related to protein synthesis and energy metabolism had higher relative abundances in MH than in NH. For example, ribosome biogenesis, oxidative phosphorylation, and aminoacyl-tRNA biosynthesis all showed higher predicted relative abundance (p = 0.002). Additionally, predicted pathways related to secondary metabolite biosynthesis and photosynthesis showed higher relative abundances in MH than in NH (p = 0.005). Conversely, glyoxylate and dicarboxylate metabolism showed a lower predicted relative abundance in MH than in NH (p = 0.005).
In contrast, T. chinensis showed no statistically significant differences in the analysed predicted pathways between non-flooded (NC) and flooded (MC) conditions (Figure 5B). Among 23 analysed pathways, none reached statistical significance (all adjusted p ≥ 0.09). Pathways such as methane metabolism and secondary metabolite biosynthesis also remained non-significant (p = 0.14 each); thus, no pathway-level difference was detected in this comparison.
Taken together, the two host species showed contrasting habitat-associated patterns in predicted functional potential: 19 pathways differed between NH and MH for S. glauca, whereas no pathway reached significance after multiple-testing correction between NC and MC for T. chinensis.
These results support a difference in predicted functional response patterns between the two host-associated rhizosphere communities. Because PICRUSt2 infers functional potential from marker-gene data, the pathway differences should be interpreted as predictions and require validation with direct functional measurements.

2.6. Host- and Habitat-Associated Differences in Microbial Association Networks

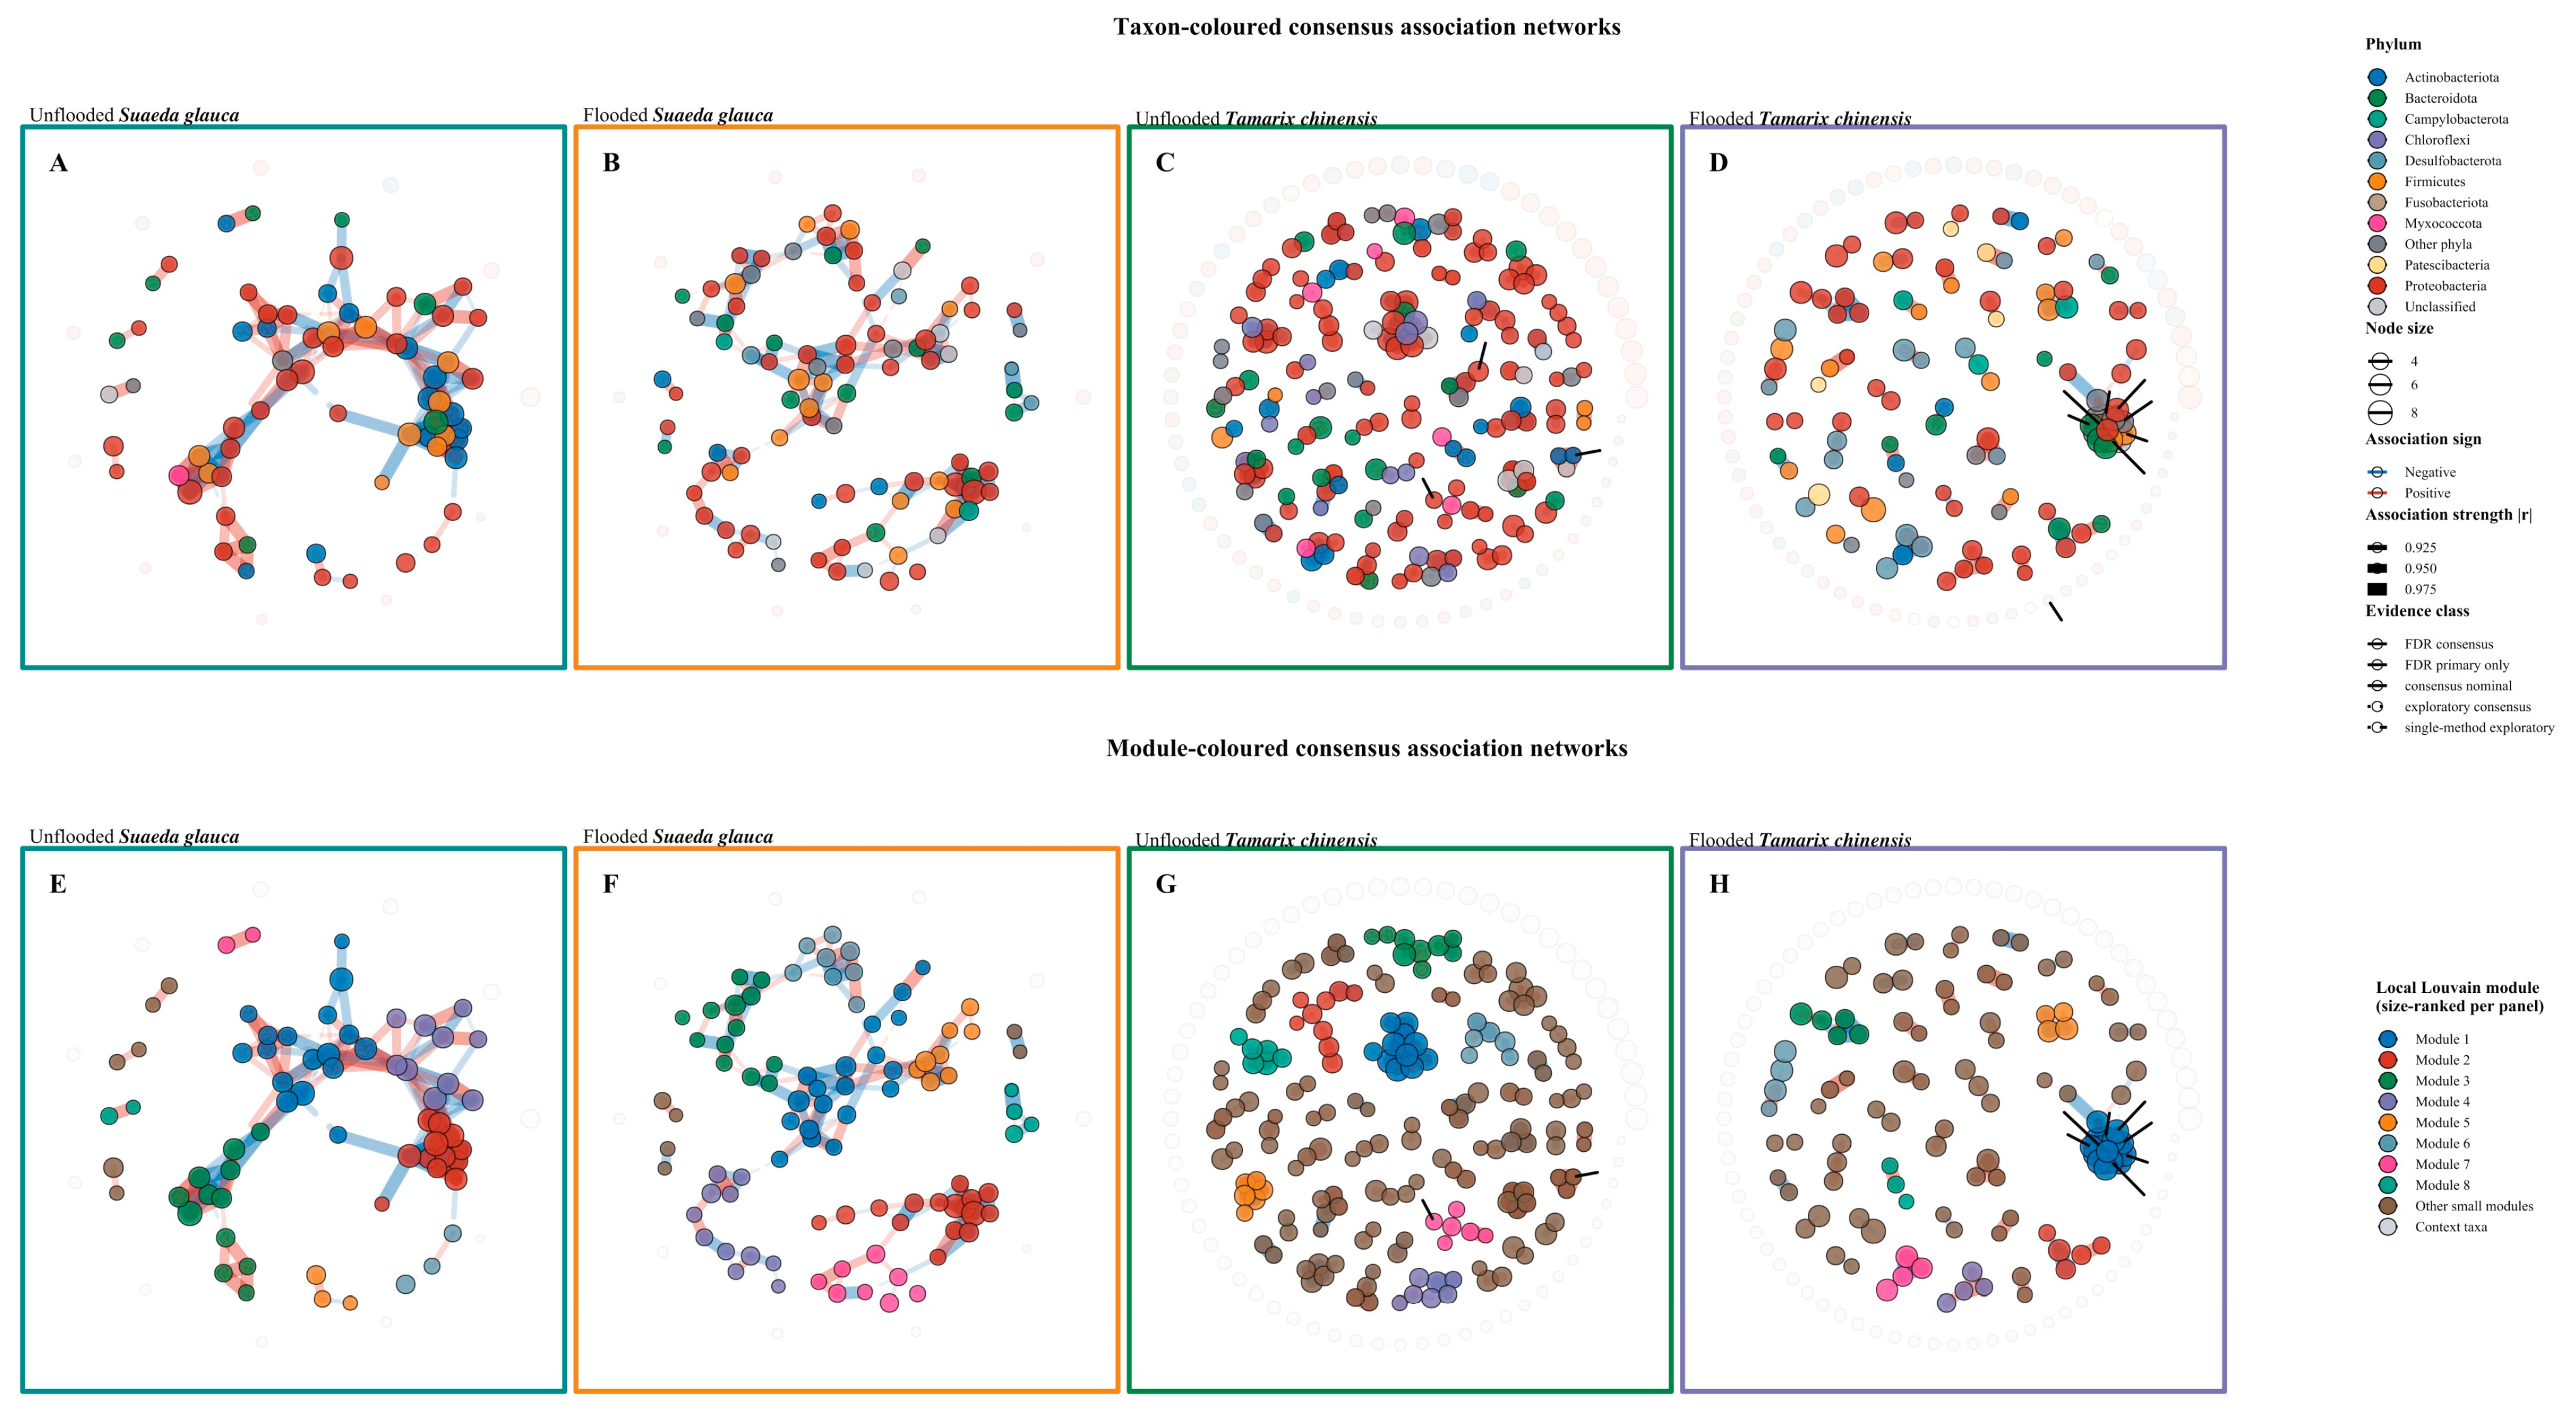
Genus-level consensus association network analysis showed host- and habitat-associated differences in exploratory rhizosphere bacterial association structures between S. glauca and T. chinensis (Figure 6). The networks were constructed from CLR-transformed genus-level abundance profiles using primary Pearson correlation, secondary Spearman sign screening, leave-one-out sign-consistency assessment and Benjamini–Hochberg FDR correction.
In the balanced consensus display layer, the non-flooded S. glauca network contained 78 displayed nodes and 180 displayed edges, including 18 FDR-supported edges, with a density of 0.060 and an average degree of 4.62. The flooded S. glauca network contained 103 displayed nodes and 180 displayed edges, including one FDR-supported edge, with a density of 0.034 and an average degree of 3.50. Thus, the flooded S. glauca habitat showed a larger displayed taxon set but lower density, lower average degree and fewer FDR-supported associations. The non-flooded T. chinensis network contained 237 displayed nodes and 180 displayed edges, including 10 FDR-supported edges, with a density of 0.006 and an average degree of 1.52. The flooded T. chinensis network contained 179 displayed nodes and 180 displayed edges, including 61 FDR-supported edges, with a density of 0.011 and an average degree of 2.01. Thus, the flooded T. chinensis habitat showed fewer displayed taxa but higher density, higher average degree and more FDR-supported associations.

2.7. Random Forest and LEfSe Identify Distinct Plant–Habitat-Associated Biomarker Signatures

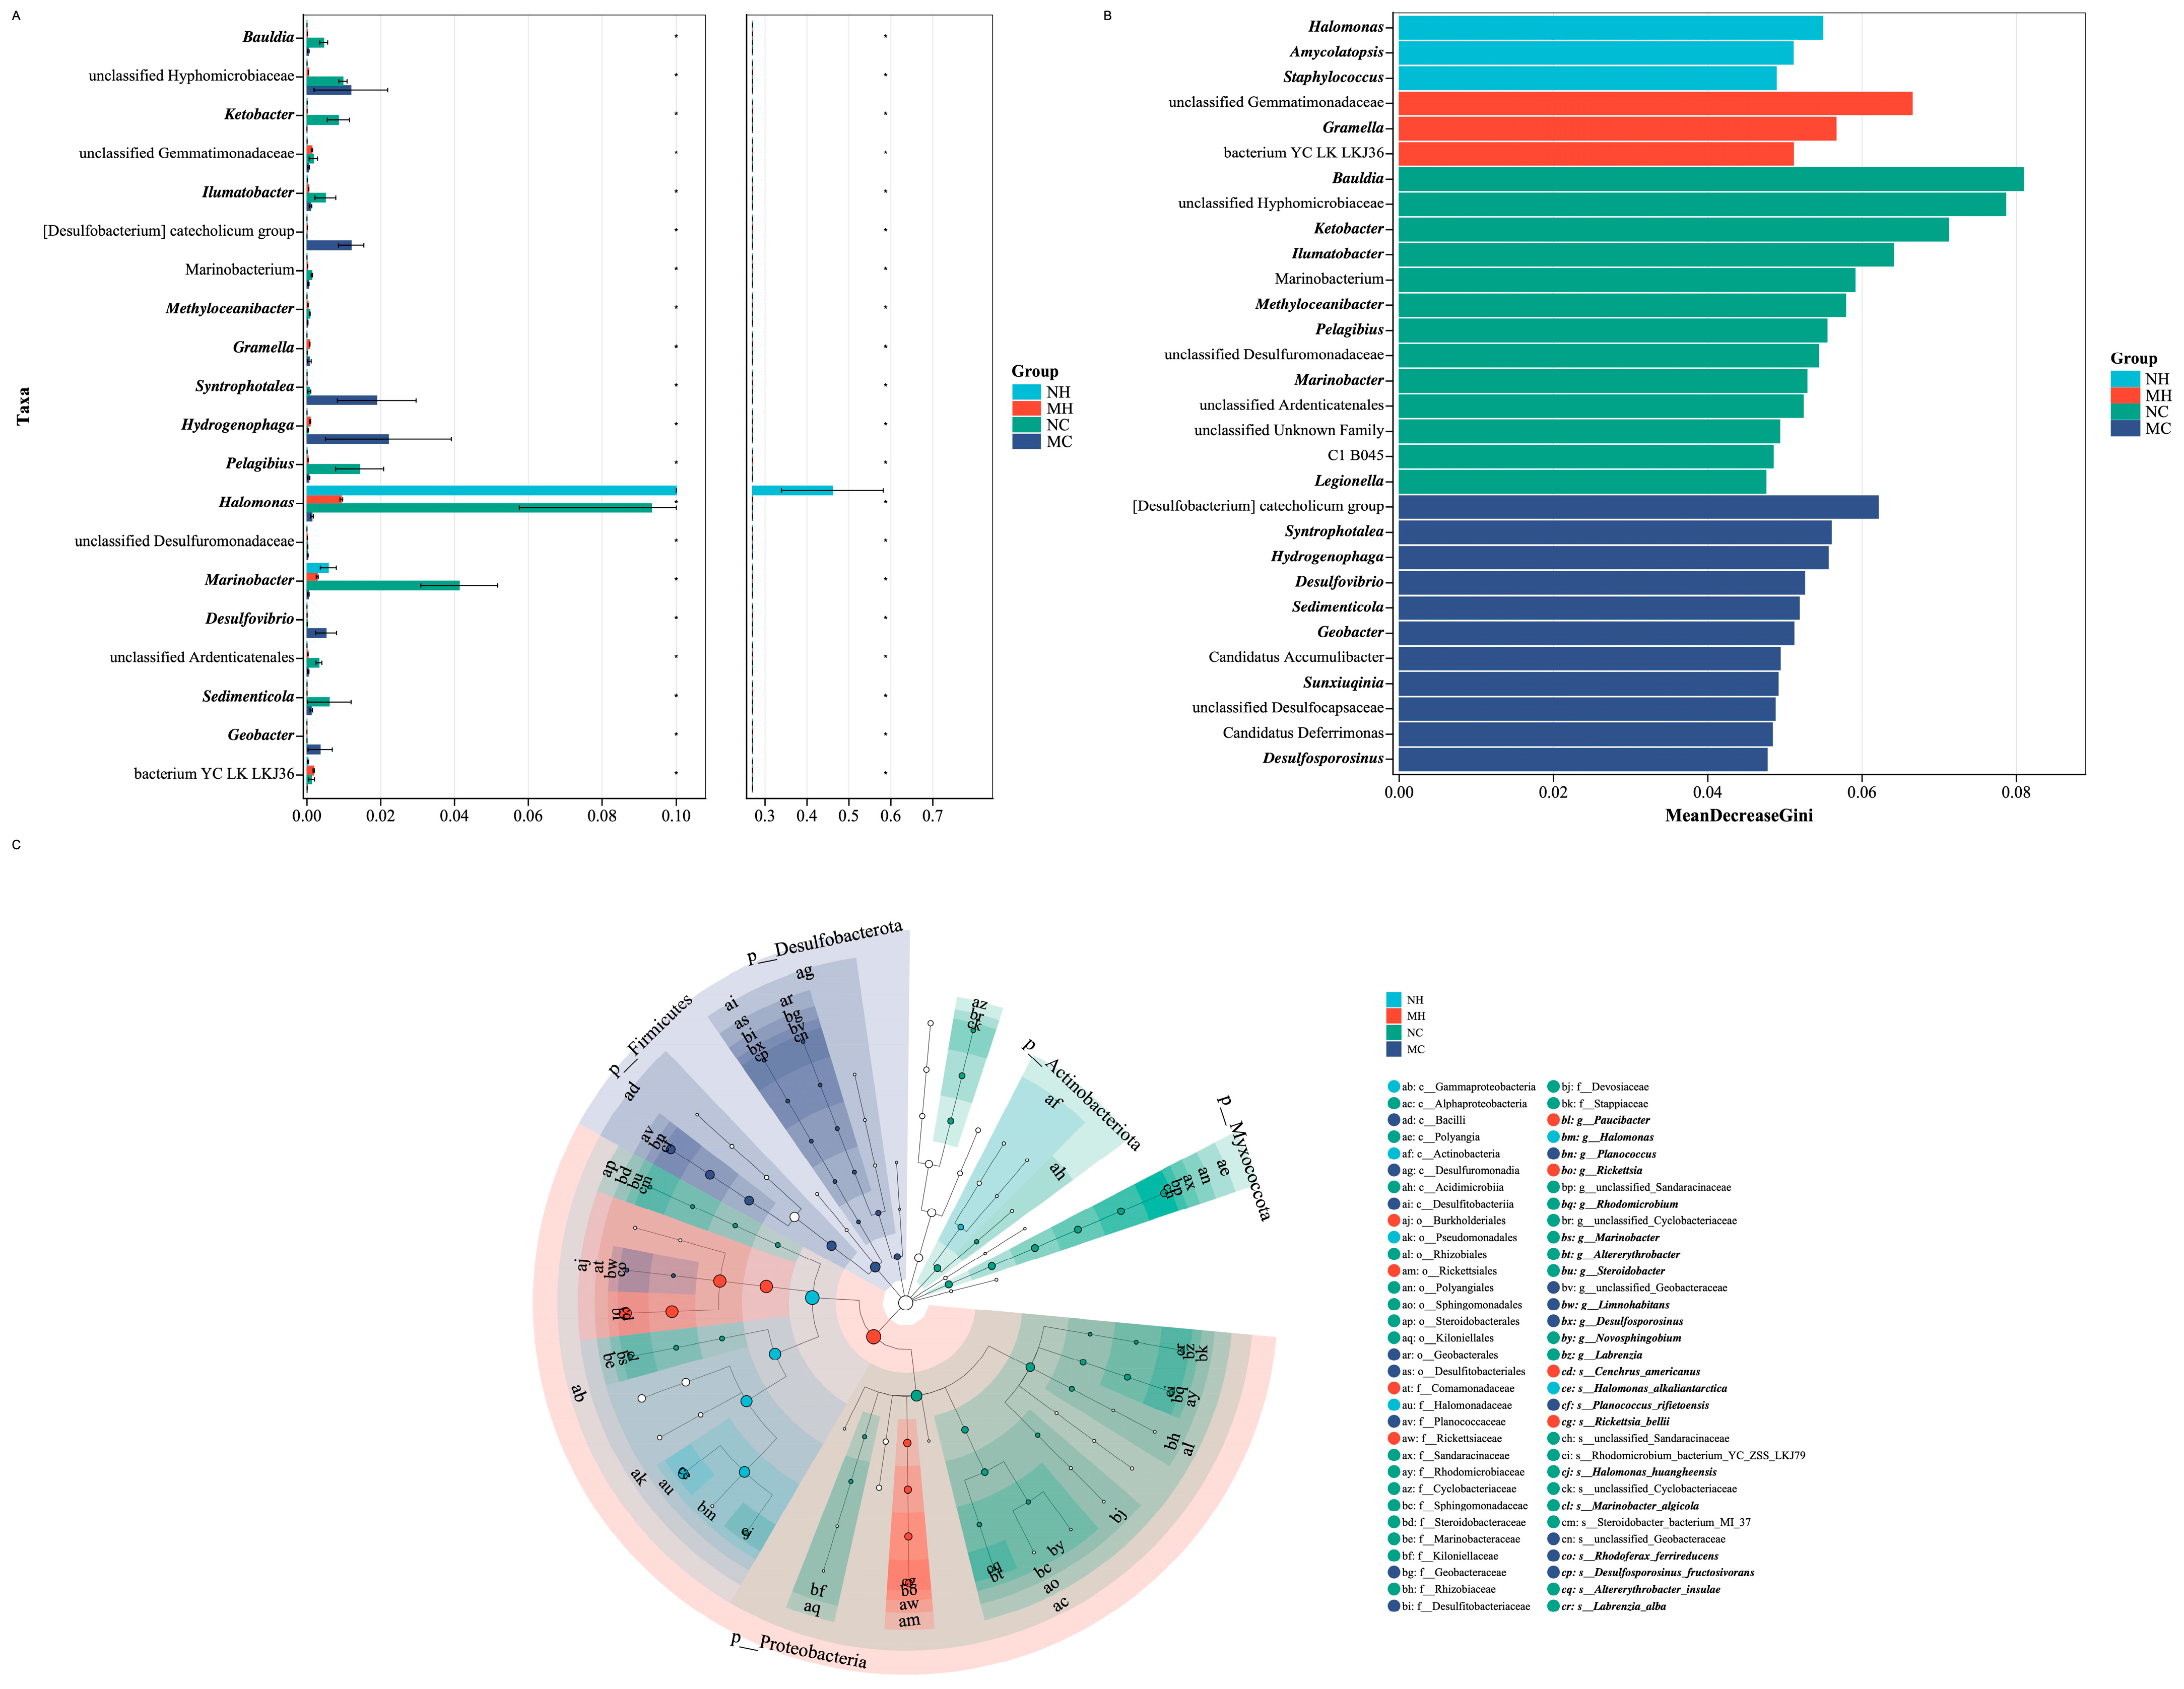
To identify genus-level taxa that best discriminated among the four plant–habitat groups, we applied a random forest (RF) workflow coupled with non-parametric significance testing. The top 30 discriminative taxa ranked by MeanDecreaseGini are shown in Figure 7B, and all 30 displayed taxa had Benjamini–Hochberg (BH)-adjusted p values < 0.05 in the corresponding differential-analysis results. The three highest-ranked features were Bauldia (NC; MeanDecreaseGini = 0.0809), unclassified Hyphomicrobiaceae (NC; 0.0786), and Ketobacter (NC; 0.0712), followed by unclassified Gemmatimonadaceae (MH; 0.0665) and Ilumatobacter (NC; 0.0641). Among the top 30 RF features, 13 were associated with NC, 11 with MC, and three each with NH and MH, indicating that most high-ranking discriminative genera were assigned to the two T. chinensis-associated groups. Figure 7A shows the group-associated relative-abundance patterns of the top 20 RF features. These included Halomonas in NH; unclassified Gemmatimonadaceae, Gramella, and bacterium YC LK LKJ36 in MH; Bauldia, unclassified Hyphomicrobiaceae, Ketobacter, Ilumatobacter, Marinobacterium, Methyloceanibacter, Pelagibius, unclassified Desulfuromonadaceae, Marinobacter, and unclassified Ardenticatenales in NC; and [Desulfobacterium] catecholicum group, Syntrophotalea, Hydrogenophaga, Desulfovibrio, Sedimenticola, and Geobacter in MC.
An independent all-rank LEfSe analysis provided a complementary taxonomic view of the condition-associated signatures (Figure 7C). After BH correction, 70 taxonomic features with LDA scores strictly greater than 4.0 were retained for the cladogram; these features were assigned to NC (37), MC (18), MH (9), and NH (6). The NH signature included Gammaproteobacteria, Pseudomonadales, Halomonadaceae, and Halomonas, whereas the MH signature included Proteobacteria, Burkholderiales, Comamonadaceae, and Paucibacter. The MC signature included Firmicutes, Bacilli, Planococcaceae/Planococcus, and Geobacter- and Desulfosporosinus-associated lineages. In contrast, NC contained a broad Alphaproteobacteria/Rhizobiales-associated signature together with lineages containing Marinobacter, Altererythrobacter, Steroidobacter, Rhodomicrobium, Novosphingobium, and Labrenzia. Because parent and child taxonomic ranks are represented simultaneously in the LEfSe cladogram, these feature counts describe nested taxonomic signatures rather than independent biological entities. Together, the genus-level RF results and the multi-rank LEfSe analysis consistently identified distinct taxonomic signatures associated with the four sampled plant–habitat groups.

2.8. Descriptive Phylogenetic Patterns in Bacterial Community Structure

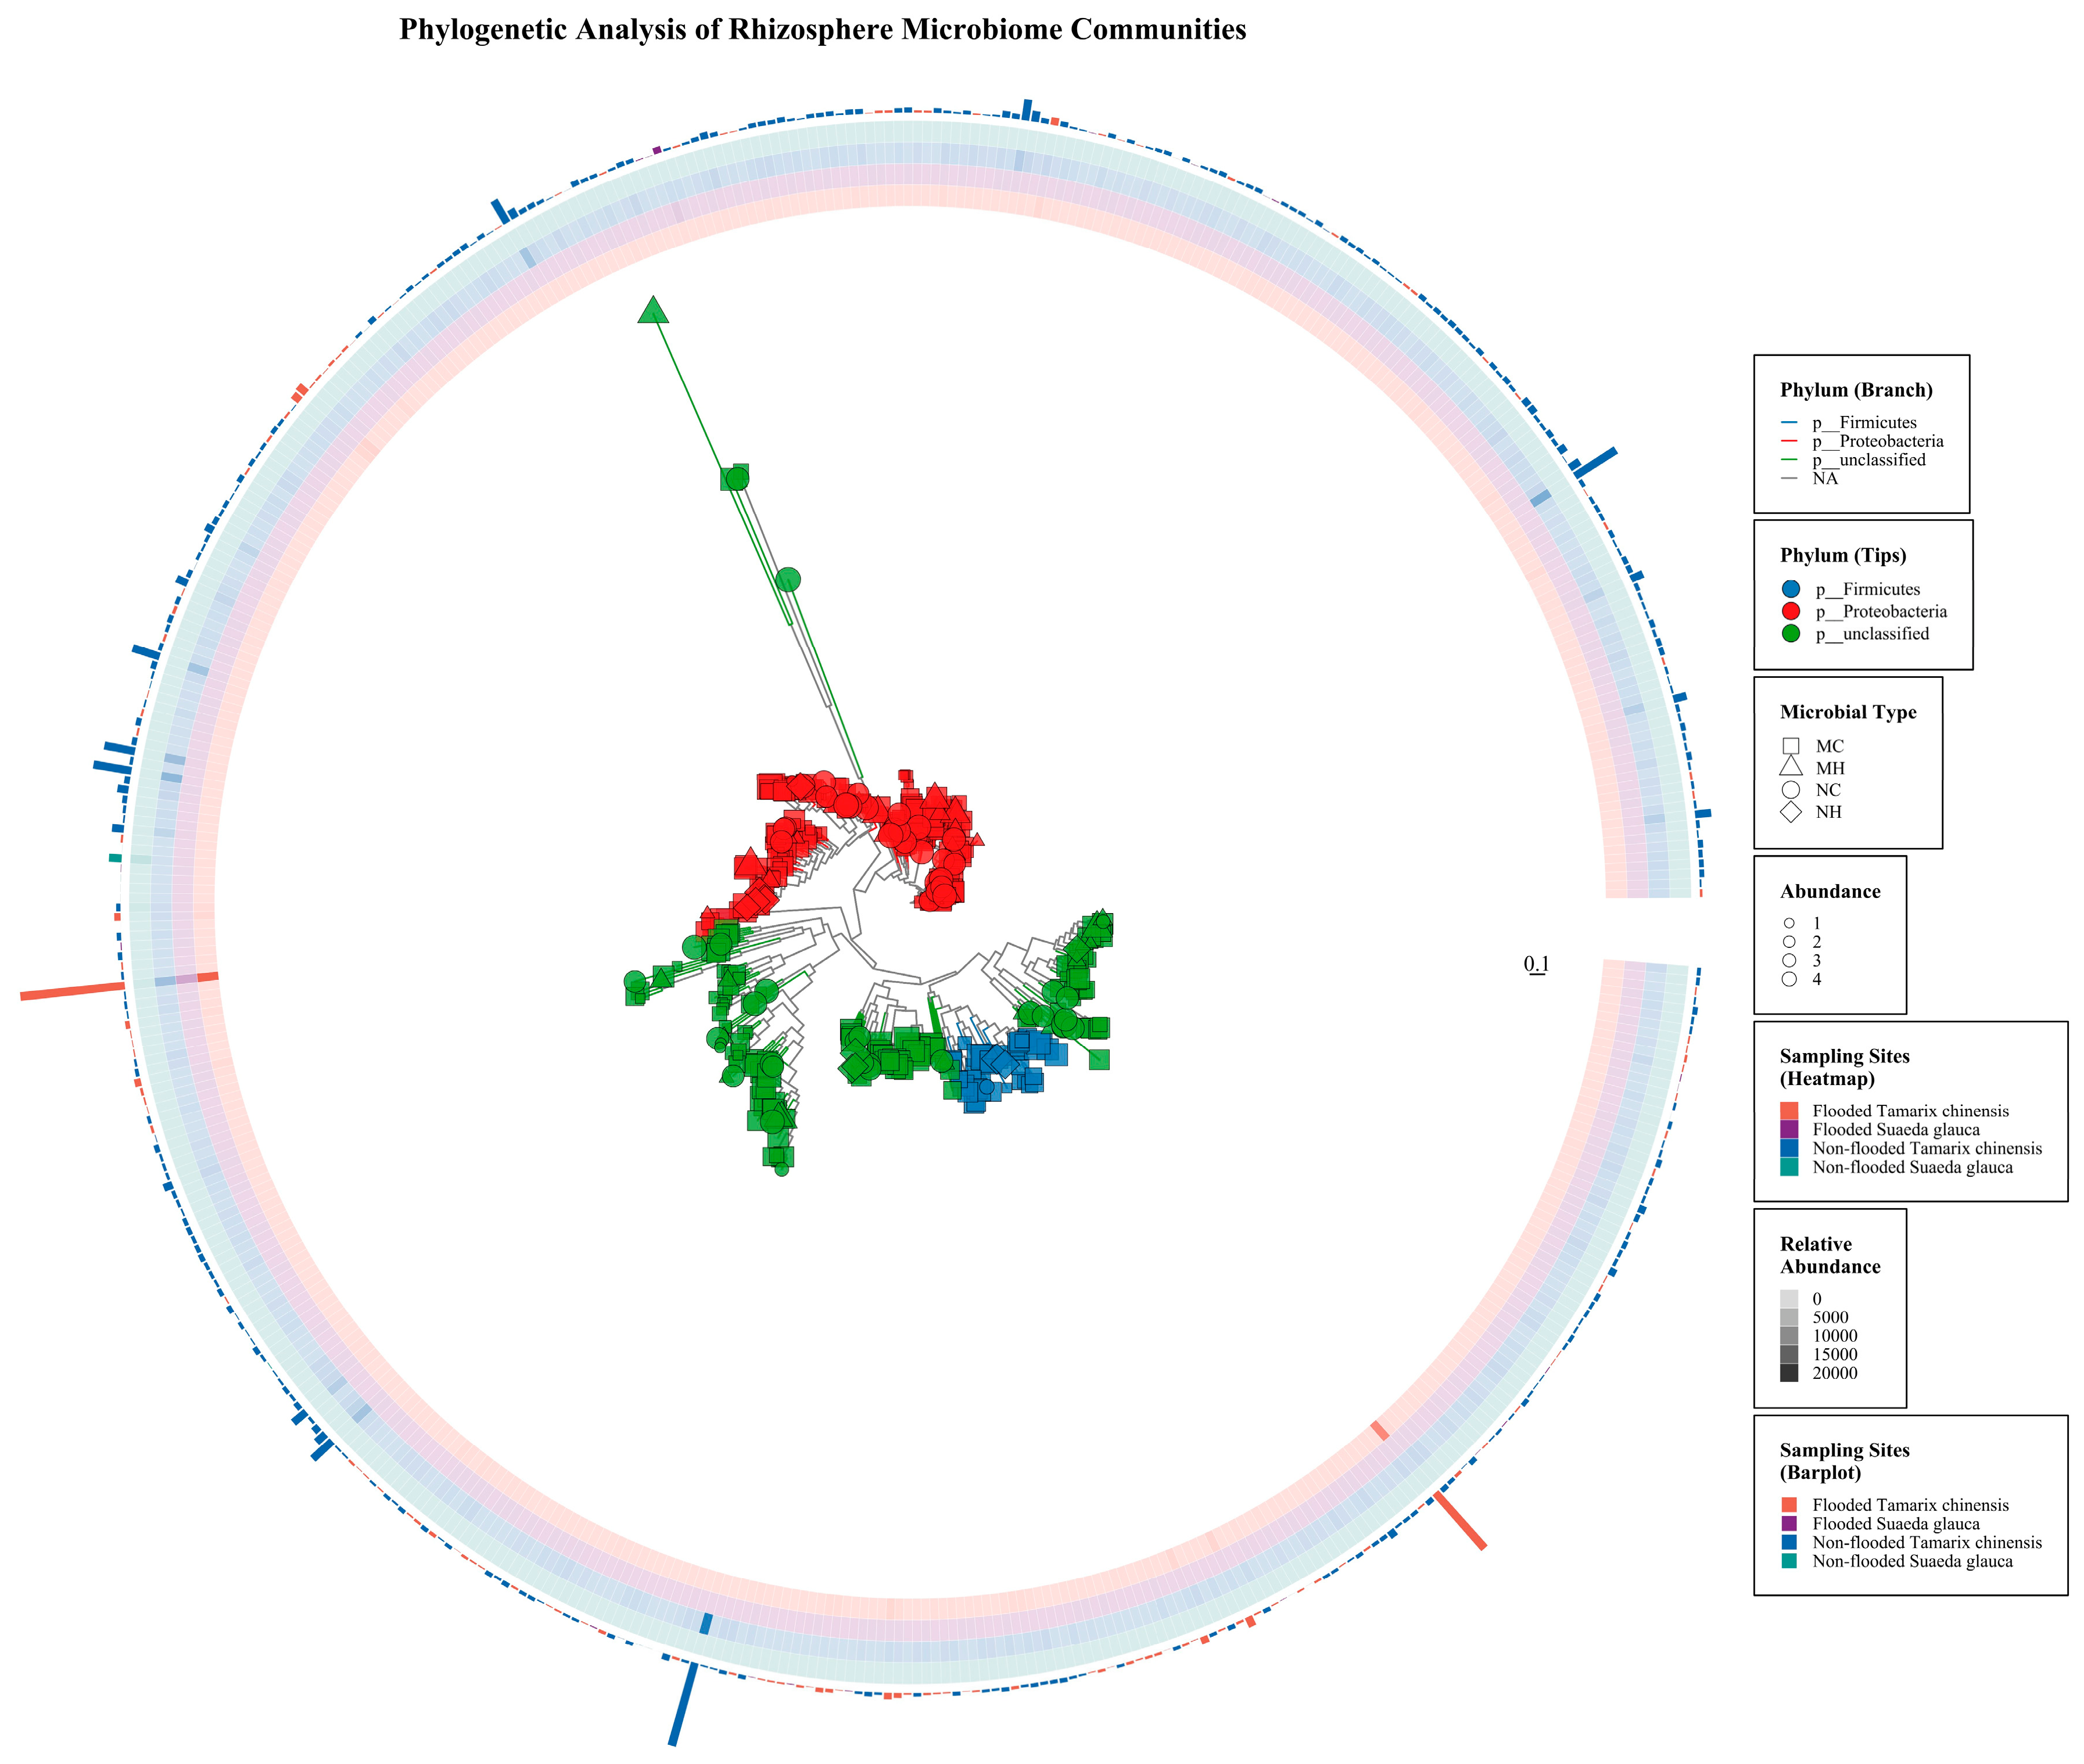
Phylogenetic analysis of the top 500 OTUs across all sampling sites revealed distinct evolutionary patterns and taxonomic clustering within the rhizosphere bacterial communities (Figure 8). The circular phylogenetic tree highlighted clear segregation of bacterial taxa into major lineages, with Proteobacteria dominating the tree, followed by Firmicutes and several unclassified groups.
The circular tree showed host- and habitat-associated distribution patterns among the 500 most abundant OTUs. Non-flooded T. chinensis samples (NC) were represented across multiple major clades, whereas MC-associated abundances were visually concentrated in a subset of lineages. The accompanying heatmap and outer bar plot displayed variation in taxon abundance across the four plant–habitat groups. Thus, Figure 8 provides a descriptive phylogenetic context for the taxonomic abundance patterns observed across the sampled plant–habitat groups.

3. Discussion

The present study showed that two coexisting halophytes in the Yellow River Delta were associated with distinct rhizosphere bacterial community patterns under saline–alkaline and hydrological habitat contrasts. Hydrological habitat conditions and plant identity together contributed to differences in rhizosphere microbial community composition. These findings represent field-based evidence for understanding plant–microbe associations in saline–alkaline wetland environments and may inform future studies on differential stress tolerance among coexisting halophytic species. Salinisation and flooding are important environmental factors affecting plant growth and development [51]. In saline–alkaline soils, excessive salt concentrations can induce osmotic dehydration in plant cells and lead to ion toxicity that disrupts normal physiological metabolism [52]. Under flooding conditions, root hypoxia can impair root function and create imbalances between photosynthesis and respiration that constrain plant growth [53]. To cope with these stresses, different plant species may be associated with distinct patterns of enrichment or depletion of rhizosphere microbial taxa, thereby shaping community structures that may contribute to stress resistance and plant growth. Our results showed differences in rhizosphere microbiome composition between the two dominant plant species in the Yellow River Delta saline–alkaline wetlands, namely S. glauca and T. chinensis, under flooded and non-flooded conditions. These results suggest that, within saline–alkali environments, flooded habitats are associated with divergent rhizosphere bacterial patterns in these plants; these patterns may reflect taxon-specific filtering and may contribute to niche-associated microbial assemblages under combined salinity–flooding conditions.
Flooding in coastal saline–alkaline habitats can influence microbial community structure by modifying physicochemical properties in rhizosphere soil, a process of ecological relevance under global environmental change [54]. Previous studies have shown that certain Limnohabitans strains are correlated with total phosphorus concentrations in aquatic systems, which provides relevant ecological context for our observations [55]. Additionally, this bacterial group has been reported to respond to dissolved organic matter (DOM) inputs and to possess organic matter metabolic capabilities, which may be related to the lower SOC observed in the sampled flooded habitat [56].
Furthermore, Kushneria, a typical halophilic genus, is adapted to high-salinity and oligotrophic environments. Some representative strains within this genus can solubilise organic phosphorus and insoluble inorganic phosphorus, converting them into bioavailable phosphorus [57,58]. Steroidobacter represents a group of organic matter-degrading bacteria distributed in soils and may play roles in carbon cycling, particularly in organically enriched habitats where its abundance can be associated with SOC and TN contents. Moreover, Marinobacter includes common aerobic heterotrophic bacteria in saline–alkaline soils and marine environments, and some members are classified as hydrocarbon-degrading bacteria [59]. These taxa may contribute to nutrient and elemental cycling through hydrocarbon degradation and related metabolic capabilities [60,61]. The reported functional characteristics of these microorganisms indicate their potential roles in nutrient cycling in coastal saline–alkali land, suggesting that saline–alkali flooding conditions may affect the predicted functional potential of rhizosphere microbial communities by altering soil physicochemical properties.
Under environmental selection pressure, halophytic species may be associated with different rhizosphere microbial assembly patterns that contribute to their adaptation to saline and flooded environments [62]. Our analysis of multiple alpha-diversity indices suggested that plant species identity and flooding conditions were associated with rhizosphere microbial alpha diversity, which is consistent with frameworks emphasising host-associated filtering in microbiome assembly [63,64]. Shannon and Gini–Simpson diversity were lower in the flooded habitat for both hosts, whereas richness responses differed between S. glauca and T. chinensis, which may reflect the effects of hypoxia, pH fluctuations and nutrient availability on microbial community viability and competitive dynamics [65]. However, the responses of T. chinensis and S. glauca to environmental variation suggested different rhizosphere microbial response patterns that may reflect distinct life-history traits and adaptive strategies [66]. These results point to different habitat-associated response patterns between the two hosts. T. chinensis retained higher Shannon and Gini–Simpson diversity than S. glauca in the flooded habitat, whereas S. glauca showed larger changes in several predicted functional pathways between its two sampled habitats.
To further analyse habitat-associated differences in bacterial community structure, we ordinated all samples using NMDS based on Bray–Curtis dissimilarity. The results showed separation between the bacterial communities of S. glauca and T. chinensis under both flooded and non-flooded conditions. These findings are consistent with the interpretation that flooding is an important environmental factor associated with changes in bacterial community structure [67,68,69]. Moreover, plant species and flooding conditions can be associated with differences in bacterial community composition [70]. At the phylum level, Proteobacteria and Firmicutes were dominant bacterial groups in coastal saline–alkaline ecosystems, consistent with previous studies [71,72]. At the genus level, Paucibacter was a common dominant genus in both flooded and non-flooded soils, but its relative abundance varied across groups. Under flooded conditions, the abundance of Paucibacter in the rhizosphere soils of T. chinensis and S. glauca increased, possibly reflecting tolerance to oxygen-limited conditions or compatibility with flooded rhizosphere environments [73]. Halomonas, a typical halophilic genus, showed higher relative abundance mainly in non-flooded environments in this study, contrasting with previous findings that reported its enrichment in saline environments [74]. Overall, Shannon and Gini–Simpson diversity associated with T. chinensis was higher than that associated with S. glauca, whereas richness differences depended on the hydrological habitat and the metric examined, indicating differences in rhizosphere microbial assembly between these plant species [75]. Furthermore, part of the rhizosphere microbial community could not be accurately classified at known phylum or genus levels, reflecting the limitations of current microbial databases and leaving some taxa unresolved in saline–alkaline ecosystems [76,77]. The ecological roles of these unclassified sequences remain uncertain in coastal saline–alkaline ecosystems [78].
Comparative analyses using cluster heatmaps and LEfSe revealed differences in the rhizosphere bacterial taxa associated with T. chinensis and S. glauca under flooded habitats [79]. The rhizosphere microbial community of S. glauca showed closer clustering between flooded and non-flooded habitats, whereas that of T. chinensis exhibited greater divergence, indicating stronger habitat-associated differentiation in the bacterial community of T. chinensis. Altererythrobacter and Novosphingobium, both within the Sphingomonadaceae family, were widely distributed in T. chinensis rhizospheres but nearly absent in S. glauca. Altererythrobacter is typically associated with oligotrophic environments, and some members can degrade polycyclic aromatic hydrocarbons and lignin-derived compounds, potentially contributing to carbon turnover in the rhizosphere [80,81,82,83]. Novosphingobium exhibits metabolic versatility and potential in pollution remediation, with some members reported to participate in nitrogen fixation or aromatic-pollutant degradation [10,71,84,85,86,87].
Under flooded conditions, S. glauca was associated with enrichment of Salinimicrobium, Sinomicrobium, and Pelagibius, which have previously been reported in marine environments, although their functional roles in this system remain unclear [88,89,90]. In contrast, T. chinensis rhizospheres included genera containing potential pathogens (Coxiella, Malaciobacter) and autotrophic sulfur bacteria (Desulfurivibrio, Sulfurivermis) [91,92,93,94]. Non-flooded T. chinensis rhizospheres also contained Desulfuromonas, members of which can perform dissimilatory sulfur reduction, and Legionella, a genus containing potential pathogens [95]. These results suggest that host-associated filtering may contribute to differences in specific microbial taxa and community function under environmental stress through niche differentiation [96]. Phylogenetic analysis suggested that microbial communities associated with T. chinensis occupied distinct habitat-related niches under both flooded and non-flooded conditions, highlighting environmental differentiation and possible host-associated microbial filtering.
The network analysis provided additional exploratory evidence that the two host species were associated with different rhizosphere bacterial association structures. In the balanced display layer, T. chinensis showed more displayed nodes under non-flooded conditions, whereas the flooded T. chinensis network had the largest number of FDR-supported associations in the strict layer [97,98,99,100,101,102]. By contrast, S. glauca showed an increase in displayed node number under flooding but a decrease in density, average degree and FDR-supported associations. These patterns suggest differences in statistical association structure among plant–habitat groups [103,104,105,106,107]. The observed topological differences between host species and habitats are hypothesis-generating and require validation through expanded sampling, independent datasets or experimental manipulation.
Functional prediction using PICRUSt2 suggested species-specific differences in predicted functional potential [108]. In S. glauca, flooded and non-flooded habitats differed in the predicted abundance of carbon metabolism, ribosome-related and secondary-metabolite pathways, suggesting stress-associated shifts in predicted functional profiles that may be linked to nutrient mobilisation and protective metabolite production [30,109,110,111,112,113,114]. In contrast, T. chinensis showed relatively stable predicted functional profiles between hydrological habitats, suggesting a stability-oriented rhizosphere functional pattern.
These results indicate habitat-associated microbiome patterns that may contribute to halophyte adaptation to saline–alkaline environments and may inform future saline–alkali land restoration through microbial inoculation or plant–microbe synergy. This work provides an integrated analysis of rhizosphere bacterial community patterns under combined salinity–flooding conditions, offering insights relevant to coastal wetland management, ecological restoration and sustainable land-use strategies [115,116]. However, as functional predictions using PICRUSt2 are inferred from marker-gene data and reference genomes, they require experimental validation through metatranscriptomics or metabolomics. In addition, the present study was limited to two halophytes in a single tidal flat region. Future work should therefore expand to multi-species, multi-site, and temporal studies to further explore rhizosphere microbial adaptive strategies under saline–alkaline and flooded conditions.

4. Materials and Methods

4.1. Field Sampling and Site Characterisation

Two contrasting saline–alkaline field habitats were sampled: (1) a tidal-flat habitat subject to periodic flooding (37°43′54″ N, 118°58′3″ E; elevation: 2.48 m below sea level) and (2) a non-flooded saline–alkaline area (37°23′28″ N, 118°55′10″ E; elevation: 0.8 m above sea level), both described as sandy loam coastal tidal-flat soils [117]. The region has a warm temperate continental monsoon climate, with annual precipitation of 530–630 mm and a mean annual temperature of 11.5–12.4 °C [118]. Soil salinity in the Yellow River Delta coastal zone generally decreases with increasing distance from the sea [119].
Two dominant halophytes, S. glauca and T. chinensis, were selected as target species [120]. Four plant–habitat groups were defined: MC, T. chinensis in the flooded habitat; MH, S. glauca in the flooded habitat; NC, T. chinensis in the non-flooded habitat; and NH, S. glauca in the non-flooded habitat. For each plant–habitat group, five 1 m × 1 m quadrats were established, giving a total of 20 quadrats across the four plant–habitat groups.
Rhizosphere soil was collected following standardised procedures. Within a 10 cm radius around the base of each target plant, root–soil mixtures were collected to a depth of approximately 20 cm using a sterile shovel. After removal of large stones and plant debris, the root-associated soil was transferred into labelled sterile bags. Plant roots were gently separated, loosely attached soil was shaken off, and the tightly adhered rhizosphere soil layer, approximately 1 mm thick, was carefully collected using sterile instruments and transferred into labelled 1.5 mL sterile centrifuge tubes. All samples were transported to the laboratory on dry ice and stored at −80 °C until DNA extraction.

4.2. Soil Physicochemical Property Analysis

Soil physicochemical properties were determined using standardised soil analytical procedures. Soil organic carbon (SOC), total nitrogen (TN), electrical conductivity (EC), and pH were measured following the procedures described in Soil Agricultural Chemical Analysis. Total phosphorus (TP) was quantified according to the standard method LY/T 1232–2015. Stoichiometric ratios, including C:N, C:P, and N:P, were calculated from measured SOC, TN, and TP values.

4.3. Soil Microbial Genomic DNA Extraction

Genomic DNA was extracted from rhizosphere soil samples using the TGuide S96 Magnetic Bead Soil/Fecal Genomic DNA Extraction Kit (DP812; Tiangen Biotech, Beijing, China), following the manufacturer’s protocol. Briefly, approximately 0.25–0.50 g of rhizosphere soil was transferred into a 2 mL centrifuge tube, followed by the addition of 500 µL Buffer SA, 100 µL Buffer SC and 0.25 g grinding beads. Samples were homogenised by vortexing for 15 min or using a tissue-grinding homogeniser. After centrifugation at 12,000 rpm (approximately 13,400× g) for 1 min, the supernatant was transferred to a new 2 mL centrifuge tube for subsequent purification. To remove impurities and improve DNA purity, 200 µL Buffer SH was added to the supernatant, mixed thoroughly and incubated at 4 °C for 10 min. After centrifugation at 12,000 rpm for 3 min, the clarified supernatant was transferred to a new tube and mixed with 500 µL Buffer GFA. Magnetic bead suspension G was then added, and DNA was captured on magnetic beads. The beads were washed sequentially with protein-removal solution RD and wash buffer PWD. After air-drying at room temperature for 5–10 min to remove residual ethanol, DNA was eluted with 50–100 µL elution buffer TB at 56 °C for 5 min.
DNA concentration was measured using a dsDNA high-sensitivity fluorescence assay. DNA integrity and amplicon quality were evaluated by 1.8% agarose gel electrophoresis or LabChip GX Touch fragment analysis. Samples with correctly sized target bands and sufficient DNA quantity were retained for downstream PCR amplification and library construction.

4.4. DNA Amplification and High-Throughput Sequencing

The near full-length bacterial 16S rRNA gene was amplified using the primer pair 27F (5′-AGRGT TTGAT YNTGG CTCAG-3′) and 1492R (5′-TASGG HTACC TTGTT ASGAC TT-3′). PCR amplification was performed in a 20 µL reaction containing 2 µL genomic DNA, 6.5 µL nuclease-free water, 10 µL KOD ONE PCR Master Mix and 1.5 µL barcoded primer pair. The amplification program was as follows: initial denaturation at 95 °C for 2 min; 22 cycles of denaturation at 98 °C for 10 s, annealing at 55 °C for 30 s and extension at 72 °C for 1 min 30 s; and final extension at 72 °C for 2 min [121].
PCR products were checked using agarose gel electrophoresis or LabChip GX Touch fragment analysis. Qualified amplicons with the expected fragment size were purified and pooled according to product concentration and band quality. The pooled library was purified using magnetic beads, and sequencing libraries were prepared using the SMRTbell Prep Kit 3.0. Libraries were subjected to damage repair, end repair, adapter ligation, and AMPure PB bead purification. The final library was quantified using Qubit. Before sequencing, the library was bound with primer and polymerase using the Revio Polymerase Kit and loaded onto the PacBio sequencing system for single-molecule real-time sequencing.

4.5. Taxonomic Assignment and Diversity Analysis

Raw PacBio reads were processed to generate high-quality circular consensus sequences (CCS) [122]. Barcode demultiplexing was performed according to sample-specific barcodes, and primer sequences were removed before downstream analysis. Cutadapt was used for primer trimming and quality filtering [123]. Chimeric sequences were identified and removed using UCHIME [124]. High-quality non-chimeric sequences were clustered into operational taxonomic units (OTUs) at 97% sequence similarity using USEARCH, and low-abundance OTUs were removed before downstream analyses [125,126]. Representative OTU sequences were taxonomically assigned against the SILVA database using a naïve Bayes classifier implemented in QIIME 2, with a confidence threshold of 0.70 [127].
Alpha-diversity metrics were calculated from the OTU abundance table, including observed species richness, ACE, Chao1, Shannon diversity, Gini–Simpson diversity and Good’s coverage [128]. Four plant–habitat groups were defined as follows: NH, non-flooded S. glauca; MH, flooded S. glauca; NC, non-flooded T. chinensis; and MC, flooded T. chinensis. For each alpha-diversity metric, a two-factor sample-level model was fitted with plant species, hydrological habitat and their interaction as fixed factors. Beta diversity was evaluated using Bray–Curtis dissimilarity, binary Jaccard distance, Kulczynski distance, and Euclidean distance after Hellinger transformation to assess microbial community dissimilarity among samples [128]. Taxonomic differences between groups were identified with linear discriminant analysis effect size (LEfSe), applying an LDA score threshold of 4.0. PERMANOVA was used to evaluate the contributions of plant species and hydrological habitat to differences in community composition. Candidate biomarker taxa were additionally ranked using random forest feature importance.

4.6. Predicted Functional Profiling

Predicted bacterial functional profiles were inferred from the 16S rRNA gene OTU table using PICRUSt2 [108]. Predicted KEGG pathway profiles were compared between flooded and non-flooded habitats separately for S. glauca and T. chinensis.

4.7. Microbial Association Network Construction

Treatment-specific microbial consensus association networks were constructed from the 16S rRNA gene abundance table after matching sample identifiers with the sample metadata. The analysis was performed at the genus level. For each treatment group (NH, MH, NC and MC), taxa were filtered according to group-wise total abundance ≥ 40 and prevalence ≥ 20% across the five biological replicates, and the top 240 genera by total abundance were retained for network inference. To reduce compositional scaling effects, genus-level count profiles were transformed using a centred log-ratio (CLR) transformation with a pseudocount of 0.5. Pairwise associations among retained taxa were first estimated using Pearson correlation coefficients calculated from CLR-transformed abundance profiles. A secondary Spearman rank correlation analysis on the CLR-transformed data was used as a sign-consistency screen. Only taxon pairs with consistent association signs between the primary and secondary analyses were retained for the consensus workflow. Leave-one-out sign consistency was calculated as a stability diagnostic, and only edges with sign consistency ≥ 0.60 were retained. Multiple-testing correction was performed using the Benjamini–Hochberg false discovery rate (FDR) procedure, with FDR < 0.05 defining the strict statistical layer. The balanced consensus display layer retained edges with |r| ≥ 0.65 (Pearson) and concordant Spearman sign, irrespective of FDR status, to ensure visual completeness.
Undirected weighted networks were generated after removing self-loops. Nodes represented retained genera; unclassified taxa were preserved as genus-level identifiers when family-level assignment was unavailable. Edges represented statistical associations inferred from the consensus workflow and were drawn with three evidence classes: solid lines for FDR-supported and consistency-filtered edges, dashed lines for consistency-supported but non-FDR edges, and dotted lines for context-only taxon pairs below the display threshold. Node attributes included phylum-level taxonomy, treatment-specific abundance, degree and module membership. Context-only taxa with degree zero were retained as faint halo nodes in the display figures to provide community background, but these nodes were not interpreted as having inferred associations. Network modules were identified using weighted Louvain community optimisation. Network layouts were generated using the Fruchterman–Reingold algorithm with context halo rendering. Network visualisation and summary statistics were performed in R (v4.3+) using igraph, tidygraph, ggraph, ggplot2, cowplot, patchwork, showtext and related dependencies. Sensitivity-ready inputs for SPIEC-EASI, SparCC and NetCoMi were exported but not formally fitted within this study.

4.8. Phylogenetic Analysis

Phylogenetic analysis was performed to describe evolutionary relationships and community structure patterns among rhizosphere bacterial communities. The 500 most abundant OTUs were aligned with MAFFT v7.490 using default parameters. An approximately maximum-likelihood phylogenetic tree was generated using FastTree v2.1.11. Phylogenetic trees were visualised in R v4.2.3 using the ggtree v3.15.0, employing circular, rectangular, and semicircular layouts to optimise data presentation [129]. Multiple data layers, including taxonomic classifications, abundance matrices, and environmental metadata were integrated to enhance interpretation. Major bacterial phyla were colour-coded on branches, while tip points were distinguished by sampling site with distinct shapes, and sizes proportional to relative abundance. Environmental annotations were displayed as ring-based heatmaps showing site-specific abundance patterns, complemented by outer bar plots representing relative abundance distributions.

4.9. Data Visualisation

Alpha-diversity metrics were visualised with box plots containing statistical annotations, and rarefaction curves were generated to assess sequencing depth sufficiency. Taxonomic composition was displayed using stacked bar plots and hierarchical clustering heatmaps. Predicted functional pathway comparisons were illustrated with forest plots to show differences between conditions. The results of the association network analysis were presented in both phylum-coloured and module-coloured formats to show microbial association patterns. Biomarker identification was performed with LEfSe, and results were visualised as cladograms and LDA score plots.

5. Conclusions

This study provides exploratory evidence that two dominant halophytes in the Yellow River Delta are associated with distinct rhizosphere bacterial community patterns under saline–alkaline and hydrological habitat contrasts. Hydrological habitat conditions and plant identity together contributed to differences in rhizosphere microbial community composition. T. chinensis generally harboured higher bacterial diversity, whereas S. glauca and T. chinensis showed contrasting patterns in predicted functional potential and exploratory microbial association networks. PICRUSt2-based analysis suggested that predicted functional profiles were more variable between hydrological habitats in the S. glauca rhizosphere, while no predicted pathway shifts were significant after multiple-testing correction in the T. chinensis rhizosphere. These contrasting habitat-associated patterns provide a basis for future studies of plant–microbiome relationships along saline–alkaline and hydrological gradients and may inform wetland restoration research.

Supplementary Materials

The following supporting information can be downloaded at: https://www.mdpi.com/article/10.3390/plants15172565/s1, Table S1. Descriptive statistics of soil physicochemical properties under flooded and non-flooded saline–alkaline rhizosphere habitats.

Author Contributions

Conceptualisation, Z.X., H.X. and Y.G.; methodology, Z.X., S.Q. and Y.G.; software, Z.X. and Y.G.; formal analysis, Z.X., S.Q., D.L., Y.X. and Y.G.; investigation, D.L., Y.X. and Z.W.; resources, H.X. and Y.G.; data curation, S.Q.; writing—original draft preparation, Z.X., S.Q., D.L., D.W., Y.X., Z.W. and Y.G.; writing—review and editing, Z.X., S.Q., D.L., D.W., G.S., Y.X., Z.W., H.X. and Y.G.; visualisation, Z.X. and Y.G.; supervision, Y.G.; project administration, Y.G.; funding acquisition, Z.X. and Y.G. All authors have read and agreed to the published version of the manuscript.

Funding

This research was funded by the Fundamental Research Funds for the Central Universities, China under grant numbers ZZK202503 and BLX202162 and the Beijing Forestry University College Student Innovation Training Program under grant numbers X202410022350 and X202410022346.

Data Availability Statement

The raw sequence data generated in this study have been deposited in the NCBI Sequence Read Archive (SRA) under BioProject accession number PRJNA1276525. The dataset comprises 20 full-length 16S rRNA gene amplicon samples sequenced on the PacBio Sequel II platform, with individual BioSample accessions ranging from SAMN51492768 to SAMN51492787 and corresponding SRA experiment accessions SRX30562599 to SRX30562618. The complete dataset, including all raw sequencing reads and associated metadata, is accessible through the SRA Study accession SRP621201. The data are available through NCBI BioProject PRJNA1276525 at https://www.ncbi.nlm.nih.gov/bioproject/PRJNA1276525 (accessed on 25 May 2026).

Acknowledgments

We gratefully acknowledge Xiaofang Chen and Kai Ning from the Dongying Academy of Agricultural Sciences for their invaluable assistance in field sampling and data collection in the Yellow River Delta region. Their local expertise and logistical support were essential for the successful completion of this research. We also thank the staff at Beijing Forestry University for providing laboratory facilities and technical support for sample processing and analysis. We appreciate the constructive feedback from anonymous reviewers, which helped improve the quality of this manuscript.

Conflicts of Interest

The authors declare that they have no conflicts of interest.

References

  1. Okur, B.; Örçen, N. Soil salinization and climate change. In Climate Change and Soil Interactions; Elsevier: Amsterdam, The Netherlands, 2020; pp. 331–350. [Google Scholar]
  2. Hassani, A.; Azapagic, A.; Shokri, N. Global predictions of primary soil salinization under changing climate in the 21st century. Nat. Commun. 2021, 12, 6663. [Google Scholar] [CrossRef] [Scilit] [PubMed]
  3. Singh, A. Soil salinity: A global threat to sustainable development. Soil Use Manag. 2022, 38, 39–67. [Google Scholar] [CrossRef] [Scilit]
  4. Ivushkin, K.; Bartholomeus, H.; Bregt, A.K.; Pulatov, A.; Kempen, B.; De Sousa, L. Global mapping of soil salinity change. Remote Sens. Environ. 2019, 231, 111260. [Google Scholar] [CrossRef] [Scilit]
  5. Li, Z.; Kekeli, M.A.; Jiang, Y.; Rui, Y. Progress and prospect of saline-alkaline soil management technology: A review. Appl. Sci. 2025, 15, 4567. [Google Scholar] [CrossRef] [Scilit]
  6. Majeed, A.; Muhammad, Z. Salinity: A major agricultural problem—Causes, impacts on crop productivity and management strategies. In Plant Abiotic Stress Tolerance: Agronomic, Molecular and Biotechnological Approaches; Springer: Berlin/Heidelberg, Germany, 2019; pp. 83–99. [Google Scholar]
  7. Husson, O. Redox potential (Eh) and pH as drivers of soil/plant/microorganism systems: A transdisciplinary overview pointing to integrative opportunities for agronomy. Plant Soil 2013, 362, 389–417. [Google Scholar] [CrossRef] [Scilit]
  8. Pezeshki, S.R.; DeLaune, R.D. Soil oxidation-reduction in wetlands and its impact on plant functioning. Biology 2012, 1, 196–221. [Google Scholar] [CrossRef] [Scilit] [PubMed]
  9. Daidu, F.; Yuan, W.; Min, L. Classifications, sedimentary features and facies associations of tidal flats. J. Palaeogeogr. 2013, 2, 66–80. [Google Scholar]
  10. Liu, L.; Wang, B. Protection of halophytes and their uses for cultivation of saline-alkali soil in China. Biology 2021, 10, 353. [Google Scholar] [CrossRef] [Scilit] [PubMed]
  11. Zhang, W.-W.; Chong, W.; Rui, X. Effects of salinity on the soil microbial community and soil fertility. J. Integr. Agric. 2019, 18, 1360–1368. [Google Scholar] [CrossRef] [Scilit]
  12. Li, S.-n.; Wang, G.-x.; Deng, W.; Hu, Y.-m.; Hu, W.-W. Influence of hydrology process on wetland landscape pattern: A case study in the Yellow River Delta. Ecol. Eng. 2009, 35, 1719–1726. [Google Scholar] [CrossRef] [Scilit]
  13. Yu, J.; Li, Y.; Han, G.; Zhou, D.; Fu, Y.; Guan, B.; Wang, G.; Ning, K.; Wu, H.; Wang, J. The spatial distribution characteristics of soil salinity in coastal zone of the Yellow River Delta. Environ. Earth Sci. 2014, 72, 589–599. [Google Scholar] [CrossRef] [Scilit]
  14. Singh, A. Soil salinization and waterlogging: A threat to environment and agricultural sustainability. Ecol. Indic. 2015, 57, 128–130. [Google Scholar] [CrossRef] [Scilit]
  15. Guo, B.; Liu, Y.; Fan, J.; Lu, M.; Zang, W.; Liu, C.; Wang, B.; Huang, X.; Lai, J.; Wu, H. The salinization process and its response to the combined processes of climate change–human activity in the Yellow River Delta between 1984 and 2022. CATENA 2023, 231, 107301. [Google Scholar] [CrossRef] [Scilit]
  16. Yadav, S.; Irfan, M.; Ahmad, A.; Hayat, S. Causes of salinity and plant manifestations to salt stress: A review. J. Environ. Biol. 2011, 32, 667. [Google Scholar] [PubMed]
  17. Wang, H.; She, D.; Ding, J.; Tang, S.; Liu, J.; Xin, P. Isotropic compression behavior of salinized unsaturated agricultural soil: An experimental and constitutive investigation. Soil Tillage Res. 2025, 245, 106314. [Google Scholar] [CrossRef] [Scilit]
  18. Acosta-Motos, J.R.; Ortuño, M.F.; Bernal-Vicente, A.; Diaz-Vivancos, P.; Sanchez-Blanco, M.J.; Hernandez, J.A. Plant responses to salt stress: Adaptive mechanisms. Agronomy 2017, 7, 18. [Google Scholar] [CrossRef] [Scilit]
  19. Arif, Y.; Singh, P.; Siddiqui, H.; Bajguz, A.; Hayat, S. Salinity induced physiological and biochemical changes in plants: An omic approach towards salt stress tolerance. Plant Physiol. Biochem. 2020, 156, 64–77. [Google Scholar] [CrossRef] [Scilit] [PubMed]
  20. Shabala, S.; Shabala, L.; Barcelo, J.; Poschenrieder, C. Membrane transporters mediating root signalling and adaptive responses to oxygen deprivation and soil flooding. Plant Cell Environ. 2014, 37, 2216–2233. [Google Scholar] [CrossRef] [Scilit] [PubMed]
  21. Pais, I.P.; Moreira, R.; Semedo, J.N.; Ramalho, J.C.; Lidon, F.C.; Coutinho, J.; Maçãs, B.; Scotti-Campos, P. Wheat crop under waterlogging: Potential soil and plant effects. Plants 2022, 12, 149. [Google Scholar] [CrossRef] [Scilit] [PubMed]
  22. Mukhtar, S.; Mirza, B.S.; Mehnaz, S.; Mirza, M.S.; Mclean, J.; Malik, K.A. Impact of soil salinity on the microbial structure of halophyte rhizosphere microbiome. World J. Microbiol. Biotechnol. 2018, 34, 136. [Google Scholar] [CrossRef] [Scilit] [PubMed]
  23. Li, H.; Chi, Z.; Li, J.; Wu, H.; Yan, B. Bacterial community structure and function in soils from tidal freshwater wetlands in a Chinese delta: Potential impacts of salinity and nutrient. Sci. Total Environ. 2019, 696, 134029. [Google Scholar] [CrossRef] [Scilit] [PubMed]
  24. Nihorimbere, V.; Ongena, M.; Smargiassi, M.; Thonart, P. Beneficial effect of the rhizosphere microbial community for plant growth and health. Biotechnol. Agron. Soc. Environ. 2011, 15, 327–337. [Google Scholar]
  25. Han, Q.; Ma, Q.; Chen, Y.; Tian, B.; Xu, L.; Bai, Y.; Chen, W.; Li, X. Variation in rhizosphere microbial communities and its association with the symbiotic efficiency of rhizobia in soybean. ISME J. 2020, 14, 1915–1928. [Google Scholar] [CrossRef] [Scilit] [PubMed]
  26. Kong, Z.; Liu, H. Modification of rhizosphere microbial communities: A possible mechanism of plant growth promoting rhizobacteria enhancing plant growth and fitness. Front. Plant Sci. 2022, 13, 920813. [Google Scholar] [CrossRef] [Scilit] [PubMed]
  27. Trivedi, P.; Leach, J.E.; Tringe, S.G.; Sa, T.; Singh, B.K. Plant–microbiome interactions: From community assembly to plant health. Nat. Rev. Microbiol. 2020, 18, 607–621. [Google Scholar] [CrossRef] [Scilit] [PubMed]
  28. Saeed, Q.; Xiukang, W.; Haider, F.U.; Kučerik, J.; Mumtaz, M.Z.; Holatko, J.; Naseem, M.; Kintl, A.; Ejaz, M.; Naveed, M. Rhizosphere bacteria in plant growth promotion, biocontrol, and bioremediation of contaminated sites: A comprehensive review of effects and mechanisms. Int. J. Mol. Sci. 2021, 22, 10529. [Google Scholar] [CrossRef] [Scilit] [PubMed]
  29. Das, P.P.; Singh, K.R.; Nagpure, G.; Mansoori, A.; Singh, R.P.; Ghazi, I.A.; Kumar, A.; Singh, J. Plant-soil-microbes: A tripartite interaction for nutrient acquisition and better plant growth for sustainable agricultural practices. Environ. Res. 2022, 214, 113821. [Google Scholar] [CrossRef] [Scilit] [PubMed]
  30. Thepbandit, W.; Athinuwat, D. Rhizosphere microorganisms supply availability of soil nutrients and induce plant defense. Microorganisms 2024, 12, 558. [Google Scholar] [CrossRef] [Scilit] [PubMed]
  31. Sannazzaro, A.I.; Ruiz, O.A.; Albertó, E.O.; Menéndez, A.B. Alleviation of salt stress in Lotus glaber by Glomus intraradices. Plant Soil 2006, 285, 279–287. [Google Scholar] [CrossRef] [Scilit]
  32. Han, Q.-Q.; Lü, X.-P.; Bai, J.-P.; Qiao, Y.; Paré, P.W.; Wang, S.-M.; Zhang, J.-L.; Wu, Y.-N.; Pang, X.-P.; Xu, W.-B. Beneficial soil bacterium Bacillus subtilis (GB03) augments salt tolerance of white clover. Front. Plant Sci. 2014, 5, 525. [Google Scholar] [CrossRef] [Scilit] [PubMed]
  33. Salazar-Garcia, G.; Balaguera-Lopez, H.E.; Hernandez, J.P. Effect of plant growth-promoting bacteria Azospirillum brasilense on the physiology of radish (Raphanus sativus L.) under waterlogging stress. Agronomy 2022, 12, 726. [Google Scholar] [CrossRef] [Scilit]
  34. Zhang, C.; Zhou, X.; Wang, X.; Ge, J.; Cai, B. Elaeagnus angustifolia can improve salt-alkali soil and the health level of soil: Emphasizing the driving role of core microbial communities. J. Environ. Manag. 2022, 305, 114401. [Google Scholar] [CrossRef] [Scilit] [PubMed]
  35. Ren, H.; Zhang, F.; Zhu, X.; Lamlom, S.F.; Zhao, K.; Zhang, B.; Wang, J. Manipulating rhizosphere microorganisms to improve crop yield in saline-alkali soil: A study on soybean growth and development. Front. Microbiol. 2023, 14, 1233351. [Google Scholar] [CrossRef] [Scilit] [PubMed]
  36. Xu, X.; Guo, L.; Wang, S.; Wang, X.; Ren, M.; Zhao, P.; Huang, Z.; Jia, H.; Wang, J.; Lin, A. Effective strategies for reclamation of saline-alkali soil and response mechanisms of the soil-plant system. Sci. Total Environ. 2023, 905, 167179. [Google Scholar] [CrossRef] [Scilit] [PubMed]
  37. Kumar, M.; Gupta, A.; Vandana, P.; Tiwari, L.D.; Patel, M.K.; Siddique, K.H. Recent advances of plant growth-promoting rhizobacteria (PGPR)-mediated drought and waterlogging stress tolerance in plants for sustainable agriculture. In Microbial Biostimulants for Plant Growth and Abiotic Stress Amelioration; Elsevier: Amsterdam, The Netherlands, 2024; pp. 315–344. [Google Scholar]
  38. Aloo, B.N.; Tripathi, V.; Makumba, B.A.; Mbega, E.R. Plant growth-promoting rhizobacterial biofertilizers for crop production: The past, present, and future. Front. Plant Sci. 2022, 13, 1002448. [Google Scholar] [CrossRef] [Scilit] [PubMed]
  39. Zhang, T.; Jian, Q.; Yao, X.; Guan, L.; Li, L.; Liu, F.; Zhang, C.; Li, D.; Tang, H.; Lu, L. Plant growth-promoting rhizobacteria (PGPR) improve the growth and quality of several crops. Heliyon 2024, 10, e31553. [Google Scholar] [CrossRef] [Scilit] [PubMed]
  40. Yang, H.; Xia, J.; Cui, Q.; Liu, J.; Wei, S.; Feng, L.; Dong, K. Effects of different Tamarix chinensis-grass patterns on the soil quality of coastal saline soil in the Yellow River Delta, China. Sci. Total Environ. 2021, 772, 145501. [Google Scholar] [CrossRef] [Scilit] [PubMed]
  41. Jiang, H.; Okoye, C.O.; Chen, X.; Zhang, F.; Jiang, J. High-throughput 16S rRNA gene-based amplicon sequencing reveals the functional divergence of halophilic bacterial communities in the Suaeda salsa root compartments on the eastern coast of China. Sci. Total Environ. 2024, 942, 173775. [Google Scholar] [CrossRef] [Scilit] [PubMed]
  42. Jin, H.; Dong, D.; Yang, Q.; Zhu, D. Salt-responsive transcriptome profiling of Suaeda glauca via RNA sequencing. PLoS ONE 2016, 11, e0150504. [Google Scholar] [CrossRef] [Scilit] [PubMed]
  43. Yu, W.; Wu, W.; Zhang, N.; Wang, L.; Wang, Y.; Wang, B.; Lan, Q.; Wang, Y. Research advances on molecular mechanism of salt tolerance in Suaeda. Biology 2022, 11, 1273. [Google Scholar] [CrossRef] [Scilit] [PubMed]
  44. Mujakić, I.; Piwosz, K.; Koblížek, M. Phylum Gemmatimonadota and its role in the environment. Microorganisms 2022, 10, 151. [Google Scholar] [CrossRef] [Scilit] [PubMed]
  45. Dong, L.; Hua, Y.; Gao, Z.; Wu, H.; Hou, Y.; Chu, Y.; Zhang, J.; Cui, G. The multiple promoting effects of Suaeda glauca root exudates on the growth of alfalfa under NaCl stress. Plants 2024, 13, 752. [Google Scholar] [CrossRef] [Scilit] [PubMed]
  46. Ren, D.; Xu, X.; Ramos, T.B.; Huang, Q.; Huo, Z.; Huang, G. Modeling and assessing the function and sustainability of natural patches in salt-affected agro-ecosystems: Application to tamarisk (Tamarix chinensis Lour.) in Hetao, upper Yellow River basin. J. Hydrol. 2017, 552, 490–504. [Google Scholar] [CrossRef] [Scilit]
  47. Sun, J.; Xia, J.; Zhao, X.; Gao, F.; Zhao, W.; Xing, X.; Dong, M.; Chu, J. Enrichment of soil nutrients and salt ions with different salinities under Tamarix chinensis shrubs in the Yellow River Delta. CATENA 2023, 232, 107433. [Google Scholar] [CrossRef] [Scilit]
  48. Wang, X.; Sun, R.; Tian, Y.; Guo, K.; Sun, H.; Liu, X.; Chu, H.; Liu, B. Long-term phytoremediation of coastal saline soil reveals plant species-specific patterns of microbial community recruitment. Msystems 2020, 5, 10–1128. [Google Scholar] [CrossRef] [Scilit] [PubMed]
  49. Simon, H.M.; Smith, M.W.; Herfort, L. Metagenomic insights into particles and their associated microbiota in a coastal margin ecosystem. Front. Microbiol. 2014, 5, 466. [Google Scholar] [CrossRef] [Scilit] [PubMed]
  50. Sjøgaard, K.S.; Valdemarsen, T.B.; Treusch, A.H. Responses of an agricultural soil microbiome to flooding with seawater after managed coastal realignment. Microorganisms 2018, 6, 12. [Google Scholar] [CrossRef] [Scilit] [PubMed]
  51. Huckle, J.M.; Potter, J.A.; Marrs, R.H. Influence of environmental factors on the growth and interactions between salt marsh plants: Effects of salinity, sediment and waterlogging. J. Ecol. 2000, 88, 492–505. [Google Scholar] [CrossRef] [Scilit]
  52. Fang, S.; Hou, X.; Liang, X. Response mechanisms of plants under saline-alkali stress. Front. Plant Sci. 2021, 12, 667458. [Google Scholar] [CrossRef] [Scilit] [PubMed]
  53. Manghwar, H.; Hussain, A.; Alam, I.; Khoso, M.A.; Ali, Q.; Liu, F. Waterlogging stress in plants: Unraveling the mechanisms and impacts on growth, development, and productivity. Environ. Exp. Bot. 2024, 224, 105824. [Google Scholar] [CrossRef] [Scilit]
  54. Shao, T.; Zhao, J.; Liu, A.; Long, X.; Rengel, Z. Effects of soil physicochemical properties on microbial communities in different ecological niches in coastal area. Appl. Soil Ecol. 2020, 150, 103486. [Google Scholar] [CrossRef] [Scilit]
  55. Props, R.; Denef, V.J. Temperature and nutrient levels correspond with lineage-specific microdiversification in the ubiquitous and abundant freshwater genus Limnohabitans. Appl. Environ. Microbiol. 2020, 86, e00140-20. [Google Scholar] [CrossRef] [Scilit] [PubMed]
  56. Shabarova, T.; Kasalický, V.; Šimek, K.; Nedoma, J.; Znachor, P.; Posch, T.; Pernthaler, J.; Salcher, M.M. Distribution and ecological preferences of the freshwater lineage L im A (genus L imnohabitans) revealed by a new double hybridization approach. Environ. Microbiol. 2017, 19, 1296–1309. [Google Scholar] [CrossRef] [Scilit] [PubMed]
  57. Zhu, F.; Qu, L.; Hong, X.; Sun, X. Isolation and characterization of a phosphate-solubilizing halophilic bacterium Kushneria sp. YCWA18 from Daqiao Saltern on the coast of Yellow Sea of China. Evid.-Based Complement. Altern. Med. 2011, 2011, 615032. [Google Scholar] [CrossRef] [Scilit] [PubMed]
  58. Du, G.-X.; Qu, L.-Y.; Hong, X.-G.; Li, C.-H.; Ding, D.-W.; Gao, P.; Xu, Q.-Z. Kushneria phosphatilytica sp. nov., a phosphate-solubilizing bacterium isolated from a solar saltern. Int. J. Syst. Evol. Microbiol. 2021, 71, 004619. [Google Scholar] [CrossRef] [Scilit] [PubMed]
  59. Handley, K.M.; Lloyd, J.R. Biogeochemical implications of the ubiquitous colonization of marine habitats and redox gradients by Marinobacter species. Front. Microbiol. 2013, 4, 136. [Google Scholar] [CrossRef] [Scilit] [PubMed]
  60. Singer, E.; Webb, E.A.; Nelson, W.C.; Heidelberg, J.F.; Ivanova, N.; Pati, A.; Edwards, K.J. Genomic potential of Marinobacter aquaeolei, a biogeochemical “opportunitroph”. Appl. Environ. Microbiol. 2011, 77, 2763–2771. [Google Scholar] [CrossRef] [Scilit] [PubMed]
  61. Bonin, P.; Vieira, C.; Grimaud, R.; Militon, C.; Cuny, P.; Lima, O.; Guasco, S.; Brussaard, C.P.; Michotey, V. Substrates specialization in lipid compounds and hydrocarbons of Marinobacter genus. Environ. Sci. Pollut. Res. 2015, 22, 15347–15359. [Google Scholar] [CrossRef] [Scilit] [PubMed]
  62. Qiu, L.; Kong, W.; Zhu, H.; Zhang, Q.; Banerjee, S.; Ishii, S.; Sadowsky, M.J.; Gao, J.; Feng, C.; Wang, J. Halophytes increase rhizosphere microbial diversity, network complexity and function in inland saline ecosystem. Sci. Total Environ. 2022, 831, 154944. [Google Scholar] [CrossRef] [Scilit] [PubMed]
  63. Lei, S.; Xu, X.; Cheng, Z.; Xiong, J.; Ma, R.; Zhang, L.; Yang, X.; Zhu, Y.; Zhang, B.; Tian, B. Analysis of the community composition and bacterial diversity of the rhizosphere microbiome across different plant taxa. Microbiologyopen 2019, 8, e00762. [Google Scholar] [CrossRef] [Scilit] [PubMed]
  64. Qiqige, B.; Liu, J.; Li, M.; Hu, X.; Guo, W.; Wang, P.; Ding, Y.; Zhi, Q.; Wu, Y.; Guan, X. Different flooding conditions affected microbial diversity in riparian zone of Huihe Wetland. Microorganisms 2025, 13, 154. [Google Scholar] [CrossRef] [Scilit] [PubMed]
  65. Senko, H.; Kajić, S.; Huđ, A.; Palijan, G.; Petek, M.; Rajnović, I.; Šamec, D.; Udiković-Kolić, N.; Mešić, A.; Brkljačić, L. Will the beneficial properties of plant-growth promoting bacteria be affected by waterlogging predicted in the wake of climate change: A model study. Appl. Soil Ecol. 2024, 198, 105379. [Google Scholar] [CrossRef] [Scilit]
  66. Otlewska, A.; Migliore, M.; Dybka-Stępień, K.; Manfredini, A.; Struszczyk-Świta, K.; Napoli, R.; Białkowska, A.; Canfora, L.; Pinzari, F. When salt meddles between plant, soil, and microorganisms. Front. Plant Sci. 2020, 11, 553087. [Google Scholar] [CrossRef] [Scilit] [PubMed]
  67. Yu, T.; Cheng, L.; Liu, Q.; Wang, S.; Zhou, Y.; Zhong, H.; Tang, M.; Nian, H.; Lian, T. Effects of waterlogging on soybean rhizosphere bacterial community using V4, LoopSeq, and PacBio 16S rRNA sequence. Microbiol. Spectr. 2022, 10, e02011-21. [Google Scholar] [CrossRef] [Scilit] [PubMed]
  68. Leelastwattanagul, O.; Sutheeworapong, S.; Khoiri, A.N.; Dulsawat, S.; Wattanachaisaereekul, S.; Tachaleat, A.; Duangfoo, T.; Paenkaew, P.; Prommeenate, P.; Cheevadhanarak, S. Soil microbiome analysis reveals effects of periodic waterlogging stress on sugarcane growth. PLoS ONE 2023, 18, e0293834. [Google Scholar] [CrossRef] [Scilit] [PubMed]
  69. Li, T.; Wang, M.; Cui, R.; Li, B.; Wu, T.; Liu, Y.; Geng, G.; Xu, Y.; Wang, Y. Waterlogging stress alters the structure of sugar beet rhizosphere microbial community structure and recruiting potentially beneficial bacterial. Ecotoxicol. Environ. Saf. 2023, 262, 115172. [Google Scholar] [CrossRef] [Scilit] [PubMed]
  70. González Macé, O.; Steinauer, K.; Jousset, A.; Eisenhauer, N.; Scheu, S. Flood-induced changes in soil microbial functions as modified by plant diversity. PLoS ONE 2016, 11, e0166349. [Google Scholar] [CrossRef] [Scilit] [PubMed]
  71. Liu, R.; Liang, B.; Zhao, H.; Zhao, Y. Impacts of various amendments on the microbial communities and soil organic carbon of coastal saline–alkali soil in the Yellow River Delta. Front. Microbiol. 2023, 14, 1239855. [Google Scholar] [CrossRef] [Scilit] [PubMed]
  72. Ma, S.; Liu, X.; Liu, J.; Zeng, J.; Zhou, X.; Jia, Z.; Li, C.; Leng, H.; Liu, X.; Zhang, J. Keystone microbial species drive the responses of saline–alkali soil to three-year amendment measures. Forests 2023, 14, 2295. [Google Scholar] [CrossRef] [Scilit]
  73. Van Le, V.; Ko, S.-R.; Oh, H.-M.; Ahn, C.-Y. Genomic insights into Paucibacter aquatile DH15, a cyanobactericidal bacterium, and comparative genomics of the genus Paucibacter. J. Microbiol. Biotechnol. 2023, 33, 1615. [Google Scholar] [CrossRef] [Scilit] [PubMed]
  74. Vreeland, R.H. Halomonas. In Bergey’s Manual of Systematics of Archaea and Bacteria; Wiley: Hoboken, NJ, USA, 2015; pp. 1–19. [Google Scholar]
  75. Liu, L.; Huang, X.; Zhang, J.; Cai, Z.; Jiang, K.; Chang, Y. Deciphering the relative importance of soil and plant traits on the development of rhizosphere microbial communities. Soil Biol. Biochem. 2020, 148, 107909. [Google Scholar] [CrossRef] [Scilit]
  76. Loeffler, C.; Karlsberg, A.; Martin, L.S.; Eskin, E.; Koslicki, D.; Mangul, S. Improving the usability and comprehensiveness of microbial databases. BMC Biol. 2020, 18, 37. [Google Scholar] [CrossRef] [Scilit] [PubMed]
  77. Ding, Y.; Ke, J.; Hong, T.; Zhang, A.; Wu, X.; Jiang, X.; Shao, S.; Gong, M.; Zhao, S.; Shen, L. Microbial diversity and ecological roles of halophilic microorganisms in Dingbian (Shaanxi, China) saline-alkali soils and salt lakes. BMC Microbiol. 2025, 25, 287. [Google Scholar] [CrossRef] [Scilit] [PubMed]
  78. Li, P.-D.; Jeewon, R.; Aruna, B.; Li, H.-Y.; Lin, F.-C.; Wang, H.-K. Metabarcoding reveals differences in fungal communities between unflooded versus tidal flat soil in coastal saline ecosystem. Sci. Total Environ. 2019, 690, 911–922. [Google Scholar] [CrossRef] [Scilit] [PubMed]
  79. Segata, N.; Izard, J.; Waldron, L.; Gevers, D.; Miropolsky, L.; Garrett, W.S.; Huttenhower, C. Metagenomic biomarker discovery and explanation. Genome Biol. 2011, 12, R60. [Google Scholar] [CrossRef] [Scilit] [PubMed]
  80. Yuan, C.-G.; Chen, X.; Jiang, Z.; Chen, W.; Liu, L.; Xian, W.-D.; Asem, M.D.; Zhi, X.-Y.; Li, W.-J. Altererythrobacter lauratis sp. nov. and Altererythrobacter palmitatis sp. nov., isolated from a Tibetan hot spring. Antonie Van Leeuwenhoek 2017, 110, 1077–1086. [Google Scholar] [CrossRef] [Scilit] [PubMed]
  81. Maeda, A.H.; Nishi, S.; Ishii, S.i.; Shimane, Y.; Kobayashi, H.; Ichikawa, J.; Kurosawa, K.; Arai, W.; Takami, H.; Ohta, Y. Complete genome sequence of Altererythrobacter sp. strain B11, an aromatic monomer-degrading bacterium, isolated from deep-sea sediment under the seabed off Kashima, Japan. Genome Announc. 2018, 6, 10–1128. [Google Scholar] [CrossRef] [Scilit] [PubMed]
  82. Levy-Booth, D.J.; Hashimi, A.; Roccor, R.; Liu, L.-Y.; Renneckar, S.; Eltis, L.D.; Mohn, W.W. Genomics and metatranscriptomics of biogeochemical cycling and degradation of lignin-derived aromatic compounds in thermal swamp sediment. ISME J. 2021, 15, 879–893. [Google Scholar] [CrossRef] [Scilit] [PubMed]
  83. Fan, K.; Feng, Q.; Li, K.; Lin, J.; Wang, W.; Cao, Y.; Gai, H.; Song, H.; Huang, T.; Zhu, Q. The metabolism of pyrene by a novel Altererythrobacter sp. with in-situ co-substrates: A mechanistic analysis based on pathway, genomics, and enzyme activity. Chemosphere 2022, 307, 135784. [Google Scholar] [CrossRef] [Scilit] [PubMed]
  84. Addison, S.L.; Foote, S.M.; Reid, N.M.; Lloyd-Jones, G. Novosphingobium nitrogenifigens sp. nov., a polyhydroxyalkanoate-accumulating diazotroph isolated from a New Zealand pulp and paper wastewater. Int. J. Syst. Evol. Microbiol. 2007, 57, 2467–2471. [Google Scholar] [CrossRef] [Scilit] [PubMed]
  85. Smit, A.-M.; Strabala, T.J.; Peng, L.; Rawson, P.; Lloyd-Jones, G.; Jordan, T.W. Proteomic phenotyping of Novosphingobium nitrogenifigens reveals a robust capacity for simultaneous nitrogen fixation, polyhydroxyalkanoate production, and resistance to reactive oxygen species. Appl. Environ. Microbiol. 2012, 78, 4802–4815. [Google Scholar] [CrossRef] [Scilit] [PubMed]
  86. Lyu, Y.; Zheng, W.; Zheng, T.; Tian, Y. Biodegradation of polycyclic aromatic hydrocarbons by Novosphingobium pentaromativorans US6-1. PLoS ONE 2014, 9, e101438. [Google Scholar] [CrossRef] [Scilit] [PubMed]
  87. Rangjaroen, C.; Sungthong, R.; Rerkasem, B.; Teaumroong, N.; Noisangiam, R.; Lumyong, S. Untapped endophytic colonization and plant growth-promoting potential of the genus Novosphingobium to optimize rice cultivation. Microbes Environ. 2017, 32, 84–87. [Google Scholar] [CrossRef] [Scilit] [PubMed]
  88. Choi, D.H.; Hwang, C.Y.; Cho, B.C. Pelagibius litoralis gen. nov., sp. nov., a marine bacterium in the family Rhodospirillaceae isolated from coastal seawater. Int. J. Syst. Evol. Microbiol. 2009, 59, 818–823. [Google Scholar] [CrossRef] [Scilit] [PubMed]
  89. Xu, Y.; Tian, X.-P.; Liu, Y.-J.; Li, J.; Kim, C.-J.; Yin, H.; Li, W.-J.; Zhang, S. Sinomicrobium oceani gen. nov., sp. nov., a member of the family Flavobacteriaceae isolated from marine sediment. Int. J. Syst. Evol. Microbiol. 2013, 63, 1045–1050. [Google Scholar] [CrossRef] [Scilit] [PubMed]
  90. Cao, W.-R.; Zhang, L.-Z.; Hu, Y.-H.; Jiang, M.-Y.; Li, Y.-J. Salinimicrobium nanhaiense sp. nov. and Salinimicrobium oceani sp. nov., two novel species of the family Flavobacteriaceae isolated from the South China Sea. Int. J. Syst. Evol. Microbiol. 2020, 70, 5263–5270. [Google Scholar] [CrossRef] [Scilit] [PubMed]
  91. Kazar, J. Coxiella burnetii infection. Ann. N. Y. Acad. Sci. 2005, 1063, 105–114. [Google Scholar] [CrossRef] [Scilit] [PubMed]
  92. Auguste, M.; Rahman, F.U.; Balbi, T.; Leonessi, M.; Oliveri, C.; Bellese, G.; Vezzulli, L.; Furones, D.; Canesi, L. Responses of Mytilus galloprovincialis to challenge with environmental isolates of the potential emerging pathogen Malaciobacter marinus. Fish Shellfish Immunol. 2022, 131, 1–9. [Google Scholar] [CrossRef] [Scilit] [PubMed]
  93. Melton, E.D.; Sorokin, D.Y.; Overmars, L.; Chertkov, O.; Clum, A.; Pillay, M.; Ivanova, N.; Shapiro, N.; Kyrpides, N.C.; Woyke, T. Complete genome sequence of Desulfurivibrio alkaliphilus strain AHT2T, a haloalkaliphilic sulfidogen from Egyptian hypersaline alkaline lakes. Stand. Genom. Sci. 2016, 11, 67. [Google Scholar] [CrossRef] [Scilit] [PubMed]
  94. Kojima, H.; Watanabe, M.; Fukui, M. Sulfurivermis fontis gen. nov., sp. nov., a sulfur-oxidizing autotroph, and proposal of Thioprofundaceae fam. nov. Int. J. Syst. Evol. Microbiol. 2017, 67, 3458–3461. [Google Scholar] [CrossRef] [Scilit] [PubMed]
  95. Pfennig, N.; Biebl, H. Desulfuromonas acetoxidans gen. nov. and sp. nov., a new anaerobic, sulfur-reducing, acetate-oxidizing bacterium. Arch. Microbiol. 1976, 110, 3–12. [Google Scholar] [CrossRef] [Scilit] [PubMed]
  96. Konopka, A.; Lindemann, S.; Fredrickson, J. Dynamics in microbial communities: Unraveling mechanisms to identify principles. ISME J. 2015, 9, 1488–1495. [Google Scholar] [CrossRef] [Scilit] [PubMed]
  97. Lee, K.K.; Kim, H.; Lee, Y.-H. Cross-kingdom co-occurrence networks in the plant microbiome: Importance and ecological interpretations. Front. Microbiol. 2022, 13, 953300. [Google Scholar] [CrossRef] [Scilit] [PubMed]
  98. Newman, M.E. Modularity and community structure in networks. Proc. Natl. Acad. Sci. USA 2006, 103, 8577–8582. [Google Scholar] [CrossRef] [Scilit] [PubMed]
  99. Hassani, M.A.; Durán, P.; Hacquard, S. Microbial interactions within the plant holobiont. Microbiome 2018, 6, 58. [Google Scholar] [CrossRef] [Scilit] [PubMed]
  100. Tao, J.; Meng, D.; Qin, C.; Liu, X.; Liang, Y.; Xiao, Y.; Liu, Z.; Gu, Y.; Li, J.; Yin, H. Integrated network analysis reveals the importance of microbial interactions for maize growth. Appl. Microbiol. Biotechnol. 2018, 102, 3805–3818. [Google Scholar] [CrossRef] [Scilit] [PubMed]
  101. Gao, C.; Xu, L.; Montoya, L.; Madera, M.; Hollingsworth, J.; Chen, L.; Purdom, E.; Singan, V.; Vogel, J.; Hutmacher, R.B. Co-occurrence networks reveal more complexity than community composition in resistance and resilience of microbial communities. Nat. Commun. 2022, 13, 3867. [Google Scholar] [CrossRef] [Scilit] [PubMed]
  102. Gao, L.; Huang, Y.; Liu, Y.; Mohamed, O.A.A.; Fan, X.; Wang, L.; Li, L.; Ma, J. Bacterial community structure and potential microbial coexistence mechanism associated with three halophytes adapting to the extremely hypersaline environment. Microorganisms 2022, 10, 1124. [Google Scholar] [CrossRef] [Scilit] [PubMed]
  103. Power, M.E.; Tilman, D.; Estes, J.A.; Menge, B.A.; Bond, W.J.; Mills, L.S.; Daily, G.; Castilla, J.C.; Lubchenco, J.; Paine, R.T. Challenges in the quest for keystones: Identifying keystone species is difficult—But essential to understanding how loss of species will affect ecosystems. BioScience 1996, 46, 609–620. [Google Scholar]
  104. Zhao, H.; Li, S.; Jiang, Y.; Wang, D.; Wang, H.; Dou, X. Independent and combined effects of antibiotic stress and EM microbial agent on the nitrogen and humus transformation and bacterial community successions during the chicken manure composting. Bioresour. Technol. 2022, 354, 127237. [Google Scholar] [CrossRef] [Scilit] [PubMed]
  105. Liu, C.; Li, L.; Zhi, Y.; Chen, J.; Zuo, Q.; He, Q. Molecular insight into the vertical migration and degradation of dissolved organic matter in riparian soil profiles. Environ. Res. 2024, 245, 118013. [Google Scholar] [CrossRef] [Scilit] [PubMed]
  106. Feng, K.; Zhang, Z.; Cai, W.; Liu, W.; Xu, M.; Yin, H.; Wang, A.; He, Z.; Deng, Y. Biodiversity and species competition regulate the resilience of microbial biofilm community. Mol. Ecol. 2017, 26, 6170–6182. [Google Scholar] [CrossRef] [Scilit] [PubMed]
  107. Zhang, C.; Lei, S.; Wu, H.; Liao, L.; Wang, X.; Zhang, L.; Liu, G.; Wang, G.; Fang, L.; Song, Z. Simplified microbial network reduced microbial structure stability and soil functionality in alpine grassland along a natural aridity gradient. Soil Biol. Biochem. 2024, 191, 109366. [Google Scholar] [CrossRef] [Scilit]
  108. Douglas, G.M.; Maffei, V.J.; Zaneveld, J.R.; Yurgel, S.N.; Brown, J.R.; Taylor, C.M.; Huttenhower, C.; Langille, M.G.I. PICRUSt2 for prediction of metagenome functions. Nat. Biotechnol. 2020, 38, 685–688. [Google Scholar] [CrossRef] [Scilit] [PubMed]
  109. Williamson, K.S.; Richards, L.A.; Perez-Osorio, A.C.; Pitts, B.; McInnerney, K.; Stewart, P.S.; Franklin, M.J. Heterogeneity in Pseudomonas aeruginosa biofilms includes expression of ribosome hibernation factors in the antibiotic-tolerant subpopulation and hypoxia-induced stress response in the metabolically active population. J. Bacteriol. 2012, 194, 2062–2073. [Google Scholar] [CrossRef] [Scilit] [PubMed]
  110. Trivedi, P.; Delgado-Baquerizo, M.; Trivedi, C.; Hu, H.; Anderson, I.C.; Jeffries, T.C.; Zhou, J.; Singh, B.K. Microbial regulation of the soil carbon cycle: Evidence from gene–enzyme relationships. ISME J. 2016, 10, 2593–2604. [Google Scholar] [CrossRef] [Scilit] [PubMed]
  111. Picard, F.; Loubière, P.; Girbal, L.; Cocaign-Bousquet, M. The significance of translation regulation in the stress response. BMC Genom. 2013, 14, 588. [Google Scholar] [CrossRef] [Scilit] [PubMed]
  112. Nagesh, K.M.; Piovene, C. Emission and function of volatile organic compounds in response to abiotic stress. In Abiotic Stress in Plants: Mechanisms and Adaptations; Intech: Rijeka, Croatia, 2011; 367p. [Google Scholar]
  113. Vimal, S.R.; Singh, J.S.; Kumar, A.; Prasad, S.M. The plant endomicrobiome: Structure and strategies to produce stress resilient future crop. Curr. Res. Microb. Sci. 2024, 6, 100236. [Google Scholar] [CrossRef] [Scilit] [PubMed]
  114. Biswas, T.; Kole, S.C. Soil organic matter and microbial role in plant productivity and soil fertility. In Advances in Soil Microbiology: Recent Trends and Future Prospects: Volume 2: Soil-Microbe-Plant Interaction; Meena, V.S., Ed.; Springer: Singapore, 2018; pp. 219–238. [Google Scholar]
  115. Yao, K.; Wang, G.; Zhang, W.; Liu, Q.; Hu, J.; Ye, M.; Jiang, X. Saline soil improvement promotes the transformation of microbial salt tolerance mechanisms and microbial-plant-animal ecological interactions. J. Environ. Manag. 2024, 372, 123360. [Google Scholar] [CrossRef] [Scilit] [PubMed]
  116. Wang, X.; Riaz, M.; Babar, S.; Eldesouki, Z.; Liu, B.; Xia, H.; Li, Y.; Wang, J.; Xia, X.; Jiang, C. Alterations in the composition and metabolite profiles of the saline-alkali soil microbial community through biochar application. J. Environ. Manag. 2024, 352, 120033. [Google Scholar] [CrossRef] [Scilit] [PubMed]
  117. Dai, D.; Xu, J.; Jiang, T. Agro-geological characteristics of Dongying coastal areas. Shanghai Geol. 2010, 31, 118–121. [Google Scholar]
  118. Song, C. Distribution patterns of plant communities in the Yellow River Delta and related affecting factors. Chin. J. Ecol. 2008, 27, 2042–2048. [Google Scholar]
  119. Wang, Z.; Zhao, G.; Gao, M.; Chang, C. Spatial variability of soil salinity in coastal saline soil at different scales in the Yellow River Delta, China. Environ. Monit. Assess. 2017, 189, 80. [Google Scholar] [CrossRef] [Scilit] [PubMed]
  120. Li, Y.; Yu, J.; Ning, K.; Du, S.; Han, G.; Qu, F.; Wang, G.; Fu, Y.; Zhan, C. Ecological effects of roads on the plant diversity of coastal wetland in the Yellow River Delta. Sci. World J. 2014, 2014, 952051. [Google Scholar] [CrossRef] [Scilit] [PubMed]
  121. Callahan, B.J.; Wong, J.; Heiner, C.; Oh, S.; Theriot, C.M.; Gulati, A.S.; McGill, S.K.; Dougherty, M.K. High-throughput amplicon sequencing of the full-length 16S rRNA gene with single-nucleotide resolution. Nucleic Acids Res. 2019, 47, e103. [Google Scholar] [CrossRef] [Scilit] [PubMed]
  122. Ardui, S.; Ameur, A.; Vermeesch, J.R.; Hestand, M.S. Single molecule real-time (SMRT) sequencing comes of age: Applications and utilities for medical diagnostics. Nucleic Acids Res. 2018, 46, 2159–2168. [Google Scholar] [CrossRef] [Scilit] [PubMed]
  123. Martin, M. Cutadapt removes adapter sequences from high-throughput sequencing reads. EMBnet. J. 2011, 17, 10–12. [Google Scholar] [CrossRef] [Scilit]
  124. Edgar, R.C.; Haas, B.J.; Clemente, J.C.; Quince, C.; Knight, R. UCHIME improves sensitivity and speed of chimera detection. Bioinformatics 2011, 27, 2194–2200. [Google Scholar] [CrossRef] [Scilit] [PubMed]
  125. Bokulich, N.A.; Subramanian, S.; Faith, J.J.; Gevers, D.; Gordon, J.I.; Knight, R.; Mills, D.A.; Caporaso, J.G. Quality-filtering vastly improves diversity estimates from Illumina amplicon sequencing. Nat. Methods 2013, 10, 57–59. [Google Scholar] [CrossRef] [Scilit] [PubMed]
  126. Edgar, R.C. UPARSE: Highly accurate OTU sequences from microbial amplicon reads. Nat. Methods 2013, 10, 996–998. [Google Scholar] [CrossRef] [Scilit] [PubMed]
  127. Quast, C.; Pruesse, E.; Yilmaz, P.; Gerken, J.; Schweer, T.; Yarza, P.; Peplies, J.; Glöckner, F.O. The SILVA ribosomal RNA gene database project: Improved data processing and web-based tools. Nucleic Acids Res. 2012, 41, D590–D596. [Google Scholar] [CrossRef] [Scilit] [PubMed]
  128. Bolyen, E.; Rideout, J.R.; Dillon, M.R.; Bokulich, N.A.; Abnet, C.C.; Al-Ghalith, G.A.; Alexander, H.; Alm, E.J.; Arumugam, M.; Asnicar, F. Reproducible, interactive, scalable and extensible microbiome data science using QIIME 2. Nat. Biotechnol. 2019, 37, 852–857. [Google Scholar] [CrossRef] [Scilit] [PubMed]
  129. Wang, Z.; Guo, Y.; Chen, Y.; Gao, F.; Xue, Y.; Niu, Q.; Li, D.; Smagghe, G.; Gai, Y. Chloroplast genome sequencing of Poa pratensis and comparative chloroplast genomics analysis with other 29 grass species. Funct. Integr. Genom. 2026, 26, 44. [Google Scholar] [CrossRef] [Scilit] [PubMed]
Figure 1. Descriptive comparison of soil physicochemical properties under flooded and non-flooded conditions. Bars represent quadrat-level group means, and error bars represent standard deviations.
Plants 15 02565 g001
Figure 2. Alpha diversity of rhizosphere bacterial communities across NH, MH, NC, and MC. Boxplots show observed species richness, ACE, Chao1, Shannon diversity, Gini–Simpson diversity, and Good’s coverage for NH, non-flooded Suaeda glauca; MH, flooded S. glauca; NC, non-flooded Tamarix chinensis; and MC, flooded T. chinensis. Different lowercase letters indicate groups that differed significantly in the pairwise comparisons shown in the figure (p < 0.05); groups sharing a letter were not significantly different.
Plants 15 02565 g002
Figure 3. Sensitivity analysis of NMDS patterns across four dissimilarity strategies. Panels show NMDS ordinations of rhizosphere bacterial communities based on Bray–Curtis, binary Jaccard, Kulczynski, and Euclidean distance after Hellinger transformation. Points represent individual samples, dashed ellipses indicate 95% group envelopes, and group labels are placed at centroids.
Plants 15 02565 g003
Figure 4. Taxonomic composition and descriptive OTU overlap patterns of rhizosphere bacterial communities associated with S. glauca and T. chinensis under flooded and non-flooded saline–alkaline conditions. (A) Stacked bar plots showing the relative abundances of the dominant bacterial phyla (top) and genera (bottom) across the four condition groups. (B) Descriptive set-intersection analysis of OTU membership among NH, MH, NC, and MC after within-group prevalence filtering; the upper panel shows the four-set overlap diagram, and the lower panel shows the corresponding UpSet summary of intersection size and set size. In the analysis workflow, OTU presence within a condition was defined as detection in at least two biological replicates with a per-sample count ≥ 1. This panel is descriptive and should not be interpreted as formal differential-abundance inference. (C) Heatmap of the 50 most abundant genera based on log10-transformed relative abundance, with hierarchical clustering applied to both samples and genera. The side annotation indicates condition group, and the upper annotation indicates phylum affiliation of the displayed genera. NH, non-flooded S. glauca; MH, flooded S. glauca; NC, non-flooded T. chinensis; MC, flooded T. chinensis.
Plants 15 02565 g004
Figure 5. Host-dependent responses of predicted rhizosphere functional potential to flooding. PICRUSt2-based KEGG level 3 pathway profiles were compared between flooded and non-flooded rhizosphere bacterial communities associated with (A) S. glauca (MH vs. NH) and (B) T. chinensis (MC vs. NC). In each panel, the left subpanel shows the mean relative abundance (%) of each pathway in the two groups, the middle subpanel shows the difference between group means with 95% confidence intervals, and the right subpanel shows the multiple-testing-adjusted p values. The vertical dashed line indicates no difference between groups.
Plants 15 02565 g005
Figure 6. Treatment-specific microbial consensus association networks inferred at the genus level for rhizosphere bacterial communities under contrasting flooding regimes. Panels (AD) show phylum-coloured consensus display networks for NH, non-flooded Suaeda glauca; MH, flooded S. glauca; NC, non-flooded Tamarix chinensis; and MC, flooded T. chinensis, respectively. Panels (EH) show the corresponding Louvain module-coloured networks using the same layouts. Edge evidence classes are indicated by line style: solid lines denote FDR-supported associations (Benjamini–Hochberg FDR < 0.05) passing the consensus filter (Pearson |r| ≥ 0.65, Spearman sign concordance, leave-one-out sign consistency ≥ 0.60); dashed lines denote display-layer edges meeting the |r| ≥ 0.65 and sign-consistency thresholds but not surviving FDR correction; and dotted lines denote context-only taxon pairs below the display threshold. Faint grey halo nodes represent context-only taxa with degree zero in the inferred network.
Plants 15 02565 g006
Figure 7. Random forest and LEfSe identification of plant–habitat-associated rhizosphere bacterial signatures. (A) Group-associated relative-abundance patterns of the top 20 genus-level discriminative taxa from the RF/non-parametric workflow. Asterisks indicate significant group differences after Benjamini–Hochberg correction (adjusted p < 0.05). A two-segment abundance axis is used only to display low- and high-abundance ranges and does not alter the underlying abundance or statistical results. (B) Feature-importance ranking of the top 30 genus-level taxa by MeanDecreaseGini; colours denote the associated plant–habitat group. (C) All-rank LEfSe taxonomic cladogram restricted to features with LDA > 4.0. Coloured nodes and sectors indicate group-associated lineages, while higher taxonomic ranks are labelled directly and lower ranks are linked to the letter-coded two-column legend. NH, non-flooded S. glauca; MH, flooded S. glauca; NC, non-flooded T. chinensis; MC, flooded T. chinensis.
Plants 15 02565 g007
Figure 8. Phylogenetic analysis of rhizosphere bacterial communities across different plant species and flooding conditions. The circular phylogenetic tree displays the evolutionary relationships among the top 500 OTUs identified across all the sampling sites.
Plants 15 02565 g008
Disclaimer/Publisher’s Note: The statements, opinions and data contained in all publications are solely those of the individual author(s) and contributor(s) and not of MDPI and/or the editor(s). MDPI and/or the editor(s) disclaim responsibility for any injury to people or property resulting from any ideas, methods, instructions or products referred to in the content.