3.1. Implementation Details
BCAR-Net is implemented in PyTorch 1.10.2 and trained on a single NVIDIA RTX 5090 GPU with 32 GB of memory. Training uses the Adam optimizer with an initial learning rate of
and a weight decay of
. The learning rate is decayed by a factor of 0.5 every 100 epochs starting from epoch 200. For bounding-box-guided density supervision, the Gaussian box-density target was used in all main experiments. The batch size is set to 8, and the model is trained for 400 epochs in total, including 50 epochs for the reconstruction-oriented first stage and 350 epochs for the counting-oriented second stage. The input crop size used during training is
. The two-stage training scheme described in
Section 2.2.4 was followed throughout. During the second stage, the auxiliary reconstruction loss weight was controlled by
: it was set to 1.0 before epoch 300, linearly reduced to 0.1 from epoch 300 to epoch 400, and then kept at 0.1 for the remaining epochs.
For the loss configuration, the main counting loss weight is set to . In the counting objective, the density map loss and count consistency loss are weighted by and , respectively. In the auxiliary objectives, the RGB reconstruction, depth reconstruction, and feature consistency terms are weighted by , , and , respectively. During the first training stage, a weak counting regularization term is retained with . For depth reconstruction, the SSIM and gradient consistency terms are weighted by and .
3.3. Comparative Experiments
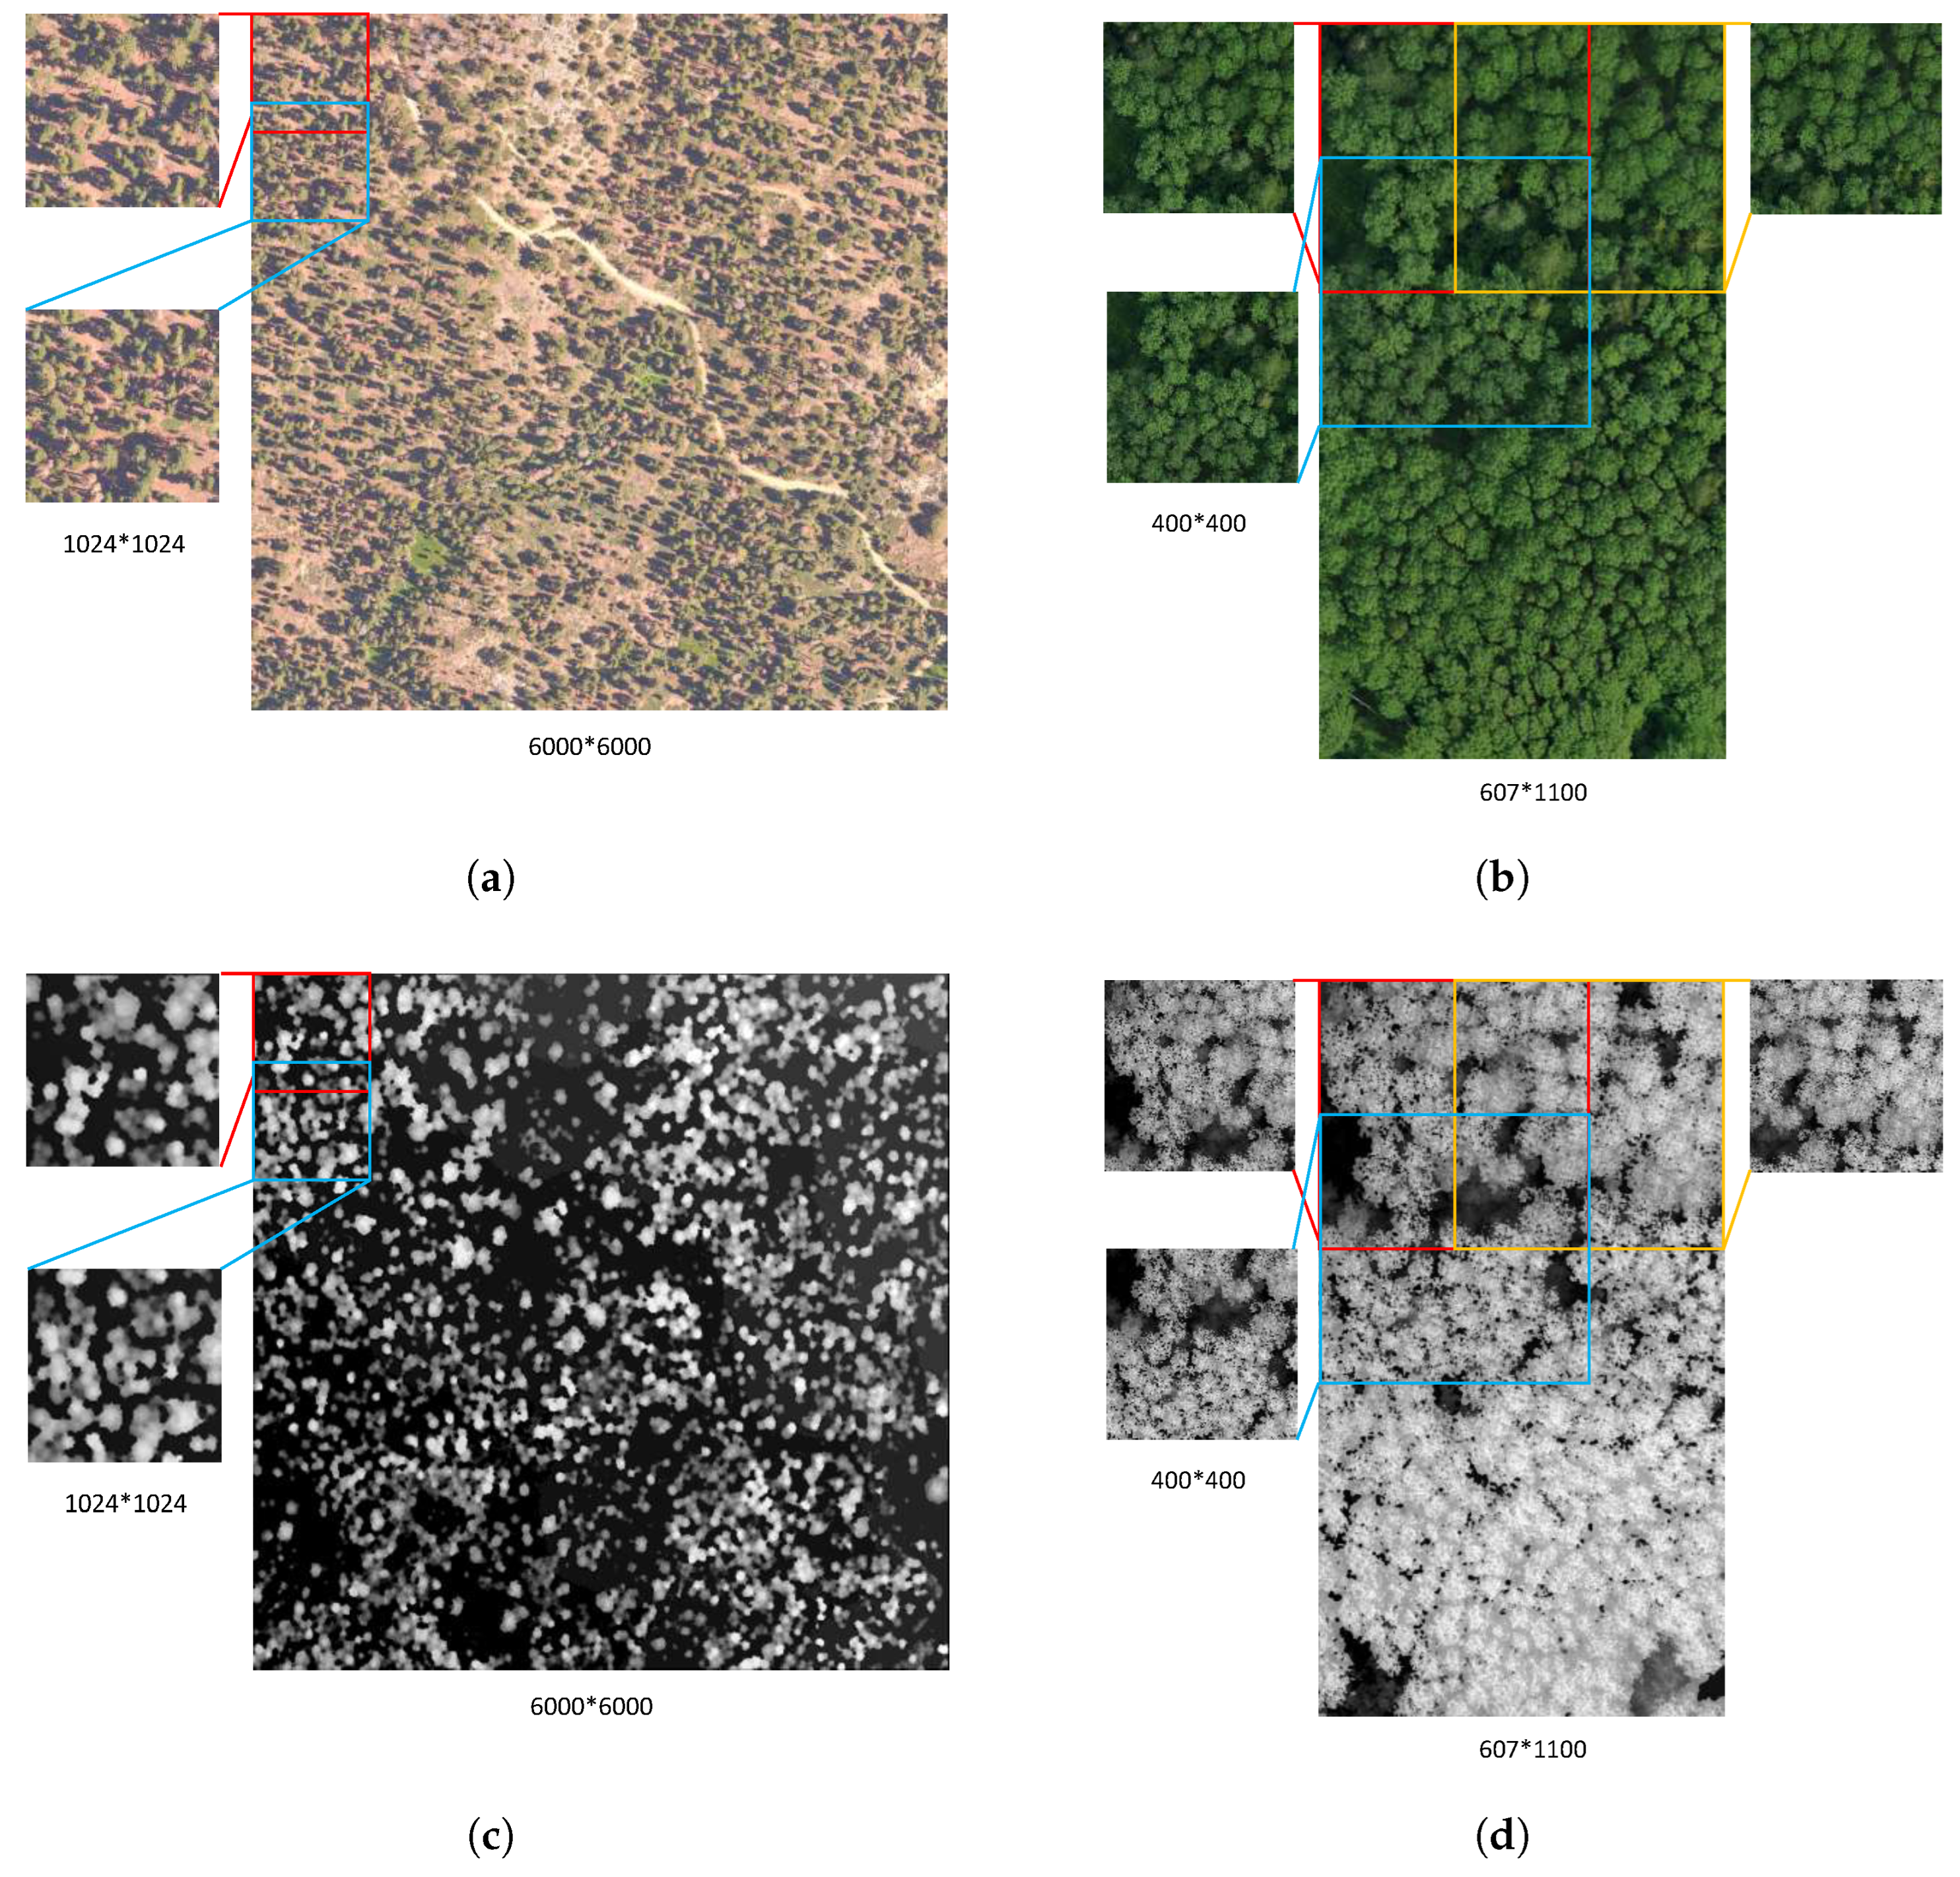
To assess the overall effectiveness of BCAR-Net, we conduct two test experiments under different evaluation settings. In the first experiment, the model is trained on the NEON training set and evaluated on the NEON test set. In the second experiment, the model trained on the NEON training set is further fine-tuned on the UAV training set and then evaluated on the UAV test set. The compared methods cover several different design paradigms, including generic CNN-based backbones, stronger counting-oriented baselines, and the broker modality baseline BM. Specifically, SENet50 is based on channel-wise feature recalibration [
53], ResNet50 is a standard residual CNN backbone [
54], STEERER is designed to address scale variation in counting and localization [
55], APGCC improves point-based counting by stabilizing proposal–target matching with auxiliary point guidance [
56], P2RLoss introduces point-to-region supervision for point-based crowd counting [
57], and BM is the most relevant multimodal baseline [
44]. This comparison is intended to examine not only whether multimodal learning is beneficial but also whether the proposed RGB–D formulation is more suitable for tree counting than both unimodal counters and the original broker-style design.
A notable difference between BCAR-Net and several compared counting baselines lies in the supervision form. Some existing methods are primarily designed for point-style supervision [
56,
57], where each object is represented by a single annotated location. Such supervision is efficient and well suited to standard counting settings, but it provides limited information about the object extent. By contrast, BCAR-Net adopts bounding-box-guided density supervision, which preserves the density-regression formulation while introducing additional spatial cues about the canopy extent.
Experimental results on NEONTreeEvaluation dataset. The overall quantitative comparison on the NEON test set is summarized in
Table 4. BCAR-Net achieves the best performance, reaching an MAE of 7.92, an RMSE of 14.20, and an
of 0.8684. These results indicate that the proposed framework yields not only a lower counting error but also a better regression fit than the competing methods.
Within the RGB-only group, SENet50 and ResNet50 provide standard convolutional feature extraction, but their performance remains limited in cluttered forest scenes, suggesting that generic backbone enhancement alone is insufficient for reliable tree counting under canopy overlap and heterogeneous backgrounds. In addition to density-regression baselines, a YOLO-based detector was included as a detection-based counting baseline using RGB input, and its predicted count was obtained by counting the detected crown boxes after post-processing. As reported in
Table 4, YOLO outperforms SENet50, ResNet50, and STEERER under RGB-only input, confirming that the original bounding-box annotations are useful for direct crown detection. Its counting error nevertheless remains higher than that of BCAR-Net, indicating that multimodal density regression keeps a clear advantage for count estimation when RGB texture and height-related structural information are jointly used. In the depth-only group, STEERER gives the strongest unimodal performance, indicating that geometric cues are particularly informative for the NEON scenes. Even so, BCAR-Net further reduces the MAE from 11.21 to 7.92 and RMSE from 22.67 to 14.20, showing that multimodal fusion still provides clear gains beyond depth alone.
The most important multimodal comparison is with BM in the RGB+Depth category. As shown in
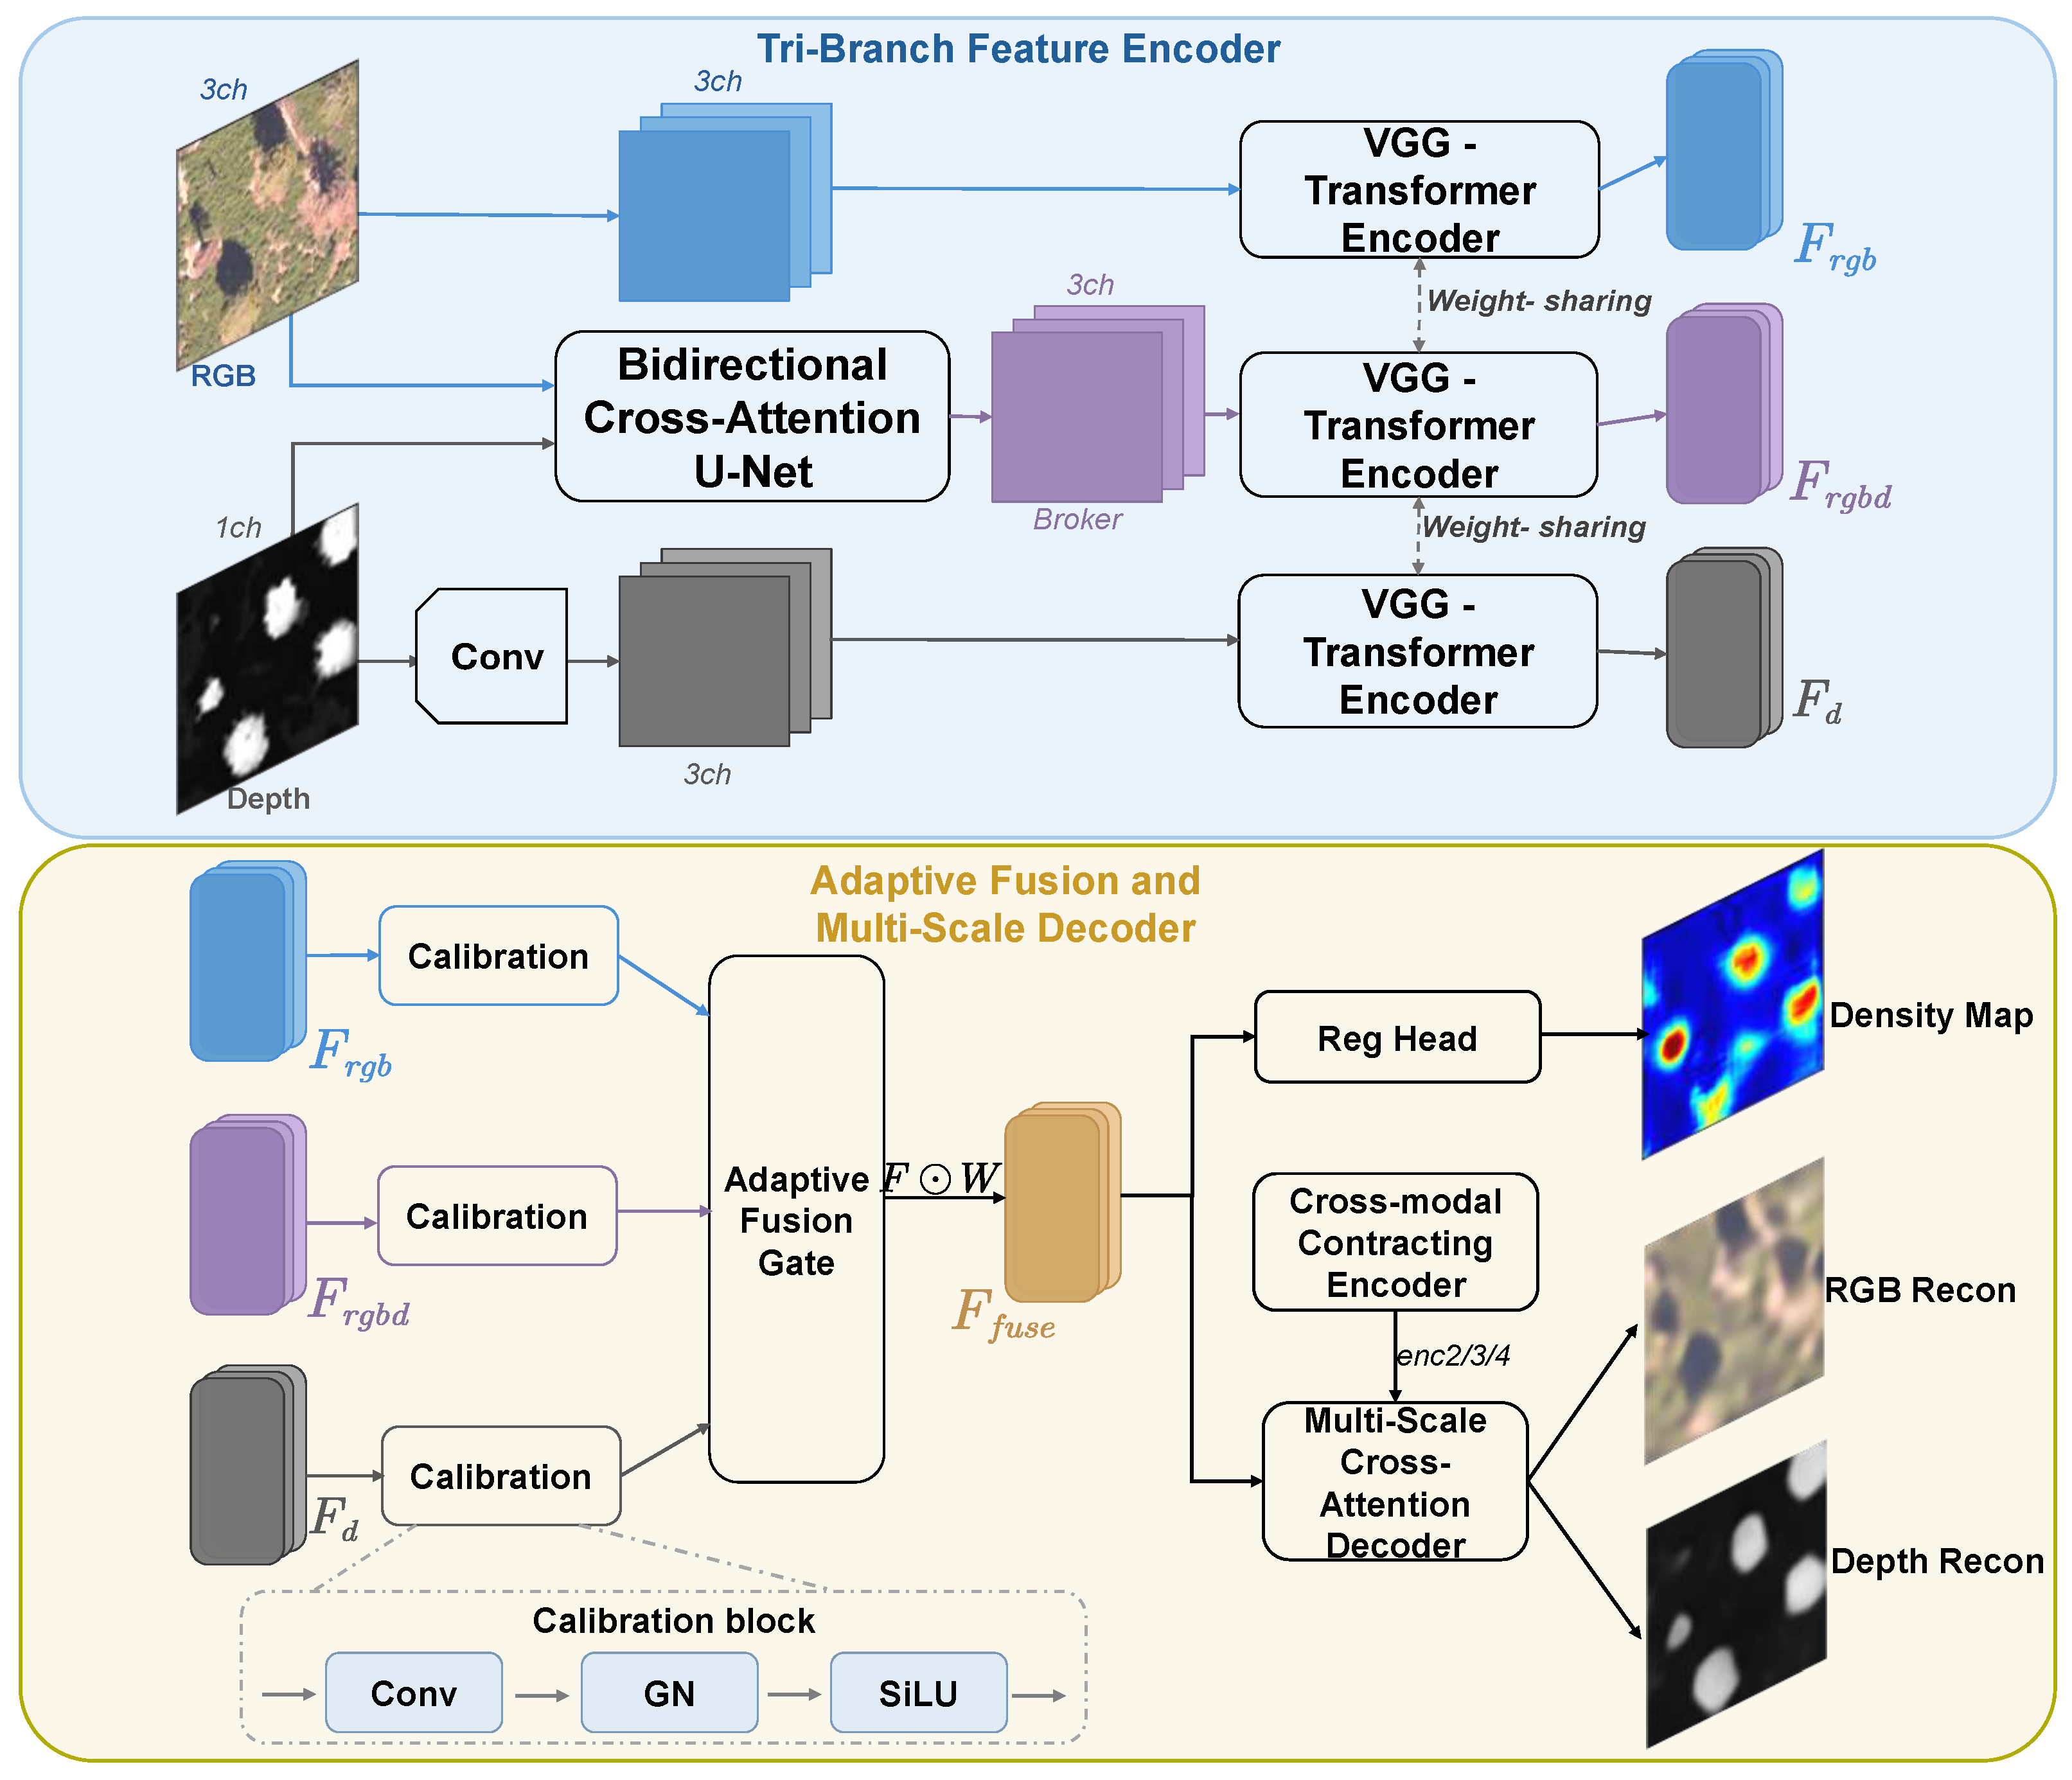
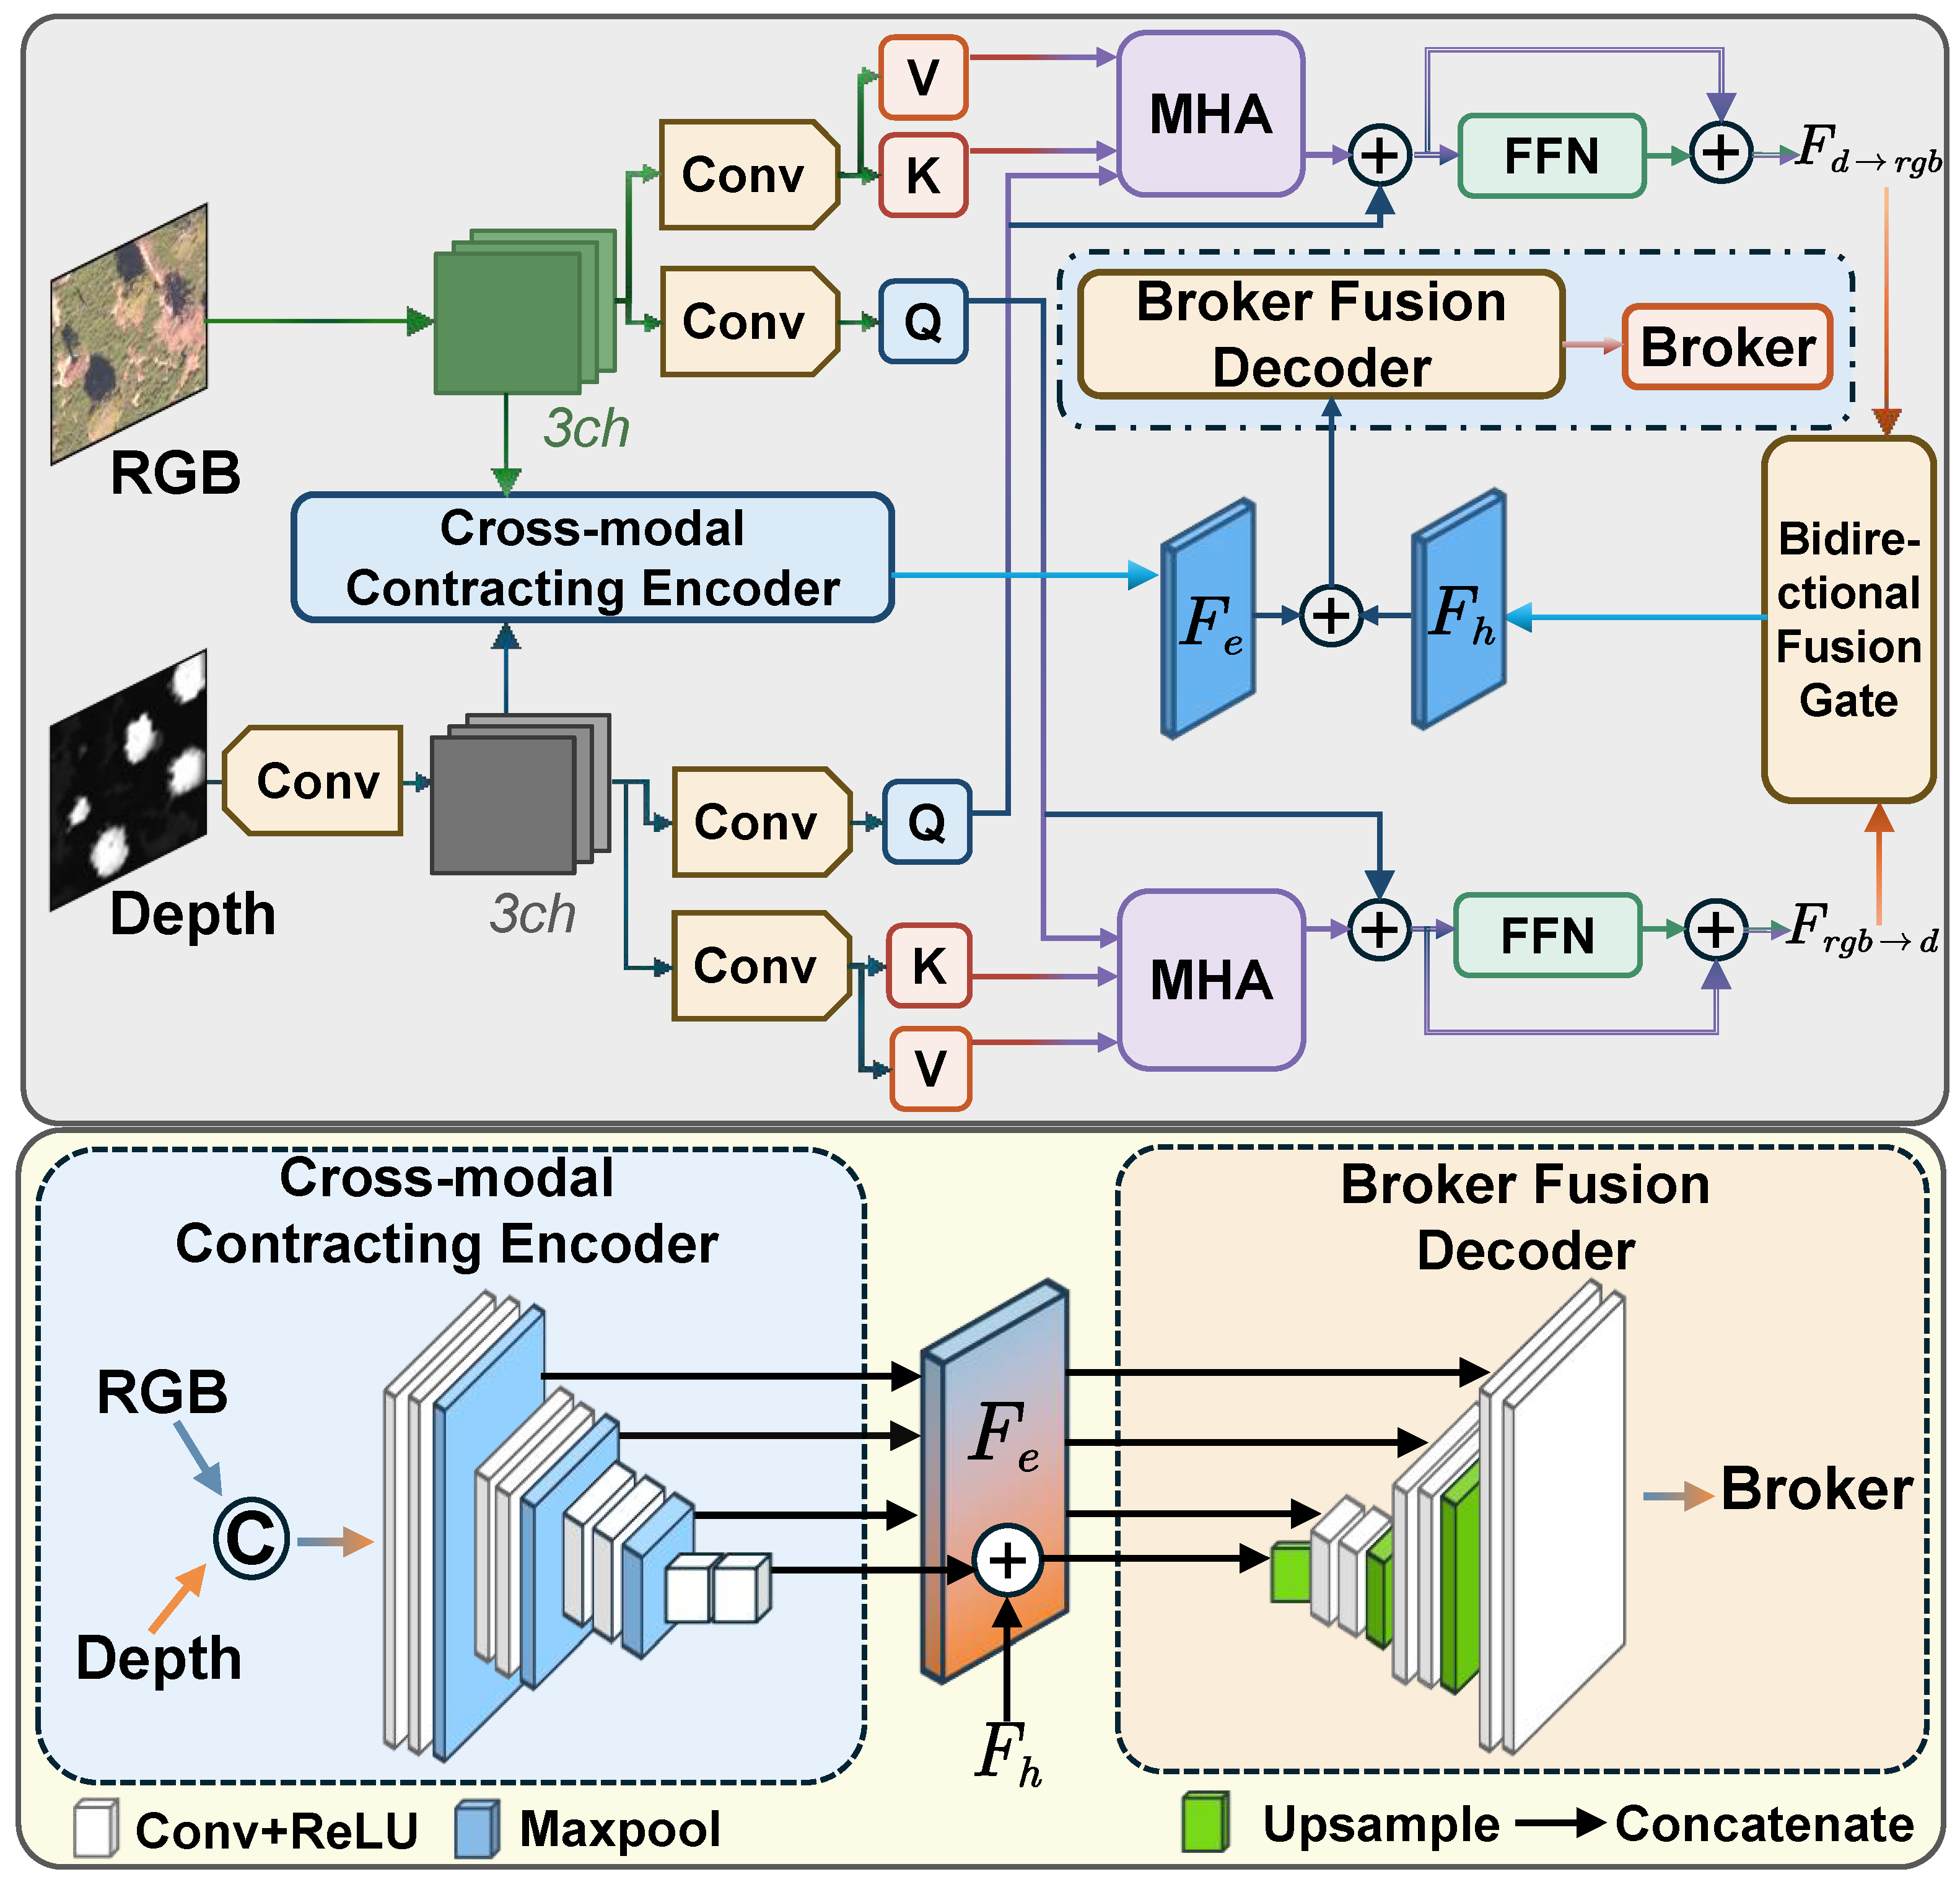
Table 4, BM also benefits from multimodal input, but its performance remains clearly inferior to that of BCAR-Net. This gap suggests that directly transferring the original broker modality formulation to RGB–D tree counting is not sufficient. In our case, the gain appears to come from several coordinated modifications, including bidirectional cross-attention in the broker generation stage, explicit tri-branch encoding of RGB, Depth, and broker RGB–D features, adaptive spatial gating during branch fusion, and a reconstruction-oriented staged training strategy.
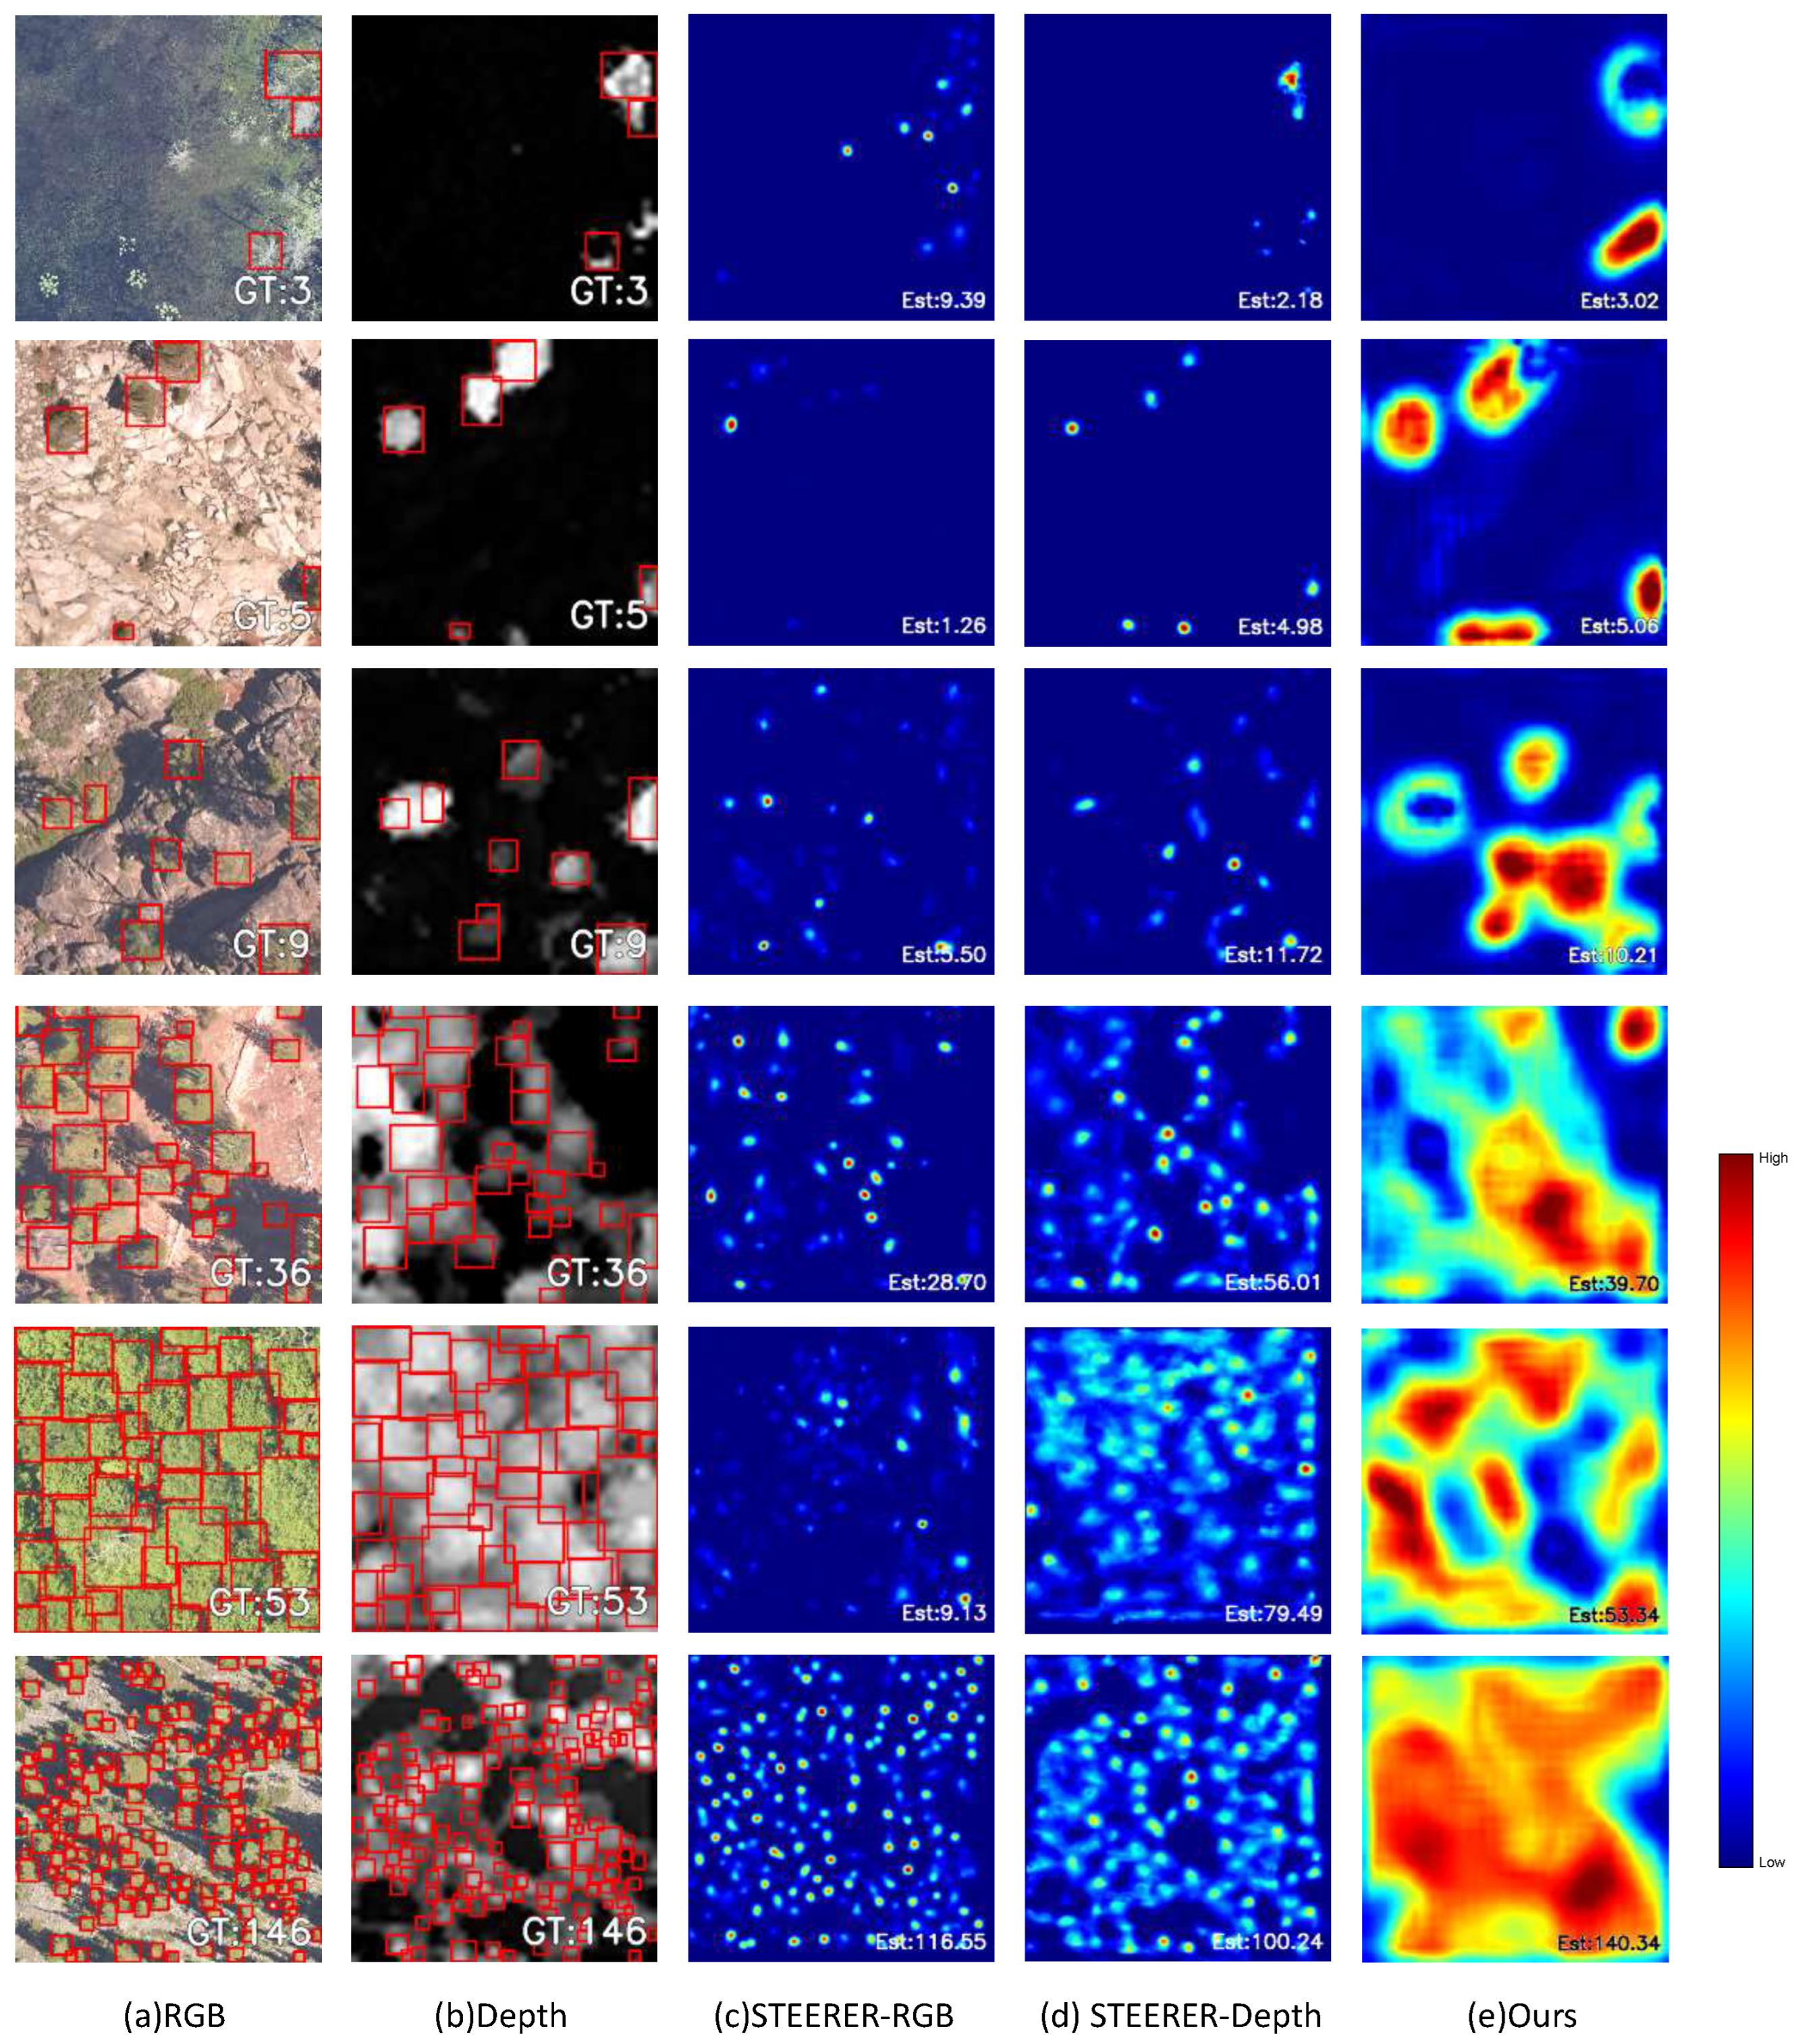
Furthermore, qualitative results on the NEON test set are presented in
Figure 5 to further illustrate the behavior of BCAR-Net under different forest conditions. The selected examples span a range of canopy densities and scene complexities, providing an intuitive complement to the quantitative results. Compared with the single-modality baselines STEERER-RGB and STEERER-Depth, BCAR-Net produces density maps whose spatial distribution is better aligned with the true canopy layout, and its predicted counts stay closer to the ground truth in both sparse and dense scenes.
Experimental results on UAV dataset. To further examine the behavior of BCAR-Net under a different acquisition setting, the model trained on the NEON training set is further fine-tuned on the UAV training set and then evaluated on the UAV test set. The quantitative comparison is reported in
Table 5. To account for the small size of the UAV dataset, the compared methods were independently repeated multiple times, and the results are reported as the mean ± standard deviation. BCAR-Net achieves the best average performance, with an MAE of 11.56 ± 0.32, an RMSE of 14.70 ± 0.33, and an
of 0.7360 ± 0.0127. Compared with P2RLoss-Depth, BCAR-Net obtains a lower average MAE and RMSE and a higher average
, although the improvement is relatively modest and should be interpreted cautiously given the small test set.
A notable trend on the UAV test set is that the depth-based baselines are stronger than the RGB-only baseline. STEERER-RGB shows large variability and a negative average , whereas STEERER-Depth achieves lower average counting errors and a higher average . P2RLoss-Depth further improves over STEERER-Depth, indicating that structural cues from the depth-related modality are especially informative under the UAV setting. BCAR-Net achieves the best average results among the compared methods, suggesting that multimodal fusion can further refine geometric cues with complementary appearance information after adaptation to the UAV data. However, given the limited number of UAV samples and the modest margin over P2RLoss-Depth, this experiment should be interpreted as a small-scale supplementary evaluation rather than as conclusive evidence of broad cross-platform generalization.
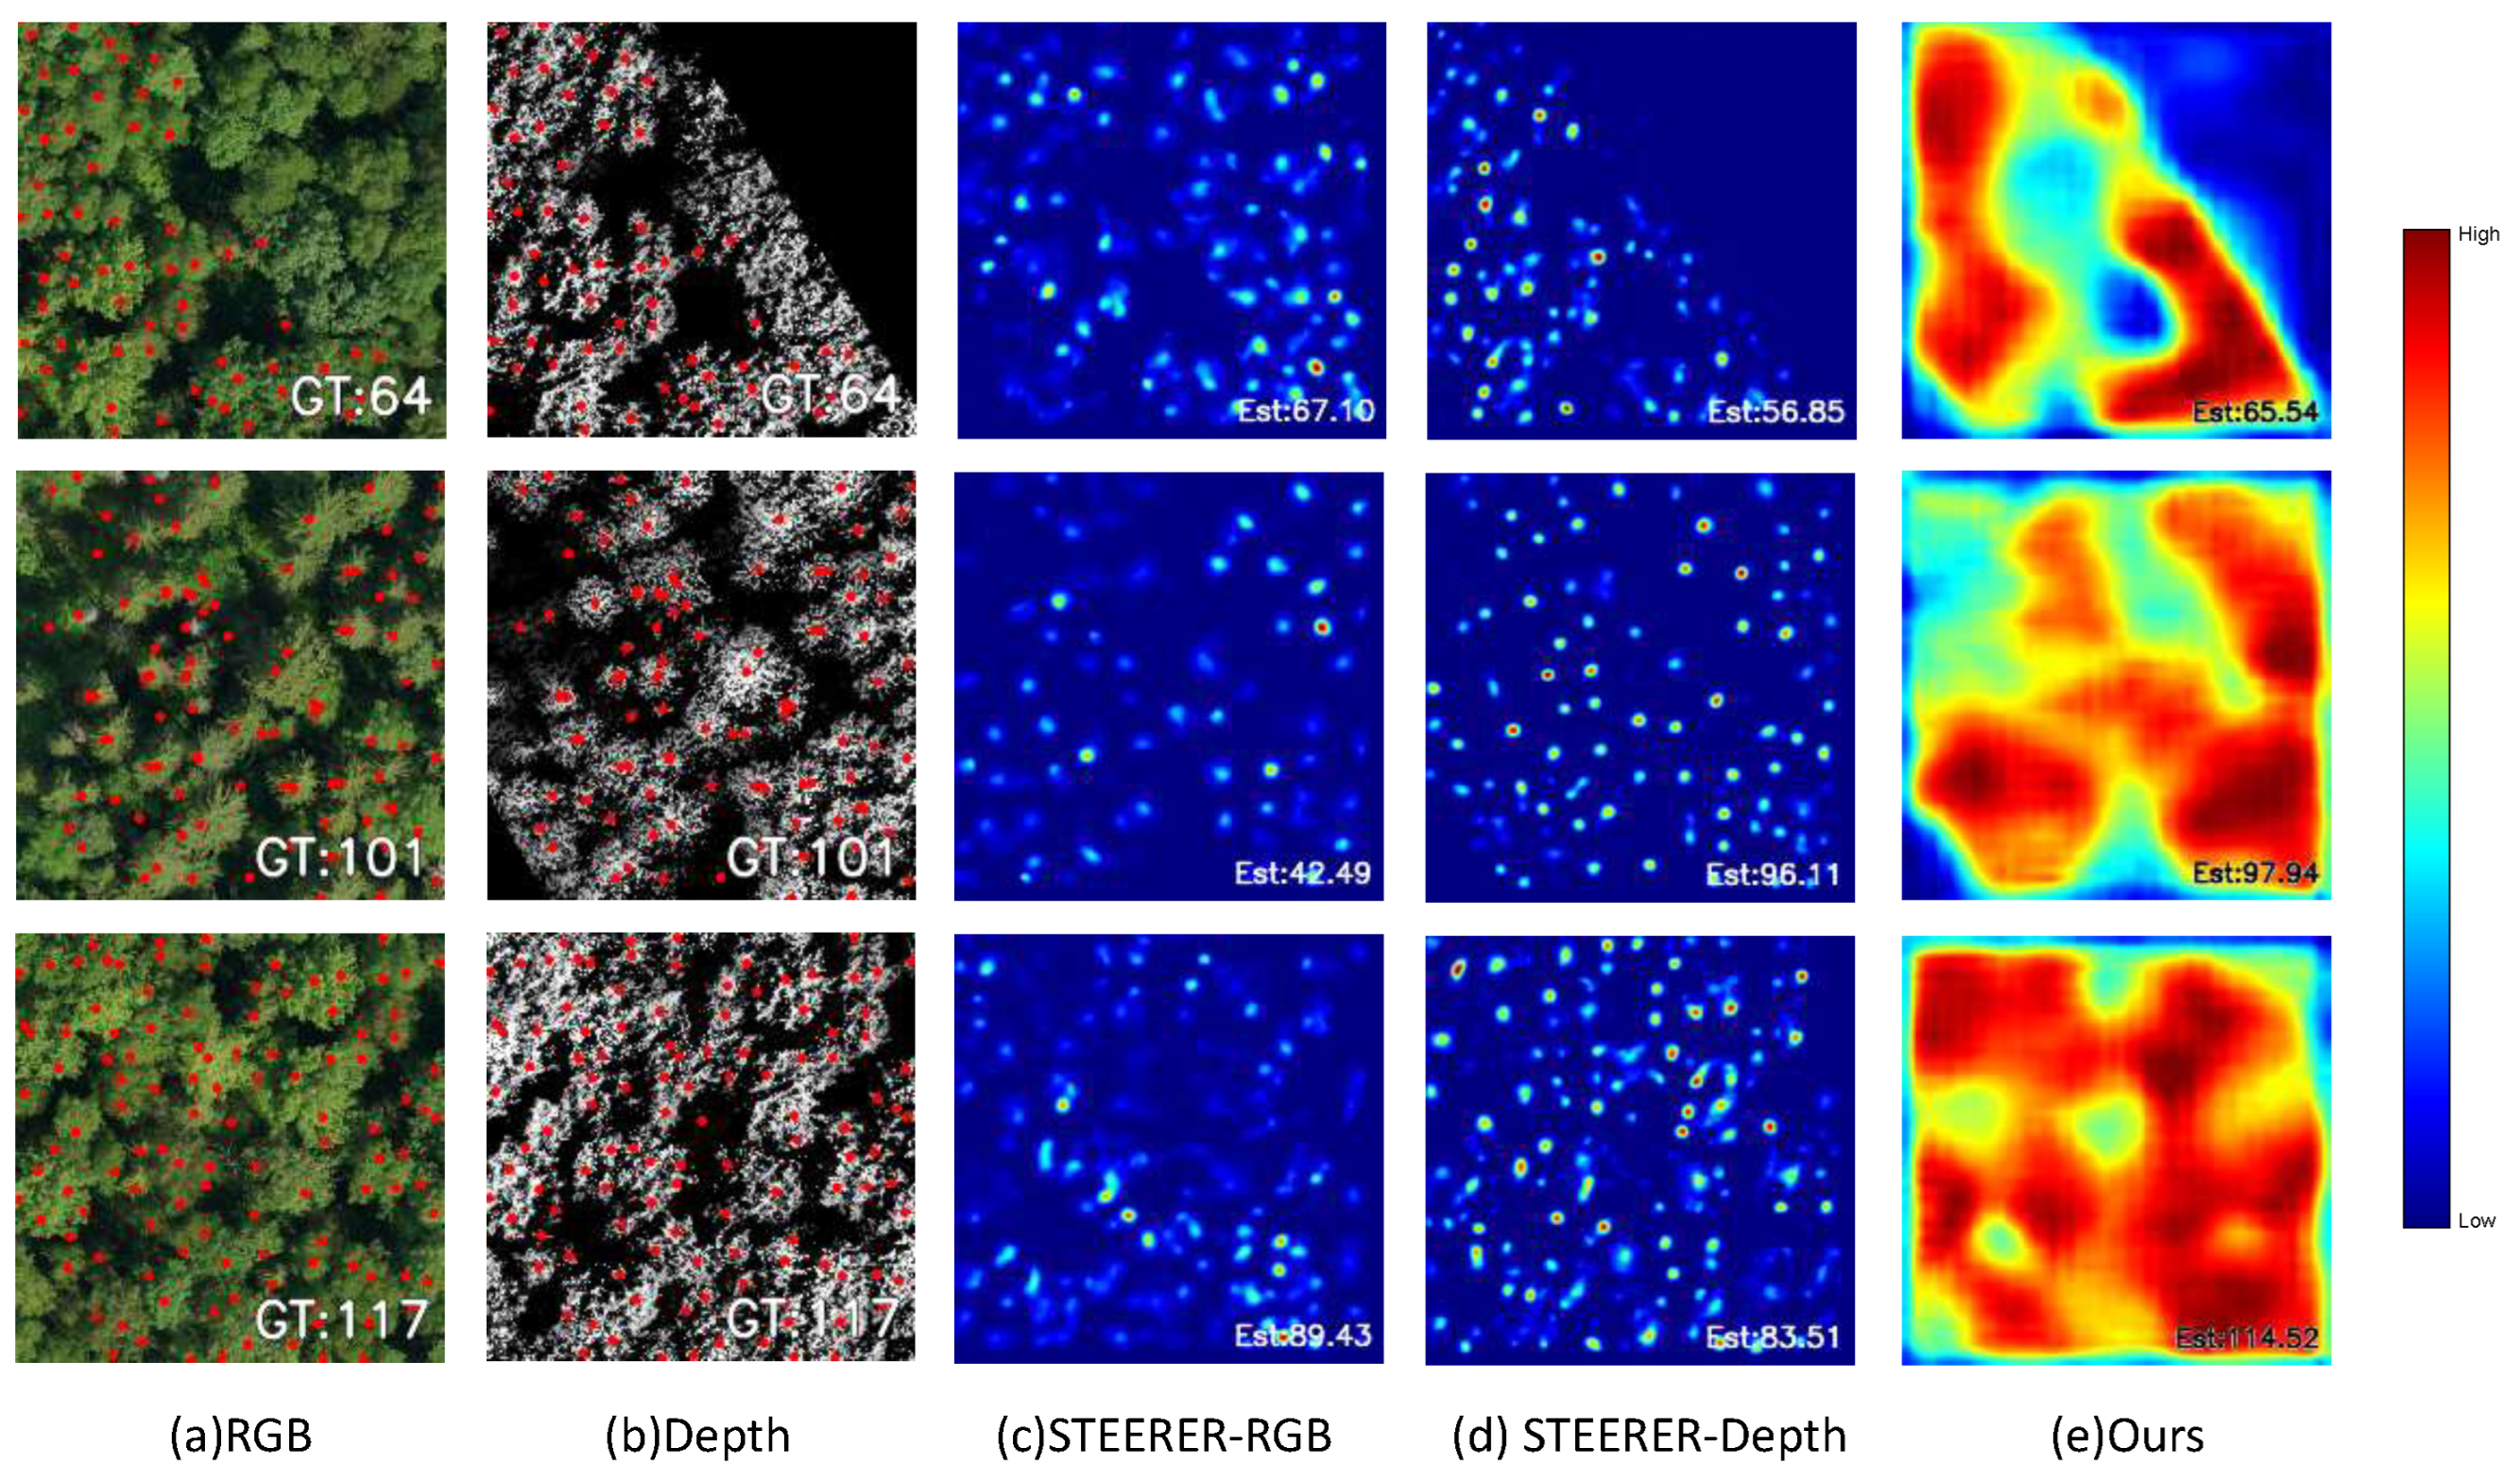
The UAV qualitative results are shown in
Figure 6. Compared with the RGB-only and depth-only baselines, BCAR-Net produces more coherent density responses over tree-populated regions and gives predicted counts that are generally closer to the ground truth. These visual examples are used as qualitative illustrations, while the quantitative comparison is based on the full UAV test set in
Table 5.
Overall, the two test experiments support two observations. First, multimodal learning is more effective than relying on a single modality alone in the evaluated settings, although the relative contribution of RGB and depth differs across datasets. Second, after adaptation to the UAV training data, BCAR-Net still benefits from the coordinated design of broker generation, tri-branch adaptive fusion, reconstruction-oriented training, and bounding-box-guided density supervision. Nevertheless, because the UAV dataset contains only a limited number of training and testing patches, the UAV results should be regarded as supplementary evidence of applicability under a different acquisition condition rather than a definitive demonstration of broad operational generalization.
3.4. Systematic Error Analysis
The visual examples in
Figure 5 and
Figure 6 are used only as qualitative illustrations. To provide a more systematic view of model behavior, we further grouped the NEONTreeEvaluation test samples by tree density, crown size, canopy closure, and site identity. Tree density was defined as the ground-truth tree count of each patch. Crown size was estimated by the average normalized area of annotated crown bounding boxes in each patch. Canopy closure was approximated by the proportion of valid depth pixels whose normalized height response was larger than 0.5. Therefore, this canopy-closure value should be interpreted as a height-map-based proxy rather than a field-measured canopy-closure variable. For tree density, crown size, and canopy closure, the samples were divided into low, medium, and high groups using tertiles computed on the test set.
For each group, the MAE, RMSE,
, and mean bias were reported. The bias is defined as
where
and
denote the predicted and ground-truth counts of sample
i, respectively. Positive bias indicates over-counting, while negative bias indicates under-counting.
Several patterns can be observed from
Table 6. Among the analyzed factors, tree density shows one of the clearest error trends. The counting error increases substantially from low- and medium-density patches to high-density patches, where the MAE and RMSE reach 17.19 and 23.15, respectively. The negative bias of −9.21 further indicates that errors in dense patches are dominated by under-counting. This result suggests that dense crowns and overlapping canopy structures remain a primary failure mode for density map regression in complex forest scenes.
Crown size provides a related explanation for this behavior. Samples dominated by smaller annotated crowns produce larger errors, possibly because small crowns have weaker spatial support and are more easily confused with background texture or neighboring crowns in aerial imagery. In contrast, patches with larger average crown boxes have lower absolute errors. The negative in the large-crown group should be interpreted cautiously, since the within-group variation of ground-truth counts is relatively limited and can make unstable.
Canopy closure shows a similarly important error pattern. Low- and medium-closure patches have relatively small errors, whereas high-closure patches show a marked increase in the MAE and RMSE, reaching 17.17 and 23.50, respectively. The negative bias of −6.17 indicates that closed-canopy conditions also mainly lead to under-counting. This is likely because closed-canopy areas often contain visually connected neighboring crowns, while height discontinuities in the depth map may become less distinct. These conditions make individual crown contributions harder to separate and identify high-canopy-closure patches as another key limitation of the current model.
Site-level results further indicate that the performance is affected by local scene characteristics. The model performs well on SJER and TEAK, while larger errors are observed on NIWO and the merged group of other sites. Such variation may be related to differences in forest structure, crown morphology, illumination conditions, and depth-map quality. Overall, this grouped analysis provides a more systematic complement to the selected qualitative examples and clarifies where the current model is more likely to fail.
3.5. Ablation Studies
The ablation study was designed to evaluate whether each architectural component contributes to the final counting performance. Starting from an RGB-only baseline, depth information, broker-based cross-modal interaction, adaptive fusion, auxiliary reconstruction, and the two-stage training strategy were added progressively. This incremental evaluation helps distinguish the effect of the additional height modality from the effect of the proposed fusion and reconstruction mechanisms. To better understand where the performance gains come from, we analyze BCAR-Net according to the four main components introduced in the Introduction and Methods:
Broker generation via a bidirectional cross-attention U-Net. We first examine whether the gain mainly comes from multimodal input itself or from the intermediate broker RGB–D representation. The corresponding results are listed in
Table 7. Both single-modality settings perform worse than multimodal learning on the NEONTreeEvaluation test set. Depth alone achieves a lower MAE than RGB alone, while RGB obtains a slightly higher
, suggesting that the two modalities provide different but complementary cues. Directly concatenating RGB and depth already produces a clear improvement over either single modality, confirming the importance of incorporating canopy-height information. Compared with simple RGB–D concatenation, the proposed RGB–D design further reduces the average MAE from 8.87 to 8.18 and the average RMSE from 15.79 to 14.52, while increasing the average
from 0.8289 to 0.8624. Given the standard deviations, this improvement should be read as a consistent but relatively modest gain over direct concatenation. The largest gain therefore comes from introducing the height modality, while the broker generation design further refines RGB–Depth interaction by organizing the two modalities into an intermediate cross-modal representation.
We further evaluate the role of bidirectional cross-attention inside BCA-UNet. As shown in
Table 8, removing the U-Net cross-attention or replacing it with a single-direction attention variant degrades the performance compared with the full model. Removing cross-attention increases the MAE from 7.92 to 8.38, while the single-direction variant further increases the MAE to 8.72. These results indicate that cross-modal interaction inside BCA-UNet is necessary and that the RGB–Depth relationship should not be modeled as a one-way information transfer. The bidirectional design enables more balanced interaction between appearance and geometric cues during broker generation.
Tri-branch adaptive fusion. We next evaluate the tri-branch adaptive fusion design, including the shared VGG–ViT branch encoder, the broker branch, and the spatial fusion gate. Since the three branches are built upon a shared VGG–ViT backbone, we first investigate how much Transformer capacity is needed. The results in
Table 9 show that introducing a lightweight Transformer encoder is beneficial, but increasing its depth beyond one layer becomes counterproductive. Compared with the CNN-only setting, one Transformer layer reduces the MAE from 9.11 to 7.92 and RMSE from 16.25 to 14.20. This indicates that moderate contextual modeling helps tree counting, while deeper Transformer stacks may introduce unnecessary optimization difficulty for the current dataset scale.
The structural contribution of tri-branch adaptive fusion is further analyzed in
Table 10. Disabling the spatial fusion gate causes a clear performance drop, increasing the MAE to 9.21 and the RMSE to 16.31. This indicates that fixed or less adaptive fusion is insufficient for handling spatially varying modality reliability. Removing the broker RGB–D branch also degrades performance, with the MAE increasing to 8.23 and the RMSE increasing to 14.40. Although this degradation is smaller than that caused by removing the fusion gate, it still shows that the broker representation contributes useful cross-modal information to the tri-branch fusion framework.
Multi-scale cross-attention reconstruction and two-stage training. We then examine the reconstruction module and the staged optimization strategy. First, we evaluate the cross-attention design in the reconstruction decoder. The results in
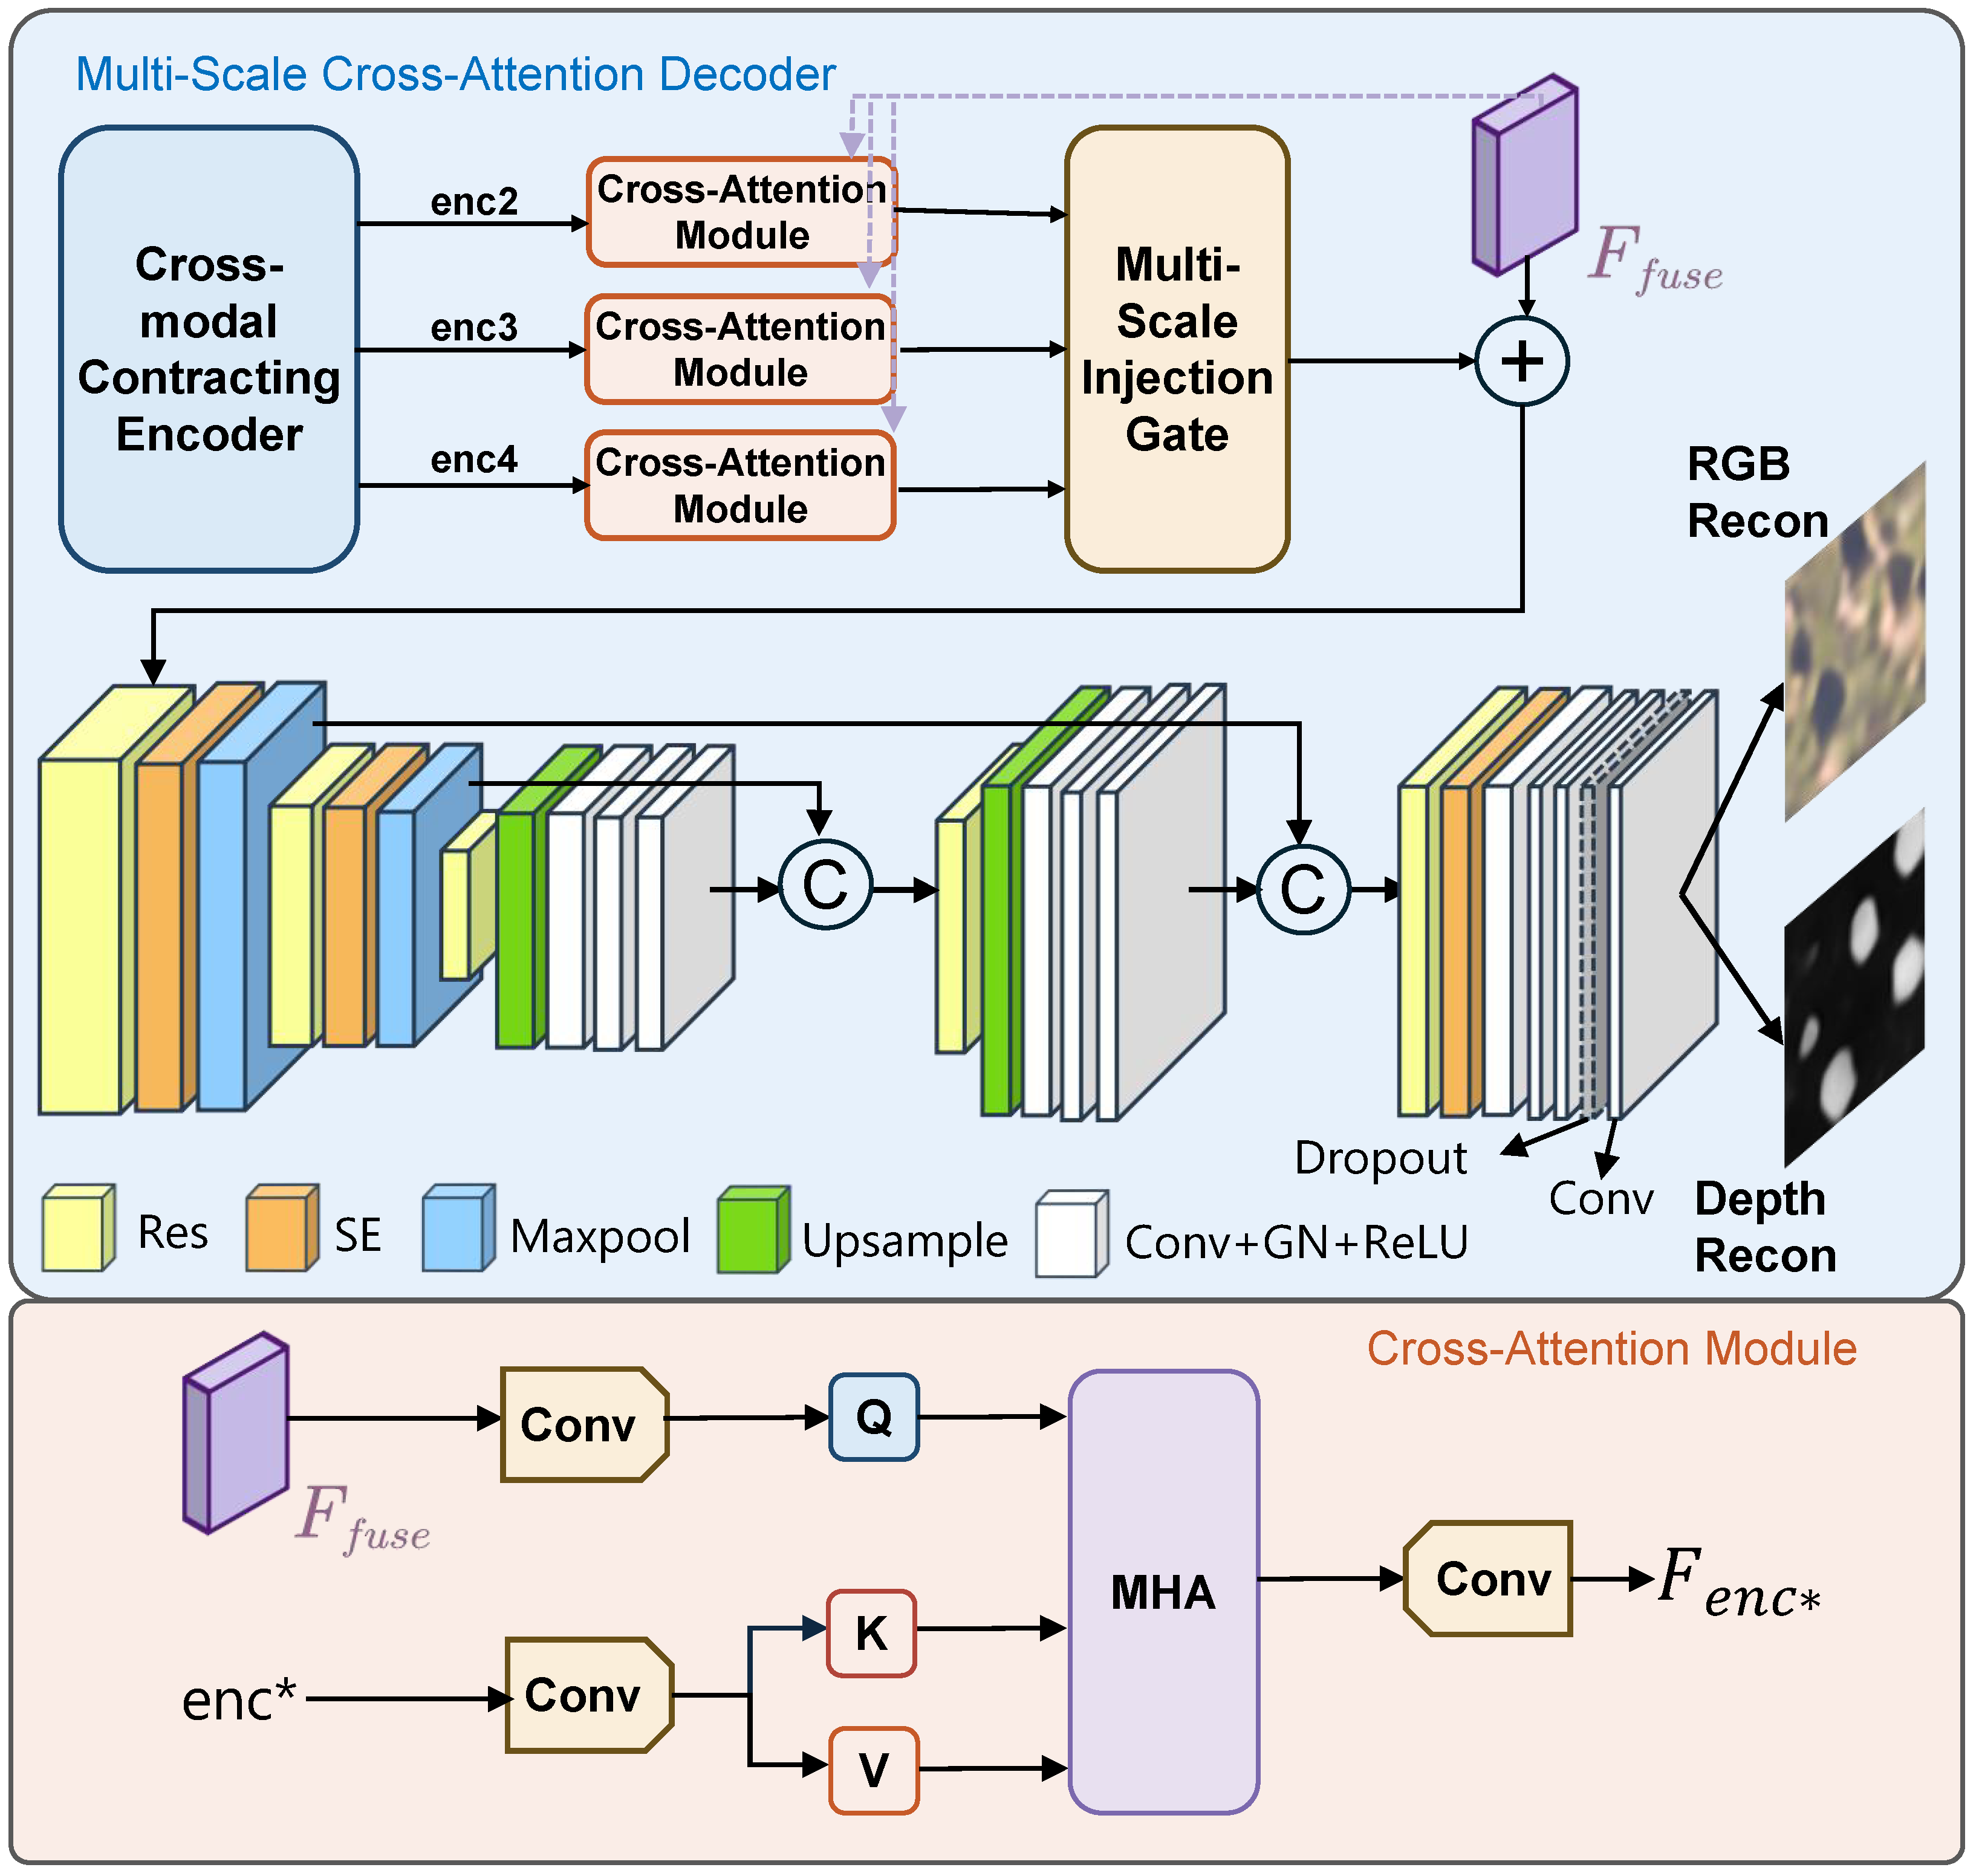
Table 11 show that removing decoder-side cross-attention increases the MAE from 7.92 to 9.28 and the RMSE from 14.20 to 16.12. This clear degradation suggests that the reconstruction branch benefits from selectively injecting intermediate BCA-UNet encoder features, rather than decoding only from the fused latent feature.
The influence of auxiliary reconstruction supervision is summarized in
Table 12. Removing all reconstruction losses degrades the model, confirming that reconstruction acts as an effective regularizer for multimodal fusion learning. Among the two reconstruction branches, removing depth reconstruction causes a larger performance drop than removing RGB reconstruction, which suggests that geometry-aware reconstruction is especially important for stabilizing the fused representation in tree counting. At the same time, removing RGB reconstruction is also harmful, indicating that appearance recovery still contributes to the learned representation. The feature consistency term contributes a smaller but still measurable amount. Removing it raises the MAE from 7.92 to 8.20, raises the RMSE from 14.20 to 15.07, and lowers
from 0.8684 to 0.8517, showing that weak task-level consistency between RGB and depth features helps stabilize multimodal fusion. Because its effect is smaller than that of the reconstruction losses, this term acts as a regularizer rather than the main source of performance improvement.
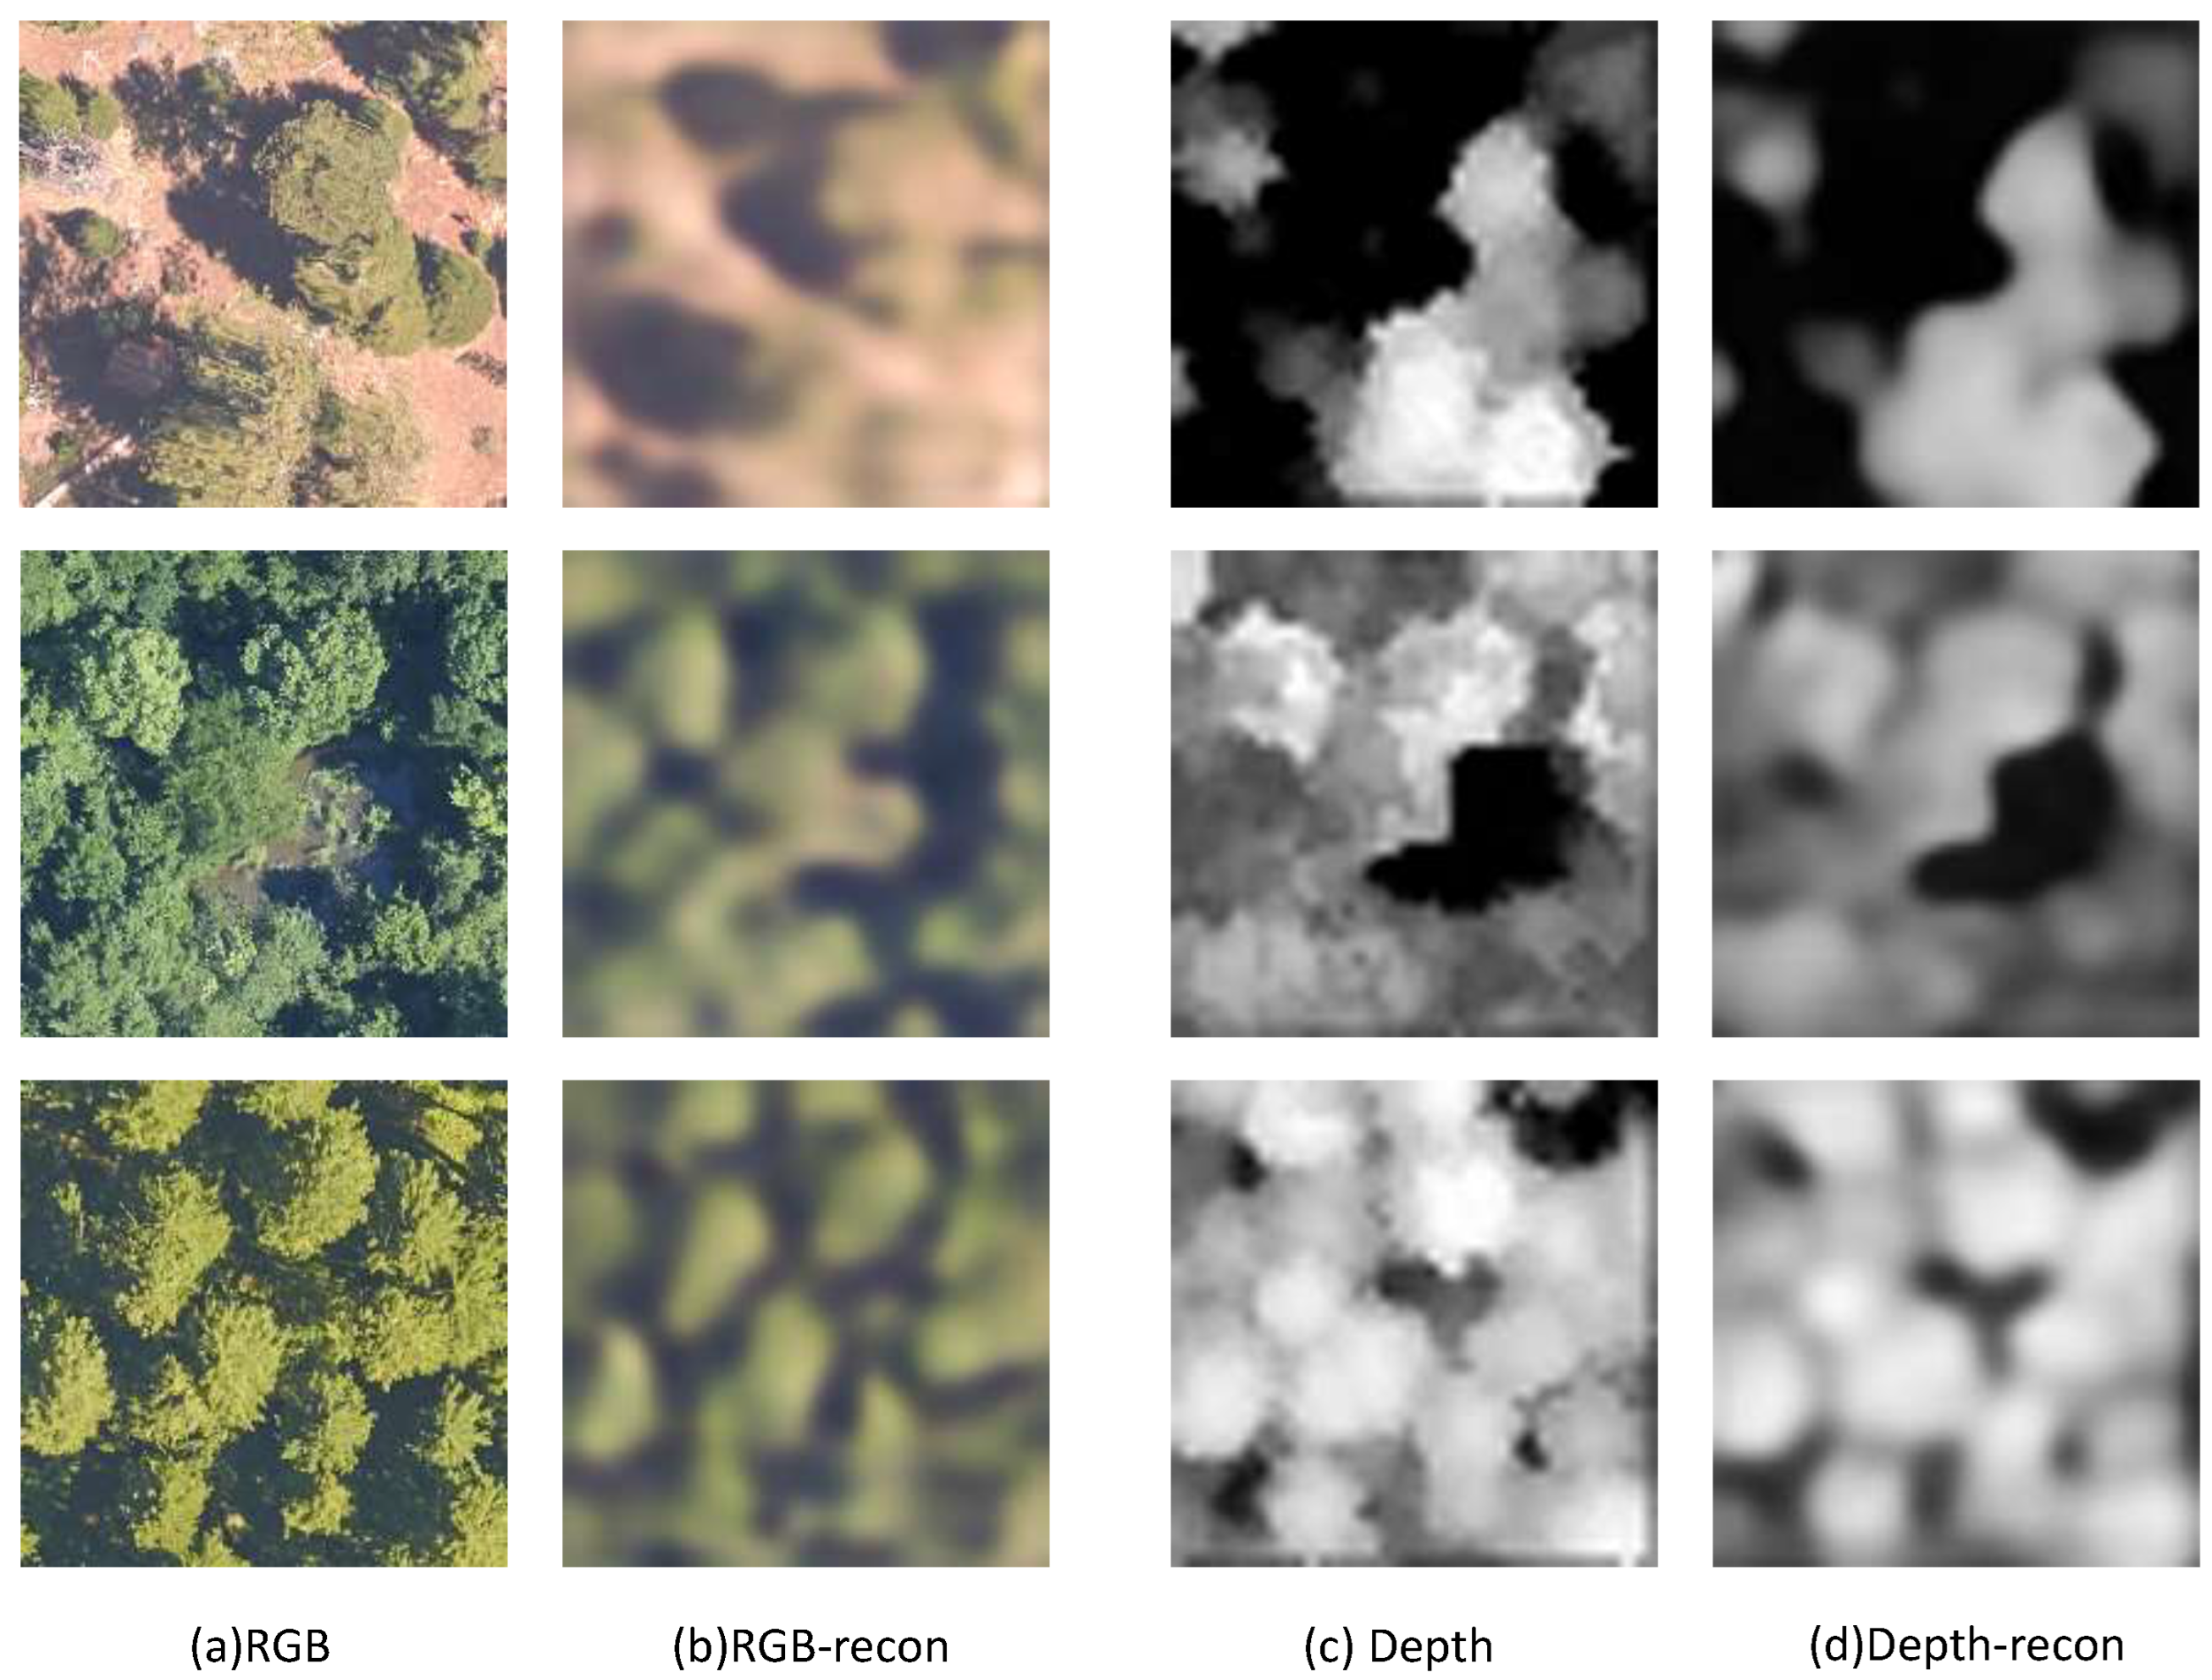
To further examine whether the auxiliary reconstruction branch provides a useful regularization signal for modality-aware feature learning, we visualize several reconstruction examples in
Figure 7 and report the reconstruction error statistics in
Table 13. Specifically, reconstruction quality is evaluated using MSE, MAE, peak signal-to-noise ratio (PSNR), structural similarity index measure (SSIM) [
52], and gradient error (Grad. error). PSNR measures pixel-level reconstruction fidelity in decibels (dB), SSIM evaluates structural similarity, and Grad. error measures the discrepancy between image gradients, which reflects edge and local structure preservation. Higher PSNR and SSIM indicate better reconstruction quality, while lower MSE, MAE, and Grad. error indicate better performance. The gradient error corresponds to the gradient consistency term
in the depth reconstruction loss and is defined as
where
and
denote the horizontal and vertical finite-difference gradient operators, respectively, and
and
denote the reconstructed and input depth maps.
The reconstructed RGB images preserve the coarse color distribution and canopy layout of the input RGB images, while the reconstructed depth maps retain the main height-structure patterns of tree crowns and background regions. The reconstructed outputs are smoother than the original inputs, which is expected because they are generated from the fused latent representation and are used as training-time regularization rather than as final inference outputs.
As shown in
Figure 7, the auxiliary decoders recover the main spatial structure of both modalities, although fine-grained texture details are smoothed. This behavior is also reflected in
Table 13. The RGB reconstruction has an MSE of 0.018 and a PSNR of 17.79 dB, indicating that the reconstructed RGB branch retains coarse appearance information rather than producing pixel-level high-fidelity restoration. The depth reconstruction obtains an MAE of 0.058, an SSIM of 0.574, and a Grad. error of 0.009 suggesting that the height-related structure and local spatial variations are partially preserved. Overall, these results support the role of reconstruction supervision as an auxiliary regularizer that encourages the fused latent representation to encode task-relevant appearance and structural cues. Although the reconstructed RGB and depth maps are smoother than the original observations, they provide sufficient supervision for modality-aware feature learning.
A further comparison with the BM-style training method supports the proposed redesign of the first training stage. As shown in
Table 14, the BM-style training variant performs substantially worse than the proposed reconstruction-oriented two-stage strategy, with the MAE increasing from 7.92 to 12.30 and the RMSE increasing from 14.20 to 20.10. These observations suggest that, for RGB–D tree counting, learning from self-reconstruction provides a more task-consistent initialization than directly imitating externally generated fused images.
Additional analysis on supervision form and kernel function. Finally, we examine the effect of the density supervision design by conducting controlled experiments on the full model. In these experiments, all model components and training configurations are kept unchanged, and only the construction of the density supervision target is modified. The corresponding results are reported in
Table 15.
First, switching from bounding-box-guided supervision to point-guided supervision leads to degradation on all three metrics, with the MAE increasing from 7.92 to 8.71, the RMSE increasing from 14.20 to 16.01, and decreasing from 0.8684 to 0.8328. This result indicates that bounding-box-guided density supervision contributes positively to the final performance of BCAR-Net. A plausible explanation is that point supervision only provides object-center information, whereas bounding boxes additionally encode the coarse spatial extent of tree crowns. Such spatial cues are particularly useful in aerial forest scenes, where crowns often exhibit overlap, scale variation, and ambiguous boundaries.
We further evaluate the effect of different kernel functions for constructing the box-derived density target . Although both uniform and Gaussian forms are possible, the Gaussian box-density target was adopted in all main experiments. Compared with the uniform box target, the Gaussian target reduces the MAE from 8.62 to 7.92 and the RMSE from 15.44 to 14.20, while increasing from 0.8445 to 0.8684. This suggests that a center-weighted Gaussian target provides a more informative supervision signal than uniformly distributing the density mass over the whole bounding box. In overlapping canopy regions, a uniform target may assign similar weights to crown centers, crown boundaries, and background pixels enclosed by the box, which can blur the distinction between adjacent trees. In contrast, the Gaussian target concentrates larger density responses near the box center and assigns smaller weights near the boundary, helping the model learn more localized density responses around individual tree crowns.
3.6. Discussion
Structured multimodal fusion and failure cases. The comparative experiments and modality ablations indicate that BCAR-Net benefits from combining RGB appearance with height-related structural information. Direct RGB–D concatenation already improves over either single modality, while the broker representation, BCA-UNet interaction, and spatial fusion gate provide additional gains (
Table 7,
Table 8,
Table 9 and
Table 10). These results suggest that tree counting in aerial forest imagery requires not only access to geometric cues but also an effective way to align them with RGB texture and canopy appearance. The auxiliary reconstruction branch further provides training-time regularization for the fused representation, but its role should be understood as a representation constraint rather than as high-fidelity RGB or depth generation.
Nevertheless, the grouped error analysis shows that this fusion strategy is not uniformly effective under all forest conditions. As shown in
Table 6, the largest errors are concentrated in high-density and high-canopy-closure patches, and both groups exhibit negative bias, indicating systematic under-counting in crowded and closed-canopy scenes. Such errors are closely related to the vertical and horizontal complexity of forest structure. In multi-layered stands, understory trees are often occluded by dominant canopy layers in nadir-view aerial imagery and may have weak or missing responses in both RGB imagery and CHM-derived height maps. High-density patches further increase the chance that several adjacent crowns are represented as a continuous canopy texture, while high-canopy-closure patches reduce the separability of individual crowns because both RGB boundaries and height discontinuities become less distinct. Overlapping crowns introduce a similar ambiguity: although the annotations may mark multiple neighboring trees, their RGB textures and height responses can appear as a single connected canopy region. Density regression avoids the need for explicit crown delineation, but it can still underestimate tree abundance when several crowns form a continuous texture or height pattern.
Data quality and forest condition also affect the reliability of the multimodal cues. CHM may vary across sites because of differences in point-cloud density, interpolation artifacts, terrain normalization errors, shadows, or missing values. When the height product is inaccurate or overly smoothed, the benefit of RGB–Depth fusion can be weakened. Dead trees, leaf-off trees, and sparse crowns further increase uncertainty because their visual appearance and height responses may differ from those of healthy broadleaf or conifer crowns. These factors are particularly relevant for cross-site evaluation, where species composition, phenological stage, illumination, crown morphology, and forest management history can vary substantially.
Practical use and deployment feasibility. From a practical perspective, BCAR-Net is more suitable for offline or near-offline patch-level and plot-level tree-count estimation where paired RGB and CHM are available. The method predicts density maps and obtains the final count by density integration; it does not explicitly output tree centers, crown boundaries, or instance-level boxes. Therefore, it should not be viewed as a replacement for individual tree detection or crown delineation methods when precise tree locations, crown extents, or tree-level attributes are required. The YOLO-based baseline provides a complementary detection-based reference, whereas BCAR-Net focuses on count estimation through density map regression. For deployment, the auxiliary reconstruction decoders are used only during training and do not increase the inference-stage parameter count. Even so, BCAR-Net still requires paired RGB and height inputs and contains a multimodal broker-fusion pipeline, which makes it more suitable for offline or near-offline monitoring than for strict real-time embedded deployment. In UAV or edge-computing scenarios, the computational cost of RGB–Depth alignment, height-map generation, and multimodal inference should be considered together. Future work will focus on lightweight backbones, cross-attention pruning, quantization, and knowledge distillation to improve its applicability to real-time UAV monitoring and resource-constrained forest assessment.