Article

Humic Acid Modulates Photosynthetic Responses to PEG-Induced Drought in Ocimum basilicum L.

by
Martin A. Stefanov
,
Georgi D. Rashkov
,
Preslava B. Borisova
,
Anelia G. Dobrikova
and
Emilia L. Apostolova
*
Institute of Biophysics and Biomedical Engineering, Bulgarian Academy of Sciences, Acad. G. Bonchev Str., Bl. 21, 1113 Sofia, Bulgaria
*
Author to whom correspondence should be addressed.
Plants 2026, 15(10), 1491; https://doi.org/10.3390/plants15101491
Submission received: 8 April 2026 / Revised: 30 April 2026 / Accepted: 11 May 2026 / Published: 13 May 2026

Abstract

Drought is a major environmental constraint that disrupts photosynthetic processes. This study investigated the effects of foliar-applied commercial humic acid (HA) at different concentrations (1, 3 and 5 mg/mL) on the photosynthetic apparatus of sweet basil (Ocimum basilicum L. Italiano classico) under PEG-induced stress. The responses of the photosynthetic machinery were evaluated using chlorophyll a fluorescence analyses (JIP-test and PAM), leaf pigment composition, and assessments of membrane integrity. Drought stress caused pronounced alterations on both the donor and acceptor sides of photosystem II (PSII), including impaired QA reoxidation, reduced open PSII reaction centers (qP), diminished electron transport (ETo/RC, REo/RC), and substantial declines in performance indices (PIABS, PItotal). Energy dissipation increased (DI0/RC), with regulated energy losses (ΦNPQ) rising more strongly than non-regulated losses (ΦNO). Drought also elevated oxidative stress markers (MDA and H2O2), leading to enhanced membrane injury. Among the tested concentrations, 5 mg/mL HA provided the most effective protection against drought stress. This treatment mitigated PEG-induced damage on both PSII donor and acceptor sides and increased the proportion of open reaction centers (qP). Improved PSII photochemistry corresponded with more efficient QA reoxidation, facilitated its interaction with plastoquinone, and caused the overall stabilization of photosynthetic functions under drought. The protective effects of HA were also evident for both PSI subpopulations. The enhanced tolerance was associated with the activation of antioxidant enzymes (CAT, SOD, APX) and the increased levels of anthocyanins and total phenolic content (TPC). In contrast, lower HA concentrations (1 and 3 mg/mL) provided insufficient protection. This study clearly demonstrates that HA enhances drought tolerance in basil in a concentration-dependent manner by protecting the structural and functional integrity of the photosynthetic apparatus, supporting its potential use as a foliar treatment to improve crop resilience under water-limited conditions.

1. Introduction

One of the main abiotic stresses limiting plant growth, productivity, and global food security is drought [1]. Water deficit significantly affects plants by impairing cellular metabolism and physiology, reducing membrane stability, and inhibiting plant growth and yield [2,3]. Photosynthesis is among the primary physiological processes disrupted by drought stress [4,5]. Drought-induced physiological, biochemical, and molecular alterations strongly impair photosynthetic efficiency [6,7]. Chloroplasts are known to be the primary sites of oxidative stress due to the light reactions of photosynthesis and, in particular, the imbalance between light capture and its utilization [8]. The increased levels of reactive oxygen species (ROS) lead to the disassembly of pigment–protein complexes, destabilization of thylakoid membranes, and inhibition of both photosystem I (PSI) and photosystem II (PSII) activities [9,10]. Drought-induced dehydration causes significant disorder in the photosynthetic machinery, as evidenced by the loss of several PSI and PSII reaction center proteins and associated light-harvesting complexes under severe drought stress [11]. The authors demonstrated a decrease in PSII dimers, along with an increase in LHCII monomers in the LHCII-PSII supercomplexes. These changes disrupt the balance of electron-transport pathways and reduce photochemical efficiency [7,11,12,13,14]. PSII is known to be more sensitive than PSI under environmental stress [15,16]. Studies have shown that, under moderate drought, the core protein content of PSI often remains unchanged [17], whereas prolonged drought can reduce the size of the PSI antenna system and lead to the disassembly of the PSI supercomplexes, thereby disrupting the structure required for efficient energy transfer [9].
Plants have developed adaptive mechanisms such as the activation of antioxidant defenses and osmotic adjustments to alleviate the negative impacts of environmental stressors [1,6,18]. One promising approach for improving plant resilience and tolerance to abiotic stresses, including drought, is the use of plant biostimulants [19,20,21]. Biostimulants represent a diverse group of substances—such as humic acids, seaweed extracts, protein hydrolysates, and microbial inoculants—that can modulate plant physiological and metabolic processes, enhancing stress tolerance and crop performance [22,23]. Natural organic substances such as humic acid (HA) have attracted considerable attention due to their multifaceted roles in promoting plant growth [24], nutrient uptake [25], and stress adaptation [26]. HA has been shown to enhance the activity of antioxidant enzymes (such as superoxide dismutase, catalase, and peroxidases), thereby reducing ROS accumulation, mitigating oxidative damage, and protecting the photosynthetic apparatus [27,28,29,30]. Activation of antioxidant enzyme systems under drought stress following HA application has been demonstrated in different plant species, including maize, sorghum, and lettuce [28,30,31]. Foliar-applied HA (0.2 mg/mL) under drought increased total chlorophyll content and overall photosynthetic activity in wheat varieties [32]. Increased photosynthetic pigment content and improved relative water content (RWC) were also observed in spearmint (Mentha spicata L.) after the foliar application of 1 mg/mL HA [33]. HA has been shown to influence the expression of the stress-related antioxidant enzyme genes and effectively reduce drought stress [34]. The study of Alsamadany [35] has revealed that the HA application upregulated the expression of drought-related genes. However, the alleviating effects of HA on drought-induced changes vary among plant species [30]. Additionally, HA promotes osmotic adjustment by increasing the accumulation of compatible solutes, which stabilize membrane structures under water deficit [26,29]. The effectiveness of HA is known to be highly dose-dependent, with sub-optimal or supra-optimal doses producing insignificant or even inhibitory effects [36,37]. Despite many studies on the effects of HA on plants, the exact protective mechanisms underlying the primary processes of photosynthesis under drought conditions have not been elucidated.
Basil (Ocimum basilicum L. Italiano classico) is a widely used herb valued both as a fresh vegetable and in the pharmaceutical industry due to its essential oil content and secondary metabolites such as phenolic compounds, flavonoids, and anthocyanins [38,39]. Drought stress limits basil production worldwide, reducing basil biomass and altering metabolic composition, thereby compromising its economic and medicinal value [40,41,42]. Therefore, exploring effective approaches to enhance basil tolerance to drought is essential for maintaining productivity and quality under water-limited conditions.
The present study aimed to assess the effects of foliar-applied HA (1, 3, and 5 mg/mL) on the function of the photosynthetic apparatus under PEG-induced drought stress and to identify the most effective HA concentration within the tested range for protecting sweet basil (Ocimum basilicum L. Italiano classico) under drought conditions. In addition, the relationship between changes in the primary processes of photosynthesis and alterations in pigment composition, membrane stability, RWC, and antioxidant activity was examined. The results provide new insights into the role of HA in enhancing basil tolerance to drought stress and demonstrate that 5 mg/mL HA is the most effective concentration within the tested range.

2. Results

2.1. Pigment Composition

The effects of HA on pigment content in basil plants under PEG-induced drought stress varied depending on its concentration (Table 1). The data revealed that treatment with 20% PEG alone significantly reduced the amounts of chlorophyll a (Chl a) and carotenoids (Car) by 20% and 16%, respectively, while the amount of chlorophyll b (Chl b) remained unchanged (Table 1). Under PEG-induced drought stress, the foliar application of a higher HA concentration (5 mg/mL) increased the amounts of Chl a and Car by 41% and 45%, respectively, compared to plants treated with PEG alone. In contrast, the combined treatment with PEG and lower HA concentrations (1 and 3 mg/mL) did not alter Chl a and Car content, as their amounts did not differ significantly from those in PEG-treated plants (Table 1).

2.2. Membrane Stability Index and Relative Water Content

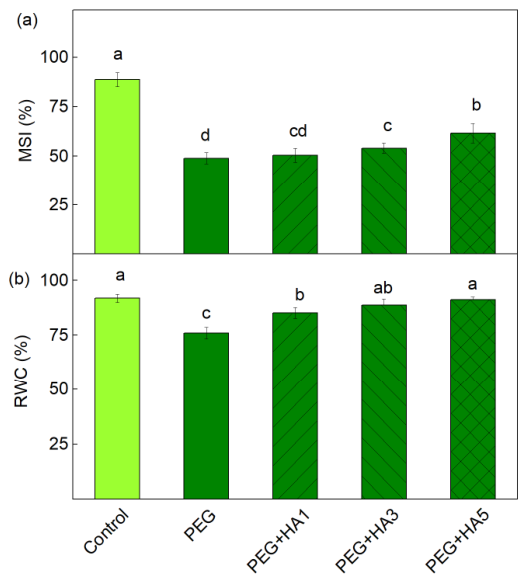
Membrane stability index (MSI) and relative water content (RWC) were used to determine the role of HA in basil tolerance under PEG-induced drought stress. The MSI decreased by 45% after PEG treatment compared to the control. The foliar application of 3 mg/mL HA under drought stress increased MSI by 10% relative to PEG treatment alone, whereas no significant difference was observed at 1 mg/mL HA. Application of 5 mg/mL HA under PEG-induced stress increased MSI by 26%, although the value remained lower than that of the control plants (Figure 1a). The RWC also decreased after treatment with PEG alone, while after applying all concentrations of HA, the values of this parameter increased. After applying 5 mg/mL HA under stress, the RWC level was similar to that of the control plants (Figure 1b).

2.3. Oxidative Stress Markers

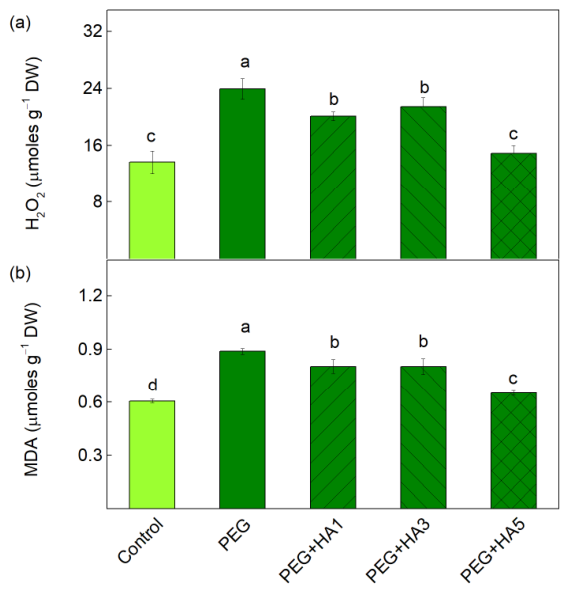
PEG-induced drought stress led to a 75% increase in H2O2 levels compared to the control plants (Figure 2a). The foliar application of HA under PEG treatment reduced these H2O2 levels relative to plants exposed to PEG alone. The decreases ranged from 11% to 16% at the lower HA concentrations (1 and 3 mg/mL). The lowest level of H2O2 (a reduction of 38%) was observed at 5 mg/mL HA, and the amount of H2O2 was similar to that of the control plants (Figure 2a). The amount of MDA, an indicator of lipid peroxidation, increased by 47% after PEG treatment (Figure 2b). All studied HA concentrations reduced MDA relative to PEG treatment, with the strongest reduction observed at the highest HA concentration (5 mg/mL); however, the control values were not reached (Figure 2b).

2.4. Antioxidant Enzymes, Anthocyanins and Total Phenolic Content

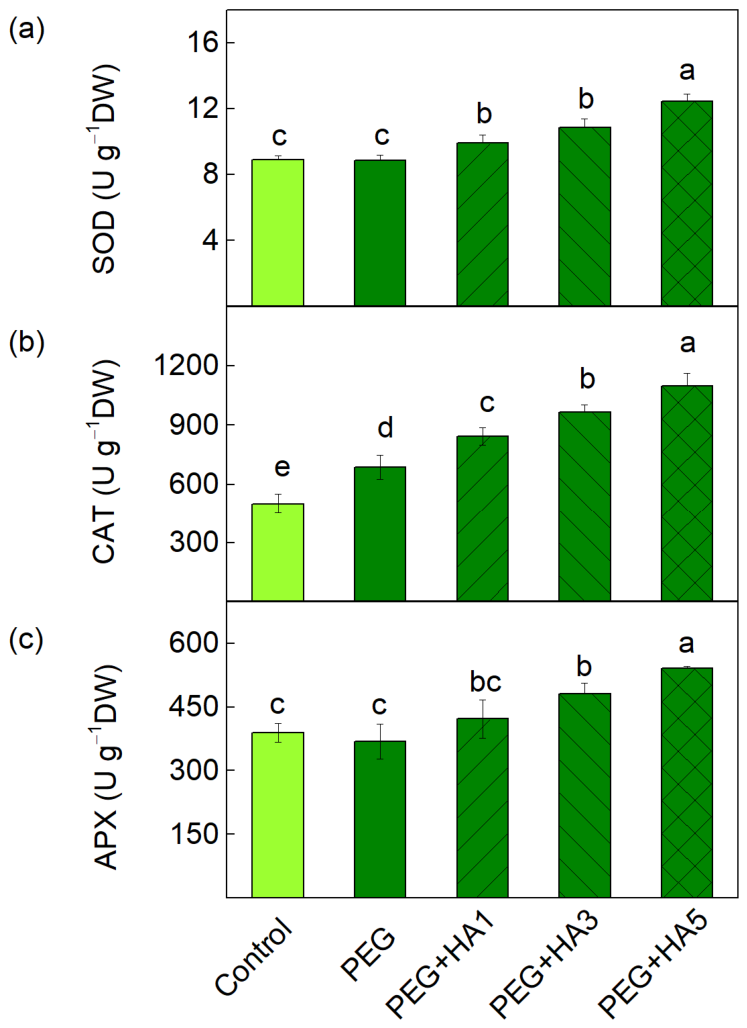
The alterations in the enzyme activities of superoxide dismutase (SOD), catalase (CAT) and ascorbate peroxidase (APX) after the foliar application of HA under PEG-induced drought stress are presented in Figure 3. Treatment with PEG alone increased CAT activity by 37% compared to the control plants, while SOD and APX activities remained unchanged. The results demonstrated that the foliar application of HA under PEG-induced drought stress leads to the increased activities of all three antioxidant enzymes (SOD, CAT, and APX) compared to PEG-treated plants. The degree of enzyme activation depended on the HA concentration, with the highest concentration (5 mg/mL) producing the strongest response. At this concentration, CAT activity showed the greatest increase (by 60%), while SOD and APX activities were increased by 40–45% compared to PEG-treated plants (Figure 3).
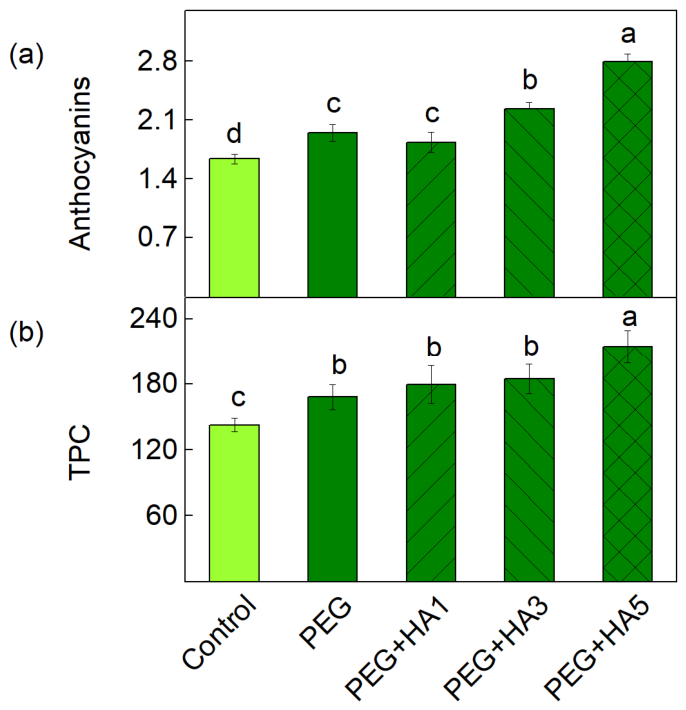
PEG-induced drought stress increased the anthocyanin amount and total phenolic content (TPC) in basil leaves (Figure 4). Anthocyanins increased by 19% compared to untreated plants (Figure 4a), and foliar spraying with 1 mg/mL of HA did not induce alterations in their level compared to PEG treatment alone. At the same time, HA spraying with 3 and 5 mg/mL enhanced anthocyanin accumulation by 36% and by 70%, respectively, compared to the control (Figure 4a). Similarly, PEG treatment alone increased TPC by 18% relative to the control plants. The application of lower HA concentrations (1 and 3 mg/mL) did not affect TPC compared to PEG treatment, while a significant increase in TPC (50%) was observed only after treatment with 5 mg/mL HA under stress compared to untreated plants (Figure 4b).

2.5. Pulse Amplitude-Modulated Chlorophyll a Fluorescence

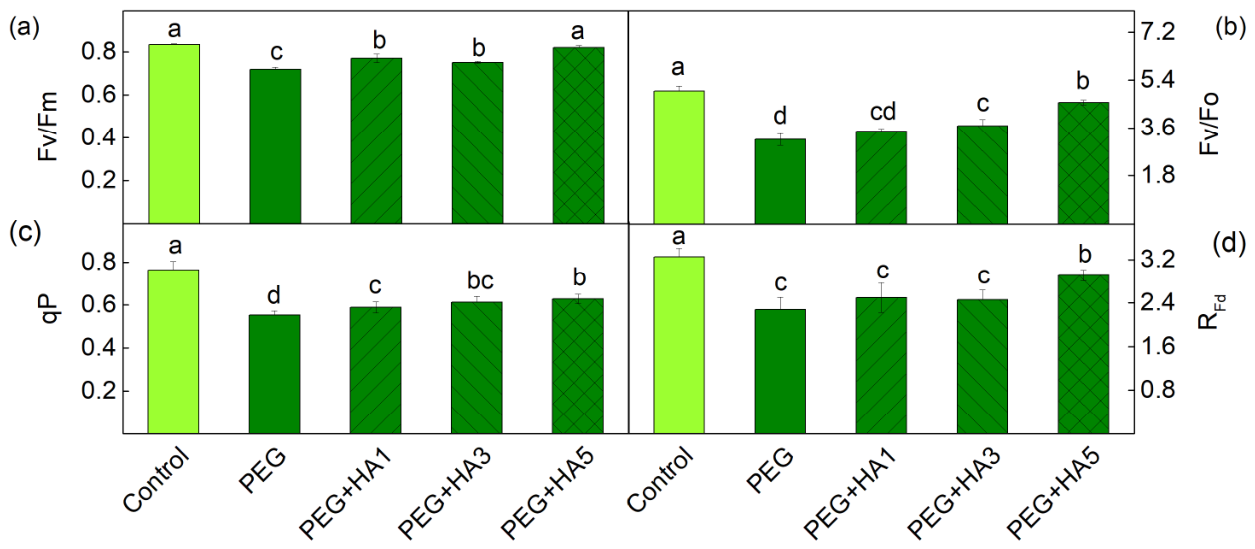
Pulse Amplitude-Modulated (PAM) chlorophyll a fluorescence was used to assess the impact of HA under PEG-induced drought stress on the functions of the photosynthetic apparatus of basil plants. PEG treatment led to a reduction in the maximum quantum yield of PSII (Fv/Fm) and in the ratio of photochemical to non-photochemical processes (Fv/Fo) as Fv/Fm decreased by 14% and Fv/Fo by 37% (Figure 5). In addition, reductions in the photochemical quenching (qP) and photosynthetic rate (RFd) were also observed. The application of HA under drought stress increased Fv/Fm (by 7–39%) and Fv/Fo (16–44%), with the strongest effects observed at 5 mg/mL HA (Figure 5). After applying 5 mg/mL HA, a significant increase was also registered in RFd values (Figure 5).
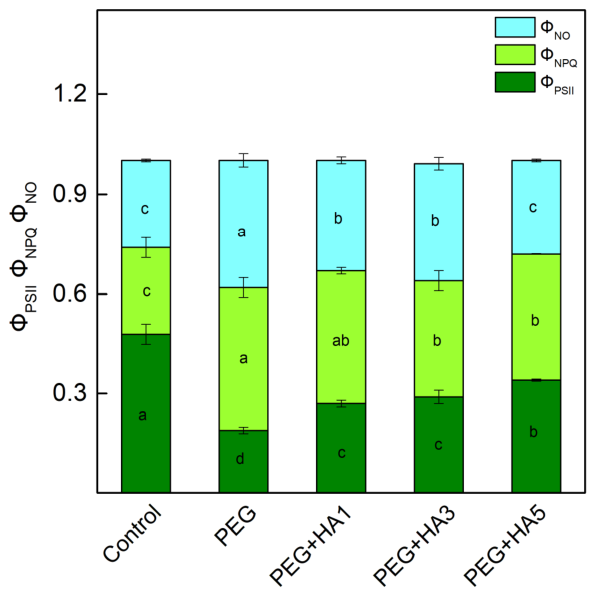
PEG-induced drought stress decreased the effective quantum yield of PSII photochemistry (ΦPSII) by 60% and increased both non-regulated (ΦNO) and regulated (ΦNPQ) energy dissipation by 46% and 65%, respectively, compared to control plants (Figure 6). The application of HA under stress conditions prevented the photochemical activity of PSII (ΦPSII), as the effect was more pronounced at 5 mg/mL HA. At this concentration of HA, ΦNO and ΦNPQ decreased by 26% and 12%, respectively, relative to PEG-treated plants (Figure 6).
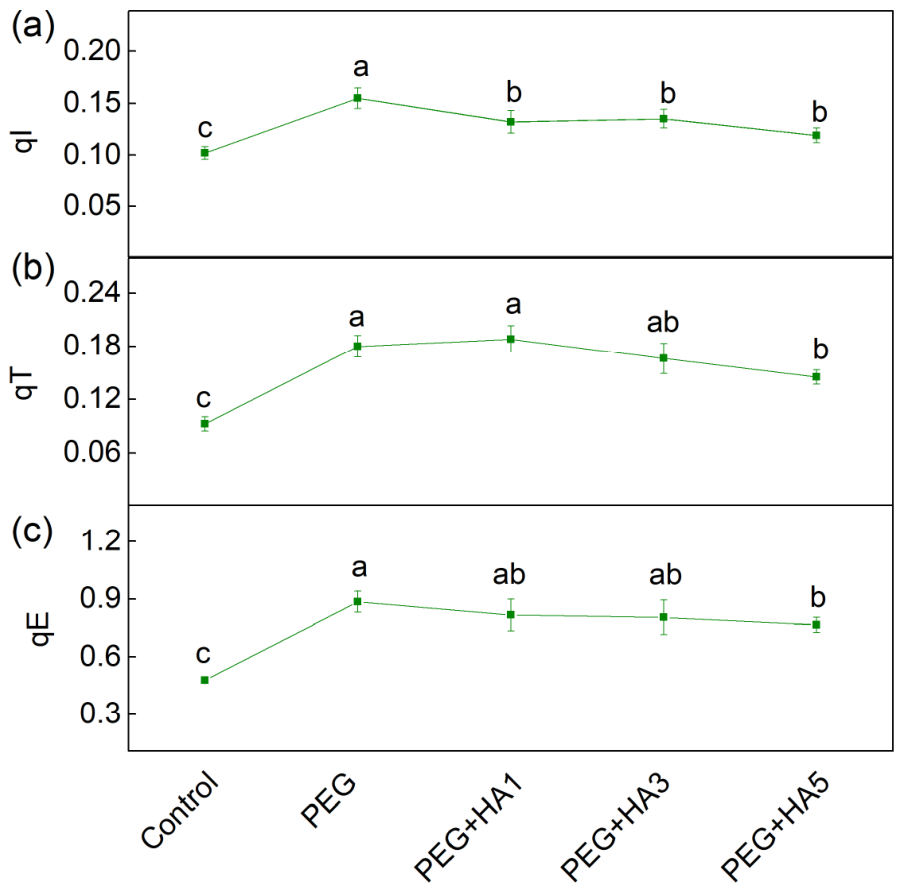
More detailed information on non-photochemical quenching within the photoprotective machinery is provided by its components: qI (photoinhibitory quenching), qT (state-transition quenching), and qE (energy-dependent quenching) (Figure 7). In response to PEG treatment, all these components increased compared to the control (Figure 7). Treatment with PEG increased qT, qE and qI by 96%, 85% and 52%, respectively (Figure 7). The application of HA under stress conditions reduced qI by 13–24% compared to PEG-treated plants. Compared to PEG treatment alone, the components qE and qT showed significant decreases by 14% and 20%, respectively, only at the highest HA concentration (5 mg/mL) (Figure 7).
The chlorophyll fluorescence after a single saturating pulse was deconvoluted into two components, fast (A1) and slow (A2), with times t1 and t2, respectively. These components characterize the distinct electron pathways of QA reoxidation [43,44]. PEG treatment alone led to an increase in t1 of 31% and a decrease in t2 of 13% compared to control plants. The application of lower HA concentrations (1 and 3 mg/mL) under drought conditions had a smaller effect on the time t1 compared to PEG-treated plants, whereas 5 mg/mL HA decreased this time to the level of the control plants. The time t2 increased at all studied concentrations of HA compared to the plants treated with PEG alone. The ratio of two components (A1/A2) decreased under PEG treatment alone, but only after the application of the highest HA concentration (5 mg/mL), this ratio increased (Table 2).

2.6. Fast Chlorophyll a Fluorescence

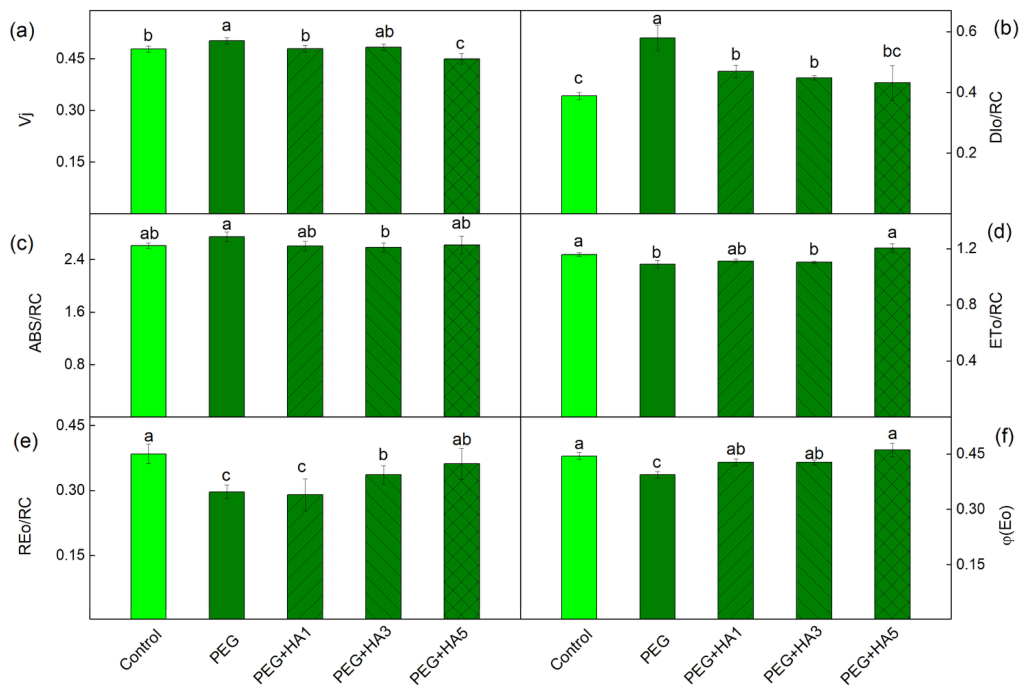
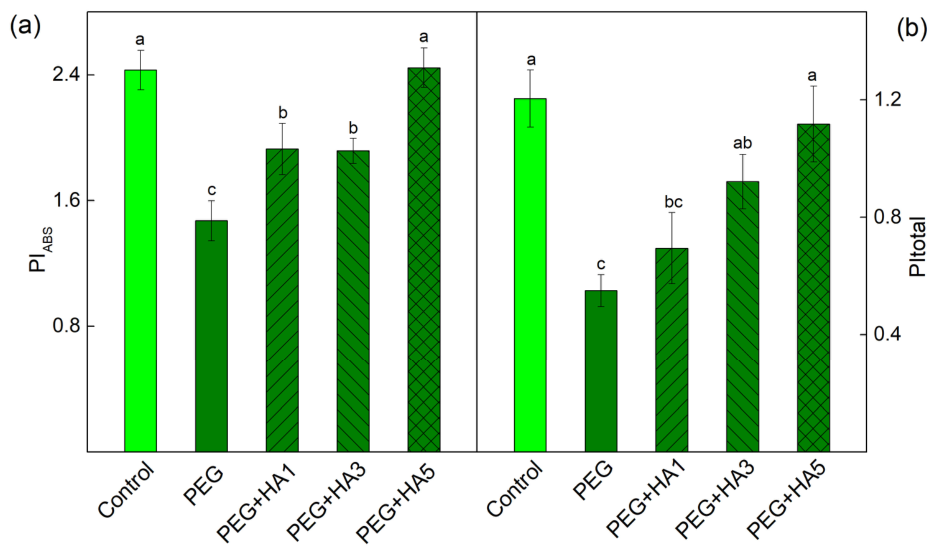
More detailed information about the impact of HA under PEG-induced drought stress is provided by chlorophyll fluorescence induction (OJIP transitions). The experimental results showed that the antenna size per active reaction center (ABS/RC), the dissipation energy flux per reaction center (DIo/RC), and the instability of the PSII acceptor side (Vj) increased after PEG treatment. Among all examined parameters, the strongest PEG-induced increase was observed for DIo/RC (by 50%), whereas the most pronounced decrease occurred in REo/RC (by 24%), highlighting that PEG-induced stress markedly enhances energy dissipation while severely limiting electron flow toward PSI acceptors (Figure 8). A decrease was also registered for PIABS (by 38%) and PItotal (by 55%) (Figure 9). The application of HA prevented the PEG-induced drought changes in the photosynthetic apparatus (Figure 8). The protective effect of HA was most pronounced at 5 mg/mL, where the values of the studied parameters were similar to those of the control plants (Figure 8 and Figure 9).
The increased values of both performance indices after combined HA and PEG treatment resulted from the better protection of the performance of the primary photochemistry [φ(Po)/(1 − φ(Po))] and the non-light-dependent reaction [ψ(Eo)/(1 − ψ(Eo))] (Table S1). In addition, the higher values of PItotal after applying 5 mg/mL HA were determined by the better efficiency of electron transfer from QB to PSI electron acceptors [δ(Ro)/(1 – δ(Ro))] (Table S1).

2.7. P700 Photooxidation

The photooxidation of P700 (P700+) under far-red (FR) light was analyzed to evaluate PSI photochemistry (Table 3). The dark-decay kinetics of P700+ were deconvoluted into two exponential components: fast A1 with time t1P700 and slow A2 with time t2P700. The PEG treatment decreased relative changes in P700+ (ΔA/A) by 19%, time t1P700 by 27% and the ratio of amplitudes of the fast to slow components (A1P700/A2P700) by 50% (Table 3). The application of HA led to an increase in the ΔA/A ratio by 15–16% compared to PEG-treated plants, but values are smaller than those of the control plants. Data also revealed that t2P700 increased by 21% under PEG treatment, whereas it decreased after foliar treatment with all studied concentrations of HA. Treatment with 5 mg/mL HA under stress increased the A1P700/A2P700 ratio, reaching control values (Table 3).

3. Discussion

Drought stress is known to negatively impact plants by impairing photosynthesis, which is essential for their growth and productivity [1,7]. Although several studies have highlighted the important role of HA in regulating photosynthesis and enhancing plant tolerance to abiotic stress, detailed information regarding their influence on the photosynthetic apparatus remains insufficient [26,45,46]. Therefore, this study aimed to provide more detailed information about the protective effects of HA on the primary processes of photosynthesis in basil plants by assessing its influence on the function of the main complexes of the photosynthetic apparatus under PEG-induced drought stress. The physiological responses observed in plants following the foliar application of HA are likely mediated by a combination of nutrient uptake processes, surface interactions, and signaling-driven adjustments [47]. The humic substances are known to activate membrane-associated receptors and ion transport systems, triggering early signaling events such as transient ROS accumulation, Ca2+ fluxes, modulation of auxin- and ABA-related pathways and upregulation of the expression of drought-related genes [35,48,49].
PEG-induced drought stress causes a significant disruption of the photosynthetic machinery, accompanied by changes in leaf pigment content [11]. A reduction in photosynthetic pigments is a typical symptom of drought stress and is closely associated with alterations in plant morphology [14,50]. The data in this study revealed a decrease in the amounts of Chl a and Car, accompanied by an increase in H2O2 content in basil plants under stress conditions (Table 1, Figure 2), suggesting that the reduction in these pigments (Chl a and Car) is mainly due to oxidative stress. At the same time, no changes in the amount of Chl b were registered under water deficiency conditions (Table 1), which suggests a higher sensitivity of Chl a than Chl b. The decrease in Chl content is commonly observed in many plant species under drought stress, as the changes strongly depend on the plant sensitivity [14,51,52,53]. The Chl reduction may be due to stress-induced impairment in pigment biosynthetic pathways or pigment degradation [54,55].
Oxidative stress also caused increased lipid peroxidation, corresponding to an increased MDA content (Figure 2). All these changes, together with the decrease in RWC, led to reduced membrane stability, i.e., the MSI parameter decreased by 45% (Figure 1). The highest applied concentration of HA (5 mg/mL) prevented a decrease in RWC, Chl a, and Car, which in turn preserved membrane integrity (MSI). Smaller lipid peroxidation and membrane injury in drought-tolerant genotypes of Brassica napus and Setaria italica have been shown [56,57]. Having in mind that lipid peroxidation and membrane injury can be used to assess the plant drought tolerance [58,59], it could be suggested that 5 mg/mL HA increased basil tolerance under drought stress.
The protective effects of HA under PEG-induced drought stress were also associated with the activation of the antioxidant defense system. The current results revealed that, under stress conditions, HA application gradually activated SOD, CAT, and APX with the maximum effect observed at 5 mg/mL, whereas after PEG treatment alone, stimulation was registered only for CAT activity (Figure 3). The upregulation of these enzymes enhances the detoxification of superoxide radicals and hydrogen peroxide, thereby limiting oxidative damage to the photosynthetic membranes. Similar responses have been observed in previous studies, showing that HA improved antioxidant capacity in finger millet, wheat, foxtail millet, and maize [27,28,53,60,61,62]. It has been demonstrated that HA influences the transcription of stress-responsive antioxidant enzyme genes, contributing to a reduction in drought-induced damage [34]. HA treatment also promoted the accumulation of non-enzymatic antioxidants, including anthocyanins and TPC, which increased by 70% and 50%, respectively, at 5 mg/mL HA (Figure 4). These metabolites are known to contribute to ROS scavenging and support osmotic adjustment under stress conditions [26,29,63,64] as well as the functions of the photosynthetic apparatus [65]. The enhanced antioxidant capacity and osmotic stabilization of cellular structures after the foliar application of HA most likely contribute to the maintenance of membrane integrity and photosynthetic functions. Thus, the membrane integrity (MSI) was protected, and the RWC was restored to control levels after the application of 5 mg/mL HA, indicating that HA effectively mitigated the water deficit in leaf tissues. It has also been found that the modulation of the water status and antioxidant activity in wheat leaves are the reasons for the reduction in Cd toxicity in wheat leaves [66].
PEG-induced drought stress also led to a significant reduction in all studied PAM parameters, especially in the ratio of the photochemical to non-photochemical processes (Fv/Fo), the amount of the open reaction centers’ proportion (qP) and the photosynthetic rate (RFd) (Figure 5). A similar decrease in photosynthetic efficiency and damage to PSII reaction centers under drought stress has been reported in barley, maize, chickpea, wheat and quinoa [15,53,67,68]. The strong decrease in Fv/Fo under drought stress (Figure 5) suggests structural alterations in the thylakoid membranes and an inhibition of the oxygen-evolving complex [54,69]. Analysis of the OJIP transition revealed an increase in Vj, which corresponds to altered QA reoxidation kinetics and restricted electron transfer from QA to the plastoquinone pool (Figure 8, Table 2). These observations indicate changes in both the acceptor side (parameter Vj) and donor side (ratio Fv/Fo) of PSII. The drought-induced changes in the PSII complex could be the result of the alterations in D1 protein and QB reducing complex and the damage of the oxygen-evolving complex [70,71,72,73]. The drought-induced modification of PSII strongly limits the effective quantum yield of the photochemical energy conversion of PSII (ΦPSII) and the efficiency of the photosynthetic machinery and increases energy dissipation per reaction center (DIo/RC), which reflects structural and energetic constraints within PSII reaction centers (Figure 8). In addition, the increases in both regulated (ΦNPQ) and non-regulated (ΦNO) energy losses, revealing the real-time regulatory adjustments of energy dissipation under illumination, were registered (Figure 6). It is well known that non-photochemical quenching is a major photoprotective mechanism of the photosynthetic apparatus under stress [15]. Furthermore, our data revealed an increase in energy-dependent quenching component (qE, by 85%) and the state-transition quenching component (qT, by 96%) under PEG treatment (Figure 7). The strongly enhanced component qT indicates the stimulated/increased redistribution of excitation energy between the two photosystems, which is vital for protecting the photosynthetic apparatus under stress [74]. The ratio of these protective mechanisms (qE/qT) was 4.92 under stress compared to 5.19 in control plants, suggesting a decrease in the proportion of qE (i.e., ΔpH-dependent energy dissipation) in non-photochemical processes after PEG treatment alone. At the same time, photoinhibitory quenching (qI) increased, indicating PSII damage as a result of ROS accumulation [74,75]. The impairment of PSII function also influenced electron flow toward PSI acceptors (REo/RC) and reduced PItotal (Figure 8 and Figure 9).
PEG-induced drought stress also influenced PSI activity (ΔA/A) and P700 photooxidation kinetics, including changes in the fast and slow components of P700+ dark reduction (Table 3). Previous studies have shown that drought stress reduces PSI antenna complexes and affects the organization of PSI-LHCI supercomplexes [9]. This study showed that drought stress caused an increase in t2P700, as well as a decrease in t1P700 and the A1/A2 ratio under drought conditions (Table 3), suggesting changes in the two PSI populations associated with different thylakoid domains [76,77]. The decrease in t1P700 indicates an increased cyclic electron flow, a process that protects the photosynthetic machinery from oxidative damage [78].
The highest concentration of HA (5 mg/mL) provided the optimal protection of photosynthetic function under PEG-induced drought stress. Foliar HA alleviated the drought-induced changes on both the donor and acceptor sides of PSII. Analysis of the dark relaxation of chlorophyll a fluorescence showed that, after HA application under stress, the times of the fast and slow components (t1 and t2) were similar to those of the untreated plants (Table 2). The fast component (A1 and time t1) is associated with QA reoxidation by the PQ pool, while the slow component (A2 and time t2) is associated with QA reoxidation by recombination with S2 and S3 states of the oxygen-evolving complex [79,80,81]. This study demonstrated that HA preserves the functionality of the PSII acceptor side by maintaining efficient QA reoxidation and alleviating its interaction with plastoquinone, as evidenced by the decrease in t1 (Table 2).
Additionally, HA treatment increased the Fv/Fo ratio (Figure 5), indicating an improvement in the PSII donor side. All these changes in the PSII complex after the HA application under stress led to an increased number of open PSII reaction centers (qP) and an improved effective quantum yield of PSII photochemistry (ΦPSII) (Figure 5 and Figure 6). The data also revealed an improved electron transport from QA to QB (ETo/RC), a higher quantum yield of electron transport beyond QA (φEo), and an increased electron flux reaching PSI end acceptors (REo/RC). The protection of PSII photochemistry during drought in the presence of HA corresponds with an improved photosynthesis rate (RFd) (Figure 5 and Figure 8). Similarly, it has been found that the HA application improved the net photosynthesis under water stress by increasing the gas exchange rate and electron transport flux in rapeseed plants, as the parameters ABS/RC and ETo/RC were increased, and DIo/RC decreased after the application of HA [82]. The protective effect of HA on the functions of the photosynthetic apparatus was clearly shown by the performance indices (PIABS and PI total), which were similar to those of control plants (Figure 9). Analysis of their components revealed that HA prevented the drought-induced decline in primary photochemistry [φ(Po)/(1 − φ(Po))], the non-light-dependent reaction [ψ(Eo)/(1 − ψ(Eo))], and the efficiency of the electron transfer from QB to PSI electron acceptors [δ(Ro)/(1 – δ(Ro))] (Table S1). The better protection of the function of the photosynthetic apparatus corresponded with the decreased energy dissipation per reaction center (DIo/RC) and the reduced components of the non-photochemical quenching (qE, qT and qI) (Figure 7 and Figure 8). In addition, combined PEG and HA treatment increased the ratio of energy-dependent quenching (qE) to state-transition quenching (qT) to 5.28, compared with 4.92 under PEG alone, indicating a greater contribution of qE to the protection of the photosynthetic apparatus. This study also showed the protective role of HA on PSI photochemistry (Table 3). The times (t1P700 and t2P700) of P700 dark relaxation after HA treatment under stress were similar to those of the control, suggesting the effective protection of the two PSI subpopulations.

4. Materials and Methods

4.1. Plant Growth Conditions and Treatments

Seeds from sweet basil (Ocimum basilicum L. Italiano Classico) were grown hydroponically in containers on a half-strength Hoagland’s solution containing 2.5 mM KNO3, 2.5 mM Ca(NO3)2, 1 mM MgSO4, 0.5 mM NH4NO3, 0.5 mM K2HPO4, 23 µM H3BO3, 4.5 µM MnCl2, 0.4 µM ZnSO4, 0.2 µM CuSO4, 0.25 µM Na2MoO4, and 20 µM Fe-EDTA (pH 6.0) as in [65]. Cultivation was carried out under controlled conditions at a light intensity of 150 µmol photons m−2·s−1, a 12 h photoperiod, and a 24/20 °C (day/night) temperature. The nutrient solution in containers was renewed every three days. Drought stress was induced on one-month-old plants by adding 20% polyethylene glycol 6000 (PEG 6000) to the nutrient solution for three days. The foliar spraying of plants with three different concentrations (1, 3 or 5 mg/mL) of HA (Thermo Fisher Scientific, Waltham, MA, USA) was performed 24 h prior the PEG treatment. HA was dissolved in water (slightly alkaline, pH 7.8). The control group of plants was sprayed with an equivalent volume of water. After 3 days of the PEG exposure, all measurements were conducted on fully expanded mature basil leaves.

4.2. Determination of the Pigment Composition

The content of chlorophyll a (Chl a), chlorophyll b (Chl b) and carotenoids (Car) was determined by incubating fresh leaf tissues in 80% (v/v) acetone overnight at 4 °C in the darkness following the protocol described in [83]. Subsequently, the leaf extracts were filtered through Miracloth (475855-1R, Millipore, Merck, Darmstadt, Germany) before measuring the concentrations of photosynthetic pigments spectrophotometrically, following the method of Lichtenthaler [84].

4.3. Relative Water Content and Membrane Stability Index

The relative water content (RWC) of basil leaves was evaluated as described in [85]. The RWC was calculated using the following equation:
RWC (%) = (FW − DW)/(TW − DW) × 100
where FW is the fresh weight (measured immediately after harvesting the leaves), TW is the turgid weight (of leaves immersed in distilled water until full hydration), and DW is the dry weight (measured after oven-drying the leaves at 80 °C for 24 h). This parameter reflects the water status of the leaf tissues under different experimental treatments.
The cell membrane stability in leaf tissues was evaluated according to the method described in [86]. Leaf tissue samples taken from the control and differently treated plants were placed in 30 mL of distilled water and left to incubate at room temperature for 24 h. After incubation, the initial electrical conductivity (EC1) of the solutions was measured using a conductivity meter (Hydromat LM302, Witten, Germany). The solutions were then subjected to 20 min of boiling to completely disrupt the membranes, after which they were cooled to room temperature and the final conductance (EC2) was recorded again to assess the total ion leakage. The membrane stability index (MSI) was estimated in percentages using the following equation:
MSI (%) = [(1 − EC1/EC2)] × 100.

4.4. Determination of MDA and H2O2 Content

Lipid peroxidation was determined by the malondialdehyde (MDA) content using the protocol of Stewart and Bewley [87]. Absorbance values were recorded spectrophotometrically at 532 nm and 600 nm. The MDA concentration was expressed as µmoles per g DW using an extinction coefficient of 155 mM−1 cm−1.
Hydrogen peroxide (H2O2) content was determined following the method described in [88]. Absorbance was measured spectrophotometrically at 390 nm. The H2O2 concentration was calculated using a standard curve and expressed as µmoles per g DW.

4.5. Determination of Antioxidant Enzyme Activities

The activity of superoxide dismutase (SOD, U g−1 DW) was determined according to the method described in [89], based on its ability to inhibit the photochemical reduction of nitroblue tetrazolium (NBT). The absorbance was recorded at 560 nm. One unit of SOD activity was defined as the amount of enzyme required for 50% inhibition of NBT reduction. Catalase (CAT, U g−1 DW) activity was assayed following the monitoring of the decrease in absorbance at 240 nm over 2 min after the initiation of the reaction. Ascorbate peroxidase (APX, U g−1 DW) activity was determined by measuring the H2O2-dependent oxidation rate of ascorbic acid (AsA) over 1 min, according to the method described in [90].

4.6. Determination of Anthocyanins and Total Phenolic Content

The anthocyanins were determined according to the method described in [91]. Anthocyanin concentrations were determined spectrophotometrically by measuring the absorbances at 536 nm and 600 nm and expressed as mg of cyanidin-3-glucoside equivalent per g DW using the molar extinction coefficient of 33,000 mM−1 cm−1.
The total phenolic content (TPC) was determined using 10% Folin–Ciocalteu’s reagent as described in [92]. The absorbance was recorded spectrophotometrically at 765 nm, and the TPC values were expressed as mg gallic acid (GAE) per g DW.

4.7. Pulse Amplitude-Modulated Chlorophyll a Fluorescence Measurements

Pulse Amplitude-Modulated (PAM) chlorophyll a fluorescence was measured with a fluorometer (Model 101/103, Walz GmbH, Effeltrich, Germany) following an established procedure [80]. Prior to measurements, leaves were dark-adapted for 20 min. The minimum fluorescence in the dark (Fo) was recorded using modulated measuring light (1.6 kHz, 0.02 µmol m−2 s−1). The maximal dark-adapted fluorescence (Fm) was obtained with a saturating pulse (3000 µmol m−2 s−1, 0.8 s). Actinic illumination (150 µmol m−2 s−1) was applied using a Schott KL 1500 light source (Schott Glaswerke, Mainz, Germany), and steady-state fluorescence (Fs) was recorded. During illumination, saturating pulses were applied every 60 s to determine maximal light-adapted fluorescence (Fm′). The several photosynthetic parameters were used to evaluate PSII photochemistry (Table 4).
Non-photochemical quenching (NPQ) was analyzed by separating its major components: energy-dependent quenching (qE), state-transition quenching (qT) and photoinhibitory quenching (qI) (Table 4). After illumination, plants were returned to darkness, and fluorescence relaxation kinetics were followed for 15 min using saturating pulses at 1, 2, 3, 4, 5, 10, and 15 min to obtain Fm2 and Fm15, corresponding to the fast (2 min) and slow (15 min) phases of NPQ relaxation. The NPQ components were quantified from the decline in NPQ during dark relaxation using the following expressions from [93,94]:
qE = (Fm2 − Fm’)/Fm’
qT = (Fm15 − Fm2)/Fm2
qI = (Fm − Fm15)/Fm15
The chlorophyll fluorescence decay ratio (RFd) was calculated as RFd = Fd/Fs, where Fd is the decline from Fm to Fs under continuous saturating light [95].
PSII photochemical efficiency was evaluated using selected fluorescence parameters shown in Table 4.
Fluorescence relaxation kinetics in dark-adapted leaves were evaluated following excitation with a saturating light pulse (3000 µmol photons m−2 s−1). The relaxation curves could be fitted by two components (fast and slow components). The times of fast (t1) and slow (t2) components and the ratio of their amplitudes (A1/A2) were determined. The fast component characterizes the reoxidation of QA through the plastoquinone pool, whereas the slower phase is linked to the recombination reactions associated with the S2 and S3 states of the oxygen-evolving complex [80].

4.8. Chlorophyll a Fluorescence Induction

OJIP transients were recorded to evaluate the effect of treatment with HA (1, 3, or 5 mg/mL) on the function of the photosynthetic apparatus under PEG-induced stress. Measurements were performed using a Handy PEA+ fluorimeter (Hansatech Instruments, King’s Lynn, UK), and fluorescence induction curves were analyzed with the PEA Plus software (v.1.13). Before each measurement, leaves were dark-adapted for 15 min. A saturating light pulse of 3200 µmol photons m−2 s−1 was then applied to induce the OJIP fluorescence rise. All measurements were taken from mature basil leaves. The OJIP transients were processed to obtain a comprehensive set of JIP-test parameters, summarized in Table 4.

4.9. P700 Photooxidation Measurements

Photooxidation of P700 (P700+) in leaves was assessed using a dual-wavelength detection system operating at 820 nm (ED 700DW-E, Walz, Effeltrich, Germany) coupled to a PAM-101E control unit in the reflectance mode, following the protocol as in [96]. The leaves were dark-adapted for 20 min before measurements. P700 oxidation was induced by far-red (FR) light provided by a 102-FR emitter (Walz GmbH, Effeltrich, Germany). Changes in P700 redox state were monitored as absorbance variations at 820 nm (ΔA) during FR exposure. From these measurements, the relative absorbance change (ΔA/A) was calculated, and the kinetics of P700+ reduction in darkness were analyzed. The decay of signal was deconvoluted into two exponential components characterized by fast and slow times (t1P700 and t2P700) along with respective amplitudes (A1P700 and A2P700) as described previously in [97].
Table 4. Chlorophyll a fluorescence parameters (PAM and JIP test) defined according to the methodologies described in [81,93,98,99,100,101].
Functional GroupParameter and Description
PAM parameters
Variable Fluorescence and Derived RatiosFv = Fm − Fo—variable fluorescence
Fv/Fm—maximum quantum efficiency of PSII photochemistry in dark-adapted state
Fv/Fo = (Fm − Fo)/Fo—balance between photochemical and non-photochemical processes
Fv′ = Fm′ − Fo′—variable fluorescence in light-adapted state (if Fo′ is measured or estimated)
Quantum Yields of PSIIΦPSII = (Fm′ − Fs)/Fm′—effective quantum yield
ΦNO = Fs/Fm—non-regulated energy dissipation
ΦNPQ = (Fs/Fm′) − (Fs/Fm)—regulated energy dissipation via NPQ mechanisms.
Photochemical QuenchingqP = (Fm′ − Fs)/Fv′—photochemical quenching coefficient, fraction of open PSII reaction centers
Non-Photochemical Quenching ComponentsqE—energy-dependent quenching (ΔpH-dependent)
qT—state-transition quenching
qI—photoinhibitory quenching
Fluorescence-Based Physiological IndicatorsRFd = Fd/Fs—fluorescence decay ratio, proxy for photosynthetic performance and vitality
JIP parameters
Vj—relative variable fluorescence at the J-step
Energy fluxes per reaction centerABS/RC = 1/φPo—absorbed energy flux
DIo/RC = (1 − φPo)/φPo—energy dissipated as heat
ETo/RC= ψ (Eo)/φPo—electron transport flux from QA to QB
REo/RC= (ψ (Eo) × δ (Ro))/φPo—electron flux reaching PSI end acceptors
Quantum yieldφEo—quantum yield of electron transport beyond QA
Performance indicesPIABS—based on absorption and PSII efficiency
PIABS = γ(RC)/(1 − γ(RC)) × φPo/(1 − φPo) × ψ (Eo)/(1 − ψ(Eo))
PItotal—total, including PSI contribution
PItotal = PIABS × δ (Ro)/(1 − δ (Ro))
Structural/derived
PI components
γ(RC)/(1 − γ(RC))—ratio of active reaction centers to total chlorophyll
φPo/(1 − φPo)—maximum of primary photochemistry
ψ(Eo)/(1 − ψ(Eo))—probability of electron transport beyond QA
δ(Ro)/(1 − δ(Ro))—efficiency/probability with which an electron from the intersystem electron carriers is transferred to reduce end electron acceptors at the PSI acceptor side

4.10. Statistical Analysis

Data are expressed as mean ± standard error (SE), obtained from two independent experiments with four biological replicates per treatment (n = 8). The statistical effects of the PEG+HA treatments were assessed using analysis of variance (ANOVA). When significant differences were detected, Tukey’s post hoc test was applied for multiple comparisons among means. Prior to analysis, data were examined to confirm normal distribution and homogeneity of variances. Statistical significance was accepted at p < 0.05. All calculations were performed using OriginPro 9.0 (OriginLab Corporation, Northampton, MA, USA).

5. Conclusions

The present study contributes to the expansion and deepening of existing knowledge on HA-mediated drought mitigation by providing a detailed mechanistic analysis of the protective effects of HA on the functions of photosynthetic apparatus and the related defense processes playing a regulatory role in basil plants exposed to PEG-induced drought stress. Drought stress caused substantial damage to both PSII and PSI. The inhibition of PSII photochemistry resulted from alterations in its donor and acceptor sides. Drought-induced changes at the acceptor side influenced QA reoxidation, consistent with a restriction of the interaction between QA and plastoquinone, reduced electron transport (ETR, REo/RC), and produced pronounced declines in performance indices (PIABS, PItotal). The decreased efficiency of the photosynthetic apparatus after PEG treatment was further associated with elevated oxidative stress (H2O2), enhanced lipid peroxidation, reduced RWC, and altered pigment composition, all of which correspond to a disruption of the membrane integrity. The data also highlight the influence of both PSI subpopulations under drought stress. The protective effect of foliar HA was strongly dose-dependent, with lower concentrations having negligible effects on basil plants. The foliar spraying of 5 mg/mL HA markedly protects the primary processes of photosynthesis by preventing PEG-induced disruptions in the PSII donor and acceptor sides. This protection corresponded with improved QA reoxidation by plastoquinone and enhanced electron transport efficiency toward the end PSI acceptors. Performance indices clearly reflected the mitigating role of HA on the photosynthetic apparatus under PEG-induced drought stress. At the same time, HA stimulated the activity of antioxidant enzymes (CAT, SOD, APX) and decreased oxidative stress markers (H2O2 and MDA). These findings indicate that HA-induced modulation of antioxidant enzymes and stabilization of the photosynthetic apparatus occurred simultaneously, with each process reinforcing the other under drought stress.

Supplementary Materials

The following supporting information can be downloaded at: https://www.mdpi.com/article/10.3390/plants15101491/s1, Table S1. Influence of different HA concentrations (1, 3 and 5 mg/mL) under PEG-induced drought stress on the components of the performance indices PIABS and PItotal.

Author Contributions

Conceptualization, E.L.A.; methodology, G.D.R., M.A.S., A.G.D. and E.L.A.; software, G.D.R. and M.A.S.; validation, E.L.A.; formal analysis, E.L.A.; investigation, G.D.R., M.A.S., P.B.B., A.G.D. and E.L.A.; writing—original draft preparation, E.L.A.; writing—review and editing, G.D.R., M.A.S., A.G.D. and E.L.A.; visualization, G.D.R. and M.A.S.; supervision, E.L.A. All authors have read and agreed to the published version of the manuscript.

Funding

This work was financially supported by Bulgarian Science Fund under project KΠ-06-M76/3.

Data Availability Statement

The original contributions presented in this study are included in the article/Supplementary Material. Further inquiries can be directed to the corresponding author.

Conflicts of Interest

The authors declare no conflicts of interest.

Abbreviations

APXAscorbate peroxidase
Car Carotenoids
CATCatalase
Chl aChlorophyll a
Chl bChlorophyll b
HAHumic acid
H2O2Hydrogen peroxide
LHCLight-harvesting complex
MDAMalondialdehyde
MSIMembrane stability index
PEGPolyethylene glycol
PSIPhotosystem I
PSIIPhotosystem II
ROSReactive oxygen species
RWCRelative water content
SODSuperoxide dismutase
TPCTotal phenolic content

References

  1. Wahab, A.; Abdi, G.; Saleem, M.H.; Ali, B.; Ullah, S.; Shah, W.; Mumtaz, S.; Yasin, G.; Muresan, C.C.; Marc, R.A. Plants’ physio-biochemical and phyto-hormonal responses to alleviate the adverse effects of drought stress: A comprehensive review. Plants 2022, 11, 1620. [Google Scholar] [CrossRef]
  2. Razi, K.; Muneer, S. Drought stress-induced physiological mechanisms, signaling pathways and molecular response of chloroplasts in common vegetable crops. Crit. Rev. Biotechnol. 2021, 41, 669–691. [Google Scholar] [CrossRef]
  3. Gupta, A.; Rico-Medina, A.; Caño-Delgado, A.I. The physiology of plant responses to drought. Science 2020, 368, 266–269. [Google Scholar] [CrossRef]
  4. Chaves, M.M.; Flexas, J.; Pinheiro, C. Photosynthesis under drought and salt stress: Regulation mechanisms from whole plant to cell. Ann. Bot. 2009, 103, 551–560. [Google Scholar] [CrossRef] [PubMed]
  5. Zahra, N.; Hafeez, M.B.; Kausar, A.; Al Zeidi, M.; Asekova, S.; Siddique, K.H.M.; Farooq, M. Plant photosynthetic responses under drought stress: Effects and management. J. Agron. Crop Sci. 2023, 209, 651–672. [Google Scholar] [CrossRef]
  6. Yang, X.; Lu, M.; Wang, Y.; Wang, Y.; Liu, Z.; Chen, S. Response Mechanism of Plants to Drought Stress. Horticulturae 2021, 7, 50. [Google Scholar] [CrossRef]
  7. Qiao, M.; Hong, C.; Jiao, Y.; Hou, S.; Gao, H. Impacts of drought on photosynthesis in major food crops and the related mechanisms of plant responses to drought. Plants 2024, 13, 1808. [Google Scholar] [CrossRef]
  8. Moustakas, M.; Sperdouli, I.; Adamakis, I.-D.S. Editorial: Reactive oxygen species in chloroplasts and chloroplast antioxidants under abiotic stress. Front. Plant Sci. 2023, 14, 1208247. [Google Scholar] [CrossRef]
  9. Hu, C.; Elias, E.; Nawrocki, W.J.; Croce, R. Drought affects both photosystems in Arabidopsis thaliana. New Phytol. 2023, 240, 663–675. [Google Scholar] [CrossRef]
  10. Sachdev, S.; Ansari, S.A.; Ansari, M.I.; Fujita, M.; Hasanuzzaman, M. Abiotic stress and reactive oxygen species: Generation, signaling, and defense mechanisms. Antioxidants 2021, 10, 277. [Google Scholar] [CrossRef]
  11. Pandey, J.; Devadasu, E.; Saini, D.; Dhokne, K.; Marriboina, S.; Raghavendra, A.S.; Subramanyam, R. Reversible changes in structure and function of photosynthetic apparatus of pea (Pisum sativum) leaves under drought stress. Plant J. 2023, 113, 60–74. [Google Scholar] [CrossRef]
  12. Petrova, N.; Paunov, M.; Stoichev, S.; Todinova, S.; Taneva, S.G.; Goltsev, V.; Krumova, S. Thylakoid membrane reorganization, induced by growth light intensity, affects the plants susceptibility to drought stress. Photosynthetica 2020, 58, 369–378. [Google Scholar] [CrossRef]
  13. Killi, D.; Raschi, A.; Bussotti, F. Lipid Peroxidation and Chlorophyll Fluorescence of Photosystem II Performance during Drought and Heat Stress is Associated with the Antioxidant Capacities of C3 Sunflower and C4 Maize Varieties. Int. J. Mol. Sci. 2020, 21, 4846. [Google Scholar] [CrossRef]
  14. Batra, N.G.; Sharma, V.; Kumari, N. Drought-induced changes in chlorophyll fluorescence, photosynthetic pigments, and thylakoid membrane proteins of Vigna radiata. J. Plant Interact. 2014, 9, 712–721. [Google Scholar] [CrossRef]
  15. Oukarroum, A.; Schansker, G.; Strasser, R.J. Drought stress effects on photosystem I content and photosystem II thermotolerance analyzed using Chl a fluorescence kinetics in barley varieties differing in their drought tolerance. Physiol. Plant. 2009, 137, 188–199. [Google Scholar] [CrossRef] [PubMed]
  16. Stefanov, M.A.; Rashkov, G.D.; Borisova, P.B.; Apostolova, E.L. Changes in photosystem II complex and physiological activities in pea and maize plants in response to salt stress. Plants 2024, 13, 1025. [Google Scholar] [CrossRef]
  17. Takahashi, Y.; Noguchi, K.; Ifuku, K.; Sohtome, T.; Nishimoto, T.; Wada, S.; Sato, T.; Takegahara-Tamakawa, Y.; Miyake, C.; Makino, A.; et al. Effects of drought stress on the oxidation of the reaction center chlorophyll of photosystem I and grain yield in paddy-field grown rice plants. Soil. Sci. Plant Nutr. 2023, 69, 215–220. [Google Scholar] [CrossRef]
  18. Muhammad Aslam, M.; Waseem, M.; Jakada, B.H.; Okal, E.J.; Lei, Z.; Saqib, H.S.A.; Yuan, W.; Xu, W.; Zhang, Q. Mechanisms of Abscisic Acid-Mediated Drought Stress Responses in Plants. Int. J. Mol. Sci. 2022, 23, 1084. [Google Scholar] [CrossRef] [PubMed]
  19. Di Sario, L.; Boeri, P.; Matus, J.T.; Pizzio, G.A. Plant Biostimulants to Enhance Abiotic Stress Resilience in Crops. Int. J. Mol. Sci. 2025, 26, 1129. [Google Scholar] [CrossRef]
  20. Bulgari, R.; Franzoni, G.; Ferrante, A. Biostimulants Application in Horticultural Crops under Abiotic Stress Conditions. Agronomy 2019, 9, 306. [Google Scholar] [CrossRef]
  21. Franzoni, G.; Cocetta, G.; Prinsi, B.; Ferrante, A.; Espen, L. Biostimulants on Crops: Their Impact under Abiotic Stress Conditions. Horticulturae 2022, 8, 189. [Google Scholar] [CrossRef]
  22. Ma, Y.; Freitas, H.; Dias, M.C. Strategies and prospects for biostimulants to alleviate abiotic stress in plants. Front. Plant Sci. 2022, 13, 1024243. [Google Scholar] [CrossRef]
  23. Bhupenchandra, I.; Chongtham, S.K.; Devi, E.L.; R., R.; Choudhary, A.K.; Salam, M.D.; Sahoo, M.R.; Bhutia, T.L.; Devi, S.H.; Thounaojam, A.S.; et al. Role of biostimulants in mitigating the effects of climate change on crop performance. Front. Plant Sci. 2022, 13, 967665. [Google Scholar] [CrossRef] [PubMed]
  24. Aydin, A. Humic acid application alleviate salinity stress of bean (Phaseolus vulgaris L.) plants decreasing membrane leakage. Afr. J. Agric. Res. 2012, 7, 274. [Google Scholar] [CrossRef]
  25. Kıran, S.; Furtana, G.B.; Talhouni, M.; Ellialtıoğlu, Ş.Ş. Drought stress mitigation with humic acid in two Cucumis melo L. genotypes differ in their drought tolerance. Bragantia 2019, 78, 490–497. [Google Scholar] [CrossRef]
  26. Nabi, F.; Sarfaraz, A.; Kama, R.; Kanwal, R.; Li, H. Structure-Based Function of Humic Acid in Abiotic Stress Alleviation in Plants: A Review. Plants 2025, 14, 1916. [Google Scholar] [CrossRef] [PubMed]
  27. Shen, J.; Guo, M.; Wang, Y.; Yuan, X.; Wen, Y.; Song, X.; Dong, S.; Guo, P. Humic acid improves the physiological and photosynthetic characteristics of millet seedlings under drought stress. Plant Signal. Behav. 2020, 15, 1774212. [Google Scholar] [CrossRef]
  28. Altaf, A.; Nawaz, F.; Majeed, S.; Ahsan, M.; Ahmad, K.S.; Akhtar, G.; Shehzad, M.A.; Javeed, H.M.R.; Farman, M. Foliar humic acid and salicylic acid application stimulates physiological responses and antioxidant systems to improve maize yield under water limitations. JSFA Rep. 2023, 3, 119–128. [Google Scholar] [CrossRef]
  29. Chen, Q.; Qu, Z.; Ma, G.; Wang, W.; Dai, J.; Zhang, M.; Wei, Z.; Liu, Z. Humic acid modulates growth, photosynthesis, hormone and osmolytes system of maize under drought conditions. Agric. Water Manag. 2022, 263, 107447. [Google Scholar] [CrossRef]
  30. Abu-Ria, M.E.; Elghareeb, E.M.; Shukry, W.M.; Abo-Hamed, S.A.; Ibraheem, F. Mitigation of drought stress in maize and sorghum by humic acid: Differential growth and physiological responses. BMC Plant Biol. 2024, 24, 514. [Google Scholar] [CrossRef]
  31. Zhi, Y.; Li, X.; Wang, X.; Jia, M.; Wang, Z. Photosynthesis promotion mechanisms of artificial humic acid depend on plant types: A hydroponic study on C3 and C4 plants. Sci. Total Environ. 2024, 917, 170404. [Google Scholar] [CrossRef]
  32. Roy, D.; Sayed, M.Z.I.; Mondal, D.; Bandhan, B.S.; Bahadur, M.M.; Islam, M.R.; Gaber, A.; Kabir, M.P.; Hossain, A.; Pramanik, S.K. Humic acid mediates drought tolerance in wheat through the modulation of morphophysiological traits, leading to improve the grain yield in wheat. Phyton-Int. J. Exp. Bot. 2025, 94, 763–779. [Google Scholar] [CrossRef]
  33. Rostami, Q.; Moghadam, M.; Pouya, E.S.; Ajdanian, L. Effect of humic acid foliar application on some morphophysiological and biochemical properties of green mint (Mentha spicata L.) under drought stress. Environ. Stress. Crop Sci. 2019, 12, Fa95–Fa110. [Google Scholar] [CrossRef]
  34. Aytaç, E.; Ünlü, H.; Erkan, İ.E.; Çelikkol Akçay, U. Humic Acid Mitigates Drought Stress in Tomato. Bilge Int. J. Sci. Technol. Res. 2024, 8, 27–37. [Google Scholar] [CrossRef]
  35. Alsamadany, H. Physiological, biochemical and molecular evaluation of mungbean genotypes for agronomical yield under drought and salinity stresses in the presence of humic acid. Saudi J. Biol. Sci. 2022, 29, 103385. [Google Scholar] [CrossRef]
  36. Jan, J.A.; Nabi, G.; Khan, M.; Ahmad, S.; Shah, P.S.; Hussain, S.; Sehrish, S. Foliar Application of Humic Acid Improves Growth and Yield of Chilli (Capsicum annum L.) Varieties. Pak. J. Agric. Res. 2020, 33, 461–472. [Google Scholar] [CrossRef]
  37. Bisen, D.; Jadhao, S.; Jadhao, S.; Aage, A.; Sonune, B.; Sontakke, S.; Sontakke, S. Effect of foliar spray and soil application of humic acid on yield and uptake of nutrient by cotton grown in vertisol. Int. J. Adv. Biochem. Res. 2024, 8, 847–852. [Google Scholar] [CrossRef]
  38. Nguyen, V.T.; Nguyen, N.Q.; Thi, N.Q.N.; Thi, C.Q.N.; Truc, T.T.; Nghi, P.T.B. Studies on chemical, polyphenol content, flavonoid content, and antioxidant activity of sweet basil leaves (Ocimum basilicum L.). IOP Conf. Ser. Mater. Sci. Eng. 2021, 1092, 012083. [Google Scholar] [CrossRef]
  39. Nadeem, H.R.; Akhtar, S.; Sestili, P.; Ismail, T.; Neugart, S.; Qamar, M.; Esatbeyoglu, T. Toxicity, Antioxidant Activity, and Phytochemicals of Basil (Ocimum basilicum L.) Leaves Cultivated in Southern Punjab, Pakistan. Foods 2022, 11, 1239. [Google Scholar] [CrossRef] [PubMed]
  40. Mulugeta, S.M.; Radácsi, P. Influence of Drought Stress on Growth and Essential Oil Yield of Ocimum Species. Horticulturae 2022, 8, 175. [Google Scholar] [CrossRef]
  41. Mulugeta, S.M.; Sárosi, S.; Radácsi, P. Physio-morphological trait and bioactive constituents of Ocimum species under drought stress. Ind. Crops Prod. 2023, 205, 117545. [Google Scholar] [CrossRef]
  42. Mulugeta, S.M.; Gosztola, B.; Radácsi, P. Morphological and biochemical responses of selected Ocimum species under drought. Herba Pol. 2022, 68, 1–10. [Google Scholar] [CrossRef]
  43. Bukhov, N.G.; Heber, U.; Wiese, C.; Shuvalov, V.A. Energy dissipation in photosynthesis: Does the quenching of chlorophyll fluorescence originate from antenna complexes of photosystem II or from the reaction center? Planta 2001, 212, 749–758. [Google Scholar] [CrossRef]
  44. Shirao, M.; Kuroki, S.; Kaneko, K.; Kinjo, Y.; Tsuyama, M.; Förster, B.; Takahashi, S.; Badger, M.R. Gymnosperms have increased capacity for electron leakage to oxygen (Mehler and PTOX reactions) in photosynthesis compared with angiosperms. Plant Cell Physiol. 2013, 54, 1152–1163. [Google Scholar] [CrossRef] [PubMed]
  45. Canellas, L.P.; Canellas, N.O.A.; da S. Irineu, L.E.S.; Olivares, F.L.; Piccolo, A. Plant chemical priming by humic acids. Chem. Biol. Technol. Agric. 2020, 7, 12. [Google Scholar] [CrossRef]
  46. Nardi, S.; Schiavon, M.; Francioso, O. Chemical structure and biological activity of humic substances define their role as plant growth promoters. Molecules 2021, 26, 2256. [Google Scholar] [CrossRef]
  47. Fernández, V.; Eichert, T. Uptake of hydrophilic solutes through plant leaves: Current state of knowledge and perspectives of foliar fertilization. CRC Crit. Rev. Plant Sci. 2009, 28, 36–68. [Google Scholar] [CrossRef]
  48. Schnitzer, M. Chapter 1 Humic Substances: Chemistry and Reactions. In Developments in Soil Science; Schnitzer, M., Khan, S.U., Eds.; Elsevier: Amsterdam, The Netherlands, 1978; pp. 1–64. [Google Scholar]
  49. Smilkova, M.; Smilek, J.; Kalina, M.; Klucakova, M.; Pekar, M.; Sedlacek, P. A simple technique for assessing the cuticular diffusion of humic acid biostimulants. Plant Methods 2019, 15, 83. [Google Scholar] [CrossRef]
  50. Salehi-Lisar, S.Y.; Bakhshayeshan-Agdam, H. Drought stress in plants: Causes, consequences, and tolerance. Drought Stress Toler. Plants 2016, 1, 1–16. [Google Scholar] [CrossRef]
  51. Bijanzadeh, E.; Emam, Y. Effect of defoliation and drought stress on yield components and chlorophyll content of wheat. Pak. J. Biol. Sci. 2010, 13, 699–705. [Google Scholar] [CrossRef]
  52. Din, J.; Khan, S.U.; Ali, I.; Gurmani, A.R. Physiological and agronomic response of canola varieties to drought stress. J. Anim. Plant Sci. 2011, 21, 78–82. [Google Scholar]
  53. Stefanov, M.; Rashkov, G.; Borisova, P.; Apostolova, E. Sensitivity of the photosynthetic apparatus in maize and sorghum under different drought levels. Plants 2023, 12, 1863. [Google Scholar] [CrossRef]
  54. Ma, Y.; Dias, M.C.; Freitas, H. Drought and salinity stress responses and microbe-induced tolerance in plants. Front. Plant Sci. 2020, 11, 591911. [Google Scholar] [CrossRef]
  55. Dai, L.; Li, J.; Harmens, H.; Zheng, X.; Zhang, C. Melatonin enhances drought resistance by regulating leaf stomatal behaviour, root growth and catalase activity in two contrasting rapeseed (Brassica napus L.) genotypes. Plant Physiol. Biochem. 2020, 149, 86–95. [Google Scholar] [CrossRef]
  56. Chen, W.; Miao, Y.; Ayyaz, A.; Hannan, F.; Huang, Q.; Ulhassan, Z.; Zhou, Y.; Islam, F.; Hong, Z.; Farooq, M.A.; et al. Purple stem Brassica napus exhibits higher photosynthetic efficiency, antioxidant potential and anthocyanin biosynthesis related genes expression against drought stress. Front. Plant Sci. 2022, 13, 936696. [Google Scholar] [CrossRef]
  57. Lata, C.; Jha, S.; Dixit, V.; Sreenivasulu, N.; Prasad, M. Differential antioxidative responses to dehydration-induced oxidative stress in core set of foxtail millet cultivars Setaria italica (L.). Protoplasma 2011, 248, 817–828. [Google Scholar] [CrossRef]
  58. Gupta, S.; Gupta, N.K.; Arora, A.; Agarwal, V.P.; Purohit, A.K. Effect of water stress on photosynthetic attributes, membrane stability and yield in contrasting wheat genotypes. Indian J. Plant Physiol. 2012, 17, 22–27. [Google Scholar]
  59. Chowdhury, J.; Karim, M.; Khaliq, Q.; Ahmed, A. Effect of drought stress on bio-chemical change and cell membrane stability of soybean genotypes. Bangladesh J. Agric. Res. 2017, 42, 475–485. [Google Scholar] [CrossRef]
  60. Rakkammal, K.; Pandian, S.; Maharajan, T.; Antony Ceasar, S.; Sohn, S.-I.; Ramesh, M. Humic acid regulates gene expression and activity of antioxidant enzymes to inhibit the salt-induced oxidative stress in finger millet. Cereal Res. Commun. 2024, 52, 397–411. [Google Scholar] [CrossRef]
  61. Yildiztugay, E.; Ozfidan-Konakci, C.; Elbasan, F.; Yildiztugay, A.; Kucukoduk, M. Humic acid protects against oxidative damage induced by cadmium toxicity in wheat (Triticum aestivum) roots through water management and the antioxidant defence system. Bot. Serbica 2019, 43, 161–173. [Google Scholar] [CrossRef]
  62. Sgherri, C.L.M.; Maffei, M.; Navari-Izzo, F. Antioxidative enzymes in wheat subjected to increasing water deficit and rewatering. J. Plant Physiol. 2000, 157, 273–279. [Google Scholar] [CrossRef]
  63. Amerian, M.; Palangi, A.; Gohari, G.; Ntatsi, G. Humic acid and grafting as sustainable agronomic practices for increased growth and secondary metabolism in cucumber subjected to salt stress. Sci. Rep. 2024, 14, 15883. [Google Scholar] [CrossRef]
  64. De Gregorio, M.A.; Zengin, G.; Alp-Turgut, F.N.; Elbasan, F.; Ozfidan-Konakci, C.; Arikan, B.; Yildiztugay, E.; Zhang, L.; Lucini, L. Glutamate, humic acids and their combination modulate the phenolic profile, antioxidant traits, and enzyme-inhibition properties in lettuce. Plants 2023, 12, 1822. [Google Scholar] [CrossRef]
  65. Stefanov, M.A.; Rashkov, G.D.; Apostolova, E.L.; Borisova, P.B.; Dobrikova, A.G. Differential photosynthetic responses of green and purple basil to drought stress and recovery: The protective role of anthocyanins. Plants 2026, 15, 572. [Google Scholar] [CrossRef]
  66. Ozfidan-Konakci, C.; Yildiztugay, E.; Bahtiyar, M.; Kucukoduk, M. The humic acid-induced changes in the water status, chlorophyll fluorescence and antioxidant defense systems of wheat leaves with cadmium stress. Ecotoxicol. Environ. Saf. 2018, 155, 66–75. [Google Scholar] [CrossRef]
  67. Barboričová, M.; Filaček, A.; Mlynáriková Vysoká, D.; Gašparovič, K.; Živčák, M.; Brestič, M. Sensitivity of fast chlorophyll fluorescence parameters to combined heat and drought stress in wheat genotypes. Plant Soil. Environ. 2022, 68, 309–316. [Google Scholar] [CrossRef]
  68. Fghire, R.; Anaya, F.; Ali, O.I.; Benlhabib, O.; Ragab, R.; Wahbi, S. Physiological and photosynthetic response of quinoa to drought stress. Chil. J. Agric. Res. 2015, 75, 174–183. [Google Scholar] [CrossRef]
  69. Fahad, S.; Bajwa, A.A.; Nazir, U.; Anjum, S.A.; Farooq, A.; Zohaib, A.; Sadia, S.; Nasim, W.; Adkins, S.; Saud, S.; et al. Crop production under drought and heat stress: Plant responses and management options. Front. Plant Sci. 2017, 8, 1147. [Google Scholar] [CrossRef]
  70. Georgieva, K.; Maslenkova, L.; Peeva, V.; Markovska, Y.; Stefanov, D.; Tuba, Z. Comparative study on the changes in photosynthetic activity of the homoiochlorophyllous desiccation-tolerant Haberlea Rhodopensis and desiccation-sensitive spinach leaves during desiccation and rehydration. Photosynth. Res. 2005, 85, 191–203. [Google Scholar] [CrossRef]
  71. Kawakami, K.; Umena, Y.; Kamiya, N.; Shen, J.R. Location of chloride and its possible functions in oxygen-evolving photosystem II revealed by X-ray crystallography. Proc. Natl. Acad. Sci. USA 2009, 106, 8567–8572. [Google Scholar] [CrossRef]
  72. Huseynova, I.M.; Rustamova, S.M.; Suleymanov, S.Y.; Aliyeva, D.R.; Mammadov, A.C.; Aliyev, J.A. Drought-induced changes in photosynthetic apparatus and antioxidant components of wheat (Triticum durum Desf.) varieties. Photosynth. Res. 2016, 130, 215–223. [Google Scholar] [CrossRef]
  73. Wang, Z.; Li, G.; Sun, H.; Ma, L.; Guo, Y.; Zhao, Z.; Gao, H.; Mei, L. Effects of drought stress on photosynthesis and photosynthetic electron transport chain in young apple tree leaves. Biol. Open 2018, 7, bio035279. [Google Scholar] [CrossRef]
  74. Ruban, A.V.; Johnson, M.P.; Duffy, C.D.P. The photoprotective molecular switch in the photosystem II antenna. Biochim. Biophys. Acta-Bioenerg. 2012, 1817, 167–181. [Google Scholar] [CrossRef]
  75. Guidi, L.; Lo Piccolo, E.; Landi, M. Chlorophyll fluorescence, photoinhibition and abiotic stress: Does it make any difference the fact to be a C3 or C4 species? Front. Plant Sci. 2019, 10, 174. [Google Scholar] [CrossRef]
  76. Albertsson, P.Å. The structure and function of the chloroplast photosynthetic membrane—A model for the domain organization. Photosynth. Res. 1995, 46, 141–149. [Google Scholar] [CrossRef]
  77. Yanhui, C.; Hongrui, W.; Beining, Z.; Shixing, G.; Zihan, W.; Yue, W.; Huihui, Z.; Guangyu, S. Elevated air temperature damage to photosynthetic apparatus alleviated by enhanced cyclic electron flow around photosystem I in tobacco leaves. Ecotoxicol. Environ. Saf. 2020, 204, 111136. [Google Scholar] [CrossRef]
  78. Huang, W.; Yang, Y.-J.; Zhang, S.-B. Specific roles of cyclic electron flow around photosystem I in photosynthetic regulation in immature and mature leaves. J. Plant Physiol. 2017, 209, 76–83. [Google Scholar] [CrossRef]
  79. Deák, Z.; Sass, L.; Kiss, É.; Vass, I. Characterization of wave phenomena in the relaxation of flash-induced chlorophyll fluorescence yield in cyanobacteria. Biochim. Biophys. Acta-Bioenerg. 2014, 1837, 1522–1532. [Google Scholar] [CrossRef]
  80. Stefanov, M.; Yotsova, E.; Rashkov, G.D.; Ivanova, K.; Markovska, Y.; Apostolova, E.L. Effects of salinity on the photosynthetic apparatus of two Paulownia lines. Plant Physiol. Biochem. 2016, 101, 54–59. [Google Scholar] [CrossRef]
  81. Stefanov, M.A.; Rashkov, G.D.; Yotsova, E.K.; Borisova, P.B.; Dobrikova, A.G.; Apostolova, E.L. Different sensitivity levels of the photosynthetic apparatus in Zea mays L. and Sorghum bicolor L. under salt stress. Plants 2021, 10, 1469. [Google Scholar] [CrossRef]
  82. Lotfi, R.; Kalaji, H.M.; Valizadeh, G.R.; Khalilvand Behrozyar, E.; Hemati, A.; Gharavi-Kochebagh, P.; Ghassemi, A. Effects of humic acid on photosynthetic efficiency of rapeseed plants growing under different watering conditions. Photosynthetica 2018, 56, 962–970. [Google Scholar] [CrossRef]
  83. Dai, L.-P.; Xiong, Z.-T.; Huang, Y.; Li, M.-J. Cadmium-induced changes in pigments, total phenolics, and phenylalanine ammonia-lyase activity in fronds of Azolla imbricata. Environ. Toxicol. 2006, 21, 505–512. [Google Scholar] [CrossRef]
  84. Lichtenthaler, H.K. Chlorophylls and carotenoids: Pigments of photosynthetic biomembranes. Methods Enzymol. 1987, 148, 350–382. [Google Scholar] [CrossRef]
  85. Barrs, H.; Weatherley, P. A re-examination of the relative turgidity technique for estimating water deficits in leaves. Aust. J. Biol. Sci. 1962, 15, 413–428. [Google Scholar] [CrossRef]
  86. Dobrikova, A.; Apostolova, E.; Adamakis, I.-D.S.; Hanć, A.; Sperdouli, I.; Moustakas, M. Combined impact of excess zinc and cadmium on elemental uptake, leaf anatomy and pigments, antioxidant capacity, and function of photosynthetic apparatus in clary sage (Salvia sclarea L.). Plants 2022, 11, 2407. [Google Scholar] [CrossRef] [PubMed]
  87. Stewart, R.R.C.; Bewley, J.D. Lipid peroxidation associated with accelerated aging of soybean axes. Plant Physiol. 1980, 65, 245–248. [Google Scholar] [CrossRef]
  88. Alexieva, V.; Sergiev, I.; Mapelli, S.; Karanov, E. The effect of drought and ultraviolet radiation on growth and stress markers in pea and wheat. Plant Cell Environ. 2001, 24, 1337–1344. [Google Scholar] [CrossRef]
  89. Chen, T.; Zhang, B. Measurements of Proline and Malondialdehyde Content and Antioxidant Enzyme Activities in Leaves of Drought Stressed Cotton. Bio-Protocol 2016, 6, e1913. [Google Scholar] [CrossRef]
  90. Kumar, P. Measurement of Ascorbate Peroxidase Activity in Sorghum. Bio-Protocol 2022, 12, e4531. [Google Scholar] [CrossRef]
  91. Hodges, M.D.; Nozzolillo, C. Anthocyanin and Anthocyanoplast Content of Cruciferous Seedlings Subjected to Mineral Nutrient Deficiencies. J. Plant Physiol. 1996, 147, 749–754. [Google Scholar] [CrossRef]
  92. Dobrikova, A.; Apostolova, E.; Hanć, A.; Yotsova, E.; Borisova, P.; Sperdouli, I.; Adamakis, I.-D.S.; Moustakas, M. Tolerance mechanisms of the aromatic and medicinal plant Salvia sclarea L. to excess zinc. Plants 2021, 10, 194. [Google Scholar] [CrossRef]
  93. Guadagno, C.R.; Virzo De Santo, A.; D’Ambrosio, N. A revised energy partitioning approach to assess the yields of non-photochemical quenching components. Biochim. Biophys. Acta-Bioenerg. 2010, 1797, 525–530. [Google Scholar] [CrossRef]
  94. Müller, P.; Li, X.-P.; Niyogi, K.K. Non-Photochemical Quenching. A Response to Excess Light Energy. Plant Physiol. 2001, 125, 1558–1566. [Google Scholar] [CrossRef] [PubMed]
  95. Lichtenthaler, H.K.; Buschmann, C.; Knapp, M. How to correctly determine the different chlorophyll fluorescence parameters and the chlorophyll fluorescence decrease ratio RFd of leaves with the PAM fluorometer. Photosynthetica 2005, 43, 379–393. [Google Scholar] [CrossRef]
  96. Dankov, K.; Busheva, M.; Stefanov, D.; Apostolova, E.L. Relationship between the degree of carotenoid depletion and function of the photosynthetic apparatus. J. Photochem. Photobiol. B Biol. 2009, 96, 49–56. [Google Scholar] [CrossRef]
  97. Jin, M.-X.; Yao, Z.-J.; Mi, H. Multi-phasic kinetics of P700+ dark re-reduction in Nicotiana tabacum. Photosynthetica 2001, 39, 419–425. [Google Scholar] [CrossRef]
  98. Roháček, K. Chlorophyll fluorescence parameters: The definitions, photosynthetic meaning, and mutual relationships. Photosynthetica 2002, 40, 13–29. [Google Scholar] [CrossRef]
  99. Genty, B.; Briantais, J.M.; Baker, N.R. The relationship between the quantum yield of photosynthetic electron transport and quenching of chlorophyll fluorescence. Biochim. Biophys. Acta-Gen. Subj. 1989, 990, 87–92. [Google Scholar] [CrossRef]
  100. Lichtenthaler, H.K.; Langsdorf, G.; Lenk, S.; Buschmann, C. Chlorophyll fluorescence imaging of photosynthetic activity with the flash-lamp fluorescence imaging system. Photosynthetica 2005, 43, 355–369. [Google Scholar] [CrossRef]
  101. Strasser, R.J.; Srivastava, A.; Tsimilli-Michael, M. The Fluorescence Transient as a Tool to Characterize and Screen Photosynthetic Samples. In Probing Photosynthesis: Mechanism, Regulation & Adaptation; Yunus, M., Pathre, E., Mohanty, P., Eds.; Taylor & Francis: London, UK, 2000; pp. 445–483. [Google Scholar]
Figure 1. Influence of HA (1, 3 and 5 mg/mL) on (a) the membrane stability index (MSI) and (b) relative water content (RWC) of basil leaves under PEG-induced drought stress. The variants are labeled as follows: control; PEG treatment without HA (PEG); PEG treatment with 1 mg/mL HA (PEG+HA1); PEG treatment with 3 mg/mL HA (PEG+HA3) and PEG treatment with 5 mg/mL HA (PEG+HA5). The different letters show significant differences between the variants for the respective parameter at p < 0.05.
Plants 15 01491 g001
Figure 2. Influence of HA (1, 3 and 5 mg/mL) on the content of H2O2 (a) and MDA (b) in basil leaves under PEG-induced drought stress. The variants are labeled as follows: control; PEG treatment without HA (PEG); PEG treatment with 1 mg/mL HA (PEG+HA1); PEG treatment with 3 mg/mL HA (PEG+HA3) and PEG treatment with 5 mg/mL HA (PEG+HA5). Different letters show significant differences between the studied variants for the respective parameter at p < 0.05.
Plants 15 01491 g002
Figure 3. Activities of antioxidant enzymes: (a) superoxide dismutase (SOD), (b) catalase (CAT) and (c) ascorbate peroxidase (APX) in basil leaves under PEG-induced stress and HA application. The variants are labeled as follows: control; PEG treatment without HA (PEG); PEG treatment with 1 mg/mL HA (PEG+HA1); PEG treatment with 3 mg/mL HA (PEG+HA3) and PEG treatment with 5 mg/mL HA (PEG+HA5). Data are presented as mean values (±SE). Different letters indicate significant differences between variants (p < 0.05) for the respective enzymes.
Plants 15 01491 g003
Figure 4. Influence of different HA concentrations (1, 3 and 5 mg/mL) on the content of anthocyanins (mg g−1 DW) (a) and TPC (mg g−1 DW) (b) in basil leaves under PEG-induced drought stress. The variants are labeled as follows: control; PEG treatment without HA (PEG); PEG treatment with 1 mg/mL HA (PEG+HA1); PEG treatment with 3 mg/mL HA (PEG+HA3) and PEG treatment with 5 mg/mL HA (PEG+HA5). Data are presented as mean values (±SE). Different letters indicate significant differences between variants (p < 0.05) for the respective parameters.
Plants 15 01491 g004
Figure 5. Influence of different HA concentrations (1, 3 and 5 mg/mL) under PEG-induced drought stress on the selected PAM parameters: (a) the maximum quantum yield of PSII (Fv/Fm); (b) the ratio of the photochemical to non-photochemical processes (Fv/Fo); (c) the coefficient of photochemical quenching (qP) and (d) the chlorophyll fluorescence decay ratio RFd. The variants are labeled as follows: control; PEG treatment without HA (PEG); PEG treatment with 1 mg/mL HA (PEG+HA1); PEG treatment with 3 mg/mL HA (PEG+HA3) and PEG treatment with 5 mg/mL HA (PEG+HA5). Different letters indicate significant differences between variants (p < 0.05) for the respective parameter.
Plants 15 01491 g005
Figure 6. Influence of different HA concentrations (1, 3 and 5 mg/mL) under PEG-induced drought stress on the effective quantum yield of photochemical energy conversion of PSII (ΦPSII), the non-regulated energy losses (ΦNO) and the regulated energy losses (ΦNPQ). The variants are labeled as follows: control; PEG treatment without HA (PEG); PEG treatment with 1 mg/mL HA (PEG+HA1); PEG treatment with 3 mg/mL HA (PEG+HA3) and PEG treatment with 5 mg/mL HA (PEG+HA5). Different letters indicate significant differences between variants (p < 0.05) for the respective parameters.
Plants 15 01491 g006
Figure 7. Influence of different HA concentrations (1, 3 and 5 mg/mL) under PEG-induced drought stress on the components of the non-photochemical quenching in green basil: (a) photoinhibitory quenching (qI), (b) state-transition quenching (qT), and (c) energy-dependent quenching (qE). The variants are labeled as follows: control; PEG treatment without HA (PEG); PEG treatment with 1 mg/mL HA (PEG+HA1); PEG treatment with 3 mg/mL HA (PEG+HA3), and PEG treatment with 5 mg/mL HA (PEG+HA5). Different letters indicate significant differences between variants (p < 0.05) for the respective parameters.
Plants 15 01491 g007
Figure 8. Selected JIP parameters of basil plants under PEG treatment and HA applied at concentrations of 1, 3, and 5 mg/mL: (a) relative variable fluorescence at the J step, indicating the reduction state of QA (Vj); (b) dissipated energy flux per reaction center (DIo/RC); (c) absorption flux per reaction center (ABS/RC); (d) electron transport flux from QA to QB per PSII (ETo/RC); (e) electron flux reducing end acceptors at the PSI acceptor side (REo/RC); and (f) quantum yield of electron transport (φEo). The variants are labeled as follows: control; PEG treatment without HA (PEG); PEG treatment with 1 mg/mL HA (PEG+HA1); PEG treatment with 3 mg/mL HA (PEG+HA3) and PEG treatment with 5 mg/mL HA (PEG+HA5). Mean values (±SE) were calculated from 20 independent measurements. All parameters are expressed in relative units. Different letters indicate significant differences between variants for the respective parameters at p < 0.05.
Plants 15 01491 g008
Figure 9. Performance indices of basil plants under PEG-induced drought stress and HA applied at concentrations of 1, 3, and 5 mg/mL: (a) performance index on an absorption basis (PIABS) and (b) total performance index (PItotal). The variants are labeled as follows: control; PEG treatment without HA (PEG); PEG treatment with 1 mg/mL HA (PEG+HA1); PEG treatment with 3 mg/mL HA (PEG+HA3) and PEG treatment with 5 mg/mL HA (PEG+HA5). Mean values (±SE) were calculated from 5 independent measurements (n = 20). All parameters are expressed in relative units. Different letters indicate significant differences between variants for the respective parameters at p < 0.05.
Plants 15 01491 g009
Table 1. Influence of HA (1, 3 and 5 mg/mL) on chlorophyll a (Chl a), chlorophyll b (Chl b), and carotenoids (Car). The variants are labeled as follows: control; PEG treatment without HA (PEG); PEG treatment with 1 mg/mL HA (PEG+HA1); PEG treatment with 3 mg/mL HA (PEG+HA3) and PEG treatment with 5 mg/mL HA (PEG+HA5). Different letters show significant differences in the respective parameter at p < 0.05.
VariantChl a (mg/g DW)Chl b (mg/g DW)Car (mg/g DW)
Control19.99 ± 1.01 a5.66 ± 0.28 a5.09 ± 0.25 b
PEG16.00 ± 1.33 b4.86 ± 0.25 a4.29 ± 0.17 c
PEG+HA116.10 ± 2.68 b4.61 ± 0.42 a4.47 ± 0.76 bc
PEG+HA316.56 ± 1.55 b5.33 ± 0.41 a4.52 ± 0.40 bc
PEG+HA522.60 ± 2.22 a6.12 ± 0.57 a6.20 ± 0.52 a
Table 2. Influence of HA (1, 3, and 5 mg/mL) on the dark relaxation of chlorophyll fluorescence induced by a single saturating light pulse in the leaves of green basil under PEG treatment. The following parameters are characterized: t1—the time constant of the fast component (A1); t2—the time constant of the slow component (A2); and A1/A2—the ratio of the amplitudes of the fast and slow components. The variants are labeled as follows: control; PEG treatment without HA (PEG); PEG treatment with 1 mg/mL HA (PEG+HA1); PEG treatment with 3 mg/mL HA (PEG+HA3) and PEG treatment with 5 mg/mL HA (PEG+HA5). Different letters indicate significant differences between variants for the respective parameters at p < 0.05.
Variantt1 (s)t2 (s)A1/A2
Control0.513 ± 0.037 b17.920 ± 0.688 a7.446 ± 0.293 a
PEG0.672 ± 0.041 a15.613 ± 0.076 b6.411 ± 0.221 c
PEG+HA10.613 ± 0.027 ab17.537 ± 0.365 a6.261 ± 0.387 c
PEG+HA30.613 ± 0.031 ab17.297 ± 0.708 a6.506 ± 0.302 bc
PEG+HA50.561 ± 0.020 b17.876 ± 0.876 a7.128 ± 0.118 ab
Table 3. Influence of HA (1, 3 and 5 mg/mL) on the relative changes in P700+ (ΔA/A), the fast and slow time constants (t1P700 and t2P700) and the ratio of the amplitudes of the fast and slow components (A1P700/A2P700) of P700+ dark reduction in basil under PEG-induced drought stress. The variants are labeled as follows: control; PEG treatment without HA (PEG); PEG treatment with 1 mg/mL HA (PEG+HA1); PEG treatment with 3 mg/mL HA (PEG+HA3) and PEG treatment with 5 mg/mL HA (PEG+HA5). The different letters show significant differences between variants in the respective parameter at p < 0.05.
Variantt1P700 (s)t2P700 (s)A1P700/A2P700ΔA/A
Control2.778 ± 0.386 a34.483 ± 1.189 b3.03 ± 0.48 a9.79 ± 0.48 a
PEG2.041 ± 0.250 b41.667 ± 3.472 a1.52 ± 0.22 b7.93 ± 0.40 c
PEG+HA12.941 ± 0.346 a27.778 ± 2.315 c2.16 ± 0.31 b9.14 ± 0.27 b
PEG+HA32.941 ± 0.173 a35.714 ± 1.276 b2.02 ± 0.06 b9.22 ± 0.30 b
PEG+HA52.439 ± 0.119 a35.714 ± 1.276 b2.53 ± 0.21 a9.10 ± 0.27 b
Disclaimer/Publisher’s Note: The statements, opinions and data contained in all publications are solely those of the individual author(s) and contributor(s) and not of MDPI and/or the editor(s). MDPI and/or the editor(s) disclaim responsibility for any injury to people or property resulting from any ideas, methods, instructions or products referred to in the content.