Article

Genome-Wide Identification and Characterization of Basic Pentacysteine Transcription Factors in Brassica napus

1
Shaanxi Key Laboratory of Crop Heterosis, College of Agronomy, Northwest A&F University, Yangling 712100, China
2
Department of Ecological and Environmental Engineering, Yangling Vocational & Technical College, Yangling 712100, China
*
Authors to whom correspondence should be addressed.
Plants 2025, 14(7), 1136; https://doi.org/10.3390/plants14071136
Submission received: 5 March 2025 / Revised: 26 March 2025 / Accepted: 1 April 2025 / Published: 6 April 2025
(This article belongs to the Special Issue Advances in Molecular Genetics and Breeding of Brassica napus L.)

Abstract

BARLEY B-RECOMBINANT/BASIC PENTACYSTEINE (BBR/BPC), a plant-specific transcription factor family, is a group of GAGA_motif binding factors controlling multiple developmental processes of growth and response to abiotic stresses. BPCs recruit histone remodeling factors for transcriptional repression of downstream targets. However, the information about BnaBPCs from Brassica napus remains unclear. Here, we identified 25 BnaBPC genes that were mainly localized in the nucleus, randomly localized on 16 chromosomes, and grouped into three subfamilies based on phylogenetic analysis. Twenty-five BnaBPC genes exhibit syntenic relationships with AtBPC genes, and the polypeptides encoded by BnaBPC genes within the same subfamily share similar conserved motifs and protein domains. The expansion of BnaBPC genes underwent whole-genome duplication events and purifying selection in genomes, and all the BnaBPC genes had the same conserved GAGA binding domains. Additionally, the promoter of each BnaBPC gene consisted of various cis-elements associated with stresses, phytohormones, and growth and development. Notably, the seed-specific regulatory element was found only in the BnaC04.BPC4 promoter. Further expression pattern analysis showed that BnaBPC members are widely expressed in stems, buds, developing seeds and siliques. These findings provide insights into BnaBPC genes and enrich our understanding of their functional characterization in B. napus.

1. Introduction

Oilseed rape (Brassica napus L., 2n = 38), cultivated worldwide as the second largest oil crop, serves as a vital source of edible oil [1]. Beyond its primary role as an oilseed, B. napus is also cultivated for green manure, vegetable consumption, animal feed, honey production, and ornamental purposes [2], highlighting its diverse economic and ecological importance. Since the demand for vegetable oil has sharply increased in recent years, the major goals for B. napus breeding are to improve seed productivity and seed oil content. However, global warming and climate change have led to a concerning rise in the intensity and frequency of abiotic stresses, which pose significant challenges to crop production worldwide [3,4,5]. B. napus is particularly vulnerable to these stresses, impacting its growth, development, and ultimately, seed yield [6,7,8,9]. Therefore, identifying and functionally analyzing key genes associated with both seed productivity and abiotic stress tolerance is crucial for developing climate-resilient oilseed rape cultivars through genetic improvement strategies.
As a plant-specific transcription factor family, BASIC PENTACYSTEINE (BPC) proteins are found throughout land plants. The Arabidopsis thaliana genome encodes seven BPC genes (AtBPC1~AtBPC7) that are divided into three classes based on protein domain structures and sequence similarity, namely class I (AtBPC1~AtBPC3), class II (AtBPC4~AtBPC6), and class III (AtBPC7) [10]. All seven AtBPC proteins consist of a conserved DNA-binding domain at the C-terminus, which can recognize and bind to the GAGA-rich box in the promoters of their target genes [10,11]. AtBPC1 negatively regulates the development of ovule and embryo by directly repressing the expression of AtINNER NO OUTER, AtSEEDSTICK, and AtFUSCA3 [11,12,13]. AtBPC2 negatively regulates osmotic stress tolerance in the seedling growth stage by directly repressing the expression of AtLATE EMBRYOGENSIS ABUNDANT4-5 [14]. The ectopic expression of AtBPC3 impedes the formation of leaf margin by suppressing the expression of AtTEOSINTE BRANCHED1, AtCYCLOIDEA, and AtPROLIFERATING CELL FACTORs [15]. AtBPC5 is thought to be a pseudogene that encodes a functionally inactive protein because of the presence of an in-frame stop codon [10,11]. In addition, AtBPCs act redundantly to regulate plant growth and development and respond to salt stress. For example, the members of AtBPC: AtBPC1, AtBPC2, AtBPC4, and AtBPC6 modulate root development by directly inhibiting AtABSCISIC ACID INSENSITIVE4 expression [16]. The atbpc1 atbpc2 double mutant displays minor vegetative and reproductive deformities, which are more severe in the atbpc1 atbpc2 atbpc4 atbpc6 quadruple mutant [10,16]. Class I BPCs collaborate redundantly to control inflorescence and flower development by reducing the expression levels of AtSHOOTMERISTEMLESS and AtBREVIPEDICELLUS/KNAT1 [17]. AtBPC1 together with AtBPC2 promotes β-1,4-galactan accumulation and enhances salt tolerance by repressing AtGALACTAN SYNTHASE 1 expression [18]. Apart from the redundant roles across AtBPC members, AtBPC3 has been characterized by its antagonistic relationship with other AtBPC proteins. The dwarfism and short primary inflorescence of the atbpc1 atbpc2 atbpc4 atbpc6 quadruple mutant can be restored by AtBPC3 mutation [10]. Additionally, AtBPC3 has been shown to antagonize the functions of other AtBPCs in regulating the circadian clock and flowering time, with overexpression of AtBPC3 leading to growth defects similar to those seen in the higher-order bpc mutants (atbpc1 atbpc2 atbpc4 atbpc6) [15]. These findings indicate that AtBPC3 plays a key role as a repressor in coordinating circadian rhythms and plant development through its antagonistic interactions with other AtBPC family members. The BPC transcriptional factor family has also been identified from other plant species, such as Glycine max [19], Hordeum vulgare [20], Oryza sativa [21], and Cucumis sativus [22]. Functional analysis has shown that these BPCs exhibit important roles in regulating the development of leaves, inflorescence, flowers, ovules, and embryos; the formation of later roots; and the response to salt and osmotic stresses [19,20,21,22]. However, the function of BnaBPC members remains unknown in B. napus.
The current study identified 25 BnaBPCs from the B. napus genome and executed comprehensive phylogenetic, gene structure, conserved motifs, and gene expression analysis. These findings enhance our understanding of BnaBPCs and provide a foundation for further studies on their biological functions.

2. Results

2.1. Identification and Characterization of BnaBPC Family Members

To identify BPC family members in the B. napus genome, we performed a local BLASTP search against the B. napus cultivar ‘Zhong Shuang 11’ (‘ZS11’) genome using the amino acid sequences of AtBPC proteins as query sequences. ‘ZS11’ is a representative accession of the Yangtze River Basin ecotype and has been extensively used in rapeseed genomics research due to its high oil content, superior disease resistance, and completed genome assembly [23]. A total of 25 BnaBPC proteins were predicted from the ‘ZS11’ genome (Figure 1, Supplementary Table S1). These BnaBPC proteins were categorized and named as BnaBPC2, BnaBPC3, BnaBPC4, BnaBPC5, BnaBPC6, and BnaBPC7 based on the sequence similarity with AtBPC proteins. Unfortunately, no homolog of AtBPC1 was identified in the genome of B. napus cultivar ‘ZS11’ (Figure 1). In addition, chromosomal analysis showed that all BnaBPC genes were distributed on 16 different chromosomes, except for chromosomes A5, A10, and C9. Among the 25 BnaBPC genes, 12 were localized in the AA subgenome, including 3 BnaBPC2 genes, 1 BnaBPC3 gene, 1 BnaBPC4 gene, 3 BnaBPC5 genes, 3 BnaBPC6 genes, and 1 BnaBPC7 gene. The remaining 13 BnaBPC genes were localized in the CC subgenome, consisting of 3 BnaBPC2 genes, 1 BnaBPC3 gene, 2 BnaBPC4 genes, 3 BnaBPC5 genes, 3 BnaBPC6 genes, and 1 BnaBPC7 gene (Figure 1). These results suggested that BnaBPC genes are unevenly distributed across the AA and CC subgenomes, with subgenome-specific expansion in BnaBPC2/5/6 paralogs.
The average length of the BnaBPC proteins was 308 amino acids, with the longest being 570 amino acids (BnaA06.BPC2) and the shortest length being 134 amino acids (BnaC08.BPC4) (Table 1). The analysis of the physicochemical properties of the BnaBPC proteins showed that their molecular weights ranged from 14.97 kDa (BnaC08.BPC4) to 65.34 kDa (BnaC05.BPC2) (Table 1). The theoretical isoelectric point (pI) of these proteins ranged from 8.66 to 10.46, with all BnaBPC family members having a pI greater than 7. Proteins were classified as unstable if their instability index exceeded 40, and stable if the index was below 40 [24]. Among the BnaBPC proteins, the instability index ranged from 26.50 to 59.04 (Table 1). Three proteins had an instability index below 40, while 22 proteins had an instability index above 40 (Table 1). Subcellular localization predictions showed that all 25 BnaBPC proteins were localized to the nucleus (Table 1), consistent with their potential role as transcription factors.

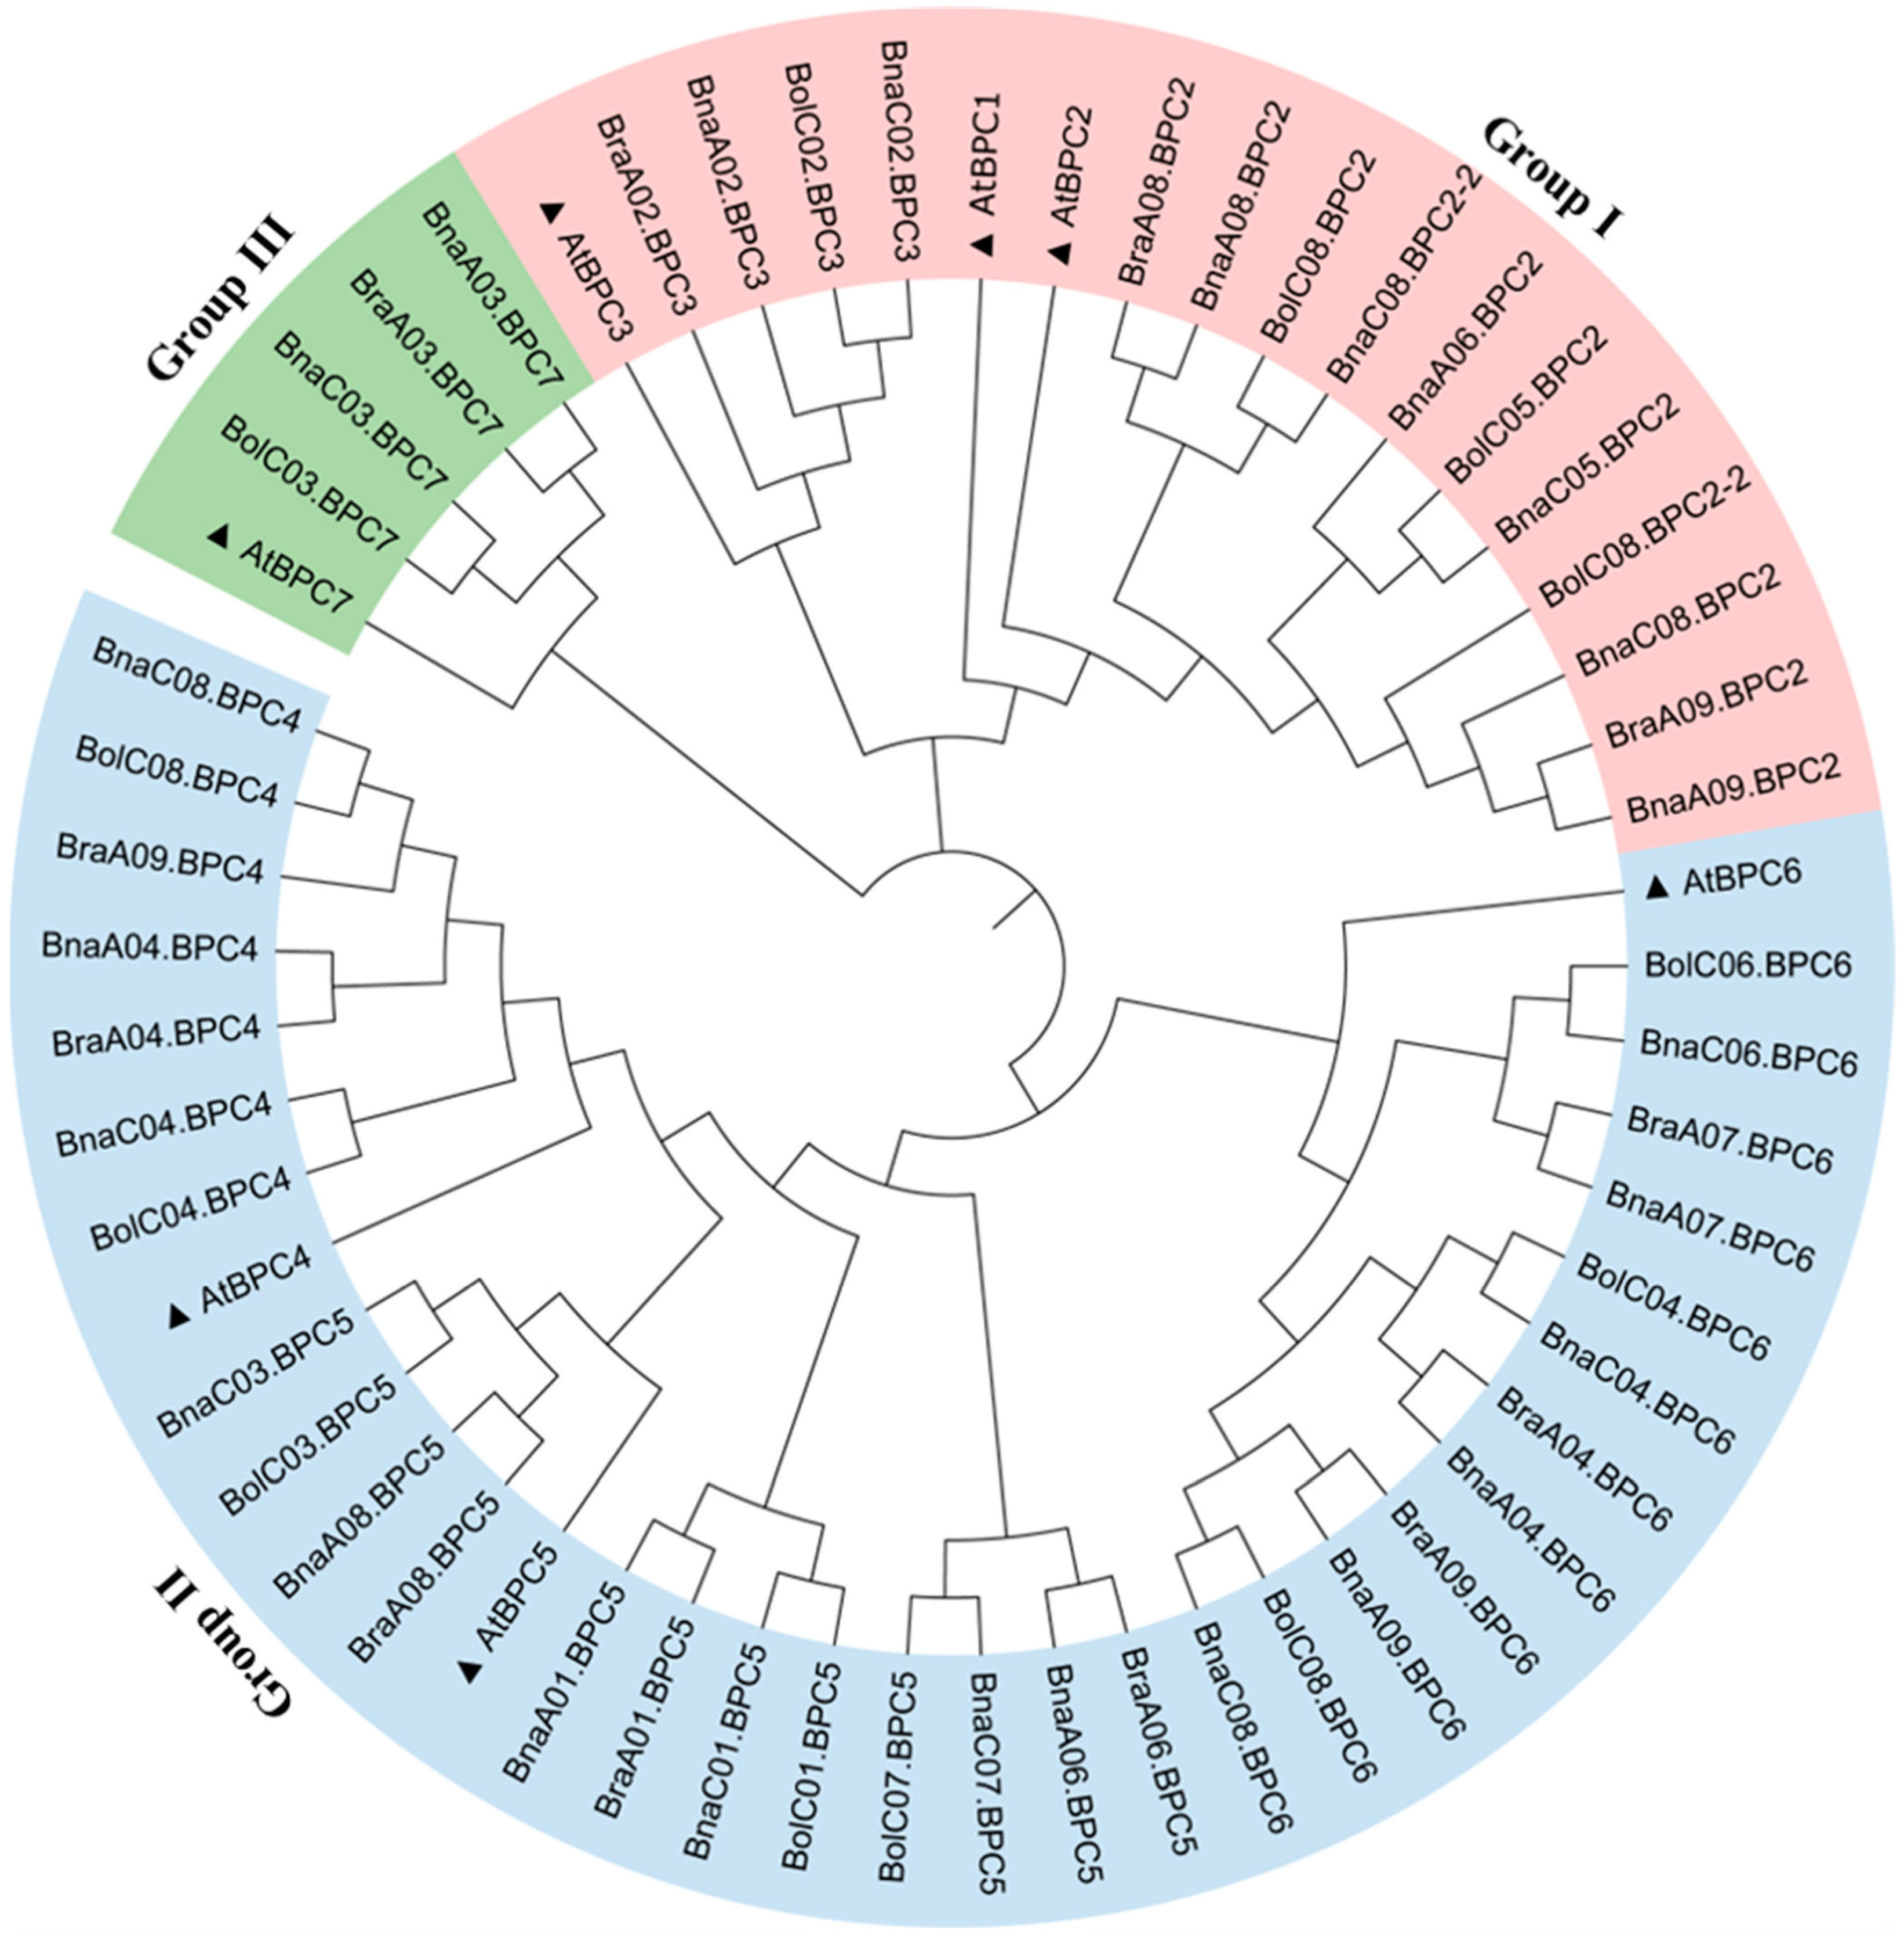
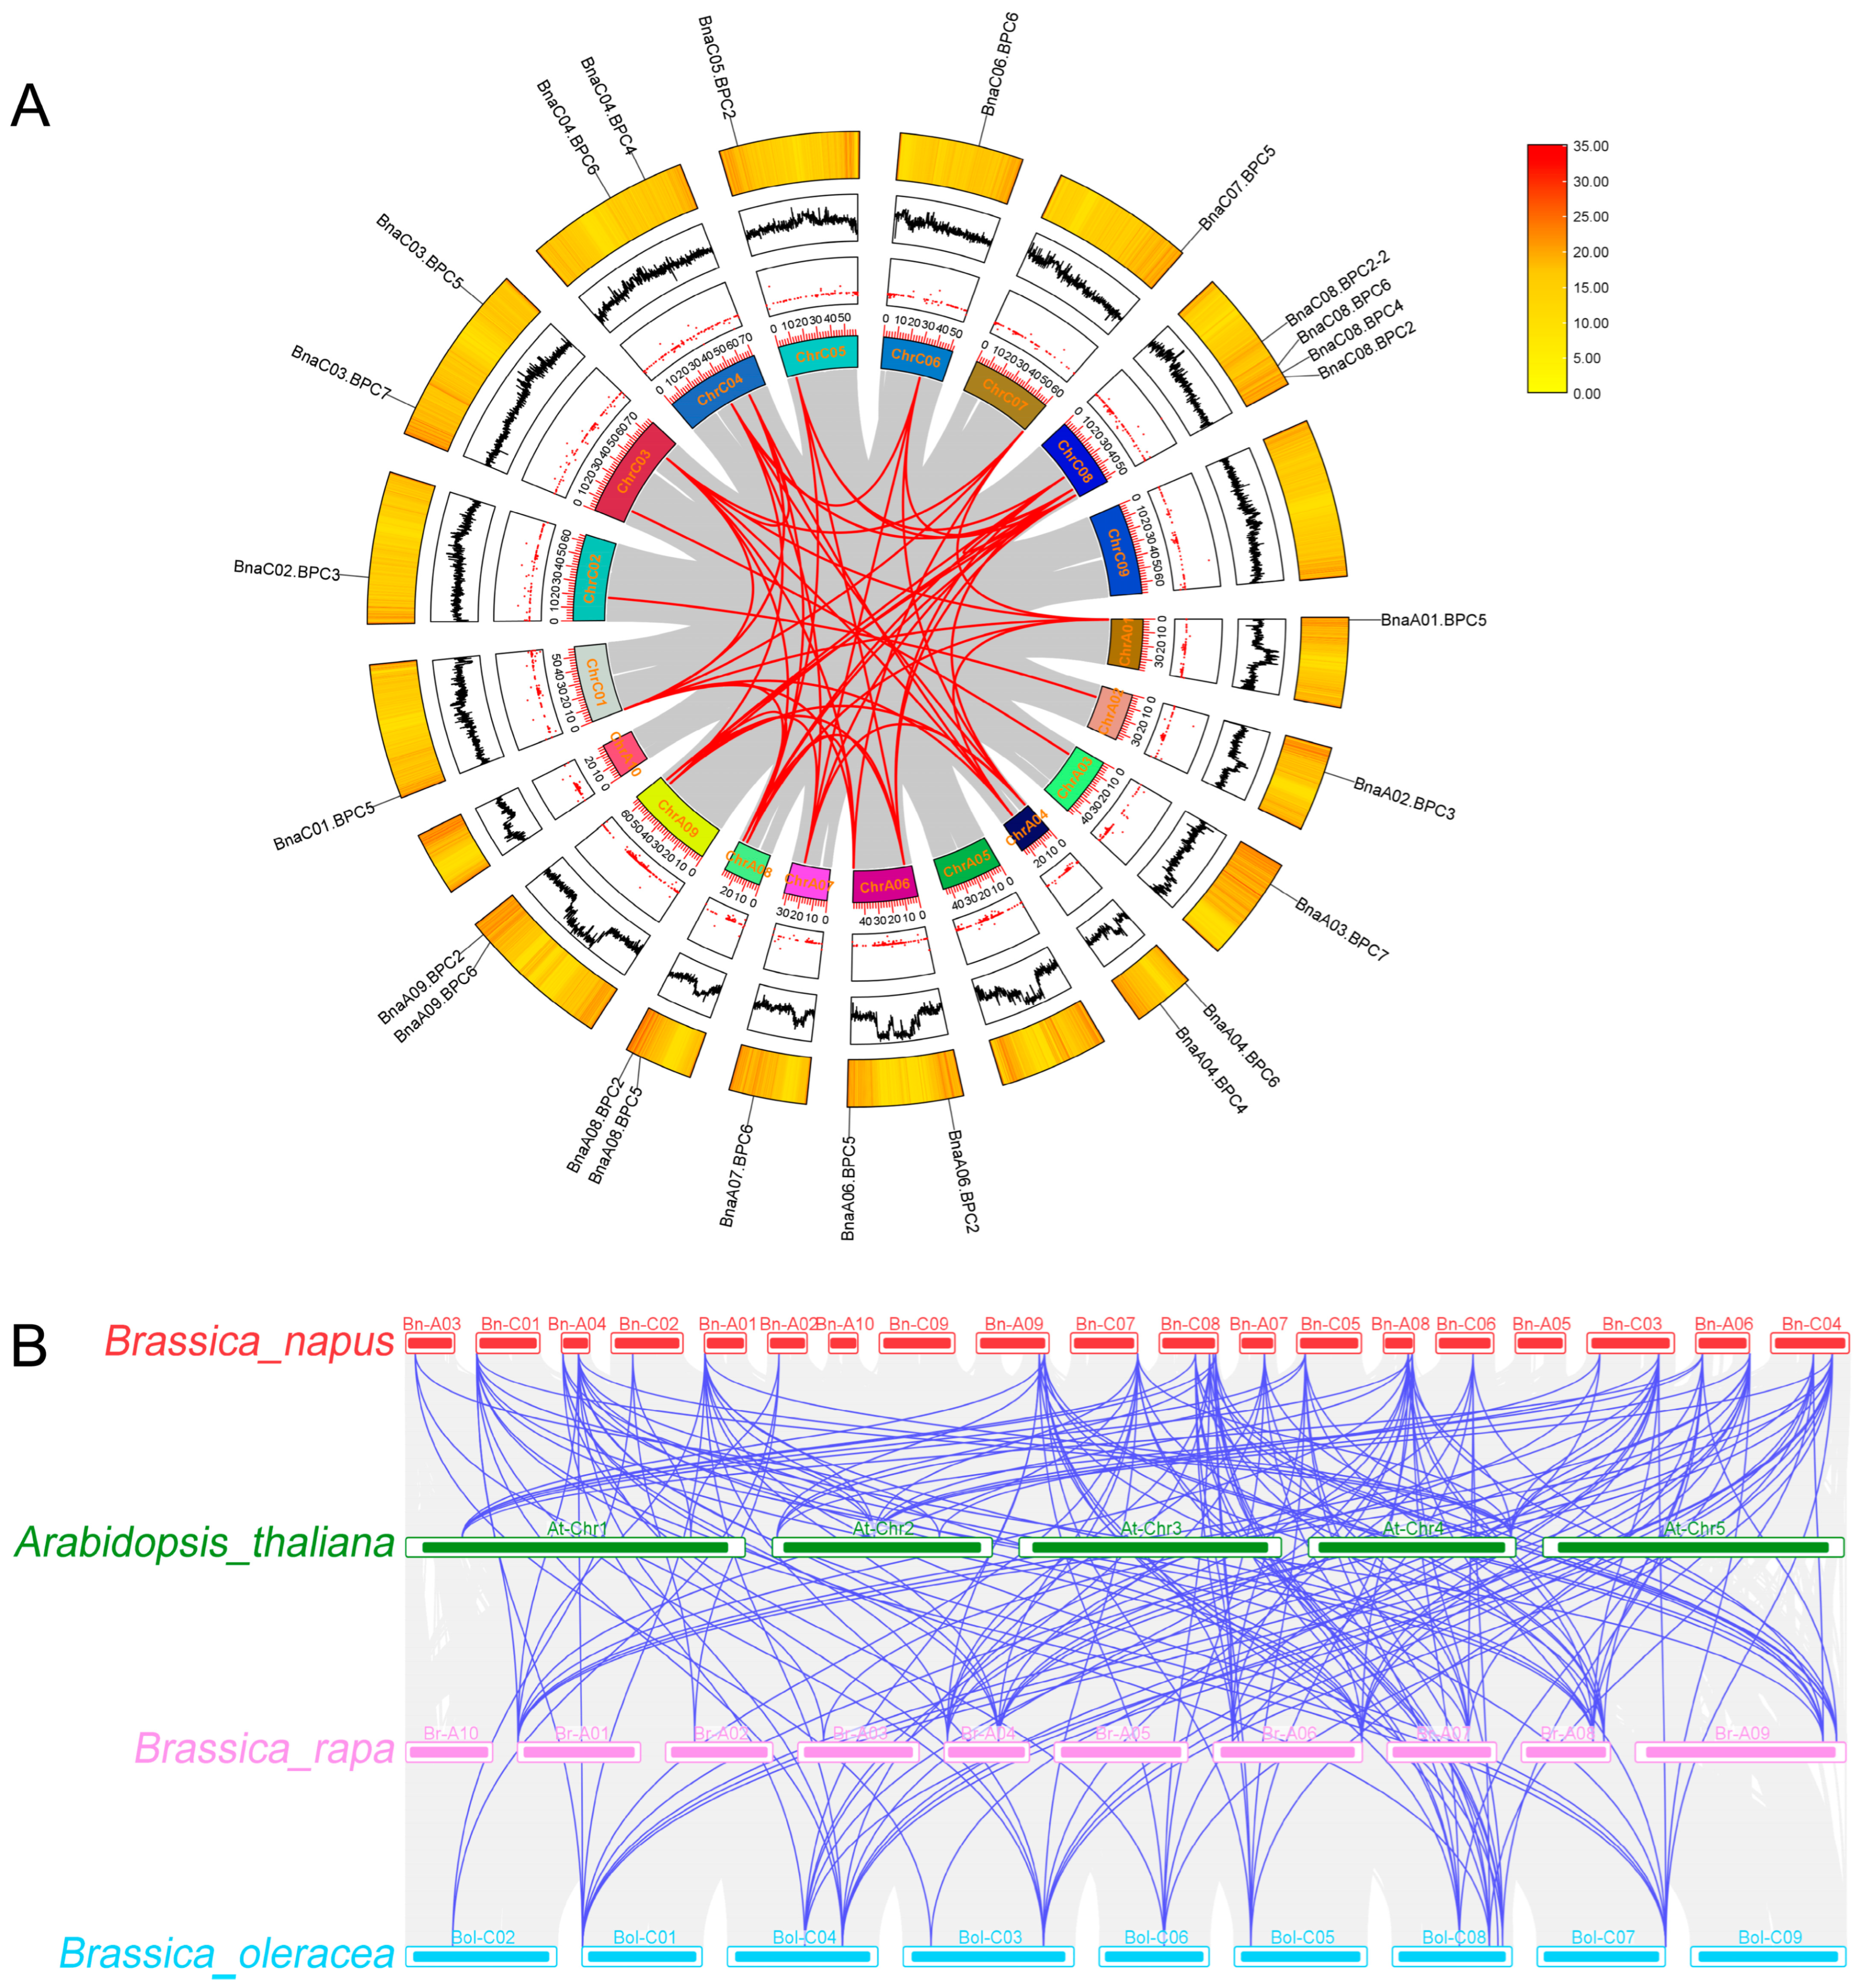
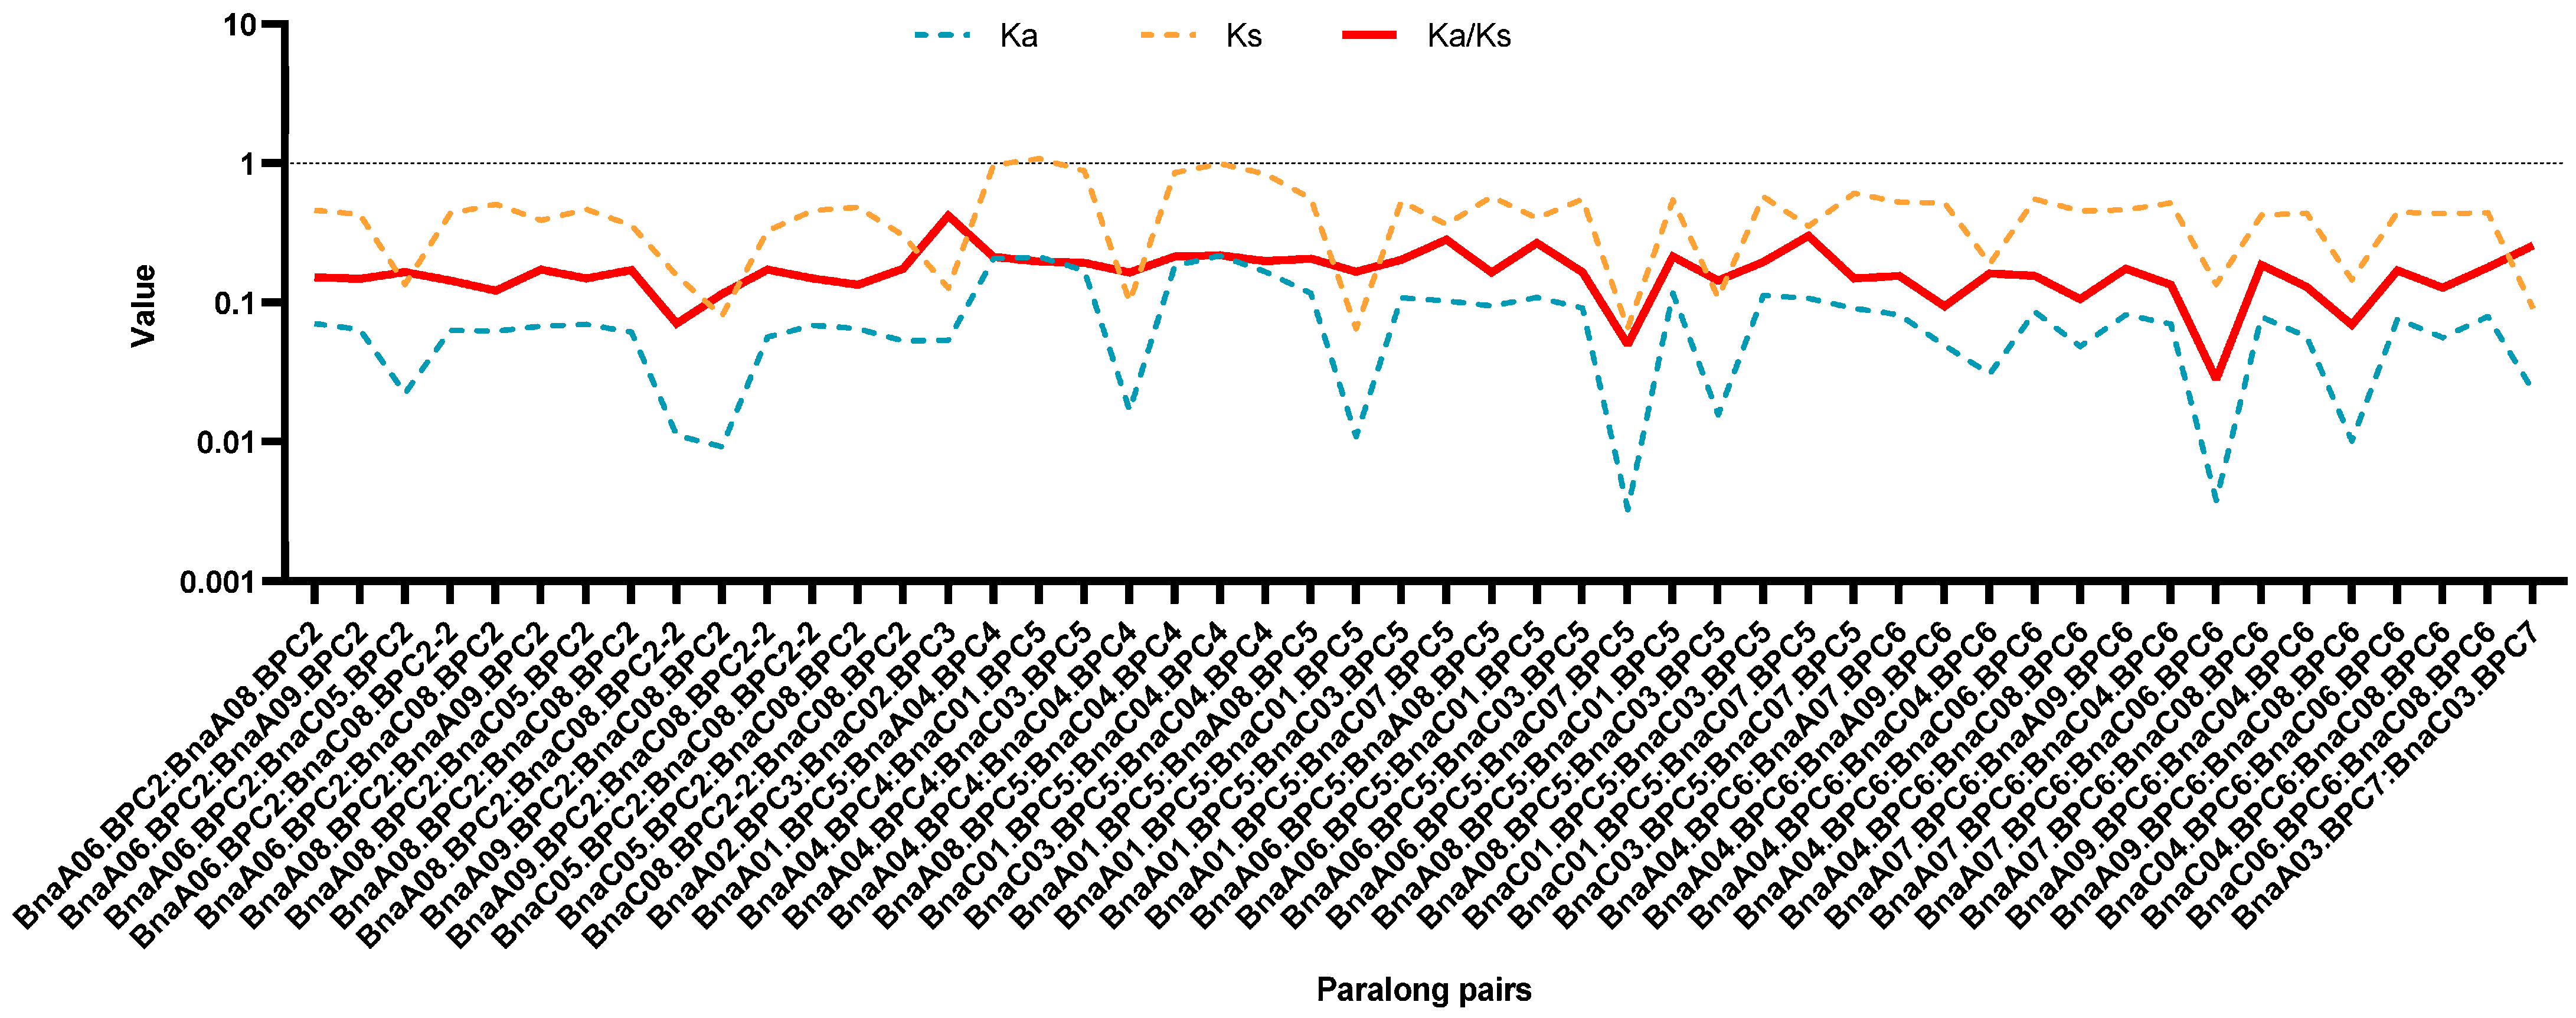
2.2. Phylogenetic and Genome Synteny Analysis of BnaBPC Proteins

To investigate the evolutionary relationships of BPC gene family members, we constructed a phylogenetic tree using the full-length amino acid sequences of BPC proteins from B. napus, Brassica oleracea, Brassica rapa, and A. thaliana, with MUSCLE [25] alignment in MEGA 11.0. The 57 proteins were classified into three subfamilies (Figure 2), recapitulating the A. thaliana classification framework [11]. However, the analysis revealed Brassica-specific lineage sorting, notably the absence of AtBPC1 orthologs in subfamily I (Figure 2). There were 18 individuals in subfamily I, 34 in subfamily II, and 5 in subfamily III (Figure 2). Additionally, all the BnaBPC proteins were closely related to their homologs in A. thaliana (Figure 2).
BLAST and MCScanX were used to identify gene duplication events of BnaBPCs, which were visualized using TBtools (Advance Circle) (Figure 3A). Several Whole Genome Duplication (WGD) events were observed, including a pair of tandem duplicates on chromosome ChrC08 (BnaC08.BPC2::BnaC08.BPC2-2). Additionally, 50 pairs of homologous genes were identified: 9 paralog pairs came from the genome of group A, 11 came from the genome of C, and 30 came from WGD events in the genomes of groups A and C (Supplementary Table S2).
A collinearity analysis of A. thaliana, B. napus, B. oleracea, and B. rapa was conducted to explore the evolutionary mechanisms of the BPC family members in different species. The results revealed that 30 paralog pairs were formed between B. napus and A. thaliana, 72 pairs between B. napus and B. rapa, and 73 pairs between B. napus and B. oleracea (Figure 3B, Supplementary Table S3). These results suggested that segmental duplication is the primary mechanism driving the evolution of BPC members. To assess the evolutionary mode of BnaBPCs, the Ka/Ks ratios for 50 homologous gene pairs were calculated. The Ka/Ks ratios of all pairs were found to be less than 1 (Figure 4, Supplementary Table S4), indicating that the evolution of BnaBPCs is primarily governed by purifying selection.

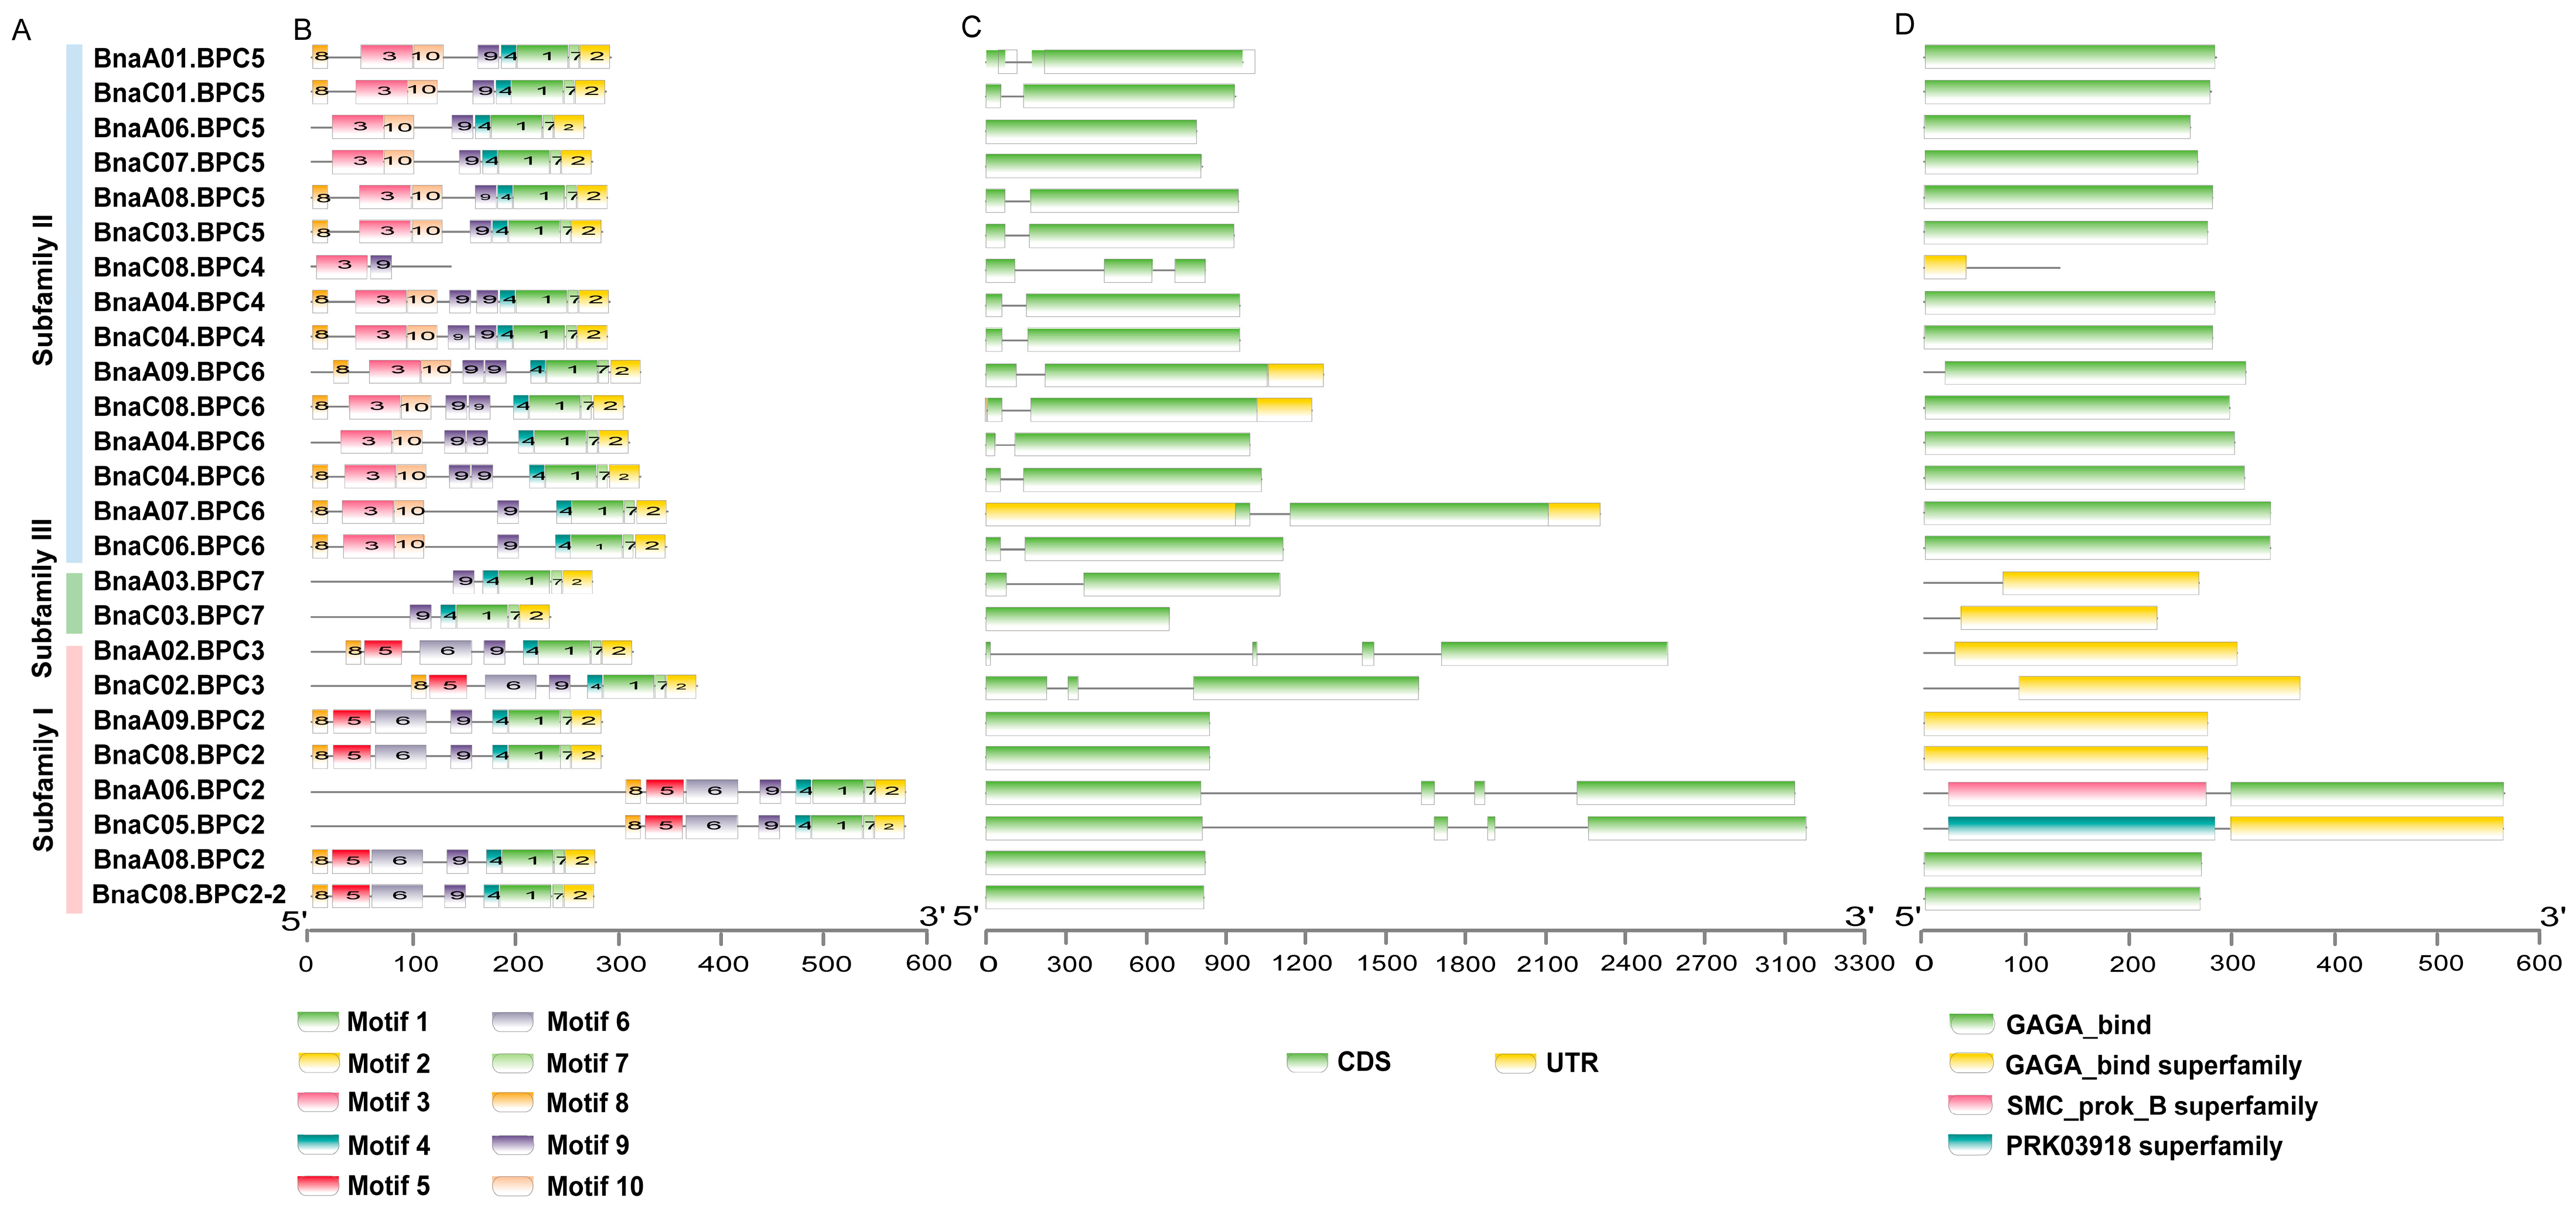
2.3. Gene Structures and Amino Acid-Conserved Structures of BnaBPC Genes

To further gain a deeper understanding of their characteristics, we analyzed the gene structure, conserved motifs, and domains of BnaBPC genes using MEME, TBtools, and the Conserved Domain Database (CDD). The analysis results revealed that the highly conserved motifs (motifs 1, 2, 4, 7, 9) were present in all BPC proteins except for BnaC08.BPC4 (Figure 5B). BnaBPC proteins within the same subfamily shared similar motif compositions, while proteins from different subfamilies exhibited significant variations in their motif compositions (Figure 5B). Specifically, proteins in subfamilies I and II contained motifs 1, 2, 3, 4, 7, 9, and 10, except for BnaC08.BPC4, which only includes motifs 3 and 9 (Figure 5B). Additionally, with the exception of BnaC08.BPC4, BnaA06.BPC5, BnaC07.BPC5, and BnaA04.BPC6, all proteins in subfamilies I and II contained motif 8. Subfamily III proteins only contained motifs 1, 2, 4, 7, and 9 (Figure 5B). Gene structure analysis revealed that only BnaA07.BPC6, BnaA09.BPC6, and BnaC08.BPC6 contained the untranslated regions, while other BnaBPC genes did not (Figure 5C). Furthermore, BnaBPC genes typically contained one to three introns, with the exception of BnaA06.BPC5, BnaC07.BPC5, BnaC03.BPC7, BnaA09.BPC2, BnaC08.BPC2, BnaA08.BPC2, and BnaC08.BPC2-2 (Figure 5C).
Members of the BPC family consist of two main structural domains: the GAGA-binding domain and the GAGA-binding superfamily domain. Subfamilies II contains one GAGA-binding domain, except for BnaC08.BPC4, which has one GAGA-binding superfamily. In contrast, most members of subfamily I and III possess one GAGA-binding superfamily domain. Notably, BnaA06.BPC2 and BnaC05.BPC2 have the SMC_prok_B_superfamily and PRK03918 superfamily domains, respectively (Figure 5D).
In summary, the similar gene structures of the BnaBPC genes, along with the conserved motifs and protein domains in their encoded polypeptides within the same subfamily, strongly support the results of the subfamily classification obtained from the phylogenetic analysis.

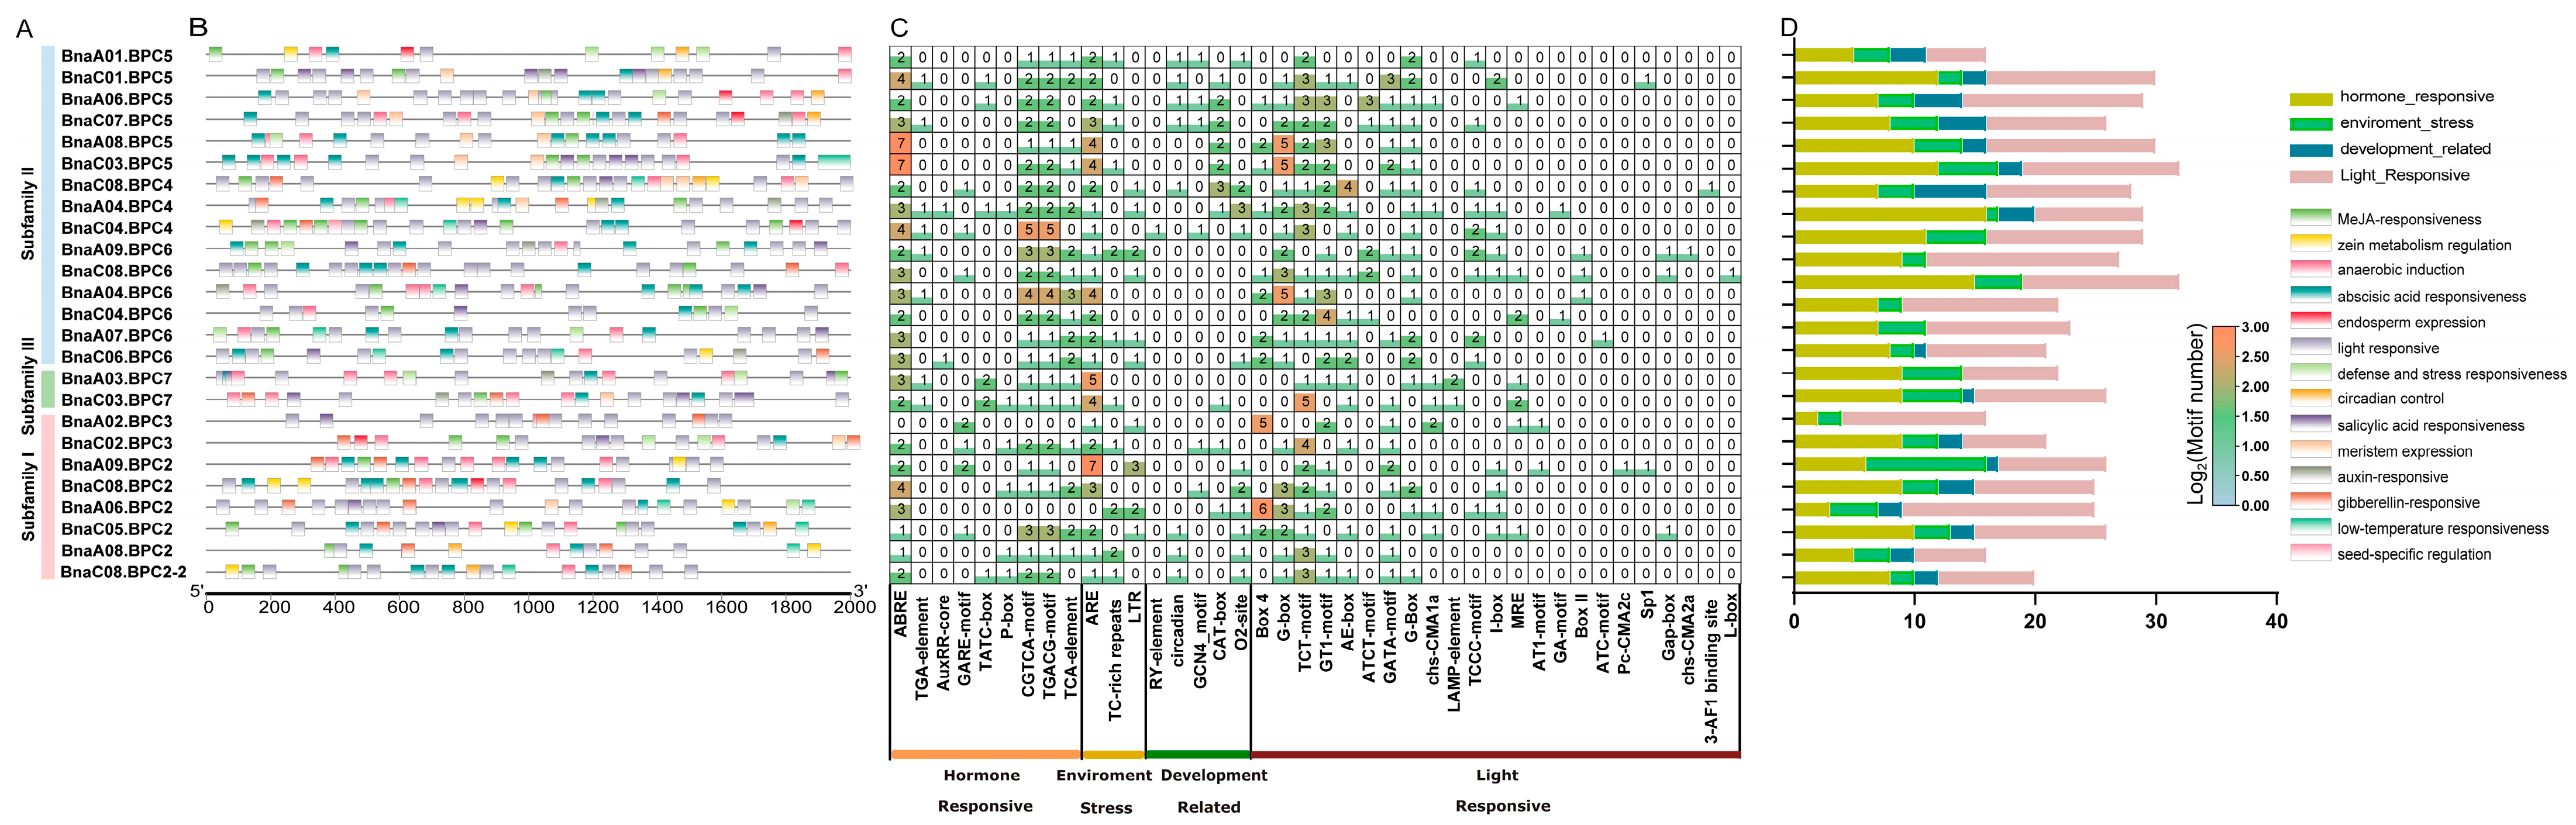
2.4. Cis-Element Analysis of BnaBPC Gene Promoters

To reveal the potential roles and regulatory mechanisms of BnaBPC genes, we selected the 2000 bp promoter sequence upstream of the start codon of each BnaBPC gene to predict cis-elements. A total of 357 cis-elements were predicted and mainly associated with hormone-responsive, development-related, environment stress, and light-responsive in the BnaBPC promoters (Figure 6; Supplementary Table S5). Among these cis-elements, the light-responsive element was particularly prominent (Figure 6B,C), indicating that BnaBPC genes may be regulated by light and subsequently participate in plant growth and development. In addition, the promoters of BnaBPC genes contained several environment-stress-responsive elements. Particularly, 24 BnaBPC genes possessed anaerobic induction elements, 16 BnaBPC genes included defense and stress-responsive elements, and 10 BnaBPC genes carried low-temperature responsive elements (Figure 6B). The cis-elements related to MeJA responsiveness and abscisic acid responsiveness were more prevalent than those related to salicylic acid responsiveness, gibberellin responsiveness, and auxin responsiveness (Figure 6B). These findings indicate that BnaBPC genes may play a role in regulating plant growth and development by responding to various hormonal signals. Furthermore, the development-related elements, such as meristem expression, zein metabolism regulation, circadian control, endosperm expression, and seed-specific regulation, were also found in the promoters of some BnaBPC genes (Figure 6B). Notably, the seed-specific regulation element was only presented in the BnaC04.BPC4 promoter (Figure 6), suggesting BnaC04.BPC4 may function in seed development in a tissue-specific manner.
In conclusion, BnaBPC genes could play vital roles in ensuring plant normal growth and development under different growing statuses and environmental conditions independently or synergistically.

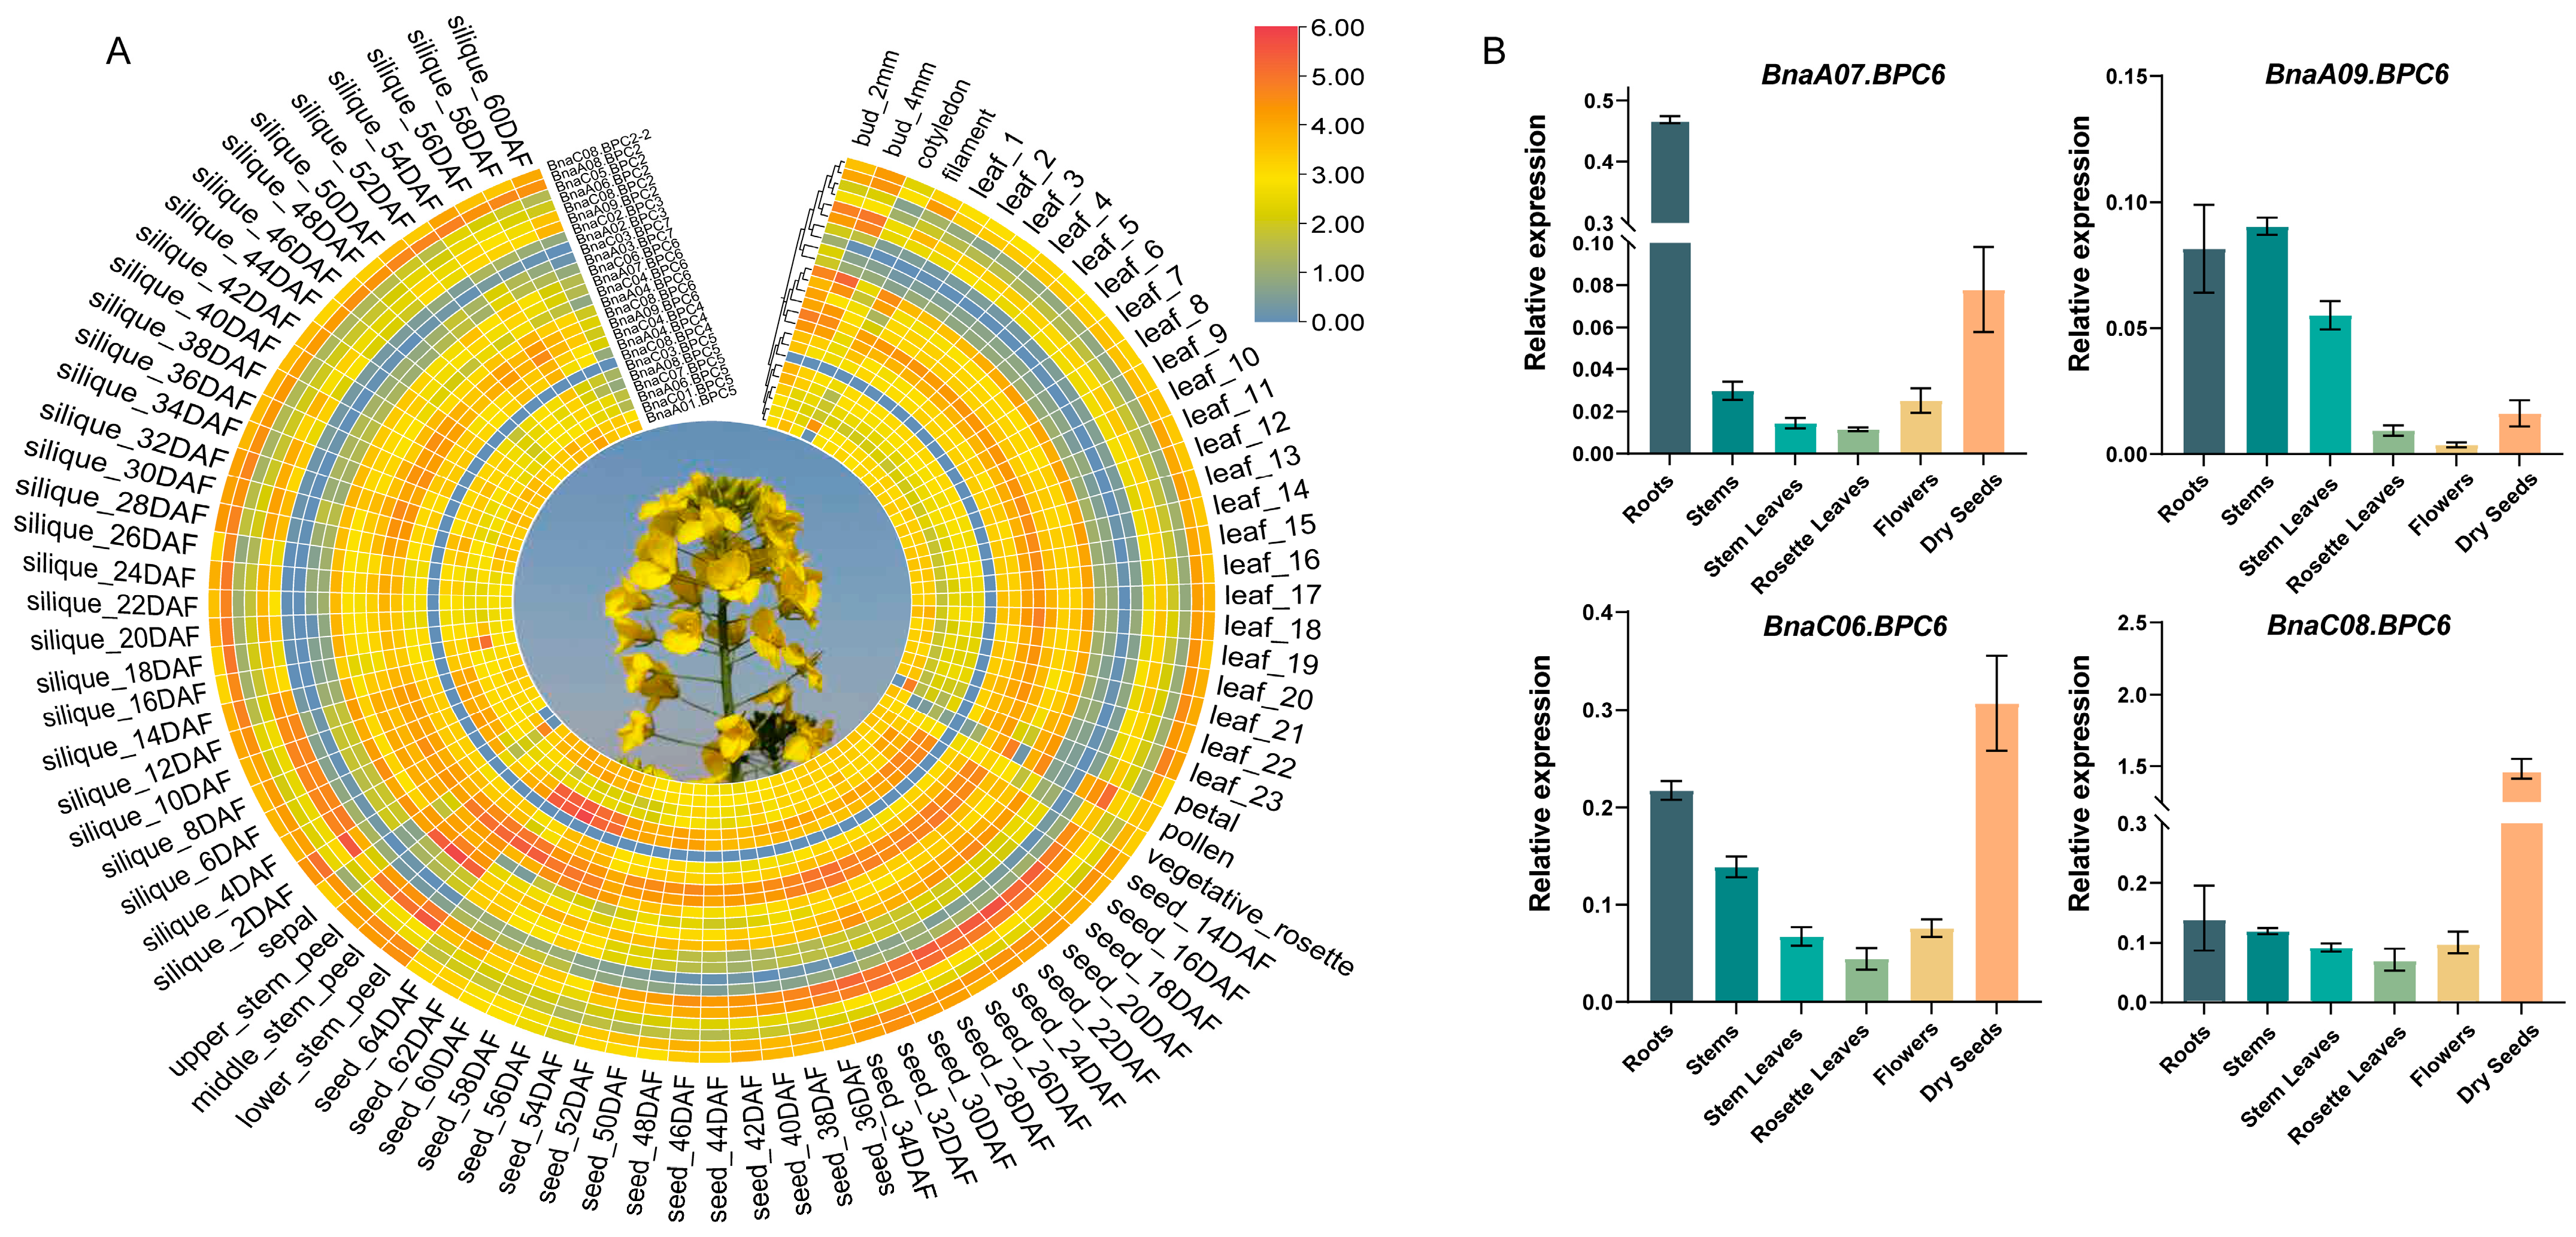
2.5. Expression Profiles of BnaBPC Genes in Various Tissues

To further investigate the potential functions of BnaBPCs, their expression patterns were analyzed in the stems, cotyledons, rosette leaves, buds, filaments, petals, pollens, sepals, developing siliques, and developing seeds using publicly available transcriptome data of B. napus cultivar ‘ZS11’ (Supplementary Table S6). The results showed that six BnaBPC2 genes were strongly transcribed in the stems, pollens, and early stages of seed development (Figure 7A), indicating that BnaBPC2 genes may play a conserved role in controlling flower and seed development. The expression levels of BnaA02.BPC3 and BnaC02.BPC3 were higher in the buds and pollens, respectively, while being undetectable in other tissues (Figure 7A), implying that BnaBPC3 genes regulate flower development in a tissue-specific manner. Almost all BnaBPC4 genes were expressed across various tissues. In contrast, BnaC08.BPC4 showed no detectable expression (transcriptome data of zero) in any of the analyzed tissues (Figure 7A). The six BnaBPC5 genes were expressed in the stems, rosette leaves, and buds, except for BnaC01.BPC5, which remained at a relatively higher transcription level in the filaments, petals, and sepals (Figure 7A). Moreover, BnaA06.BPC5 and BnaC07.BPC5 were highly expressed in the developing seeds at 16 days after pollination (DAP), whereas other BnaBPC5s increased progressively afterward at the late stages of seed maturation and reached the maximal level at 60~64 DAP (Figure 7A). Furthermore, most of the BnaBPC6 genes exhibited a higher transcriptional level in stems and leaves, and BnaBPC7 genes had relatively higher transcription levels in the buds and developing seeds at 56~64 DAP (Figure 7A).
To validate the BnIR expression database, total RNA was extracted from different tissues of the B. napus cultivar ‘ZS11’, including the roots, stems, stem leaves, rosette leaves, flowers, and dry seeds. Quantitative analysis revealed distinct expression patterns of BnaBPC6 paralogs across tissues: BnaA07.BPC6 and BnaC06.BPC6 were predominantly expressed in the roots and dry seeds; BnaA09.BPC6 was primarily localized in the roots, stems, and stem leaves; and BnaC08.BPC6 showed dominant expression in dry seeds (Figure 7B). Further comparative analysis identified tissue-specific expression hierarchies: in the root tissues, BnaA07.BPC6 exhibited the highest expression level among the four paralogs, followed by BnaC06.BPC6; in dry seeds, BnaC08.BPC6 displayed the most abundant transcripts, with BnaC06.BPC6 ranking second. These tissue-specific expression patterns, quantitatively validated by RT-qPCR, were fully consistent with the transcriptome sequencing data, reinforcing the functional relevance of BnaBPC6 paralogs in the regulating growth and developmental processes of B. napus.
Our comprehensive analysis indicates that BnaBPC family members function as master regulators governing multiple biological pathways, exhibiting both functional redundancy and specialization across different tissue types.

3. Discussion

Plant growth and development are controlled by multiple and precise regulatory networks that coordinate various external environmental and endogenous signals under different growing statuses and environmental conditions [26]. Among them, transcription regulation is crucial for balancing multi-level signals [27]. Gene regulation goes through a series of complex processes in which transcription factors play an important role. Transcription factors exhibit a wide range of functions in plant growth, including plant development and the formation of the overall morphological diversity of plants. Herein, gaining insight into the structure and function of transcription factors is essential to unravel the regulatory mechanisms that govern plant development and growth.
BPC is a plant-specific transcription factor family, and increasing evidence has revealed that BPC genes from A. thaliana and other crops are essential for controlling growth and development, as well as for response to biotic and abiotic stresses [10,17]. However, there is no relevant report on the type, quantity, structure, and function of the BPC family in B. napus. In this study, we utilized the AtBPC genes as a reference to investigate the BnaBPC gene family members throughout the entire genome. Additionally, we analyzed the gene structure and the gene evolutionary relationship of the BPC genes in different species. The expression patterns of the BnaBPC genes under different tissues were explored. This will provide useful data for high yield and stress tolerance breeding of B. napus.
B. napus is an allotetraploid crop formed by natural hybridization between two diploid progenitors, B. rapa and B. oleracea. Its evolution is accompanied by chromosomal duplication, rearrangement, and deletion, resulting in an average of two to eight paralogs of each A. thaliana locus in the B. napus genome [28,29,30]. Accordingly, two to six paralogs are homologous to each AtBPC in the genome of B. napus (Figure 1). We successfully identified 25 BnaBPC genes and divided them into three subfamilies (Figure 1 and Figure 2), which was consistent with the previous study, which showed that the BPC members encoded by the A. thaliana genome fall into three subfamilies [10]. The 25 BnaBPCs were unevenly distributed on 16 chromosomes and had different genetic structural features in each group. It is worth mentioning that there were no homologs of AtBPC1 identified in the B. napus genome (Figure 1), which might be due to the deletion occurrence during the evolution process. The subfamilies II and III shared similar members between A. thaliana and B. napus, while AtBPC1 homologs were missing from subfamily I (Figure 2), further demonstrating that the homologs of AtBPC1 disappeared during the evolution process.
An analysis of the syntenic relationships between species indicated that the BPC genes of B. napus were mainly derived from genome evolution with B. oleracea and B. rapa. The evolution mode was purifying selection, which led to the formation of tandem duplicates on chromosome ChrC08 during the WGD process (Figure 3 and Figure 4). Predicted subcellular localization suggests that BnaBPCs are localized in the nucleus, implying their potential role as transcription factors. This observation indicated that the overall functions of the gene family have been conserved, although the functions of genes in each subgroup were different. Moreover, BnaBPC members within the same subfamily possessed similar exon/intron structures and conserved motifs, suggesting a closer evolutionary relationship among the same subfamily members (Figure 5). There were significant differences in gene structure and sequence lengths of BnaBPC members in different subgroups (Figure 5, Table 1), indicating functional diversification among the members of distinct subfamilies. It has been reported that introns can improve the content of mRNA by affecting transcription and can also enhance mRNA translation efficiency [31]. The BnaBPC genes may have different biological activities due to their different intron structures. Further analysis of conserved domains and motifs showed the presence of typical motifs in all BnaBPCs (Figure 5). High sequence similarity among motif sequences within each subgroup (Figure 5) indicated that BPC members of each subgroup potentially share similar functions. Additionally, all of the BnaBPC proteins contained a conserved GAGA-binding domain or a GAGA-binding superfamily (Figure 5) that specifically interacts with GA-rich box cis-elements [11]. Previous studies showed that AtBPC6 interacts with LHP1 and then recruits PRC1 and PRC2 members to the GAGA structural domains of polycomb-responsive DNA elements of the target genes [10]. Given the conservation of the GAGA-binding domain in BnaBPC proteins, we hypothesize that BnaBPC proteins may similarly recruit PRC1 and PRC2 to target genes via GAGA motifs, acting similarly to their A. thaliana counterparts. Notably, previous studies have shown that the phylogenetic relationships among AtBPC proteins do not precisely mirror the functional relationship, and AtBPC genes function redundantly and antagonistically to regulate plant growth and development [10,16]. Therefore, the detailed roles and their specific functions of BnaBPC proteins need further investigation.
Transcription regulation is indispensable for plant growth and development [32]. The cis-elements in the promoter are essential for the expression and functions of genes [33,34]. Our results showed that the promoters of BnaBPC genes contained various cis-elements that are associated with development-related, hormone-responsive, light-responsive, and environment stress responses (Figure 6), including ABRE-motif, ARE-motif, and Box 4-motif, etc. Together with the results of the different expression levels of the BnaBPC genes under different tissues (Figure 7A), these findings suggest that BnaBPC genes might play a crucial role in plant growth, development, and the environmental stress responsiveness of plants through a variety of hormone-regulatory pathways and physiological processes. Moreover, six BnaBPC2 genes were strongly transcribed in the stems, pollen, and early stages of seed development (Figure 7A), suggesting that BnaBPC2 genes may play an important role in the growth of stems and pollen and the early development of seeds in B. napus. Previous studies showed that AtBPC6 can bind the GAGA_motif, resulting in the recruitment of PRC1 and PRC2 components to Polycomb-responsive DNA element-like GAGA motifs, which play key roles in development by repressing large numbers of genes involved in various functions [35]. Our studies showed that all six BnaBPC6s contained one GAGA-binding sequence and various cis-elements that are associated with hormone responsiveness and light responsiveness (Figure 6), suggesting that BnaBPC6 genes may play a role in growth and development by the same mechanism as AtBPCs. The differential expression patterns of BnaBPC6 paralogs across various tissues (Figure 7B), as revealed by RT-qPCR analysis, strongly suggest their specialized roles in growth and development regulation. The distinct expression profiles of the four BnaBPC6 copies indicate potential functional diversification in different tissues, with each paralog potentially serving as a major regulatory factor in specific developmental contexts. The presence of hormone-responsive cis-elements in BnaBPC6 promoters further supports their potential role in coordinating developmental transitions through hormonal signaling pathways, consistent with the known function of AtBPC6 in A. thaliana. However, the specific biological functions of these paralogs may require further validation using genetic materials, such as targeted mutants or transgenic plants, to establish direct causal relationships between their expression patterns and developmental phenotypes.
In conclusion, 25 BnaBPC genes were identified from the B. napus cultivar ‘ZS11’ genome and divided into three subfamilies. They shared high similarity in gene structure, conserved motif composition, and conserved protein domains within the same subfamily. Moreover, all of the BnaBPC genes contained various cis-elements and were broadly expressed in various tissues. These results provide a basis for the further functional analysis of BnaBPC genes in B. napus and other plant species.

4. Materials and Methods

4.1. Identification of BnaBPCs in the B. napus Genome

The amino acid sequences of the BPC family members in A. thaliana were obtained from the TAIR database (https://www.arabidopsis.org/, accessed on 5 September 2024). The reference genome of B. napus cultivar ‘ZS11’ was downloaded from the B. napus pan-genome information resource (BnPIR) database (http://cbi.hzau.edu.cn/bnapus/index.php, accessed on 5 September 2024). Using AtBPC amino acid sequences as queries, we performed Hidden Markov Model (HMM) and local BLASTP searches against the B. napus cultivar ‘ZS11’ genome to identify BnaBPC members, employing default E-value settings. All candidate sequences of BnaBPCs were confirmed using the Pfam (http://pfam.xfam.org, accessed on 6 September 2024) [36] and SMART (http://smart.embl-heidelberg.de/, accessed on 6 September 2024) databases [37]. The BnaBPC members were named based on their order of arrangement on the chromosomes of the B. napus genome.

4.2. Phylogenetic Analysis and Classification of the BnaBPC Family

The multiple sequence alignment of AtBPC and BnaBPC amino acid sequences was performed using ClustalW with default parameters [38]. The phylogenetic tree was constructed using the neighbor-joining (NJ) method with the p-distance model in MEGA 11.0 software, and bootstrap values were calculated based on 1000 replicates [38,39]. The AtBPC family members were used as a reference to classify the BnaBPC family members.

4.3. Chromosomal Localization of BnaBPCs

The chromosomal positions of BnaBPCs were queried from the B. napus genome annotation information and visualized using the TBtools software (v2.210) [40]. Intragenomic syntenic relationships among BnaBPCs were identified through BLAST+ (v2.13.0) pairwise alignments, followed by collinear block analysis with MCScanX software (v1.1) using default parameters [41].

4.4. Analysis of Gene Structures, Conserved Motifs, and Conserved Protein Domains of BnaBPCs

The gene structures of BnaBPCs were displayed based on B. napus genome annotation information by the TBtools software (v2.210) [40]. The conserved motifs of BnaBPC proteins were identified using the Multiple Expectation Maximization for Motif Elicitation (MEME) online program (https://meme-suite.org/meme/, accessed on 10 September 2024) [42] with the maximum number of motifs and the optimum width of each motif falls between 10 and 100 residues. The conserved domains of BnaBPC proteins were predicted using the Conserved Domains Database (CDD) (https://www.ncbi.nlm.nih.gov/Structure/cdd/cdd.shtml, accessed on 10 September 2024).

4.5. Cis-Element Analysis in the Promoters of BnaBPCs

The 2000 bp promoter sequence upstream of the start codon of each BnaBPC gene was selected from the reference genome of B. napus cultivar ‘ZS11’ and then submitted to the PlantCARE database (https://bioinformatics.psb.ugent.be/webtools/plantcare/html/, accessed on 14 September 2024) for cis-element prediction. The predicted cis-elements were visualized by the TBtools software (v2.210).

4.6. Expression Patterns of BnaBPCs

Transcriptome data from different tissues of the B. napus cultivar ‘ZS11’ were downloaded from the BnPIR database (http://cbi.hzau.edu.cn/bnapus/index.php, accessed on 20 September 2024). Expression standardization of BnaBPC genes was constructed using the DSEeq2 R package, and the heatmaps were performed using the TBtools software. To verify the gene expression data of BnIR, the SteadyPure Plant RNA Extraction Kit (Accurate Biology, Changsha, China) was utilized to extract RNA from the roots, stems, stem leaves, rosette leaves, flowers, and dry seeds of ‘ZS11’. An EasyScript One-Step gDNA Removal and cDNA Synthesis SuperMix (TransGen, Beijing, China) was used to obtain cDNA from 1 µg RNA. Specific primers were designed using Primer-BLAST (https://www.ncbi.nlm.nih.gov/tools/primer-blast, accessed on 20 September 2024) (Supplementary Table S7). RT-qPCR was performed with three biological replicates using SYBR Green Master Mix (Cofitt, Hong Kong, China), and each biological replicate had three technical replicates.

Supplementary Materials

The following supporting information can be downloaded at: https://www.mdpi.com/article/10.3390/plants14071136/s1. Table S1. BPCs in B. napus and their protein sequences. Table S2. The gene pairs of BnaBPCs. Table S3. The gene pairs of BPCs in B. napus, B. rapa, B. oleracea, and A. thaliana. Table S4. Ka/Ks analysis for paralogous gene pairs of BnaBPCs. Table S5. List of predicted cis-elements in the promoter of BnaBPC genes. Table S6. Expression patterns of BnaBPCs from the BnIR. Table S7. List of primers used for RT-qPCR expression analysis.

Author Contributions

The authors confirm their contributions to the paper: study conception, design, and manuscript revision: Z.L. and M.C.; data collection: H.H. and Y.J.; analysis and interpretation of results: H.H., Y.Z., and C.L.; draft manuscript preparation: H.H. All authors have read and agreed to the published version of the manuscript.

Funding

This research was funded by the Scientific and Technological Innovation Team of Shaanxi Province (grant no. 2024RS-CXTD-69), the Natural Science Foundation in Shaanxi Province of China (grant no. 2023-JC-QN-0194), and the Fundamental Research Funds for the Central Universities (grant no. 2452023090).

Data Availability Statement

The data presented in this study are available in the article and the Supplementary Materials. For further inquiries, you can contact the corresponding author directly.

Conflicts of Interest

The authors declare that they have no conflicts of interest to report regarding the present study.

References

  1. Zandberg, J.D.; Fernandez, C.T.; Danilevicz, M.F.; Thomas, W.J.W.; Edwards, D.; Batley, J. The Global Assessment of Oilseed Brassica Crop Species Yield, Yield Stability and the Underlying Genetics. Plants 2022, 11, 2740. [Google Scholar] [CrossRef]
  2. Fu, D.H.; Jiang, L.Y.; Mason, A.S.; Xiao, M.L.; Zhu, L.R.; Li, L.Z.; Zhou, Q.H.; Shen, C.J.; Huang, C.H. Research progress and strategies for multifunctional rapeseed: A case study of China. J. Integr. Agric. 2016, 15, 1673–1684. [Google Scholar]
  3. Alotaibi, M. Climate change, its impact on crop production, challenges, and possible solutions. Not. Bot. Horti Agrobot. Cluj-Napoca 2023, 51, 13020. [Google Scholar]
  4. Chaudhry, S.; Sidhu, G.P.S. Climate change regulated abiotic stress mechanisms in plants: A comprehensive review. Plant Cell Rep. 2022, 41, 1–31. [Google Scholar] [PubMed]
  5. Raza, A.; Razzaq, A.; Mehmood, S.S.; Zou, X.; Zhang, X.; Lv, Y.; Xu, J. Impact of Climate Change on Crops Adaptation and Strategies to Tackle Its Outcome: A Review. Plants 2019, 8, 34. [Google Scholar] [CrossRef]
  6. Zhu, M.; Monroe, J.G.; Suhail, Y.; Villiers, F.; Mullen, J.; Pater, D.; Hauser, F.; Jeon, B.W.; Bader, J.S.; Kwak, J.M.; et al. Molecular and systems approaches towards drought-tolerant canola crops. New Phytol. 2016, 210, 1169–1189. [Google Scholar]
  7. Raza, A. Eco-physiological and Biochemical Responses of Rapeseed (Brassica napus L.) to Abiotic Stresses: Consequences and Mitigation Strategies. J. Plant Growth Regul. 2021, 40, 1368–1388. [Google Scholar]
  8. Young, L.W.; Wilen, R.W.; Bonham, P.C. High temperature stress of Brassica napus during flowering reduces micro- and megagametophyte fertility, induces fruit abortion, and disrupts seed production. J. Exp. Bot. 2004, 55, 485–495. [Google Scholar]
  9. Abelenda, J.A.; Trabanco, N.; Del Olmo, I.; Pozas, J.; Martín, M.D.M.; Gómez, J.; Esteve, A.; Pernas, M.; Jarillo, J.A.; Piñeiro, M. High ambient temperature impacts on flowering time in Brassica napus through both H2A.Z-dependent and independent mechanisms. Plant Cell Environ. 2023, 46, 1427–1441. [Google Scholar]
  10. Monfared, M.M.; Simon, M.K.; Meister, R.J.; Roig-Villanova, I.; Kooiker, M.; Colombo, L.; Fletcher, J.C.; Gasser, C.S. Overlapping and antagonistic activities of BASIC PENTACYSTEINE genes affect a range of developmental processes in Arabidopsis. Plant J. 2011, 66, 1020–1031. [Google Scholar]
  11. Meister, R.J.; Williams, L.A.; Monfared, M.M.; Gallagher, T.L.; Kraft, E.A.; Nelson, C.G.; Gasser, C.S. Definition and interactions of a positive regulatory element of the Arabidopsis INNER NO OUTER promoter. Plant J. 2004, 37, 426–438. [Google Scholar] [CrossRef]
  12. Kooiker, M.; Airoldi, C.A.; Losa, A.; Manzotti, P.S.; Finzi, L.; Kater, M.M.; Colombo, L. BASIC PENTACYSTEINE1, a GA Binding Protein That Induces Conformational Changes in the Regulatory Region of the Homeotic Arabidopsis Gene SEEDSTICK. Plant Cell 2005, 17, 722–729. [Google Scholar] [CrossRef]
  13. Wu, J.; Mohamed, D.; Dowhanik, S.; Petrella, R.; Gregis, V.; Li, J.; Wu, L.; Gazzarrini, S. Spatiotemporal Restriction of FUSCA3 Expression by Class I BPCs Promotes Ovule Development and Coordinates Embryo and Endosperm Growth. Plant Cell 2020, 32, 1886–1904. [Google Scholar] [PubMed]
  14. Li, Q.; Wang, M.; Fang, L. BASIC PENTACYSTEINE2 negatively regulates osmotic stress tolerance by modulating LEA4-5 expression in Arabidopsis thaliana. Plant Physiol. Biochem. 2021, 168, 373–380. [Google Scholar] [PubMed]
  15. Lee, Y.C.; Tsai, P.T.; Huang, X.X.; Tsai, H.L. Family Members Additively Repress the Ectopic Expression of BASIC PENTACYSTEINE3 to Prevent Disorders in Arabidopsis Circadian Vegetative Development. Front. Plant Sci. 2022, 13, 919946. [Google Scholar]
  16. Mu, Y.; Zou, M.; Sun, X.; He, B.; Xu, X.; Liu, Y.; Zhang, L.; Chi, W. BASIC PENTACYSTEINE Proteins Repress ABSCISIC ACID INSENSITIVE4 Expression via Direct Recruitment of the Polycomb-Repressive Complex 2 in Arabidopsis Root Development. Plant Cell Physiol. 2017, 58, 607–621. [Google Scholar] [PubMed]
  17. Simonini, S.; Kater, M.M. Class I BASIC PENTACYSTEINE factors regulate HOMEOBOX genes involved in meristem size maintenance. J. Exp. Bot. 2014, 65, 1455–1465. [Google Scholar]
  18. Yan, J.; Liu, Y.; Yang, L.; He, H.; Huang, Y.; Fang, L.; Scheller, H.V.; Jiang, M.; Zhang, A. Cell wall β-1,4-galactan regulated by the BPC1/BPC2-GALS1 module aggravates salt sensitivity in Arabidopsis thaliana. Mol. Plant 2021, 14, 411–425. [Google Scholar] [CrossRef]
  19. Sangwan, I.; O’Brian, M.R. Identification of a soybean protein that interacts with GAGA element dinucleotide repeat DNA. Plant Physiol. 2002, 129, 1788–1794. [Google Scholar] [CrossRef]
  20. Santi, L.; Wang, Y.; Stile, M.R.; Berendzen, K.; Wanke, D.; Roig, C.; Pozzi, C.; Müller, K.; Müller, J.; Rohde, W.; et al. The GA octodinucleotide repeat binding factor BBR participates in the transcriptional regulation of the homeobox gene Bkn3. Plant J. 2003, 34, 813–826. [Google Scholar]
  21. Gong, R.; Cao, H.; Zhang, J.; Xie, K.; Wang, D.; Yu, S. Divergent functions of the GAGA-binding transcription factor family in rice. Plant J. 2018, 94, 32–47. [Google Scholar] [CrossRef] [PubMed]
  22. Li, S.; Miao, L.; Huang, B.; Gao, L.; He, C.; Yan, Y.; Wang, J.; Yu, X.; Li, Y. Genome-Wide Identification and Characterization of Cucumber BPC Transcription Factors and Their Responses to Abiotic Stresses and Exogenous Phytohormones. Int. J. Mol. Sci. 2019, 20, 5048. [Google Scholar] [CrossRef] [PubMed]
  23. Lee, H.; Chawla, H.S.; Obermeier, C.; Dreyer, F.; Abbadi, A.; Snowdon, R. Chromosome-Scale Assembly of Winter Oilseed Rape Brassica napus. Front. Plant Sci. 2020, 11, 496. [Google Scholar] [CrossRef]
  24. Guruprasad, K.; Reddy, B.V.B.; Pandit, M. Correlation between stability of a protein and its dipeptide composition: A novel approach for predicting in vivo stability of a protein from its primary sequence. Protein Eng. 1990, 4, 155–161. [Google Scholar] [CrossRef]
  25. Edgar, R.C. MUSCLE: Multiple sequence alignment with high accuracy and high throughput. Nucleic Acids Res. 2004, 32, 1792–1797. [Google Scholar] [CrossRef] [PubMed]
  26. Gray, W. Hormonal Regulation of Plant Growth and Development. PLoS Biol. 2004, 2, e311. [Google Scholar] [CrossRef]
  27. Wu, S.; Gallagher, K.L. Transcription factors on the move. Curr. Opin. Plant Biol. 2012, 15, 645–651. [Google Scholar] [CrossRef]
  28. Cavell, A.C.; Lydiate, D.J.; Parkin, I.A.P.; Dean, C.; Trick, M. Collinearity between a 30-centimorgan segment of Arabidopsis thaliana chromosome 4 and duplicated regions within the Brassica napus genome. Genome 1998, 41, 62–69. [Google Scholar] [CrossRef]
  29. Chalhoub, B.; Denoeud, F.; Liu, S.; Parkin, I.A.P.; Tang, H.; Wang, X.; Chiquet, J.; Belcram, H.; Tong, C.; Samans, B.; et al. Early allopolyploid evolution in the post-Neolithic Brassica napus oilseed genome. Science 2014, 345, 950–953. [Google Scholar] [CrossRef]
  30. Lu, K.; Wei, L.; Li, X.; Wang, Y.; Wu, J.; Liu, M.; Zhang, C.; Chen, Z.; Xiao, Z.; Jian, H.; et al. Whole-genome resequencing reveals Brassica napus origin and genetic loci involved in its improvement. Nat. Commun. 2019, 10, 1154. [Google Scholar] [CrossRef]
  31. Shaul, O. How introns enhance gene expression. Int. J. Biochem. Cell Biol. 2017, 91 Pt B, 145–155. [Google Scholar]
  32. Chen, J.; Wang, B.; Chung, J.S.; Chai, H.; Liu, C.; Ruan, Y.; Shi, H. The role of promoter cis-element, mRNA capping, and ROS in the repression and salt-inducible expression of AtSOT12 in Arabidopsis. Front. Plant Sci. 2015, 6, 974. [Google Scholar] [CrossRef]
  33. Lescot, M.; Gert, G.; Marchal, K.; Moreau, Y.; Déhais, P.; Van de Peer, Y.; Rouzé, P.; Rombauts, S. PlantCARE, a database of plant cis-acting regulatory elements and a portal to tools for in silico analysis of promoter sequences. Nucleic Acids Res. 2002, 30, 325–327. [Google Scholar] [CrossRef] [PubMed]
  34. Wittkopp, P.J.; Kalay, G. Cis-regulatory elements: Molecular mechanisms and evolutionary processes underlying divergence. Nat. Rev. Genet. 2011, 13, 59–69. [Google Scholar] [CrossRef] [PubMed]
  35. Hecker, A.; Brand, L.H.; Peter, S.; Simoncello, N.; Kilian, J.; Harter, K.; Gaudin, V.; Wanke, D. The Arabidopsis GAGA-Binding Factor BASIC PENTACYSTEINE6 Recruits the POLYCOMB-REPRESSIVE COMPLEX1 Component LIKE HETEROCHROMATIN PROTEIN1 to GAGA DNA Motifs. Plant Physiol. 2015, 168, 1013–1024. [Google Scholar] [CrossRef] [PubMed]
  36. Finn, R.D.; Coggill, P.; Eberhardt, R.Y.; Eddy, S.R.; Mistry, J.; Mitchell, A.L.; Potter, S.C.; Punta, M.; Qureshi, M.; Sangrador-Vegas, A.; et al. The Pfam protein families database: Towards a more sustainable future. Nucleic Acids Res. 2016, 44, D279–D285. [Google Scholar] [CrossRef]
  37. Letunic, I.; Doerks, T.; Bork, P. SMART 7: Recent updates to the protein domain annotation resource. Nucleic Acids Res. 2012, 40, D302–D305. [Google Scholar] [CrossRef]
  38. Kumar, S.; Stecher, G.; Tamura, K. MEGA7: Molecular Evolutionary Genetics Analysis Version 7.0 for Bigger Datasets. Mol. Biol. Evol. 2016, 33, 1870–1874. [Google Scholar] [CrossRef]
  39. Saitou, N.; Nei, M. The neighbor-joining method: A new method for reconstructing phylogenetic trees. Mol. Biol. Evol. 1987, 4, 406–425. [Google Scholar]
  40. Chen, C.; Chen, H.; Zhang, Y.; Thomas, H.R.; Frank, M.H.; He, Y.; Xia, R. TBtools: An Integrative Toolkit Developed for Interactive Analyses of Big Biological Data. Mol. Plant 2020, 13, 1194–1202. [Google Scholar] [CrossRef]
  41. Wang, Y.; Tang, H.; Debarry, J.D.; Tan, X.; Li, J.; Wang, X.; Lee, T.H.; Jin, H.; Marler, B.; Guo, H.; et al. MCScanX: A toolkit for detection and evolutionary analysis of gene synteny and collinearity. Nucleic Acids Res. 2012, 40, e49. [Google Scholar] [CrossRef] [PubMed]
  42. Bailey, T.L.; Johnson, J.; Grant, C.E.; Noble, W.S. The MEME Suite. Nucleic Acids Res. 2015, 43, W39–W49. [Google Scholar] [PubMed]
Figure 1. Location of BnaBPC genes on the chromosomes of B. napus cultivar ‘ZS11’. The chromosome size is expressed by length. The chromosome number is displayed on the left of each chromosome. The color variation represents the density of the region, where blue indicates low, yellow indicates medium, and red indicates high. A black line indicates the relative position of each BnaBPC gene. The scale bar on the left side is displayed as megabases (Mb).
Plants 14 01136 g001
Figure 2. Phylogenetic analysis of BPC proteins in A. thaliana, B. napus, B. oleracea, and B. rapa. BPC family proteins are grouped into I, II, and III subfamilies, indicated by red-, blue-, and green-colored arcs, respectively. The black triangle indicates AtBPC proteins. At: A. thaliana, Bna: B. napus, Bra: B. rapa, and Bol: B. oleracea.
Plants 14 01136 g002
Figure 3. Circular representations of BnaBPC chromosomal dispersal and inter-chromosomal interactions, as well as synteny analysis of BPC genes in B. rapa, B. oleracea, B. napus, and A. thaliana. (A) Analysis of syntenic relationships between BnaBPC paralog pairs. In the schematic image, red lines show duplicate pairs of BnaBPCs. (B) Analysis of syntenic relationships between BraBPCs, BolBPCs, BnaBPCs, and AtBPCs, as indicated by blue lines.
Plants 14 01136 g003
Figure 4. Evolutionary selection analysis of BnaBPC paralog pairs based on Ka/Ks ratios. Blue lines represent Ka values (nonsynonymous substitution rate), orange lines denote Ks values (synonymous substitution rate), and red lines indicate Ka/Ks ratios. Ratios > 1 suggest positive selection, <1 indicate purifying selection, and ≈1 represent neutral evolution. The X-axis shows paralog pairs, while the Y-axis represents the corresponding values of Ka, Ks, and Ka/Ks ratios.
Plants 14 01136 g004
Figure 5. Schematic diagram of gene structures, conserved motifs, and conserved protein domains of BnaBPC genes. (A) Subfamily classification. (B) The conserved motifs of BnaBPC proteins. The motifs, numbers 1–10, are represented with different colored boxes in the BnaBPC proteins. The scale at the bottom is used to estimate the length of proteins. (C) Gene structures of BnaBPC genes. Green boxes represent exons, and light gray lines indicate introns. Yellow boxes indicate the untranslated regions (UTRs). The scale at the bottom represents the length of genes. (D) The structural domains of BnaBPC proteins. The scale at the bottom is used to estimate the length of proteins.
Plants 14 01136 g005
Figure 6. Predicted cis-elements in the promoter of BnaBPC genes. (A) Subfamily classification. (B) The location of different cis-elements on the 2000 bp promoter sequence upstream of the start codon of each BnaBPC gene. The different colored boxes indicate different cis-elements. (C) The numbers of the different cis-elements. The numbers and color scale represent the Log2 (motif number). (D) Analysis of the distribution and classification of cis-elements in BnaBPCs.
Plants 14 01136 g006
Figure 7. Expression profiles of BnaBPC genes in various tissues of B. napus cultivar ‘ZS11’. (A) Publicly available RNA-Seq data of different tissues, as indicated at the bottom, were obtained from the BnIR database. The color scale represents relative expression levels, with low expression in blue and high expression in red. The scale bar represents Log2(TPM)-normalized expression. The axes indicate BnaBPCs and the phylogenetic tree. (B) RT-qPCR validation of BnaA07.BPC6, BnaA09.BPC6, BnaC06.BPC6, and BnaC08.BPC6 in different tissues, with BnaGAPDH serving as the internal control. The error bars represent the standard deviation (SD) of three biological replicates.
Plants 14 01136 g007
Table 1. Physical and chemical properties of BPC family proteins in B. napus.
Gene IDGene NameLocationLengthMolecular Weight (Da)pIInstability IndexAliphatic IndexGRAVYSubcellular Localization
BnaA06G0096700ZSBnaA06.BPC2A06:5788186..579122357065,234.188.6655.7868.6−0.791nuclear
BnaA08G0270900ZSBnaA08.BPC2A08:26026857..2602767827330,490.569.5157.7352.53−0.84nuclear
BnaA09G0631800ZSBnaA09.BPC2A09:61219562..6122040127931,216.449.6553.6350.36−0.853nuclear
BnaC05G0118800ZSBnaC05.BPC2C05:7417299..742037656965,338.518.9257.3071.97−0.764nuclear
BnaC08G0230300ZSBnaC08.BPC2-2C08:32814996..3281581127130,205.259.5154.9651.48−0.845nuclear
BnaC08G0489500ZSBnaC08.BPC2C08:50925950..5092678927931,200.449.6552.1451.04−0.837nuclear
BnaA02G0171100ZSBnaA02.BPC3A02:10179794..1018235030834,783.849.5849.5563.64−0.605nuclear
BnaC02G0219700ZSBnaC02.BPC3C02:19442545..1947417037041,534.449.5552.4865.59−0.561nuclear
BnaA04G0137800ZSBnaA04.BPC4A04:15262407..1526335728631,885.169.1734.8770.70−0.699nuclear
BnaC04G0428300ZSBnaC04.BPC4C04:55284453..5528540328431,618.839.0537.5166.73−0.708nuclear
BnaC08G0454400ZSBnaC08.BPC4C08:48985111..4898593513414,968.8910.4626.5082.31−0.753nuclear
BnaA01G0002800ZSBnaA01.BPC5A01:296800..29776228732,212.389.4455.3865.68−0.819nuclear
BnaA06G0450000ZSBnaA06.BPC5A06:48524214..4852500226229,681.829.2757.6366.37−0.833nuclear
BnaA08G0198900ZSBnaA08.BPC5A08:22511939..2251288528431,838.199.2954.6363.63−0.866nuclear
BnaC01G0002300ZSBnaC01.BPC5C01:161333..16226628231,760.99.4652.0466.13−0.828nuclear
BnaC03G0671500ZSBnaC03.BPC5C03:64845945..6484687527931,413.769.4055.9362.33−0.861nuclear
BnaC07G0547100ZSBnaC07.BPC5C07:60724181..6072499026930,443.69.2658.4164.65−0.863nuclear
BnaA04G0017300ZSBnaA04.BPC6A04:1121999..1122989 30534,288.769.3559.0458.00−0.922nuclear
BnaA07G0211100ZSBnaA07.BPC6A07:22160943..2216324934138,028.139.2852.7157.01−0.859nuclear
BnaA09G0548200ZSBnaA09.BPC6A09:56780945..5678221031635,778.639.4750.7958.45−0.876nuclear
BnaC04G0278000ZSBnaC04.BPC6C04:38436311..3843734431535,646.129.2551.2355.52−0.979nuclear
BnaC06G0222600ZSBnaC06.BPC6C06:33449718..33450832 34038,057.179.2052.3057.44−0.869nuclear
BnaC08G0394500ZSBnaC08.BPC6C08:45482887..4548410830033,903.279.5157.6653.77−1.010nuclear
BnaA03G0169700ZSBnaA03.BPC7A03:8638747..863984727029,757.79.9252.3372.93−0.375nuclear
BnaC03G0196600ZSBnaC03.BPC7C03:11259402..1126009122925,501.369.7558.0460.00−0.601nuclear
Disclaimer/Publisher’s Note: The statements, opinions and data contained in all publications are solely those of the individual author(s) and contributor(s) and not of MDPI and/or the editor(s). MDPI and/or the editor(s) disclaim responsibility for any injury to people or property resulting from any ideas, methods, instructions or products referred to in the content.

