Abstract
Rapid climate change has significantly impacted species distribution patterns, necessitating a comprehensive understanding of dominant tree dynamics for effective forest resource management and utilization. The Camellia subgenus Camellia, a widely distributed taxon in subtropical China, represents an ecologically and economically important group of woody plants valued for both oil production and ornamental purposes. In this study, we employed the BIOMOD2 ensemble modeling framework to investigate the spatial distribution patterns and range dynamics of the subgenus Camellia under projected climate change scenarios. Our analysis incorporated 1455 georeferenced occurrence records from 15 species, following the filtering of duplicate points, along with seven bioclimatic variables selected after highly correlated factors were eliminated. The ensemble model, which integrates six single species distribution models, demonstrated robust predictive performance, with mean true skil l statistic (TSS) and area under curve (AUC) values exceeding 0.8. Our results identified precipitation of the coldest quarter (Bio19) and temperature seasonality (Bio4) as the primary determinants influencing species distribution patterns. The center of species richness for the subgenus Camellia was located in the Nanling Mountains and eastern Guangxi Zhuang Autonomous Region. The projections indicate an overall expansion of suitable habitats for the subgenus under future climate conditions, with notable scenario-dependent variations: distribution hotspots are predicted to increase by 8.86% under the SSP126 scenario but experience a 2.53% reduction under the SSP585 scenario. Furthermore, a westward shift in the distribution centroid is anticipated. To ensure long-term conservation of Camellia genetic resources, we recommend establishing a germplasm conservation center in the Nanling Mountains region, which represents a critical biodiversity hotspot for this taxon.
1. Introduction
Biodiversity loss caused by climate change and human activities is one of the most pressing global challenges facing humanity today [1]. Climate warming, increased drought frequency, extreme weather events, and expanding desertification have significantly altered species distributions [2,3]. For example, a comparison of plant cover surveys (1977 vs. 2006–2007) along a 2314 m elevation gradient in Southern California’s Santa Rosa Mountains revealed that dominant plant species shifted upward by approximately 65 m [4]. This elevational shift coincided with regional climate changes recorded during the 30 years preceding the later survey, including warming temperatures, increased precipitation variability, and reduced snowfall, demonstrating climate change’s substantial impact on species distribution. According to the Intergovernmental Science-Policy Platform on Biodiversity and Ecosystem Services (IPBES), approximately 25% of organisms are currently threatened with extinction [5]. Understanding species distribution dynamics is essential for developing effective conservation strategies and sustainably utilizing species resources. This is particularly critical for keystone forest tree species, as their population dynamics can trigger cascading effects throughout ecosystems due to their central ecological roles [6]. Moreover, native plants, in stark contrast to plantations with simple structures, are far more effective in supporting biodiversity conservation and are unparalleled in realizing a wide range of crucial ecosystem services [7,8]. These services include significant surface carbon storage, highly efficient soil conservation, and excellent water conservation [8].
Species distribution modeling (SDM), also referred to as ecological niche modeling, integrates species occurrence data with environmental variables via statistical and machine learning algorithms to predict potential species distributions [9,10]. This approach has been widely applied in biogeography and conservation biology to assess species distribution shifts under climate change scenarios, identify biodiversity hotspots, and determine suitable areas for ex situ conservation of threatened species [9,11,12,13]. Among the various SDM approaches, the Maximum Entropy Model (MAXENT) has gained widespread popularity due to its user-friendly interface and high predictive accuracy. Other commonly used models include Generalized Additive Models (GAMs), Artificial Neural Networks (ANNs), Surface Range Envelopes (SREs), Flexible Discriminant Analysis (FDA), and Random Forests (RFs). However, the performance of these models varies depending on their underlying algorithms and assumptions [14]. To address model uncertainty and enhance predictive accuracy, the R package BIOMOD2 has been developed to integrate multiple modeling approaches, generating ensemble predictions through consensus methods such as boundary value analysis, commonality assessment, or probability weighting [15,16,17].
Camellia (Theaceae), a genus comprising approximately 280 species, is primarily distributed across the tropical and subtropical regions of central, southern, and southwestern China. It represents a key component of China’s subtropical evergreen broad-leaved forests (EBLFs) and serves as a valuable source of woody oilseeds and ornamental trees [18]. The genus Camellia is taxonomically divided into four subgenera based on morphological characteristics, including tegument differentiation and ovary compartment number: Protocamellia, Camellia, Thea, and Metacamellia [19]. The subgenus Camellia is further classified into seven sections: Sect. Camellia, Sect. Furfuracea, Sect. Luteoflora, Sect. Oleifera, Sect. Paracamellia, Sect. Pseudocamellia, and Sect. Tuberculata [20]. Many species within the subgenus Camellia are economically important and are being utilized for beverages, ornamental purposes, and oilseed production. For example, the seeds of Camellia oleifera and Camellia vietnamensis are rich in oil, making them valuable raw materials for edible oils, industrial oils, and cosmetic products [21]. Species within Sect. Camellia, such as Camellia japonica, Camellia pitardii, and Camellia reticulata, are widely cultivated for their striking floral beauty and vibrant colors, making them highly prized ornamentals [22]. Additionally, Sect. Furfuracea has significant potential for landscape applications [23]. The diverse ecological and economic applications of the subgenus Camellia underscore its dual significance as both an ecologically vital component of EBLFs and a valuable resource for human livelihoods.
Recent studies suggest that ongoing global climate change will significantly influence the distribution patterns of subgenus Camellia species. For example, research on C. edithae predicts a contraction in its distribution range under future climate scenarios with increasing carbon emissions [24]. In contrast, C. reticulata is projected to benefit from climate warming, with its suitable distribution area expected to expand northward [25]. Current research primarily focuses on the distribution dynamics of individual species within the subgenus Camellia. However, the species diversity distribution patterns across the entire subgenus and their distribution dynamics under future climate change remain unclear.
This study combines extensive distribution data of Camellia subgenus species with BIOMOD2 ensemble modeling to achieve three objectives: (1) identify key climatic drivers governing the subgenus’ distribution patterns; (2) map current biodiversity hotspots of Chinese Camellia; and (3) project future distribution shifts under climate change scenarios. As a keystone lineage in China’s subtropical evergreen broad-leaved forests (EBLFs), Camellia’s distribution dynamics hold critical implications. Understanding these patterns will both advance resource management strategies for this ecologically vital group and elucidate EBLF responses to future climate change.
2. Results
2.1. Model Accuracy Evaluation
In terms of simulation accuracy and reproducibility, RF and MAXENT demonstrated superior performance, with mean TSS and AUC values exceeding 0.8. In contrast, SRE exhibited relatively low mean TSS, AUC, and Kappa values during pre-evaluations for most species in subgenus Camellia, resulting in its limited participation in the construction of the ensemble model. The average TSS and AUC values generated by the remaining three models were within the range delimited by the extreme values exhibited by RF, MAXENT, and SRE; the average Kappa value exceeds 0.6. (Figure 1). Consequently, the final ensemble model predominantly integrated five models with optimal evaluation outcomes: ANN, FDA, GAM, MAXENT, and RF.
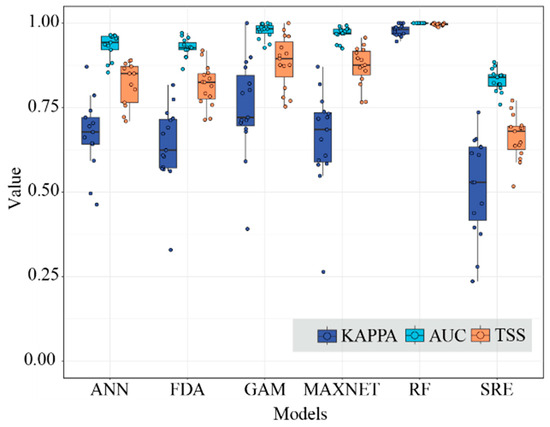
Figure 1.
The Kappa, AUC, and TSS values of the six models.
2.2. Climate Effects on Species Distribution
Correlation analysis identified seven key climatic variables influencing subgenus Camellia distribution: Bio2 (mean diurnal range), Bio3 (isothermality), Bio4 (temperature seasonality), Bio5 (max temperature of warmest month), Bio15 (precipitation seasonality), Bio18 (precipitation of warmest quarter), and Bio19 (precipitation of coldest quarter) (Table 1). Among these, Bio19 was the most important variable affecting the distribution of the subgenus Camellia, followed by Bio4. Species-specific responses varied: C. brevistyla, C. japonica, C. sasanqua, and C. polyodonta were primarily driven by Bio2 and Bio19; C. grijsii, C. pitardii, C. saluenensis, and C. vietnamensis by Bio4 and Bio18; C. kissi, C. furfuracea, and C. edithae by Bio4 and Bio19; C. reticulata by Bio3 and Bio4; C. semiserrata by Bio18 and Bio19; C. chekiangoleosa predominantly by Bio19; and C. oleifera by Bio4 and Bio2 (Table 1).

Table 1.
The contribution of climatic variables on distribution ranges of 15 species in subgenus Camellia predicted by SDMs. Contribution rate in %.
2.3. Current Distribution Patterns
The subgenus Camellia was mainly distributed in southern China, encompassing regions such as Guangxi, Hunan, Sichuan, Guangdong, Fujian, Guizhou, Jiangxi, Hainan, and Taiwan. Richness hotspots clustered in the southern Nanling Mountains, eastern Guangxi Zhuang Autonomous Region, and Fuzhou (Fujian). A distinct latitudinal gradient was observed, with species diversity declining northward (Figure 2).
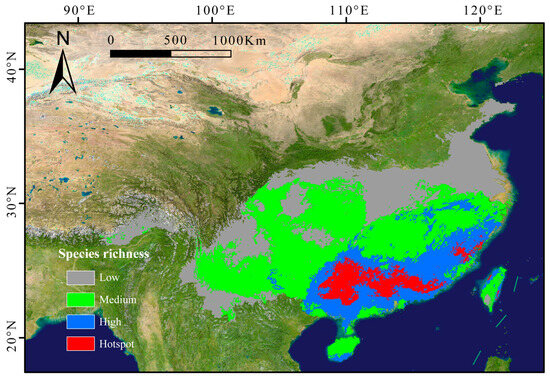
Figure 2.
Predicted richness maps of subgenus Camellia in China in the current periods. Low richness: 1~3 species; medium richness: 3~6 species; high richness: 6~9 species; hotspot: > 9 species.
2.4. Effects of Climate Change on the Distribution Patterns of Subgenus Camellia
The model predicted that under future climatic scenarios (2081–2100), subgenus Camellia would maintain its core distribution in southern China while exhibiting differential range dynamics across emission pathways. The current total suitable area encompasses 2.25 × 10⁶ km2, comprising hotspot (1.4 × 10⁵ km2), high- (3.8 × 10⁵ km2), medium- (9.4 × 10⁵ km2), and low-suitability (7.9 × 10⁵ km2) zones (Table 2). Future climatic scenarios indicated an expansion trend in both the distribution range and proportion of suitable areas for the subgenus Camellia (Table 2).
Table 2.
Species richness areas (km2) of subgenus Camellia in the current and future periods with different climatic scenarios.
Under the SSP126 scenario, the richness hotspots and high-richness regions of subgenus Camellia, which were projected to be mainly concentrated in the eastern part of Guangxi Zhuang Autonomous Region, were projected to expand (Figure 3a). And the medium species richness and low species richness showed a decreasing trend (Table 2).
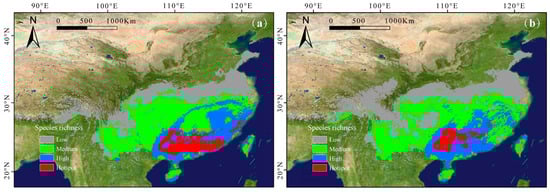
Figure 3.
Predicted richness maps of subgenus Camellia under the two future emission scenarios, SSP126 (a) and SSP585 (b). Low richness: 1~3 species; medium richness: 3~6 species; high richness: 6~9 species; hotspot: > 9 species.
Under the SSP585 scenario, richness hotspots are predicted to concentrate in the Nanling Mountains and central and northeastern Guangxi Zhuang Autonomous Region (Figure 3b). The distribution patterns of subgenus Camellia are more sensitive to climate change, with the distribution hotspots and the medium species richness areas decreasing to varying degrees. The low species richness areas increased significantly, while high richness areas expanded slightly.
The species quantity changes in subgenus Camellia exhibited a distinct spatial pattern under different future climatic scenarios. Under the SSP585 scenario, significant species loss is predicted to primarily concentrate in currently high species richness areas, particularly in Fujian Province (Figure 4b). Species numbers in the Nanling Mountains are predicted to increase under the SSP126 climatic scenario (Figure 4a).
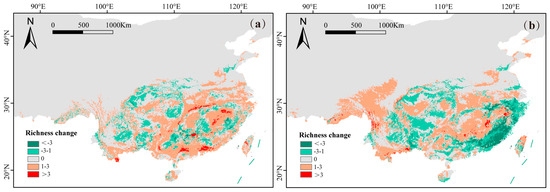
Figure 4.
The species quantity change distribution of subgenus Camellia under future climatic scenarios, SSP126 (a) and SSP585 (b).
From a single species perspective, under the SSP126 scenario, C. brevistyla (Figure 5(a1,a2)), C. grijsii, C. kissi, C. furfuracea (Figure 5(b1,b2)), C. polyodonta, C. pitardii (Figure 5(c1,c2)), C. saluenensis, C. semiserrata, C. edithae, C. japonica, C. chekiangoleosa, C. sasanqua, and C. oleifera (Figure 5(d1,d2)) exhibited expansions in total suitable areas (Table S1), while the highly suitable areas of C. polyodonta, C. pitardii, and C. oleifera are predicted to decrease. In contrast, while the suitable areas of C. reticulata and C. vietnamensis are predicted to contract, the highly suitable areas of C. vietnamensis are predicted to expand.
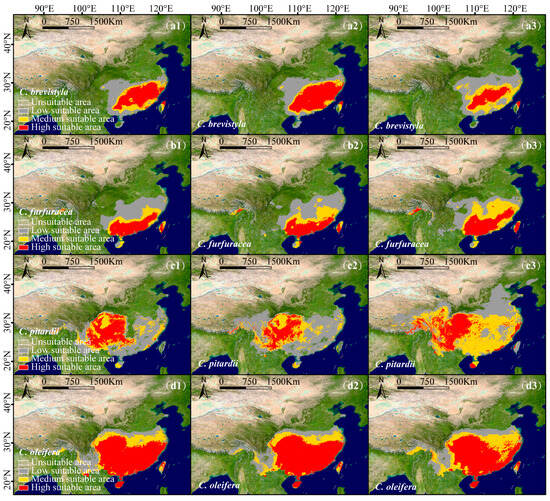
Figure 5.
Predicted suitable areas of single species of the subgenus Camellia in China under current and future conditions: C. brevistyla: (a1–a3), C. furfuracea: (b1–b3), C. pitardii: (c1–c3), C. oleifera: (d1–d3). Panels 1–3 represent Current, SSP126, and SSP585 scenarios. The classification thresholds for each species are listed in Table S2.
Under the SSP585 scenario, all species demonstrated significant range expansions (Figure 5(b3)) (Table S1). C. pitardii (Figure 5(c3)) had the most significant increase, with a total suitable area expanding by 1.38 × 10⁶ km2, while C. polyodonta displayed minimal growth, with only a 7.99 × 10⁴ km² increase. The highly suitable areas of C. brevistyla (Figure 5(a3)), C. polyodonta, C. chekiangoleosa, and C. oleifera (Figure 5(d3)) are predicted to decrease, while those of the other species are predicted to expand (Table S1).
2.5. Centroid Shift Under Climatic Scenarios
The degree of centroid migration among subgenus Camellia species varied under different climatic scenarios (Table S3). Compared to the current period, under the SSP126 climatic scenario, C. polyodonta displayed the smallest centroid shift (5.01 km), with all centroids remaining within Chenzhou City, Hunan Province. In contrast, the centroid of C. pitardii exhibited the largest migration range, shifting 127.12 km westward from Zunyi City to Bijie City, Guizhou Province (Figure 6a). Under the SSP585 climatic scenario, C. japonica had the smallest change in distribution centroid, shifting westward from Xinhua County to Xupu County, Hunan Province, with a migration distance of 42.69 km. C. pitardii had the largest migration, with a migration distance of 318.15 km westward from Zunyi City to Bijie City in Guizhou Province (Figure 6b).
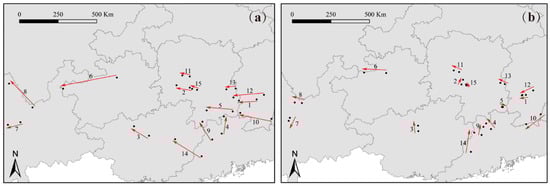
Figure 6.
The director of centroid migration under the SSP126 climatic scenario (a) and SSP585 climatic scenario (b) for the 15 species of the subgenus Camellia.
Overall, under future climate change, the distribution centroids of subgenus Camellia species are projected to shift slightly northwestward. The intensity of these shifts is notably greater under the SSP585 scenario compared to SSP126, reflecting the heightened impact of more extreme climatic conditions on species distribution dynamics.
3. Discussion
3.1. Overall Model Evaluation
Prior to constructing the final model, evaluating the performance of single models was essential to ensure accurate predictions. Different modeling algorithms have distinct advantages and limitations. For example, MAXENT is capable of fitting complex response curves even with limited occurrence data [26]. ANNs excel at processing complex, nonlinear relationships that are challenging to represent via traditional methods [27]. RF combines ensemble learning and parallel computing to achieve high computational efficiency and predictive accuracy [28]. The FDA provides robust discriminant analyses [29], whereas the SRE represents a traditional climate-envelope model with a relatively simple algorithmic structure [30]. Previous studies have demonstrated that reliance on a single modeling approach significantly limits predictive utility, as different models often yield divergent results even when applied to the same dataset [31,32]. To mitigate the biases associated with single-model approaches, the BIOMOD2 ensemble modeling platform integrates multiple models to simulate species distribution ranges, employing consensus methods, such as boundary values, commonality, or probability weighting, to generate robust predictions [33]. Biomod2 has been successfully applied to predict the distributions of various taxa, including Haloxylon [34], Tsuga chinensis [35], and Ambrosia L. [36].
The ensemble model leveraged the strengths of single models, achieving higher AUC, Kappa, and TSS values. This approach provides a more comprehensive and accurate simulation of the distribution of the subgenus Camellia, demonstrating superior predictive performance. Furthermore, the simulated distribution patterns closely aligned with the actual distribution of the subgenus Camellia, validating the scientific rigor and accuracy of the ensemble model.
3.2. Climatic Contributions to Distribution Patterns
The combined effects of temperature and precipitation play a critical role in shaping plant growth and distribution [37]. For example, temperature seasonality (Bio4), the maximum temperature of the warmest month (Bio5), and precipitation of the driest quarter (Bio17) were identified as key climatic factors determining the suitable habitat of Phoebe bournei [38]. Similarly, the distribution of Manglietia fordiana is constrained by precipitation of the driest month (Bio14), temperature seasonality (Bio4), precipitation of the warmest quarter (Bio18), and the minimum temperature of the coldest month (Bio6) [39]. For the subgenus Camellia, the most influential climatic factors are precipitation of the coldest season (Bio19) and temperature seasonality (Bio4). The distribution hotspots of the subgenus Camellia are predominantly located in southern subtropical China, where the warm, humid monsoon climate creates favorable conditions for species growth [40]. Extreme temperatures, whether excessively low or high, can adversely affect plant growth and development [41]. Temperature seasonality (Bio4), which reflects annual temperature variation, serves as an important indicator of seasonal temperature differentiation and climatic stability. According to the climate stability hypothesis, stable climatic conditions promote the availability of diverse natural resources, increasing species survival and adaptation [42]. In contrast, significant climatic fluctuations can disrupt plant growth rhythms and threaten species survival, leading to reduced species richness in regions with high temperature seasonality [43]. This pattern aligns with Rapoport’s rule, which posits that species richness decreases with increasing latitude due to greater temperature seasonality [44]. This trend explains the observed latitudinal gradient in species richness within the subgenus Camellia, with richness declining from south to north.
3.3. Species Distribution Dynamics
Paleoclimate analyses indicate that humid tropical and subtropical climates have been prevalent throughout China’s geological history, fostering the diversification of numerous plant groups adapted to warm, humid conditions [40]. The subgenus Camellia, a key component of EBLFs, is widely distributed across subtropical regions of China [7]. Currently, the subgenus Camellia exhibits high species richness in the southern Nanling Mountains, eastern Guangxi, and Fuzhou region of Fujian, with these areas supporting suitable habitats for more than nine species. Species richness within the subgenus Camellia decreases with increasing latitude, which is consistent with broader patterns of species richness in China, which generally increase from north to south, particularly in tropical and subtropical regions. For example, Cui et al. utilized microsatellite markers to demonstrate that genetic diversity in wild Camellia oleifera populations decreases with increasing latitude [45]. Similar latitudinal gradients have been observed in other plant families, including Magnoliaceae, which exhibit relatively high species richness in southeastern and southwestern China, gradually decreasing toward northern regions [46]. Fagaceae [47] and Lauraceae [48] also display comparable patterns, with species richness declining from south to north.
The southeastern region of China, characterized by a monsoon-influenced climate and diverse topography, supports a hot and humid environment that fosters high plant diversity and adaptability [49]. The Nanling Mountains, the largest east–west mountain range in southern China, serve as a natural barrier against cold air masses and are recognized as biodiversity hotspots [50]. This region functions as a Quaternary glacial refugium for Camellia species, preserving high levels of species and genetic diversity [21]. Fujian Province, located on China’s southeastern coast near the Tropic of Cancer, benefits from a warm, humid subtropical maritime monsoon climate, making it a core area for subtropical evergreen broad-leaved forests and an ideal habitat for the subgenus Camellia [51]. A previous study employing simple sequence repeat (SSR) marker technology similarly demonstrated that the subgenus Camellia, particularly Camellia chekiangoleosa populations, exhibits high genetic diversity in the Wuyi Mountains and Huaiyu Mountains [52]. Similarly, Guangxi’s subtropical humid climate and complex topography provide favorable conditions for the subgenus Camellia, which thrives in warm, acidic environments [40].
Under future climate scenarios, global warming and increased precipitation are projected to benefit the growth and distribution of the subgenus Camellia [53]. The models predicted the expansion of suitable habitats for the subgenus Camellia, with increases of 5 × 10⁴ km2 under the SSP126 scenario and 28 × 104 km2 under the SSP585 scenario. However, despite the projected overall expansion of suitable habitats, areas of high species richness and distribution hotspots may initially increase before declining under more extreme climate scenarios. Under the SSP126 scenario, hotspots are expected to increase, benefiting from moderate warming and stable precipitation patterns. These balanced climatic conditions promote habitat expansion. Under the SSP585 scenario, hotspots exhibit significant reductions, primarily due to extreme warming and aberrant precipitation fluctuations. Such climatic conditions exceed the optimal thresholds for subgenus Camellia species [53], leading to intensified habitat fragmentation in existing hotspots (e.g., Fujian and Guangxi) and subsequent species loss. While some species may adapt to changing conditions through migration, this adaptation could result in declines in species richness and contraction of hotspot ranges in specific regions. Conversely, increased precipitation and humidity are expected to benefit most subgenus Camellia species, contributing to the overall expansion of suitable habitats [54]. Consistent with the general consensus that species’ suitable habitats will shift toward higher latitudes and altitudes under global warming [35], our findings indicate that the distribution center of the subgenus Camellia will shift primarily northwestward.
3.4. Resources Management and Study Limitation
Rich species diversity serves as a critical foundation for both ecological stability and genetic resource conservation [55]. It provides abundant genetic resources for the selection and domestication of superior varieties while ensuring ecosystem resilience. The establishment of germplasm repositories in ecologically suitable regions represents an effective strategy for biodiversity conservation and sustainable resource utilization. Our study demonstrates that the Nanling region constitutes a persistent species richness center for the Camellia subgenus. Notably, this tropical biodiversity hotspot encompasses multiple protected areas with established conservation infrastructure, including the Nanling National Nature Reserve, Chebaling National Nature Reserve in Guangdong, and Mangshan National Forest Park. Based on these findings, we propose the creation of a specialized Camellia germplasm repository in this region. Such a facility would systematically preserve both interspecific diversity across Camellia taxa and intraspecific genetic variation through provenance-based collections, thereby achieving integrated conservation of species diversity and population-level genetic heterogeneity.
This study also has some limitations. First, the spatial distribution of species occurrence data may reflect sampling-accessibility biases rather than true ecological patterns, as collection efforts were predominantly confined to anthropogenically accessible zones adjacent to transportation networks [56]. Such spatial sampling artifacts could propagate geographical biases into model predictions. Future investigations should implement unmanned aerial systems for systematic surveys of topographically challenging terrains to improve data representativeness. Second, while bioclimatic variables (temperature/precipitation parameters) formed the core of our environmental predictors, the model omitted other physiologically critical determinants, including edaphic properties (soil texture/pH), topographic complexity (slope/aspect/elevation), photoperiod variations, microbial symbioses, interspecific interactions, and anthropogenic pressures [57]. Furthermore, the current framework insufficiently addresses spatial constraints on dispersal capabilities and biogeographic barriers. Model refinement could incorporate high-resolution satellite-derived environmental layers, field-validated geospatial parameters, and mechanistic dispersal filters within ensemble forecasting algorithms to constrain ecological niche projections more realistically. Third, our approach adopted the conventional species-level niche conservatism assumption, disregarding potential local adaptations arising from population genetic divergence across isolation-by-distance gradients [58]. Subsequent research should integrate landscape genomic data to identify evolutionarily significant units, enabling the development of distinct ecological niche models for genetically clustered subpopulations. This hierarchical approach would substantially improve model biological realism by accounting for intraspecific niche variation.
4. Materials and Methods
4.1. Study Area
This study investigates the subtropical ecoregion of China, demarcated by the Qinling–Huaihe Line to the north and the Nanling Mountains to the south. The study area encompasses two principal geomorphological units: the middle-lower Yangtze River Basin and the Jiangnan Hills region. Three dominant topographic formations characterize this heterogeneous landscape: (1) undulating hill systems, most prominently represented by the Jiangnan Hills; (2) intermontane sedimentary basins, including the geologically significant Sichuan Basin; and (3) elevated karst plateaus, particularly the eastern Yunnan-Guizhou Plateau.
The heterogeneous topography supports diverse ecosystems ranging from riparian corridors and montane forests to karst wetlands. Climatically, the region exhibits distinct seasonal patterns under the influence of the East Asian monsoon system: humid summers and mild winters. These bioclimatic conditions sustain one of China’s most biodiverse ecoregions, harboring approximately 20,000 vascular plant species. The zonal vegetation comprises subtropical evergreen broadleaf forests dominated by Fagaceae, Lauraceae, Theaceae, and Magnoliaceae. However, this ecologically vital region faces increasing anthropogenic pressures, particularly from agricultural intensification, urban expansion, and resource extraction activities.
4.2. Occurrence Data Collection
The distribution data of the subgenus Camellia were systematically compiled from three principal sources: (1) the National Plant Specimen Resource Center (NPSRC; http://www.cvh.ac.cn/, accessed on 1 April 2025), (2) the Global Biodiversity Information Facility (GBIF; https://www.gbif.org/, accessed on 1 April 2025), and (3) the literature published between 2000 and 2024. Initial compilation yielded 1957 occurrence records encompassing 29 species.
To ensure data quality, records with incomplete or ambiguous locality descriptions were excluded. And for records lacking geographic coordinates but containing textual descriptions of collection sites, we georeferenced these locations using the Map Location geocoding service (https://maplocation.sjfkai.com/, accessed on 1 April 2025) with a positional accuracy threshold of 1 km. Then, spatial duplicates were removed using the “dismo” package in R v.4.1.3 software [59], retaining only one occurrence per species within each 0.1° × 0.1° grid cell.
Species with fewer than 25 records were excluded to minimize stochastic errors caused by narrow distribution areas or small sample sizes [60]. The final dataset comprised 15 species with 1455 validated distribution points (Table 3).
Table 3.
The filtered occurrence data of 15 species of subgenus Camellia, utilized for subsequent analysis.
4.3. Environmental Variable Selection
The nineteen bioclimatic variables (2.5 arc-min resolution, version 2.1) were obtained from WorldClim [61,62], including current (1970–2000) and future (2081–2100) climate projections. Future climatic scenarios were derived from the CMCC-ESM2 model under two Shared Socioeconomic Pathways (SSPs): SSP126 (low emissions) and SSP585 (high emissions) [63]. The CMCC-ESM2 was selected for its advanced integration of Earth system components (atmosphere, ocean, land, biogeochemistry), alignment with IPCC AR6 standards, and capacity to simulate bioclimatic variables critical for plant distribution modeling [64]. As part of the CMIP6 ensemble, it ensures global assessment compatibility and effectively projects climate–vegetation interactions under SSP scenarios. Its proven accuracy in capturing East Asian regional dynamics (e.g., precipitation, temperature extremes) further supports habitat suitability predictions under future climate change [65]. The Shared Socioeconomic Pathways (SSPs) selected for this study represent an enhanced iteration of the Representative Concentration Pathways (RCPs), tailored to regional contexts. These pathways comprehensively incorporate socioeconomic dimensions, such as economic development, human development, technological advancement, demographics and human resources, lifestyle patterns, policy and institutional frameworks, as well as environmental and natural resource management [63]. This integrative approach effectively highlights the interplay between socioeconomic development trajectories and climate change risks.
High correlations among climate factors can lead to overfitting [66]. To eliminate highly correlated climatic variables and multicollinearity among variables, we adopted the following steps to filter the climatic variables ultimately used for simulation. First, we examined the pairwise correlations between variables and removed highly collinear variables. Then, we removed the less important climatic variable from each pair with the highest correlation (>|0.8|) using the “caret” package in R [67]. Finally, we selected seven variables that were inferred to make the highest contribution to the distribution of the subgenus Camellia for further analysis (Table 4, Figure 7).
Table 4.
Climatic variables used in species distribution models.
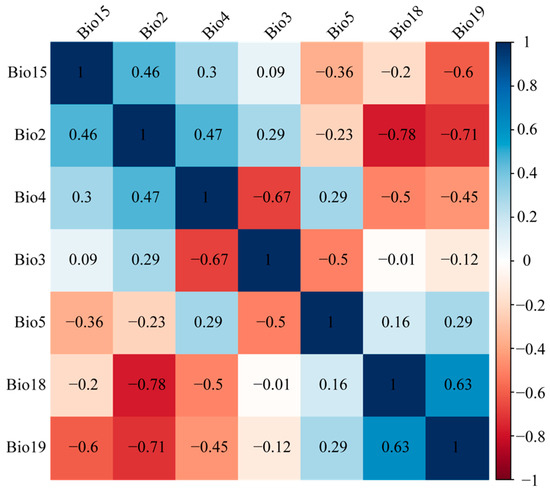
Figure 7.
Correlations among the selected climatic variables.
4.4. Species Distribution Model Construction and Evaluation
The “Biomod2” ensemble modeling platform in R was used to simulate the suitable distribution range of subgenus Camellia for current and future periods. To overcome methodological constraints of single-algorithm approaches, we employed a consensus forecasting framework incorporating six complementary algorithms: Random Forest (RF), Maximum Entropy (MAXENT), Generalized Additive Models (GAMs), Flexible Discriminant Analysis (FDA), Artificial Neural Networks (ANNs), and Surface Range Envelopes (SREs). For each species, 1000 pseudo-absence points were randomly generated within the study extent. Data were partitioned into 75% training and 25% testing sets, with 10 replicates per model to quantify stochastic uncertainty. The single models with TSS (True Skill Statistics) values ≥ 0.7 were integrated using the weighted average method, and the ensemble model was constructed with TSS values as weights for simulation.
The model’s accuracy was assessed using the area under the receiver-operating characteristic curve (AUC), the true skill statistic (TSS), and Cohen’s Kappa coefficient (Kappa) [68,69,70]. TSS and Kappa are threshold-related metrics representing the net prediction success rate of the tested samples, with values ranging from −1 to 1; higher values indicate better model performs [71]. AUC is a threshold-independent evaluation method, with values ranging from 0 to 1; the values closer to 0 indicate poor predictive performance, while higher values reflect better simulation accuracy [72]. To identify the dominant climate variables influencing the suitable distribution of subgenus Camellia, we calculated the importance of each variable using weighted superposition based on their assigned weights in the ensemble model.
4.5. Species Distribution Patterns and Centroid Migration Analysis
The distribution patterns of 15 species within the subgenus Camellia were predicted using an ensemble modeling approach, followed by binarization based on threshold values. We first extracted the habitat suitability index corresponding to species distribution points and then calculated the mean and standard deviation. Thresholds were defined as the mean habitat suitability minus one standard deviation. Areas with index values above the threshold were deemed suitable distribution areas for the species, while those below were classified as unsuitable. We overlaid these binary distributions in ArcGIS v.10.8 to identify species richness patterns for the subgenus Camellia in current and future periods. Using the Reclassify function in ArcGIS toolbox, we categorized the species distribution into four levels based on intervals of three species: low (1–3 species), medium (3–6 species), high (6–9 species), and hotspot (more than 9 species). Higher category levels indicate areas suitable for a greater number of subgenus Camellia species. Then, we calculated the area of each richness category. Additionally, the habitat suitability for single species was categorized into four distinct tiers—unsuitable, low, medium, and high—using the natural breaks (Jenks) method.
The centroids of each species and the distances between these centroids at different times were calculated using the “raster” and “geosphere” packages in R [73,74]. The coordinates of the distribution points for each species were extracted, and the latitude and longitude means were the species distribution centroids. We calculated the distances between the current and future centroids of each species and analyzed the migration directions using ArcGIS.
5. Conclusions
Our study of species distributions highlights the importance of integrating multispecies data to predict the distribution patterns and conservation priorities of the subgenus Camellia under future climate change scenarios. Our findings indicate that the range sizes of most subgenus Camellia species are likely to expand and shift toward higher latitudes by 2070 in response to climate warming. The temperature seasonality and precipitation of the coldest quarter emerged as the dominant climatic variables influencing the distribution patterns of the subgenus Camellia. Although many subgenus Camellia species are projected to experience range expansions, the majority of their suitable habitats will remain vulnerable to increasing climate variability. Based on these findings, we propose the establishment of Camellia germplasm repository for the subgenus Camellia in its species richness hotspots, such as the southern Nanling Mountains. Additionally, areas experiencing declines in species richness should be prioritized for ecological restoration and habitat reconstruction to provide increased living space and resource availability.
Supplementary Materials
The following supporting information can be downloaded at https://www.mdpi.com/article/10.3390/plants14071137/s1: Table S1 Suitable area in 15 species of subgenus Camellia in the current and future different climatic scenarios and change trends compared to the current; Table S2 The classification thresholds for unsuitability, low suitability, medium suitability, and high suitability of 15 species; Table S3 Coordinates and distance variation in centroid migration in different climatic scenarios on the 15 species of subgenus Camellia.
Author Contributions
Conceptualization, R.Y., X.-L.J., and K.-Q.X.; methodology, B.-Q.G., R.C., and Y.X.; software, B.-Q.G., R.C., and Y.X.; data curation, X.-L.J. and R.Y.; writing—original draft preparation, B.-Q.G. and Y.X.; writing—review and editing, X.-L.J., R.Y., and K.-Q.X.; supervision, X.-L.J.; funding acquisition, X.-L.J. All authors have read and agreed to the published version of the manuscript.
Funding
This research was funded by the Scientific Research Fund of Hunan Provincial Education Department, grant number 21A0158.
Data Availability Statement
Data are contained within the article.
Conflicts of Interest
The authors declare no conflicts of interest.
References
- Wang, Z.; Wang, T.; Zhang, X.; Wang, J.; Yang, Y.; Sun, Y.; Guo, X.; Wu, Q.; Nepovimova, E.; Watson, A.E.; et al. Biodiversity conservation in the context of climate change: Facing challenges and management strategies. Sci. Total Environ. 2024, 937, 173377. [Google Scholar] [CrossRef] [PubMed]
- Harris, R.M.B.; Beaumont, L.J.; Vance, T.R.; Tozer, C.R.; Remenyi, T.A.; Perkins-Kirkpatrick, S.E.; Mitchell, P.J.; Nicotra, A.B.; McGregor, S.; Andrew, N.R.; et al. Biological responses to the press and pulse of climate trends and extreme events. Nat. Clim. Change 2018, 8, 579–587. [Google Scholar] [CrossRef]
- Huang, C.M.; Liu, H.L. How Will the Weather Change Along with Global Warming? J. Shanghai Jiao Tong Univ. 2021, 55, 72–73. [Google Scholar] [CrossRef]
- Kelly, A.E.; Goulden, M.L. Rapid shifts in plant distribution with recent climate change. Proc. Natl. Acad. Sci. USA 2008, 105, 11823–11826. [Google Scholar] [CrossRef]
- Hou, Y.Z.; Zhao, W.W.; Liu, Y.X. Natural declines are “unprecedented” and extinction rates are “accelerating,” according to the IPBES Global Assessment. Acta Ecol. Sin. 2019, 39, 6943–6949. [Google Scholar] [CrossRef]
- Pongen, R. Keystone species: Ecological architects of biodiversity and stability: Review. Int. J. Sci. Res. Arch. 2024, 11, 1137–1152. [Google Scholar] [CrossRef]
- Zhu, H. Vegetation geography of evergreen broad-leaved forests in Yunnan, southwestern China. Chin. J. Plant Ecol. 2021, 45, 224–241. [Google Scholar] [CrossRef]
- Hua, F.Y.; Bruijnzeel, L.A.; Meli, P.; Martin, P.A.; Zhang, J.; Nakagawa, S.; Miao, X.R.; Wang, W.Y.; McEvoy, C.; Peña-Arancibia, J.L.; et al. The biodiversity and ecosystem service contributions and trade-offs of forest restoration approaches. Science 2022, 376, 839–844. [Google Scholar] [CrossRef]
- Guisan, A.; Zimmermann, N.E. Predictive habitat distribution models in ecology. Ecol. Model. 2000, 135, 147–186. [Google Scholar] [CrossRef]
- Franklin, J. Species distribution modelling supports the study of past, present and future biogeographies. J. Biogeogr. 2023, 50, 1533–1545. [Google Scholar] [CrossRef]
- Pulliam, H.R. On the relationship between niche and distribution. Ecol. Lett. 2002, 3, 349–361. [Google Scholar] [CrossRef]
- Liu, X.T.; Yuan, Q.; Ni, J. Research advances in modelling plant species distribution in China. Chin. J. Plant Ecol. 2019, 43, 273–283. [Google Scholar] [CrossRef]
- Austin, M.P. Spatial prediction of species distribution: An interface between ecological theory and statistical modelling. Ecol. Model. 2002, 157, 101–118. [Google Scholar] [CrossRef]
- Valavi, R.; Guillera-Arroita, G.; Lahoz-Monfort, J.J.; Elith, J. Predictive performance of presence-only species distribution models: A benchmark study with reproducible code. Ecol. Monogr. 2022, 92, e01486. [Google Scholar] [CrossRef]
- Thuiller, W. Biodiversity: Climate change and the ecologist. Nature 2007, 448, 550–552. [Google Scholar] [CrossRef]
- Thuiller, W.; Lafourcade, B.; Engler, R.; Araújo, M.B. BIOMOD—A platform for ensemble forecasting of species distributions. Ecography 2010, 32, 369–373. [Google Scholar] [CrossRef]
- Araujo, M.; New, M. Ensemble forecasting of species distributions. Trends Ecol. Evol. 2007, 22, 42–47. [Google Scholar] [CrossRef]
- Min, T.L.; Zhang, W.J. The evolution and distribution of genus Camellia. Plant Divers. 1996, 18, 1–13. [Google Scholar]
- Luo, C.Q.; Tan, X.F.; Qi, L.L. A Classification Summary on Plant of Genus Camellia. J. Cent. South For. Univ. 1999, 19, 78–81. [Google Scholar] [CrossRef]
- Wu, Z.Y.; Peng, H.; Li, D.Z. Flora of China; Science Press: Beijing, China, 1998; Volume 49. [Google Scholar]
- Qin, S.Y.; Rong, J.; Zhang, W.J.; Chen, J.K. Cultivation history of Camellia oleifera and genetic resources in the Yangtze River Basin. Biodivers. Sci. 2018, 26, 384–395. [Google Scholar] [CrossRef]
- Min, T.L. The Classification, Differentiation and Distribution of the Genus Camellia Sect. Camellia. Acta Bot. Yunnanica 1998, 20, 2–23. [Google Scholar]
- Cui, Y.; Men, Y.Y.; Chen, H.H.; Lu, Y.T.; Mao, Z.J.; Liang, R.F.; Liu, Y.H. Analysis on Resources of Sect. Furfuracea Plants of Camellia and Their Application in the Garden in China. J. Anhui Agric. Sci. 2011, 39, 14329–14330. [Google Scholar] [CrossRef]
- Chen, S.S.; Liu, X.; Tong, X.Y.; Guan, B.C. Prediction of Camellia edithae species distribution based on multi-model combination. Ecol. Sci. 2020, 39, 58–66. [Google Scholar] [CrossRef]
- Gao, C.; Fan, Z.F.; Ma, C.L.; Yang, J.X.; Guo, S.L. Prediction of suitable area of Camellia reticulata under climate change based on the Biomod2 ensemble model. Chin. J. Ecol. 2024, 43, 3526–3536. [Google Scholar] [CrossRef]
- Zhu, G.P.; Qiao, H.J. Effect of the Maxent model’s complexity on the prediction of species potential distributions. Biodivers. Sci. 2016, 24, 1189–1196. [Google Scholar] [CrossRef]
- Zhang, C.; Guo, Y.; Li, M. Review of Development and Application of Artificial Neural Network Models. Comput. Eng. Appl. 2021, 57, 57–69. [Google Scholar] [CrossRef]
- Yang, Q.P.; Wu, W.; Liu, H.B. Prediction of spatial distribution of soil available iron in a typical hilly farmland using terrain attributes and random forest model. Chin. J. Eco-Agric. 2018, 26, 422–431. [Google Scholar] [CrossRef]
- Kuemmerlen, M.; Schmalz, B.; Guse, B.; Cai, Q.; Fohrer, N.; Jähnig, S.C. Integrating catchment properties in small scale species distribution models of stream macroinvertebrates. Ecol. Model. 2014, 277, 77–86. [Google Scholar] [CrossRef]
- Araújo, M.B.; Peterson, A.T. Uses and misuses of bioclimatic envelope modeling. Ecology 2012, 93, 1527–1539. [Google Scholar] [CrossRef]
- Qiao, H.J.; Soberón, J.; Peterson, A.T. No silver bullets in correlative ecological niche modelling: Insights from testing among many potential algorithms for niche estimation. Methods Ecol. Evol. 2015, 6, 1126–1136. [Google Scholar] [CrossRef]
- Qiao, H.J.; Hu, J.H.; Huang, J.H. Theoretical Basis, Future Directions, and Challenges for Ecological Niche Models. Sci. Sin. 2013, 43, 915–927. [Google Scholar] [CrossRef]
- Buisson, L.; Thuiller, W.; Casajus, N.; Lek, S.; Grenouillet, G. Uncertainty in ensemble forecasting of species distribution. Glob. Change Biol. 2010, 16, 1145–1157. [Google Scholar] [CrossRef]
- Zhang, D.; Ma, S.M.; Wei, B.; Wang, C.C.; Zhang, L.; Yan, H. Historical distribution pattern and driving mechanism of Haloxylon in China. Biodivers. Sci. 2022, 30, 21192. [Google Scholar] [CrossRef]
- Bi, Y.F.; Xu, J.C.; Li, Q.H.; Guisan, A.; Thuiller, W.; Zimmermann, N.E. Applying BioMod for Model-Ensemble in Species Distributions:a Case Study for Tsuga chinensis in China. Plant Divers. 2013, 35, 647–655. [Google Scholar] [CrossRef]
- Xian, X.Q.; Zhao, H.X.; Wang, R.; Huang, H.K.; Chen, B.X.; Zhang, G.F.; Liu, W.X.; Wan, F.H. Climate change has increased the global threats posed by three ragweeds (Ambrosia L.) in the Anthropocene. Sci. Total Environ. 2023, 859, 160252. [Google Scholar] [CrossRef]
- Lv, J.J.; Wu, J.G. Advances in the Effects of Climate Change on the Distribution of Plant Species and Vegetation in China. Environ. Sci. Technol. 2009, 32, 85–95. [Google Scholar] [CrossRef]
- Xiao, J.H.; Ding, X.; Cai, C.N.; Zhang, C.Y.; Zhang, X.Y.; Li, L.; Li, J. Simulation of the potential distribution of Phoebe bournei with climate changes using the maximum-entropy(MaxEnt)model. Acta Ecol. Sin. 2021, 41, 5703–5712. [Google Scholar] [CrossRef]
- Zou, W.; Wang, L.; Lai, T.; Zhu, X.F.; Chen, F.S.; Zeng, J.P. Distribution, influencing factors and gaps analysis of Manglietia fordiana: Implications of conservation to mountain broad-leaved forests. Acta Ecol. Sin. 2022, 42, 1889–1900. [Google Scholar] [CrossRef]
- Ying, J.S. Species diversity and distribution pattern of seed plants in China. Biodivers. Sci. 2001, 9, 393–398. [Google Scholar] [CrossRef]
- Peng, W.F.; Zhang, D.M.; Luo, Y.M.; Tao, S.; Xu, X.L. Influence of natural factors on vegetation NDVI using geographical detection in Sichuan Province. Acta Geogr. Sin. 2019, 74, 1758–1776. [Google Scholar] [CrossRef]
- Stevens, G.C. The Latitudinal Gradient in Geographical Range: How so Many Species Coexist in the Tropics. Am. Nat. 1989, 133, 240–256. [Google Scholar] [CrossRef]
- Feng, J.M. Spatial patterns of species diversity of seed plants in China and their climatic explanation. Biodivers. Sci. 2008, 16, 470–476. [Google Scholar] [CrossRef]
- Simberloff, D.; Rapoport, E.; Drausal, B. Areography: Geographical Strategies of Species. J. Biogeogr. 1983, 10, 161. [Google Scholar] [CrossRef]
- Cui, X.Y.; Wang, W.J.; Yang, X.Q.; Li, S.; Qin, S.Y.; Rong, J. Potential distribution of wild Camellia oleifera based on ecological niche modeling. Biodivers. Sci. 2016, 24, 1117–1128. [Google Scholar] [CrossRef]
- Yan, S.X.; Li, Y.H.; Wei, F.Y. Geographical Distribution of Magnoliaceae Plants in China. Plant Sci. J. 2008, 26, 379–384. [Google Scholar] [CrossRef]
- Zhang, F.Y.; Liao, Z.Y.; Pan, K.W.; Zhang, M.; Zhao, Y.L.; Zhang, L. Species richness and endemism pattern of Fagaceae in Southwest China and their environmental interpretation. J. Appl. Ecol. 2021, 32, 2290–2300. [Google Scholar] [CrossRef]
- Zha, F.S.; He, L.X.; Yang, F.; Yang, W.; Yang, J.; Feng, J.M. Spatial Patterns of Species Diversity of Lauraceae Plants in Yunnan, China. J. Chuxiong Norm. Univ. 2008, 23, 90–94. [Google Scholar] [CrossRef]
- Duan, H.L.; Cao, F.X. Characteristics and trends of climate change of Chinese subtropical Nanling Mountain. J. Cent. South Univ. For. Technol. 2012, 32, 110–113. [Google Scholar] [CrossRef]
- Chen, D.M.; Kang, H.Z.; Liu, C.J. An Overview on the Potential Quaternary Glacial Refugia of Plants in China Mainland. Bull. Bot. Res. 2011, 31, 623–632. [Google Scholar] [CrossRef]
- Huang, Y.X.; Zha, X. Characteristics and the issues of bio-safety for the plant biodiversity in Fujian. Chin. J. Ecol. 2003, 22, 85–90. [Google Scholar]
- Huang, B.; Wang, Z.W.; Huang, J.J.; Li, X.H.; Zhu, H.; Wen, Q.; Xu, L.A. Population Genetic Structure Analysis Reveals Significant Genetic Differentiation of the Endemic Species Camellia chekiangoleosa Hu. with a Narrow Geographic Range. Forests 2022, 13, 234. [Google Scholar] [CrossRef]
- Zhou, T.J.; Chen, Z.M.; Chen, X.L.; Zuo, M.; Jiang, J.; Hu, S. Interpreting IPCC AR6: Future global climate based on projection under scenarios and on near-term information. Clim. Change Res. 2021, 17, 652–663. [Google Scholar] [CrossRef]
- Zhang, M.G.; Zhou, Z.K.; Chen, W.Y.; Cannon, C.H.; Raes, N.; Slik, J.W.F. Major declines of woody plant species ranges under climate change in Yunnan, China. Divers. Distrib. 2013, 20, 405–415. [Google Scholar] [CrossRef]
- Salgotra, R.K.; Chauhan, B.S. Genetic Diversity, Conservation, and Utilization of Plant Genetic Resources. Genes 2023, 14, 174. [Google Scholar] [CrossRef] [PubMed]
- Gutierrez-Velez, V.H.; Wiese, D. Sampling bias mitigation for species occurrence modeling using machine learning methods. Ecol. Inform. 2020, 58, 101091. [Google Scholar] [CrossRef]
- Merkenschlager, C.; Bangelesa, F.; Paeth, H.; Hertig, E. Blessing and curse of bioclimatic variables: A comparison of different calculation schemes and datasets for species distribution modeling within the extended Mediterranean area. Ecol. Evol. 2023, 13, e10553. [Google Scholar] [CrossRef] [PubMed]
- Aguirre-Liguori, J.A.; Ramírez-Barahona, S.; Gaut, B.S. The evolutionary genomics of species’ responses to climate change. Nat. Ecol. Evol. 2021, 5, 1350–1360. [Google Scholar] [CrossRef]
- Hijmans, R.J.; Phillips, S.; Leathwick, J.; Elith, J. dismo: Species Distribution Modeling, R package version 1.3-9; The Comprehensive R Archive Network: Vienna, Austria, 2022. [Google Scholar]
- Boria, R.A.; Olson, L.E.; Goodman, S.M.; Anderson, R.P. Spatial filtering to reduce sampling bias can improve the performance of ecological niche models. Ecol. Model. 2014, 275, 73–77. [Google Scholar] [CrossRef]
- Hijmans, R.J.; Cameron, S.E.; Parra, J.L.; Jones, P.G.; Jarvis, A. Very high resolution interpolated climate surfaces for global land areas. Int. J. Climatol. 2010, 25, 1965–1978. [Google Scholar] [CrossRef]
- Fick, S.E.; Hijmans, R.J. WorldClim 2: New 1-km spatial resolution climate surfaces for global land areas. Int. J. Climatol. 2017, 37, 4302–4315. [Google Scholar] [CrossRef]
- Weng, Y.W.; Cai, W.J.; Wang, C. The application and future directions of the Shared Socioeconomic Pathways(SSPs). Clim. Change Res. 2020, 16, 215–222. [Google Scholar] [CrossRef]
- Intergovernmental Panel on Climate Change. Climate Change 2022—Impacts, Adaptation and Vulnerability: Working Group II Contribution to the Sixth Assessment Report of the Intergovernmental Panel on Climate Change; Cambridge University Press: Cambridge, UK, 2023. [Google Scholar]
- Lovato, T.; Peano, D.; Butenschn, M.; Materia, S.; Iovino, D.; Scoccimarro, E.; Fogli, P.G.; Cherchi, A.; Bellucci, A.; Gualdi, S. CMIP6 Simulations with the CMCC Earth System Model (CMCC-ESM2). J. Adv. Model. Earth Syst. 2022, 14, e2021MS002814. [Google Scholar] [CrossRef]
- Chollet Ramampiandra, E.; Scheidegger, A.; Wydler, J.; Schuwirth, N. A comparison of machine learning and statistical species distribution models: Quantifying overfitting supports model interpretation. Ecol. Model. 2023, 481, 110353. [Google Scholar] [CrossRef]
- Kuhn, M. Building Predictive Models in R Using the caret Package. J. Stat. Softw. 2008, 28, 1–26. [Google Scholar] [CrossRef]
- Phillips, S.J.; Anderson, R.P.; Schapire, R.E. Maximum entropy modeling of species geographic distributions. Ecol. Model. 2006, 190, 231–259. [Google Scholar] [CrossRef]
- Fielding, A. A review of methods for the assessment of prediction errors in conservation presence/absence models. Environ. Conserv. 1997, 24, 38–49. [Google Scholar] [CrossRef]
- Allouche, O.; Tsoar, A.; Kadmon, R. Assessing the accuracy of species distribution models: Prevalence, kappa and the true skill statistic (TSS). J. Appl. Ecol. 2010, 43, 1223–1232. [Google Scholar] [CrossRef]
- Jiménez-Valverde, A.; Lobo, J.M. Threshold criteria for conversion of probability of species presence to either–or presence–absence. Acta Oecologica 2007, 31, 361–369. [Google Scholar] [CrossRef]
- Xu, Z.L.; Peng, H.H.; Peng, S.Z. The development and evaluation of species distribution models. Acta Ecol. Sin. 2015, 35, 557–567. [Google Scholar] [CrossRef]
- Hijmans, R.J. geosphere: Spherical Trigonometry, R package version 1.5-18; The Comprehensive R Archive Network: Vienna, Austria, 2022. [Google Scholar]
- Hijmans, R.J. raster: Geographic Data Analysis and Modeling, R package version 3.6-20; The Comprehensive R Archive Network: Vienna, Austria, 2023. [Google Scholar]
Disclaimer/Publisher’s Note: The statements, opinions and data contained in all publications are solely those of the individual author(s) and contributor(s) and not of MDPI and/or the editor(s). MDPI and/or the editor(s) disclaim responsibility for any injury to people or property resulting from any ideas, methods, instructions or products referred to in the content. |
© 2025 by the authors. Licensee MDPI, Basel, Switzerland. This article is an open access article distributed under the terms and conditions of the Creative Commons Attribution (CC BY) license (https://creativecommons.org/licenses/by/4.0/).