
Phenological Plant Pattern in the Topographic Complex Karstic Landscape of the Northern Dinaric Alps


Abstract
1. Introduction
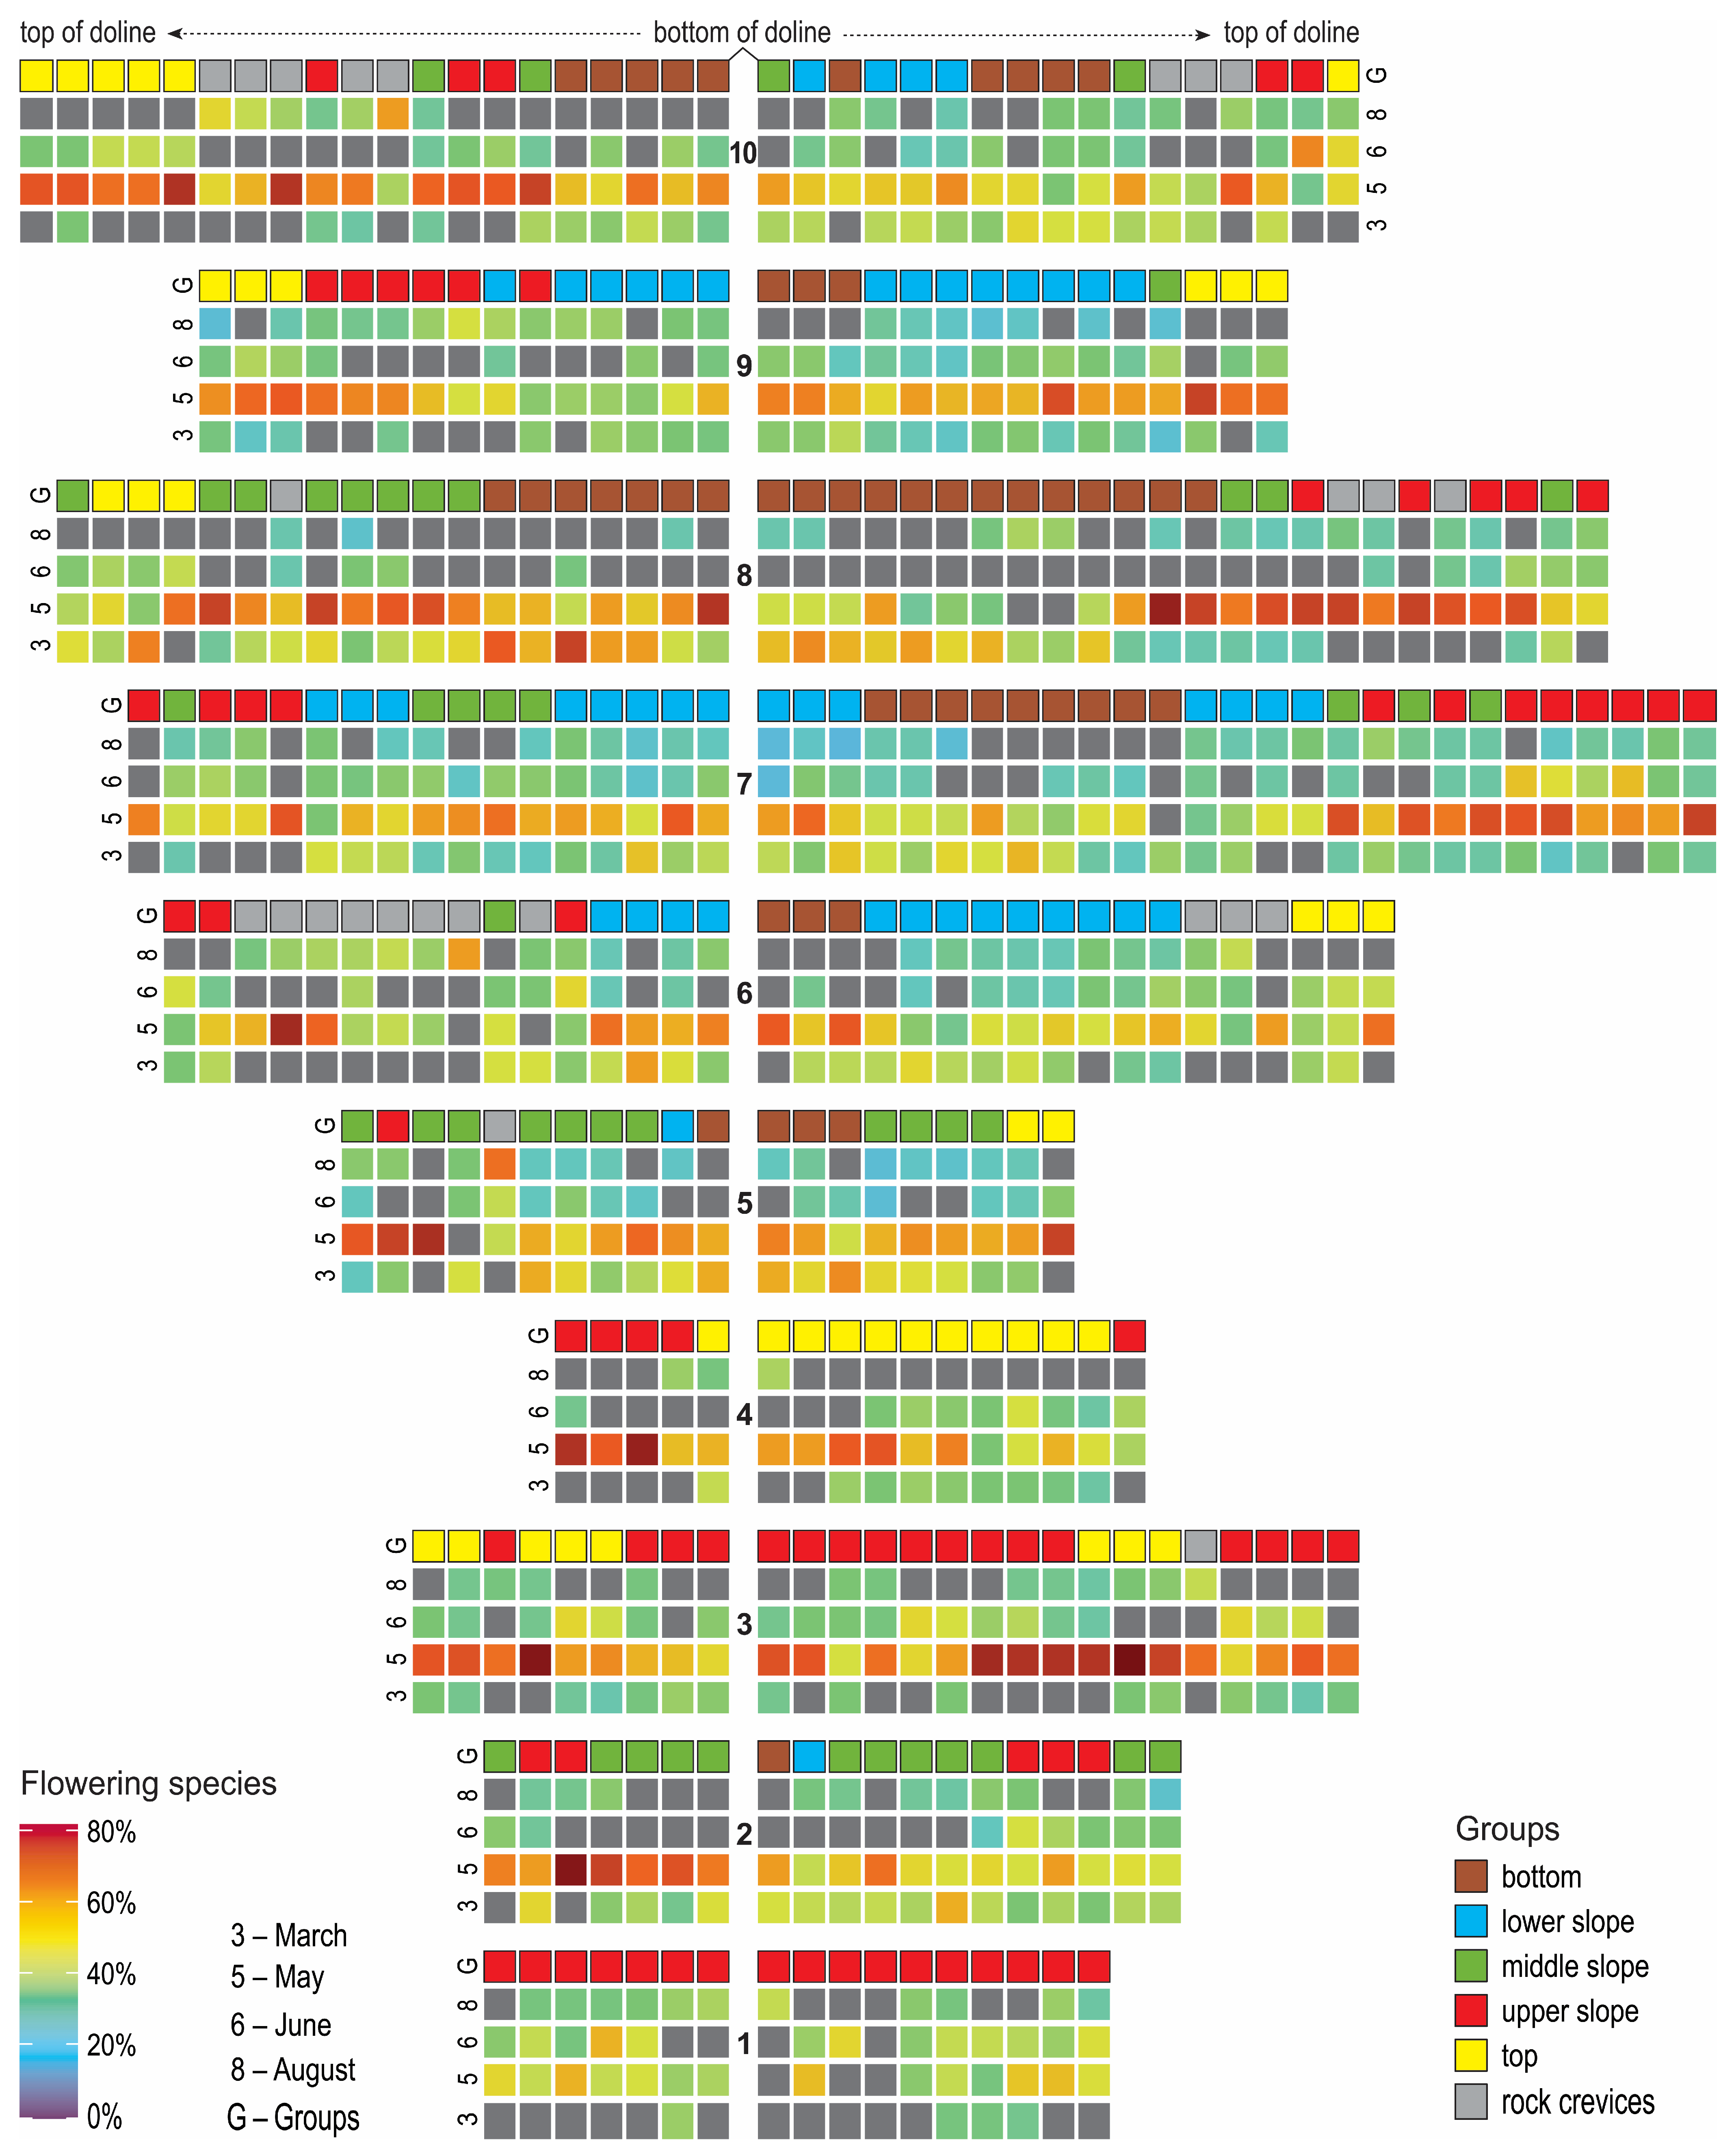
2. Results
2.1. Presentation of Floristic Gradient and Discrete Groups
2.2. Results of Diagnostic Species of Groups Calculations and Assignment of Plots to Communities
2.3. Relation of Time of Flowering Onset to Topographical and Ecological Variables
3. Discussion
3.1. Floristic Gradient and Discrete Groups
3.2. Diagnostic Species of Groups and Assignment to Forest Communities
3.3. Time of Flowering Onset in Relation to Topographical and Ecological Variables
4. Materials and Methods
4.1. Area of Research
4.2. Fieldwork
4.3. Analysis
4.3.1. Method of Analysis of Floristic Gradient and Establishment of Discrete Groups
4.3.2. Calculations of Diagnostic Species of Groups and Assignment of Plots to Communities
4.3.3. Calculation of Time of Flowering Onset and Its Relation to Topographical and Ecological Variables
5. Conclusions
Supplementary Materials
Author Contributions
Funding
Data Availability Statement
Acknowledgments
Conflicts of Interest
Nomenclature
Abbreviations
| DCA | Detrended Correspondence Analysis |
| EIV | Ellenberg indicator values |
| SVF | Sky-view factor |
References
- Hassan, T.; Gulzar, R.; Hamid, M.; Ahmad, R.; Waza, S.A.; Khuroo, A.A. Plant phenology shifts under climate warming: A systematic review of recent scientific literature. Environ. Monit. Assess. 2024, 196, 36. [Google Scholar] [CrossRef]
- Singh, P.; Gargi, B.; Semwal, P.; Verma, S. Global research and research progress on climate change and their impact on plant phenology: 30 years of investigations through bibliometric analysis. Theor. Appl. Climatol. 2024, 155, 4909–4923. [Google Scholar] [CrossRef]
- Puchałka, R.; Klisz, M.; Koniakin, S.; Czortek, P.; Dylewski, Ł.; Paź-Dyderska, S.; Vítková, M.; Sádlo, J.; Rašomavičius, V.; Čarni, A.; et al. Citizen science helps predictions of climate change impact on flowering phenology: A study on Anemone nemorosa. Agric. For. Meteorol. 2022, 325, 109133. [Google Scholar] [CrossRef]
- Jiang, Q.; Yuan, Z.; Yin, J.; Yao, M.; Qin, T.; Lü, X.; Wu, G. Response of vegetation phenology to climate factors in the source region of the Yangtze and Yellow Rivers. J. Plant Ecol. 2024, 17, rtae046. [Google Scholar] [CrossRef]
- Zhang, J.; Chen, S.; Wu, Z.; Fu, Y.H. Review of vegetation phenology trends in China in a changing climate. Prog. Phys. Geogr. Earth Environ. 2022, 46, 829–845. [Google Scholar] [CrossRef]
- Vitasse, Y.; Baumgarten, F.; Zohner, C.M.; Rutishauser, T.; Pietragalla, B.; Gehrig, R.; Dai, J.; Wang, H.; Aono, Y.; Sparks, T.H. The great acceleration of plant phenological shifts. Nat. Clim. Change 2022, 12, 300–302. [Google Scholar] [CrossRef]
- Frei, K.; Vojtkó, A.; Farkas, T.; Erdős, L.; Barta, K.; E-Vojtkó, A.; Tölgyesi, C.; Bátori, Z. Topographic depressions can provide climate and resource microrefugia for biodiversity. iScience 2023, 26, 108202. [Google Scholar] [CrossRef]
- Bátori, Z.; Vojtkó, A.; Maák, I.E.; Lőrinczi, G.; Farkas, T.; Kántor, N.; Tanács, E.; Kiss, P.J.; Juhász, O.; Módra, G.; et al. Karst dolines provide diverse microhabitats for different functional groups in multiple phyla. Sci. Rep. 2019, 9, 7176. [Google Scholar] [CrossRef]
- Knauf, A.E.; Litton, C.M.; Cole, R.J.; Sparks, J.P.; Giardina, C.P.; Gerow, K.G.; Quiñones-Santiago, M. Nutrient-use strategy and not competition determines native and invasive species response to changes in soil nutrient availability. Restor. Ecol. 2021, 29, e13374. [Google Scholar] [CrossRef]
- Puchałka, R.; Paź-Dyderska, S.; Dylewski, Ł.; Czortek, P.; Vítková, M.; Sádlo, J.; Klisz, M.; Koniakin, S.; Čarni, A.; Rašomavičius, V.; et al. Forest herb species with similar European geographic ranges may respond differently to climate change. Sci. Total Environ. 2023, 905, 167303. [Google Scholar] [CrossRef]
- Jakob, A.; Breg Valjavec, M.; Čarni, A. Determination of forest communities on the basis of small plots (microplots) within the geomorphologically diverse landscape of the Kras plateau (Italy, Slovenia). For. Ecosyst. 2025, 12, 100283. [Google Scholar] [CrossRef]
- Frei, K.; E-Vojtkó, A.; Tölgyesi, C.; Vojtkó, A.; Farkas, T.; Erdős, L.; Li, G.; Lőrincz, Á.; Bátori, Z. Topographic complexity drives trait composition as well as functional and phylogenetic diversity of understory plant communities in microrefugia: New insights for conservation. For. Ecosyst. 2025, 12, 100278. [Google Scholar] [CrossRef]
- Trew, B.T.; Maclean, I.M.D. Vulnerability of global biodiversity hotspots to climate change. Glob. Ecol. Biogeogr. 2021, 30, 768–783. [Google Scholar] [CrossRef]
- Hong, P.; Schmid, B.; De Laender, F.; Eisenhauer, N.; Zhang, X.; Chen, H.; Craven, D.; De Boeck, H.J.; Hautier, Y.; Petchey, O.L.; et al. Biodiversity promotes ecosystem functioning despite environmental change. Ecol. Lett. 2022, 25, 555–569. [Google Scholar] [CrossRef] [PubMed]
- Zhuo, Y.; Wang, M.; Koirala, S.; Hughes, A.C.; Xu, W.; Abdulnazar, A.; Rajabi, A.M.; Davletbakov, A.; Haider, J.; Khan, M.Z.; et al. Considering Plant-Ungulate Interaction Contribute to Maximizing Conservation Efficiency under Climate Change. Glob. Ecol. Conserv. 2025, 59, e03536. [Google Scholar] [CrossRef]
- Wakita, K.; Obara, H.; Oyama, N.; Murakami, T. Reassessing the Global Significance of Geological Heritage in the Miné-Akiyoshidai Karst Plateau Aspiring UNESCO Global Geopark. Geosciences 2025, 15, 56. [Google Scholar] [CrossRef]
- Creati, N.; Paganini, P.; Sterzai, P.; Pavan, A. Mapping of karst sinkholes from LIDAR data using machine-learning methods in the Trieste area. J. Spat. Sci. 2025, 1–16. [Google Scholar] [CrossRef]
- Bátori, Z.; Erdős, L.; Gajdács, M.; Barta, K.; Tobak, Z.; Frei, K.; Tölgyesi, C. Managing climate change microrefugia for vascular plants in forested karst landscapes. For. Ecol. Manag. 2021, 496, 119446. [Google Scholar] [CrossRef]
- Pakgohar, N.; Lengyel, A.; Botta-Dukát, Z. Quantitative evaluation of internal cluster validation indices using binary data sets. J. Veg. Sci. 2024, 35, e13310. [Google Scholar] [CrossRef]
- Lengyel, A.; Roberts, D.W.; Botta-Dukát, Z. Comparison of silhouette-based reallocation methods for vegetation classification. J. Veg. Sci. 2021, 32, e12984. [Google Scholar] [CrossRef]
- Čarni, A.; Čonč, Š.; Valjavec, M.B. Landform-vegetation units in karstic depressions (dolines) evaluated by indicator plant species and Ellenberg indicator values. Ecol. Indic. 2022, 135, 108572. [Google Scholar] [CrossRef]
- Tichý, L.; Chytrý, M.; Botta-Dukát, Z. Semi-supervised classification of vegetation: Preserving the good old units and searching for new ones. J. Veg. Sci. 2014, 25, 1504–1512. [Google Scholar] [CrossRef]
- Chytrý, M.; Tichý, L.; Hennekens, S.M.; Knollová, I.; Janssen, J.A.M.; Rodwell, J.S.; Peterka, T.; Marcenò, C.; Landucci, F.; Danihelka, J.; et al. EUNIS habitat classification: Expert system, characteristic species combinations and distribution maps of European habitats. Appl. Veg. Sci. 2020, 23, 648–675. [Google Scholar] [CrossRef]
- Mucina, L.; Bültmann, H.; Dierßen, K.; Theurillat, J.; Raus, T.; Čarni, A.; Šumberová, K.; Willner, W.; Dengler, J.; García, R.G.; et al. Vegetation of Europe: Hierarchical floristic classification system of vascular plant, bryophyte, lichen, and algal communities. Appl. Veg. Sci. 2016, 19, 3–264. [Google Scholar] [CrossRef]
- Bátori, Z.; Vojtkó, A.; Farkas, T.; Szabó, A.; Havadtői, K.; Vojtkó, A.E.; Tölgyesi, C.; Cseh, V.; Erdős, L.; Maák, I.E.; et al. Large- and small-scale environmental factors drive distributions of cool-adapted plants in karstic microrefugia. Ann. Bot. 2017, 119, 301–309. [Google Scholar] [CrossRef] [PubMed]
- Hinze, J.; Albrecht, A.; Michiels, H.-G. Climate-Adapted Potential Vegetation—A European Multiclass Model Estimating the Future Potential of Natural Vegetation. Forests 2023, 14, 239. [Google Scholar] [CrossRef]
- Poldini, L. La Vegetazione del Carso Isontino e Triestino; Edizioni Lint: Trieste, Italy, 1989. [Google Scholar]
- Čarni, A.; Marinček, L.; Seliškar, A.; Zupančič, M. Vegetation Map of Forest Communities of Slovenia in Scale 1:400.000; ZRC Publishing: Ljubljana, Slovenia, 2002; ISBN 961-6358-61-8. [Google Scholar]
- Klotz, S.; Kühn, I.; Durka, W. BIOLFLOR—Eine Datenbank zu Biologisch-Ökologischen Merkmalen der Gefäßpflanzen in Deutschland; Schriftenreihe für Vegetationskunde 38 Bundesamt für Naturschutz (BfN): Bonn, Germany, 2002; ISBN 378433508X. [Google Scholar]
- Kattge, J.; Bönisch, G.; Díaz, S.; Lavorel, S.; Prentice, I.C.; Leadley, P.; Tautenhahn, S.; Werner, G.D.A.; Aakala, T.; Abedi, M.; et al. TRY plant trait database—Enhanced coverage and open access. Glob. Change Biol. 2020, 26, 119–188. [Google Scholar] [CrossRef]
- Martinčič, A. (Ed.) Mala Flora Slovenije, 4th ed.; Tehniška Založba: Ljubljana, Slovenia, 2007. [Google Scholar]
- Lee, Z.; Kim, S.; Choi, S.J.; Joung, E.; Kwon, M.; Park, H.J.; Shim, J.S. Regulation of flowering time by environmental factors in plants. Plants 2023, 12, 3680. [Google Scholar] [CrossRef]
- Stemkovski, M.; Bell, J.R.; Ellwood, E.R.; Inouye, B.D.; Kobori, H.; Lee, S.D.; Lloyd-Evans, T.; Primack, R.B.; Templ, B.; Pearse, W.D. Disorder or a new order: How climate change affects phenological variability. Ecology 2023, 104, e3846. [Google Scholar] [CrossRef]
- Breg Valjavec, M.; Čarni, A.; Žlindra, D.; Zorn, M.; Marinšek, A. Soil organic carbon stock capacity in karst dolines under different land uses. CATENA 2022, 218, 106548. [Google Scholar] [CrossRef]
- Nojarov, P.; Stefanov, P.; Stefanova, D.; Jelev, G. Climate change, anthropogenic pressure, and sustainable development of karst geosystems (a case study of the Brestnitsa karst geosystem in northern Bulgaria). Sustainability 2024, 16, 6657. [Google Scholar] [CrossRef]
- Cubino, J.P.; Biurrun, I.; Bonari, G.; Braslavskaya, T.; Font, X.; Jandt, U.; Jansen, F.; Rašomavičius, V.; Škvorc, Ž.; Willner, W.; et al. The leaf economic and plant size spectra of European forest understory vegetation. Ecography 2021, 44, 1311–1324. [Google Scholar] [CrossRef]
- Košir, P.; Čarni, A.; Di Pietro, R. Classification and phytogeographical differentiation of broad-leaved ravine forests in southeastern Europe. J. Veg. Sci. 2008, 19, 331–342. [Google Scholar] [CrossRef]
- Chapman, L.; Thornes, J.E. Real-Time Sky-View Factor Calculation and Approximation. J. Atmos. Ocean. Technol. 2004, 21, 730–741. [Google Scholar] [CrossRef]
- Stefanovski, S.; Kokalj, Ž.; Stepišnik, U. Sky-view factor enhanced doline delineation: A comparative methodological review based on case studies in Slovenia. Geomorphology 2024, 465, 109389. [Google Scholar] [CrossRef]
- Marcin, M.; Raschmanová, N.; Miklisová, D.; Šupinský, J.; Kaňuk, J.; Kováč, L. Karst landforms as microrefugia for soil Collembola: Open versus forested dolines. Elem. Sci. Anthr. 2024, 12, 00107. [Google Scholar] [CrossRef]
- Jakob, A.; Breg Valjavec, M.; Čarni, A. Turnover of plant species on an ecological gradient in karst dolines is reflected in plant traits: Chorotypes, life forms, plant architecture and strategies. Diversity 2022, 14, 597. [Google Scholar] [CrossRef]
- Marcenò, C.; Gristina, A.S.; Chytrý, M.; Garfi, G.; Ilardi, V.; Jiménez-Alfaro, B.; Paliaga, S.; Pasta, S.; Venanzoni, R.; Guarino, R. Two new grassland associations from the Madonie Mountains (Sicily) disclose critical classification issues in endemic-rich oromediterranean plant communities of the classes Molinio-Arrhenatheretea and Rumici-Astragaletea siculi. Tuexenia 2024, 44, 241–259. [Google Scholar] [CrossRef]
- Lorer, E.; Verheyen, K.; Blondeel, H.; De Pauw, K.; Sanczuk, P.; De Frenne, P.; Landuyt, D. Forest understorey flowering phenology responses to experimental warming and illumination. New Phytol. 2024, 241, 1476–1491. [Google Scholar] [CrossRef]
- Timerman, D.; Barrett, S.C.H. The biomechanics of pollen release: New perspectives on the evolution of wind pollination in angiosperms. Biol. Rev. 2021, 96, 2146–2163. [Google Scholar] [CrossRef]
- Prieto, P.; Penuelas, J.; Ogaya, R.; Estiarte, M. Precipitation-dependent flowering of Globularia alypum and Erica multiflora in Mediterranean shrubland under experimental drought and warming, and its Inter-annual variability. Ann. Bot. 2008, 102, 275–285. [Google Scholar] [CrossRef]
- Bogdanović, S.; Anačkov, G.; Ćato, S.; Borovečki-Voska, L.; Salmeri, C.; Brullo, S. Allium dinaricum (Amaryllidaceae), a new species of A. sect. Codonoprasum from the Balkan Peninsula based on morphology and karyology. Willdenowia 2024, 54, 183–196. [Google Scholar] [CrossRef]
- Surina, B.; Balant, M.; Glasnović, P.; Radosavljević, I.; Fišer, Ž.; Fujs, N.; Castro, S. Population size as a major determinant of mating system and population genetic differentiation in a narrow endemic chasmophyte. BMC Plant Biol. 2023, 23, 383. [Google Scholar] [CrossRef] [PubMed]
- De Frenne, P. Novel light regimes in European forests. Nat. Ecol. Evol. 2023, 8, 196–202. [Google Scholar] [CrossRef] [PubMed]
- Ferreiro-Lera, G.-B.; Penas, Á.; del Río, S. Unveiling deviations from IPCC temperature projections through Bayesian downscaling and assessment of CMIP6 general circulation models in a climate-vulnerable region. Remote Sens. 2024, 16, 1831. [Google Scholar] [CrossRef]
- Lorente, C.; Corell, D.; Estrela, M.J.; Miró, J.J.; Orgambides-García, D. Evolution of bioclimatic belts in Spain and the Balearic islands (1953–2022). Climate 2024, 12, 215. [Google Scholar] [CrossRef]
- Keppel, G.; Stralberg, D.; Morelli, T.L.; Bátori, Z. Managing climate-change refugia to prevent extinctions. Trends Ecol. Evol. 2024, 39, 800–808. [Google Scholar] [CrossRef]
- Rudolf, A.; Vreš, B.; Dakskobler, I. Sites of rare form of auricula (Primula auricula var. tolminensis nom. prov.) in the southern Julian Alps. Folia Biol. Geol. 2019, 59, 75–91. [Google Scholar] [CrossRef]
- Mihevc, A.; Prelovšek, M.; Zupan Hajna, N. Introduction to the Dinaric Karst. J. Chem. Inf. Model. 2010, 53, 71. [Google Scholar]
- Čarni, A. Overview of Forest Communities in Slovenia; Založba Univerze v Mariboru: Maribor, Slovenia, 2019. [Google Scholar] [CrossRef]
- Vrščaj, B.; Repe, B.; Simončič, P. The Soils of Slovenia; Springer: Dordrecht, The Netherlands, 2017. [Google Scholar]
- Cervellini, M.; Zannini, P.; Di Musciano, M.; Fattorini, S.; Jiménez-Alfaro, B.; Rocchini, D.; Field, R.; Vetaas, O.R.; Irl, S.D.; Beierkuhnlein, C.; et al. A grid-based map for the biogeographical regions of Europe. Biodivers. Data J. 2020, 8, e53720. [Google Scholar] [CrossRef]
- Ford, D.C.; Williams, P. Karst Hydrogeology and Geomorphology; John Wiley & Sons: Chichester, UK, 2007. [Google Scholar] [CrossRef]
- Cernatič-Gregorič, A.; Zega, M. The impact of human activities on dolines (sinkholes)—Typical geomorphologic features on Karst (Slovenia) and possibilities of their preservation. Geogr. Panon. 2010, 14, 109–117. [Google Scholar] [CrossRef]
- Kranjc, A. Classification of Closed Depressions in Carbonate Karst. Treatise Geomorphol. 2013, 6, 104–114. [Google Scholar] [CrossRef]
- Aguilon, D.J.; Vojtkó, A.; Tölgyesi, C.; Erdős, L.; Kiss, P.J.; Lőrinczi, G.; Juhász, O.; Frei, K.; Bátori, Z. Karst environments and disturbance: Evaluation of the effects of human activity on grassland and forest naturalness in dolines. Biologia 2020, 75, 1529–1535. [Google Scholar] [CrossRef]
- Kiss, P.J.; Tölgyesi, C.; Bóni, I.; Erdős, L.; Vojtkó, A.; Maák, I.E.; Bátori, Z. The effects on intensive logging on the capacity of karst dolines to provide potential microrefugia for cool-adapted plants. Acta Geogr. Slov. 2020, 60, 37–48. [Google Scholar] [CrossRef]
- Braun-Blanquet, J. Pflanzensoziologie, Grundzüge der Vegetationskunde; Springer: Wien, Austria, 1964; ISBN 3709181119. [Google Scholar] [CrossRef]
- Čonč, Š.; Oliveira, T.; Belotti, E.; Bufka, L.; Černe, R.; Heurich, M.; Valjavec, M.B.; Krofel, M. Revealing functional responses in habitat selection of rocky features and rugged terrain by Eurasian lynx (Lynx lynx) using LiDAR data. Landsc. Ecol. 2024, 39, 121. [Google Scholar] [CrossRef]
- Oksanen, J.; Simpson, G.; Blanchet, F.; Kindt, R.; Legendre, P.; Michin, P.; O’Hara, R.B.; Solymos, P.; Stevens, H.M.H.; Szöcs, E.; et al. Vegan: Community Ecology Package, R Package version 2.6-4. Available online: https://github.com/vegandevs/vegan (accessed on 15 December 2024).
- Maechler, M.; Rousseeuw, P.; Hubert, M.; Hornik, K. cluster: Cluster Analysis Basics and Extensions. R Package Version 2.1.4. 2023. Available online: https://CRAN.R-project.org/package=cluster (accessed on 15 December 2024).
- R Core Team. R: A Language and Environment for Statistical Computing. R Foundation for Statistical Computing, version 3.6.1. Available online: https://www.R-project.org. (accessed on 15 November 2024).
- Tichý, L. JUICE, software for vegetation classification. J. Veg. Sci. 2002, 13, 451–453. [Google Scholar] [CrossRef]
- Environmental Systems Research Institute. ArcInfo (Version 10.8) [Computer Software]. 2024. Available online: https://www.esri.com (accessed on 2 November 2024).
- Wickham, H. Ggplot2: Elegant Graphics for Data Analysis; Springer: New York, NY, USA, 2016. [Google Scholar]
- Tichý, L.; Axmanová, I.; Dengler, J.; Guarino, R.; Jansen, F.; Midolo, G.; Nobis, M.P.; Van Meerbeek, K.; Aćić, S.; Attorre, F.; et al. Ellenberg-type indicator values for European vascular plant species. J. Veg. Sci. 2023, 34, e13168. [Google Scholar] [CrossRef]
- Tölgyesi, C.; Bátori, Z.; Erdos, L. Using statistical tests on relative ecological indicator values to compare vegetation units—Different approaches and weighting methods. Ecol. Indic. 2014, 36, 441–446. [Google Scholar] [CrossRef]
- Pignatti, S.; Menegoni, P.; Pietrosanti, S. Valori di bioindicazione delle piante vascolari. Valori di indicatione secondo Ellenberg per la piante delle flora d’Italia. Braun-Blanquetia 2005, 39, 3–97. [Google Scholar]
- Chytrý, M.; Tichý, L.; Holt, J.; Botta-Dukát, Z. Determination of diagnostic species with statistical fidelity measures. J. Veg. Sci. 2002, 13, 79–90. [Google Scholar] [CrossRef]
- Tichý, L.; Chytrý, M. Statistical determination of diagnostic species for site groups of unequal size. J. Veg. Sci. 2006, 17, 809–818. [Google Scholar] [CrossRef]
- Hill, M.O.; Gauch, H.G. Detrended correspondence analysis: An improved ordination technique. Vegetatio 1980, 42, 47–58. [Google Scholar] [CrossRef]
- Zelený, D. Which results of the standard test for community-weighted mean approach are too optimistic? J. Veg. Sci. 2018, 29, 953–966. [Google Scholar] [CrossRef]
- Zelený, D.; Schaffers, A.P. Too good to be true: Pitfalls of using mean Ellenberg indicator values in vegetation analyses. J. Veg. Sci. 2012, 23, 419–431. [Google Scholar] [CrossRef]
- ter Braak, C.J.F.; Šmilauer, P. CANOCO Reference Manual and User’s Guide: Software for Ordination (Version 5.0); Microcomputer Power: Ithaca, NY, USA, 2012. [Google Scholar]
- Guralnick, R.; Crimmins, T.; Grady, E.; Campbell, L. Phenological response to climatic change depends on spring warming velocity. Commun. Earth Environ. 2024, 5, 634. [Google Scholar] [CrossRef]
- Šilc, U.; Čarni, A. Conspectus of vegetation syntaxa in Slovenia. Hacquetia 2012, 11, 113–164. [Google Scholar] [CrossRef]


| DCA1 | r | p.par. | p.perm. | p.modif. | DCA2 | r | p.par. | p.perm. | p.modif. |
|---|---|---|---|---|---|---|---|---|---|
| Depth of plots | −0.997 | *** | Depth of plots | 0.318 | *** | ||||
| SVF | 0.447 | *** | SVF | −0.408 | *** | ||||
| Bare rock | −0.025 | *** | Bare rock | 0.659 | *** | ||||
| Moisture | −0.765 | *** | ** | ** | Moisture | 0.208 | *** | ** | - |
| Nutrients | −0.829 | *** | ** | ** | Nutrients | 0.182 | ** | ** | - |
| Light | 0.85 | *** | ** | ** | Light | −0.331 | *** | ** | - |
| Temperature | 0.507 | *** | ** | - | Temperature | −0.393 | *** | ** | * |
| Reaction | 0.109 | - | - | - | Reaction | 0.268 | *** | ** | - |
| Month | PTV | p Value | F Stat. |
|---|---|---|---|
| March | 2.7 | 0.001 | 8 |
| June | 2.3 | 0.001 | 6.6 |
| May | 1.5 | 0.001 | 4.4 |
| August | 1.4 | 0.001 | 4 |
| July | 1.3 | 0.001 | 3.9 |
| April | 1.2 | 0.001 | 3.4 |
| Group No. | 1 | 2 | 3 | 4 | 5 | 6 | ||||||
|---|---|---|---|---|---|---|---|---|---|---|---|---|
| Number of plots | 50 | 48 | 48 | 76 | 39 | 25 | ||||||
| Asarum europaeum | 44 | 35.3 | 19 | 4 | 21 | 6.6 | 1 | --- | . | --- | 8 | --- |
| Galanthus nivalis | 28 | 33.8 | 2 | --- | 12 | 7.9 | . | --- | . | --- | 4 | --- |
| Quercus petraea | 44 | 31.1 | 33 | 18.6 | 19 | 1.4 | 7 | --- | 3 | --- | . | --- |
| Campanula trachelium | 34 | 27.1 | 23 | 12.5 | 21 | 9.8 | 3 | --- | . | --- | . | --- |
| Anemone nemorosa | 18 | 26.3 | 12 | 15.1 | . | --- | . | --- | . | --- | . | --- |
| Corylus avellana | 24 | 26.1 | 6 | --- | 6 | --- | . | --- | . | --- | 12 | 6.4 |
| Veratrum nigrum | 8 | 26 | . | --- | . | --- | . | --- | . | --- | . | --- |
| Serratula tinctoria | 12 | 22.8 | 4 | 2.7 | . | --- | 3 | --- | . | --- | . | --- |
| Tilia cordata | 36 | 15.1 | 71 | 52.8 | 10 | --- | 3 | --- | . | --- | 12 | --- |
| Symphytum tuberosum | 34 | 9.7 | 62 | 39.3 | 35 | 11.2 | 9 | --- | 3 | --- | 4 | --- |
| Fragaria moschata | . | --- | 12 | 32.6 | . | --- | . | --- | . | --- | . | --- |
| Primula vulgaris | 12 | 9.1 | 25 | 32.1 | 4 | --- | . | --- | . | --- | . | --- |
| Polygonatum multiflorum | 4 | --- | 17 | 27.7 | 2 | --- | . | --- | 3 | --- | . | --- |
| Salvia glutinosa | 12 | 7.5 | 23 | 26 | 10 | 4.8 | . | --- | . | --- | . | --- |
| Mercurialis perennis | 26 | 4.9 | 44 | 24.2 | 40 | 19.7 | 9 | --- | 3 | --- | 8 | --- |
| Melica nutans | 2 | --- | 17 | 22.6 | 4 | --- | 7 | 2.5 | 3 | --- | . | --- |
| Carex digitata | 42 | 19.6 | 44 | 21.4 | 21 | --- | 16 | --- | 10 | --- | 8 | --- |
| Acer monspessulanum | 4 | --- | . | --- | 69 | 46.6 | 21 | --- | 23 | --- | 28 | 4 |
| Melittis melissophyllum | 18 | --- | 17 | --- | 81 | 44.9 | 37 | 2.9 | 26 | --- | 24 | --- |
| Acer campestre | 38 | 4.1 | 48 | 13.5 | 69 | 33.2 | 22 | --- | 13 | --- | 12 | --- |
| Aristolochia lutea | 2 | --- | . | --- | 12 | 29.4 | . | --- | . | --- | . | --- |
| Euonymus europaeus | 4 | --- | 15 | 4.6 | 31 | 28.1 | 8 | --- | 10 | --- | . | --- |
| Paeonia officinalis | 18 | --- | 21 | --- | 42 | 23.4 | 16 | --- | 23 | 2.8 | 4 | --- |
| Vincetoxicum hirundinaria | . | --- | 15 | --- | 29 | 3.4 | 67 | 42.2 | 36 | 10.3 | 8 | --- |
| Lathyrus sylvestris | . | --- | . | --- | . | --- | 7 | 23.5 | . | --- | . | --- |
| Genista tinctoria | . | --- | . | --- | . | --- | 7 | 23.5 | . | --- | . | --- |
| Ostrya carpinifolia | . | --- | 6 | --- | 4 | --- | 22 | 20 | 15 | 9.2 | 8 | --- |
| Lathyrus niger | . | --- | . | --- | . | --- | 5 | 21 | . | --- | . | --- |
| Dactylorhiza maculata agg. | . | --- | . | --- | . | --- | 5 | 21 | . | --- | . | --- |
| Campanula persicifolia | . | --- | . | --- | . | --- | 5 | 21 | . | --- | . | --- |
| Festuca heterophylla | . | --- | . | --- | . | --- | 5 | 21 | . | --- | . | --- |
| Cotinus coggygria | . | --- | . | --- | 6 | --- | 7 | --- | 79 | 75.2 | 8 | --- |
| Brachypodium rupestre | . | --- | 4 | --- | 46 | 15.3 | 43 | 12.9 | 79 | 48.1 | 8 | --- |
| Carex humilis | . | --- | . | --- | 2 | --- | 7 | 1.7 | 26 | 38.4 | . | --- |
| Prunus spinosa | . | --- | 4 | --- | 8 | 2.7 | 3 | --- | 26 | 33.5 | . | --- |
| Dictamnus albus | . | --- | 4 | --- | 8 | --- | 14 | 3.7 | 36 | 33.4 | 8 | --- |
| Teucrium chamaedrys | . | --- | . | --- | 4 | --- | 4 | --- | 18 | 26.5 | 4 | --- |
| Asparagus tenuifolius | 2 | --- | 6 | --- | 12 | 5 | 9 | --- | 26 | 25.3 | . | --- |
| Silene nutans | . | --- | . | --- | . | --- | 3 | 1.5 | 10 | 25 | . | --- |
| Galium lucidum | . | --- | . | --- | . | --- | 1 | --- | 8 | 22.8 | . | --- |
| Allium sphaerocephalon | . | --- | . | --- | . | --- | . | --- | 5 | 20.8 | . | --- |
| Melica uniflora | . | --- | . | --- | . | --- | . | --- | 5 | 20.8 | . | --- |
| Polygonatum odoratum | . | --- | 2 | --- | 6 | --- | 17 | 5.5 | 28 | 20.3 | 24 | 14.7 |
| Moehringia muscosa | 12 | --- | 2 | --- | 17 | --- | . | --- | 5 | --- | 76 | 65.9 |
| Asplenium trichomanes | 4 | --- | 4 | --- | 6 | --- | 3 | --- | . | --- | 56 | 59.9 |
| Campanula pyramidalis | . | --- | . | --- | . | --- | . | --- | . | --- | 40 | 59.8 |
| Geranium robertianum | . | --- | . | --- | . | --- | . | --- | . | --- | 8 | 26 |
| Prunus mahaleb | . | --- | . | --- | 2 | --- | 8 | 3 | 8 | 2.6 | 20 | 25.3 |
| Asplenium ruta-muraria | . | --- | . | --- | 2 | --- | 3 | --- | . | --- | 12 | 25 |
| Ajuga reptans | 8 | 6 | 2 | --- | 4 | --- | . | --- | . | --- | 16 | 22.4 |
| Frangula rupestris | . | --- | 2 | --- | 10 | --- | 16 | 5.3 | 15 | 4.7 | 28 | 22.1 |
| Dentaria enneaphyllos | 98 | 61.5 | 77 | 41.6 | 23 | --- | 1 | --- | . | --- | . | --- |
| Lathyrus vernus | 48 | 39.8 | 33 | 21.8 | 12 | --- | . | --- | . | --- | . | --- |
| Convallaria majalis | 42 | 22.8 | 56 | 38.4 | 10 | --- | 11 | --- | . | --- | 8 | --- |
| Hepatica nobilis | 54 | 31.9 | 8 | --- | 62 | 40.8 | 5 | --- | . | --- | 12 | --- |
| Galeobdolon montanum | 46 | 26.5 | 10 | --- | 52 | 33.1 | 5 | --- | . | --- | 16 | --- |
| Helleborus multifidus ssp. istriacus | 54 | 2.5 | 88 | 32.5 | 75 | 21.3 | 32 | --- | 59 | 7 | . | --- |
| Hedera helix | 30 | --- | 83 | 25.6 | 56 | 1.2 | 53 | --- | 23 | --- | 84 | 26.2 |
| Sesleria autumnalis | 76 | --- | 75 | --- | 96 | 11 | 100 | 16.7 | 100 | 16.7 | 80 | --- |
| Fraxinus ornus | 70 | --- | 88 | 13.9 | 69 | --- | 83 | 9.2 | 46 | --- | 88 | 24.4 |
| Quercus cerris | 54 | --- | 75 | 12.4 | 60 | --- | 78 | 14.8 | 46 | --- | 56 | --- |
| Mercurialis ovata | 18 | --- | 25 | 8.5 | 27 | 10.9 | 13 | --- | 15 | --- | 8 | --- |
| Quercus pubescens | . | --- | 2 | --- | 6 | --- | 13 | 8.7 | 18 | 16.6 | 8 | --- |
| March | r | p.par. | p.perm. | p.modif. | June | r | p.par. | p.perm. | p.modif. |
|---|---|---|---|---|---|---|---|---|---|
| Depth | 0.434 | *** | Depth | −0.361 | *** | ||||
| SVF | −0.107 | - | SVF | 0.314 | *** | ||||
| Bare rock | −0.046 | - | Bare rock | −0.240 | *** | ||||
| Moisture | 0.493 | *** | ** | * | Moisture | −0.283 | *** | ** | - |
| Nutrients | 0.636 | *** | ** | ** | Nutrients | −0.303 | *** | ** | - |
| Light | −0.427 | *** | ** | - | Light | 0.444 | *** | ** | * |
| Temperature | −0.214 | *** | ** | - | Temperature | 0.298 | *** | ** | - |
| Reaction | 0.099 | - | - | - | Reaction | −0.007 | - | - | - |
| April | r | p.par. | p.perm. | p.modif. | July | r | p.par. | p.perm. | p.modif. |
| Depth | 0.132 | * | Depth | −0.033 | - | ||||
| SVF | −0.156 | ** | SVF | 0.041 | - | ||||
| Bare rock | 0.059 | - | Bare rock | 0.001 | - | ||||
| Moisture | 0.060 | - | - | - | Moisture | −0.123 | * | * | - |
| Nutrients | 0.210 | *** | ** | - | Nutrients | −0.179 | ** | ** | - |
| Light | −0.229 | *** | ** | - | Light | 0.257 | *** | ** | - |
| Temperature | 0.151 | * | * | - | Temperature | 0.050 | - | - | - |
| Reaction | −0.185 | ** | ** | - | Reaction | 0.124 | * | * | - |
| May | r | p.par. | p.perm. | p.modif. | August | r | p.par. | p.perm. | p.modif. |
| Depth | −0.192 | * | Depth | −0.025 | - | ||||
| SVF | 0.118 | ** | SVF | −0.198 | *** | ||||
| Bare rock | −0.018 | - | Bare rock | 0.237 | *** | ||||
| Moisture | −0.307 | *** | - | - | Moisture | 0.016 | - | - | - |
| Nutrients | −0.331 | *** | - | - | Nutrients | 0.150 | * | ** | - |
| Light | 0.209 | *** | - | - | Light | 0.007 | - | - | - |
| Temperature | −0.040 | - | - | - | Temperature | −0.064 | - | - | - |
| Reaction | 0.126 | * | * | - | Reaction | −0.052 | - | - | - |
| Nr. | Depth (m) | N (North) | S (South) | Nr. | Depth (m) | N (North) | S (South) |
|---|---|---|---|---|---|---|---|
| 1 | 5.98 | 14 | 20 | 6 | 13.28 | 32 | 36 |
| 2 | 7.51 | 14 | 24 | 7 | 18.84 | 34 | 54 |
| 3 | 8.17 | 18 | 34 | 8 | 21.74 | 38 | 46 |
| 4 | 2.45 | 10 | 22 | 9 | 13.65 | 30 | 30 |
| 5 | 8.71 | 22 | 18 | 10 | 15.4 | 40 | 34 |
Disclaimer/Publisher’s Note: The statements, opinions and data contained in all publications are solely those of the individual author(s) and contributor(s) and not of MDPI and/or the editor(s). MDPI and/or the editor(s) disclaim responsibility for any injury to people or property resulting from any ideas, methods, instructions or products referred to in the content. |
© 2025 by the authors. Licensee MDPI, Basel, Switzerland. This article is an open access article distributed under the terms and conditions of the Creative Commons Attribution (CC BY) license (https://creativecommons.org/licenses/by/4.0/).
Share and Cite
Jakob, A.; Breg Valjavec, M.; Čarni, A. Phenological Plant Pattern in the Topographic Complex Karstic Landscape of the Northern Dinaric Alps. Plants 2025, 14, 1093. https://doi.org/10.3390/plants14071093
Jakob A, Breg Valjavec M, Čarni A. Phenological Plant Pattern in the Topographic Complex Karstic Landscape of the Northern Dinaric Alps. Plants. 2025; 14(7):1093. https://doi.org/10.3390/plants14071093
Chicago/Turabian StyleJakob, Aljaž, Mateja Breg Valjavec, and Andraž Čarni. 2025. "Phenological Plant Pattern in the Topographic Complex Karstic Landscape of the Northern Dinaric Alps" Plants 14, no. 7: 1093. https://doi.org/10.3390/plants14071093
APA StyleJakob, A., Breg Valjavec, M., & Čarni, A. (2025). Phenological Plant Pattern in the Topographic Complex Karstic Landscape of the Northern Dinaric Alps. Plants, 14(7), 1093. https://doi.org/10.3390/plants14071093