
Effect of LED Irradiation with Different Red-to-Blue Light Ratios on Growth and Functional Compound Accumulations in Spinach (Spinacia oleracea L.) Accessions and Wild Relatives
 , and
, and 
Abstract

1. Introduction
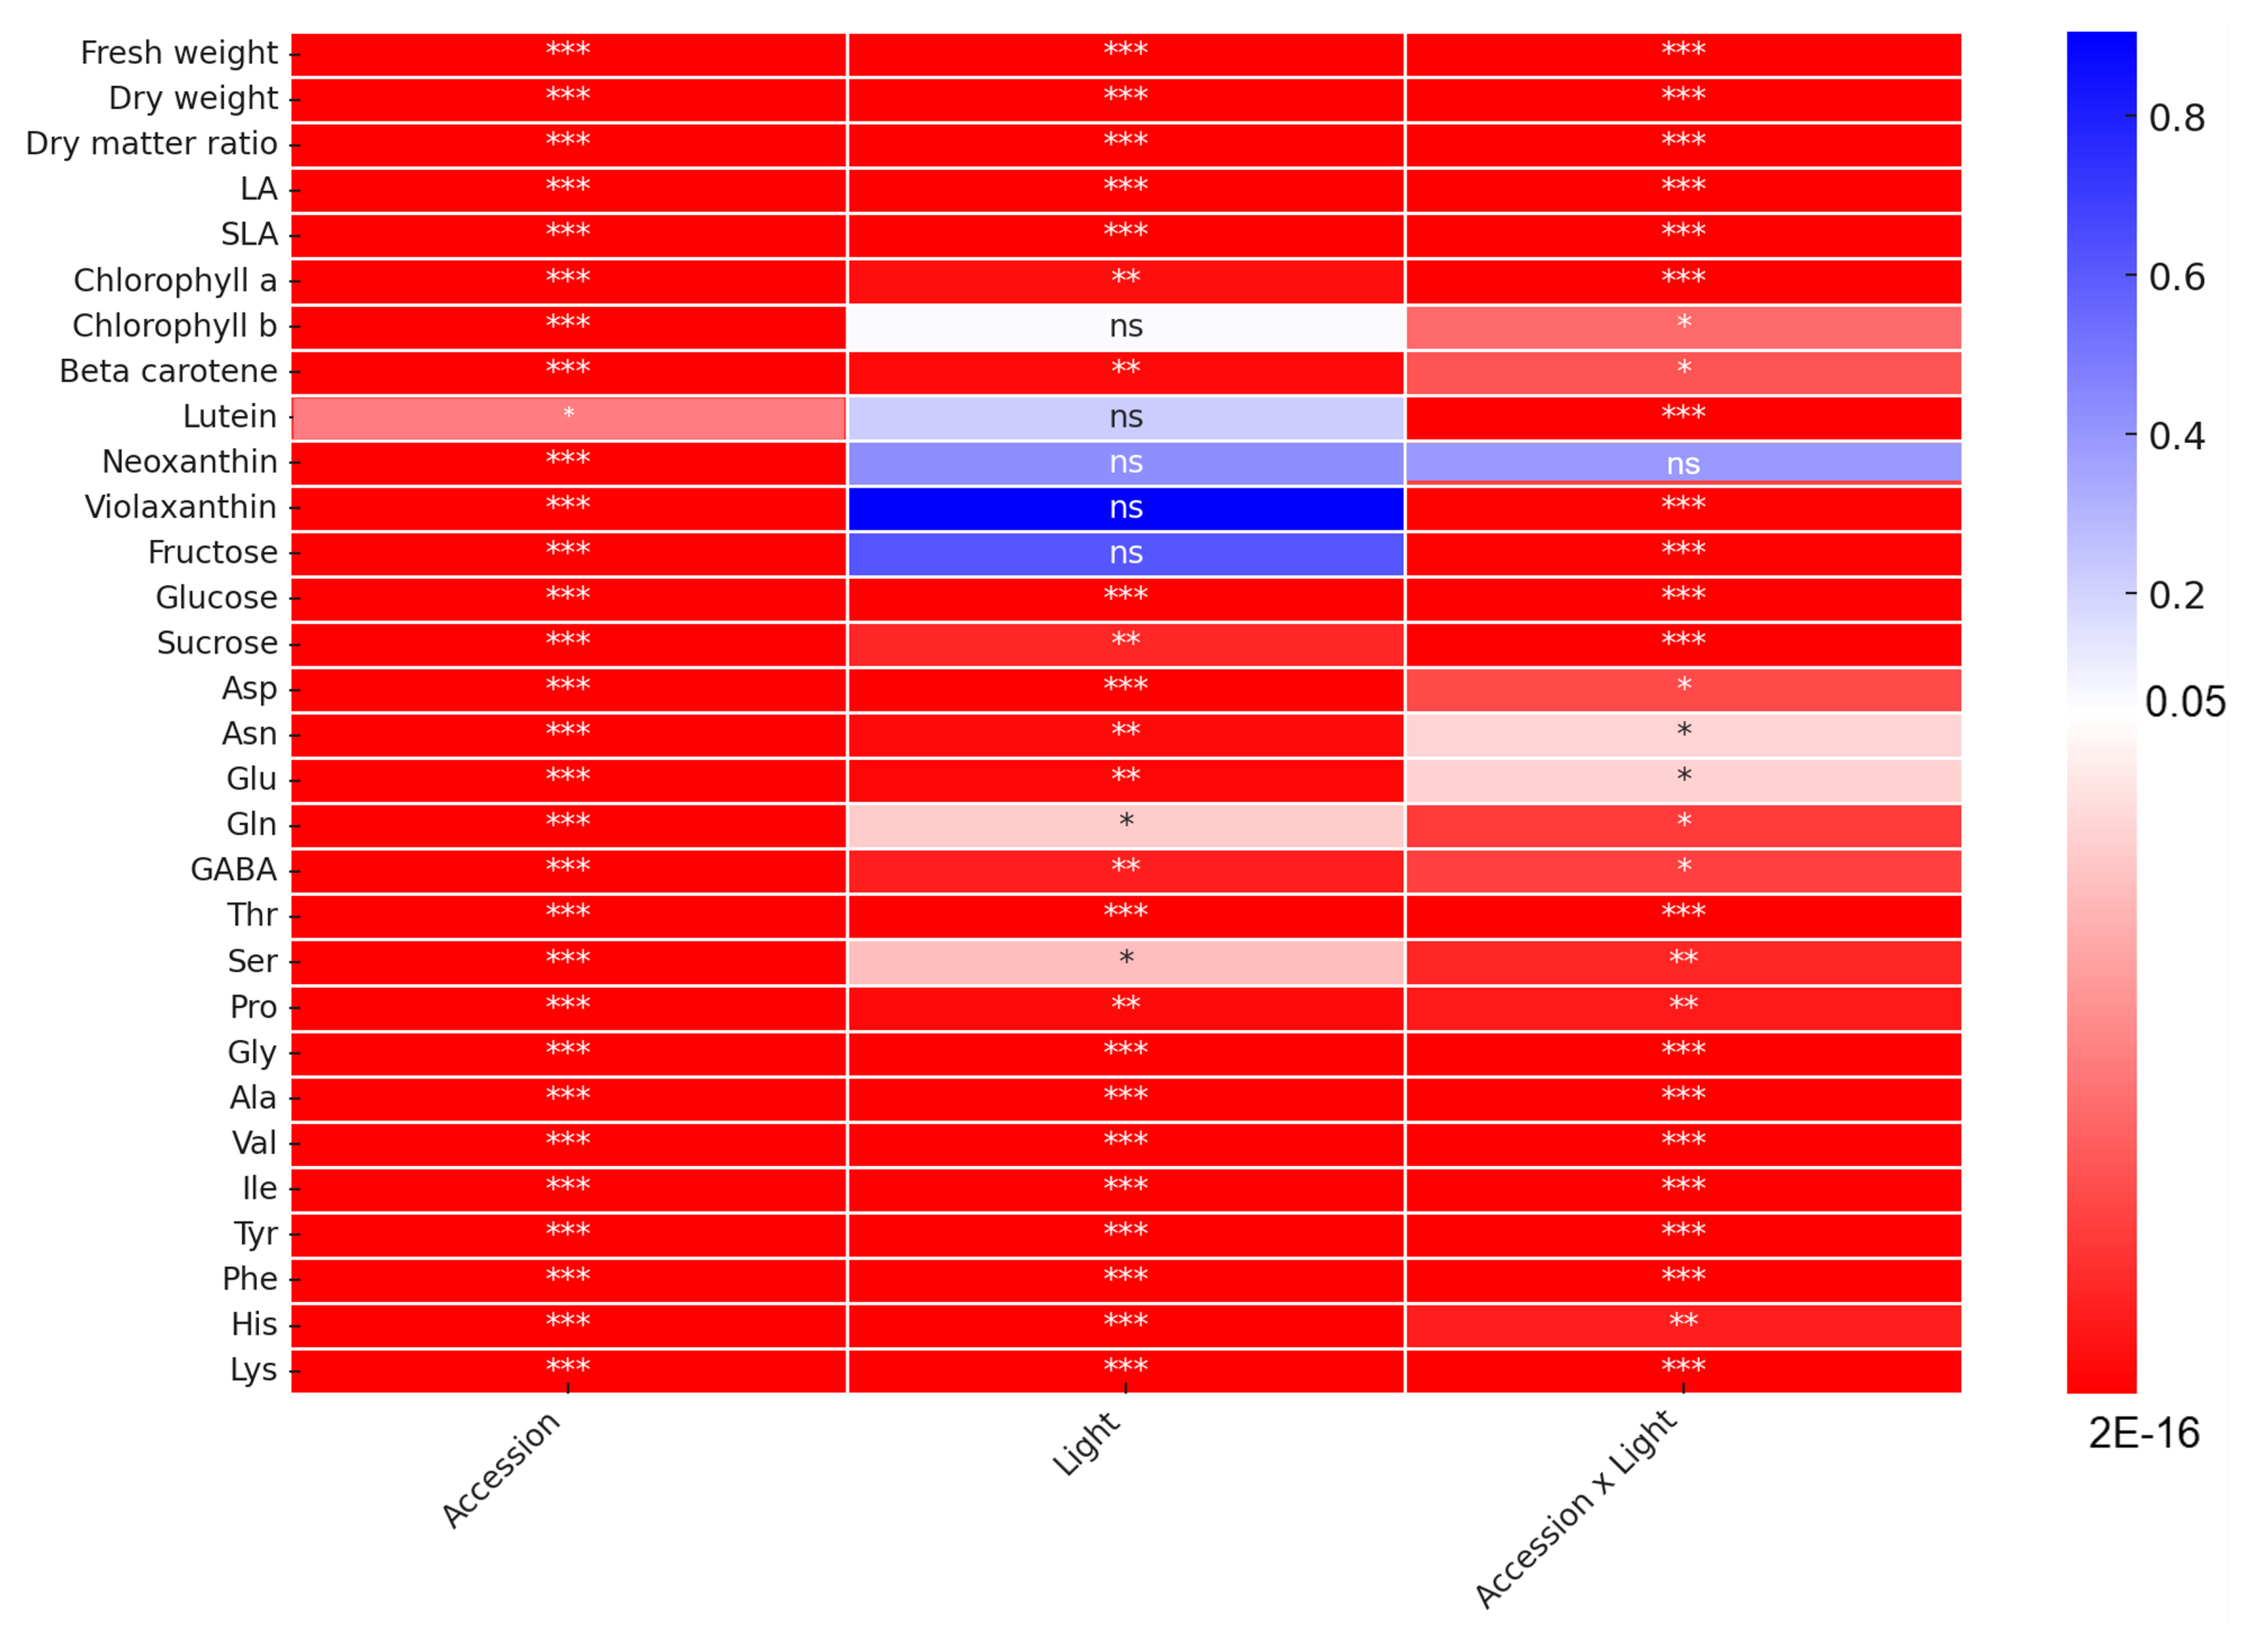
2. Results
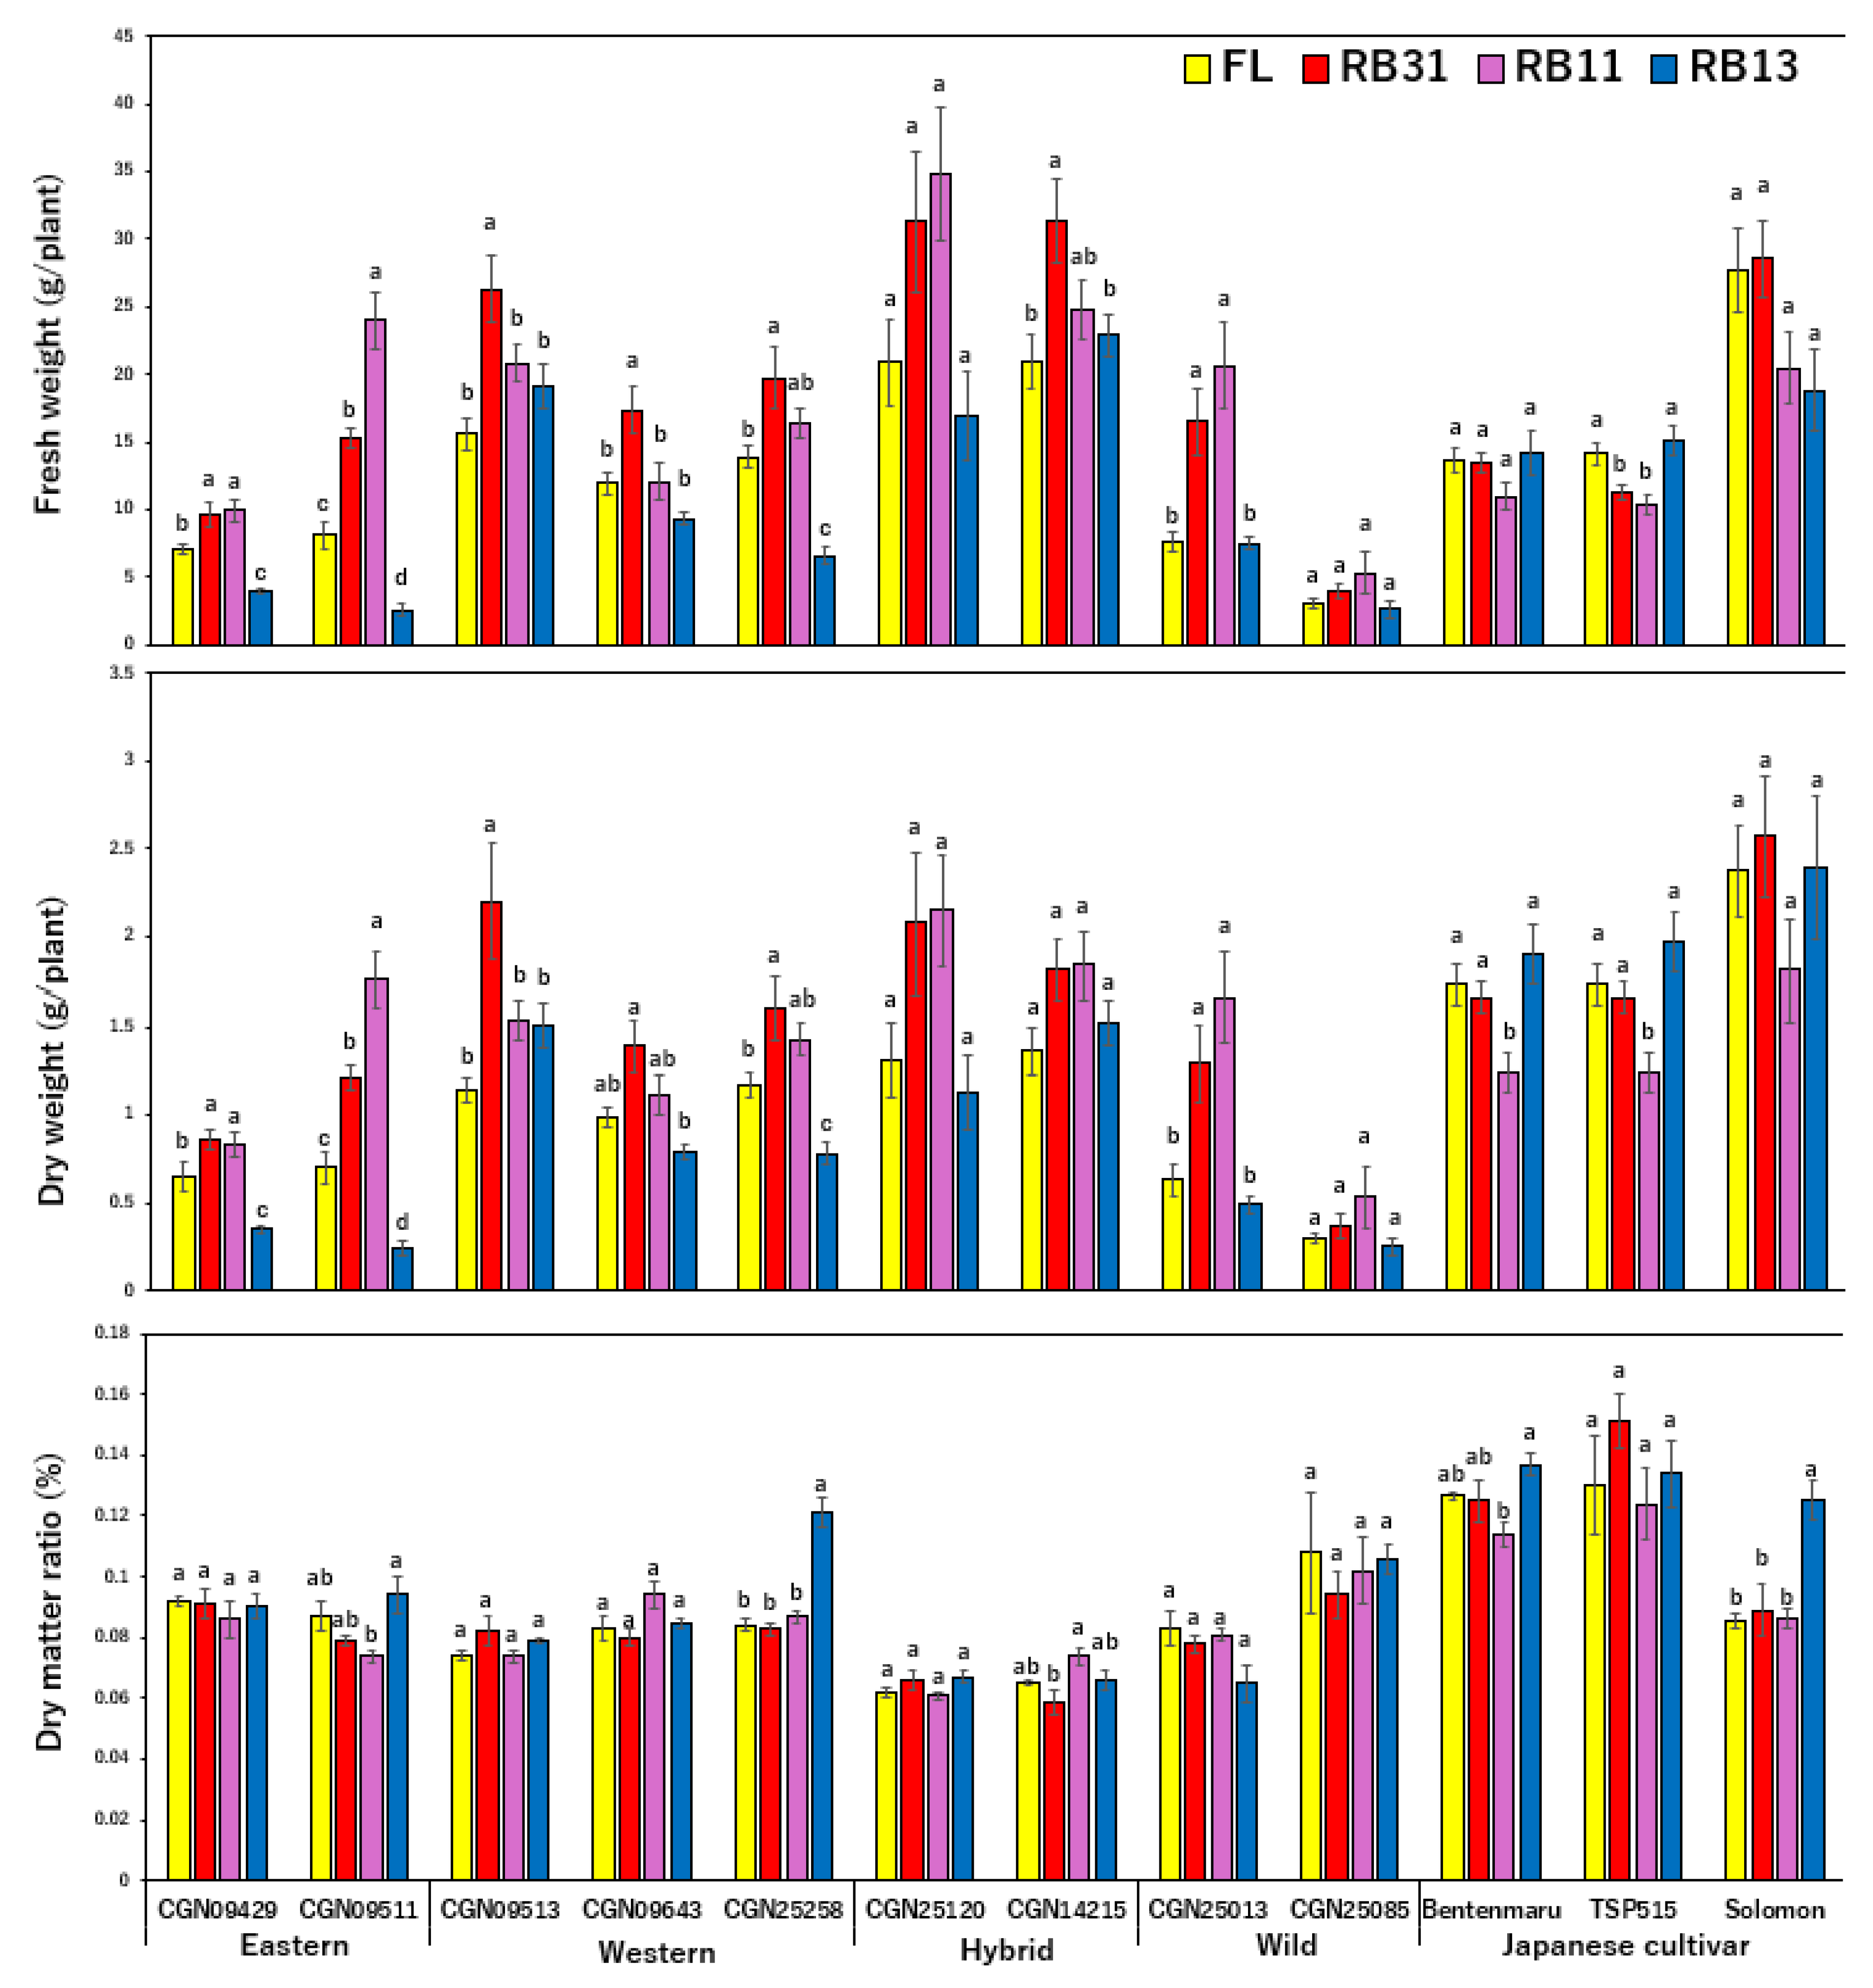
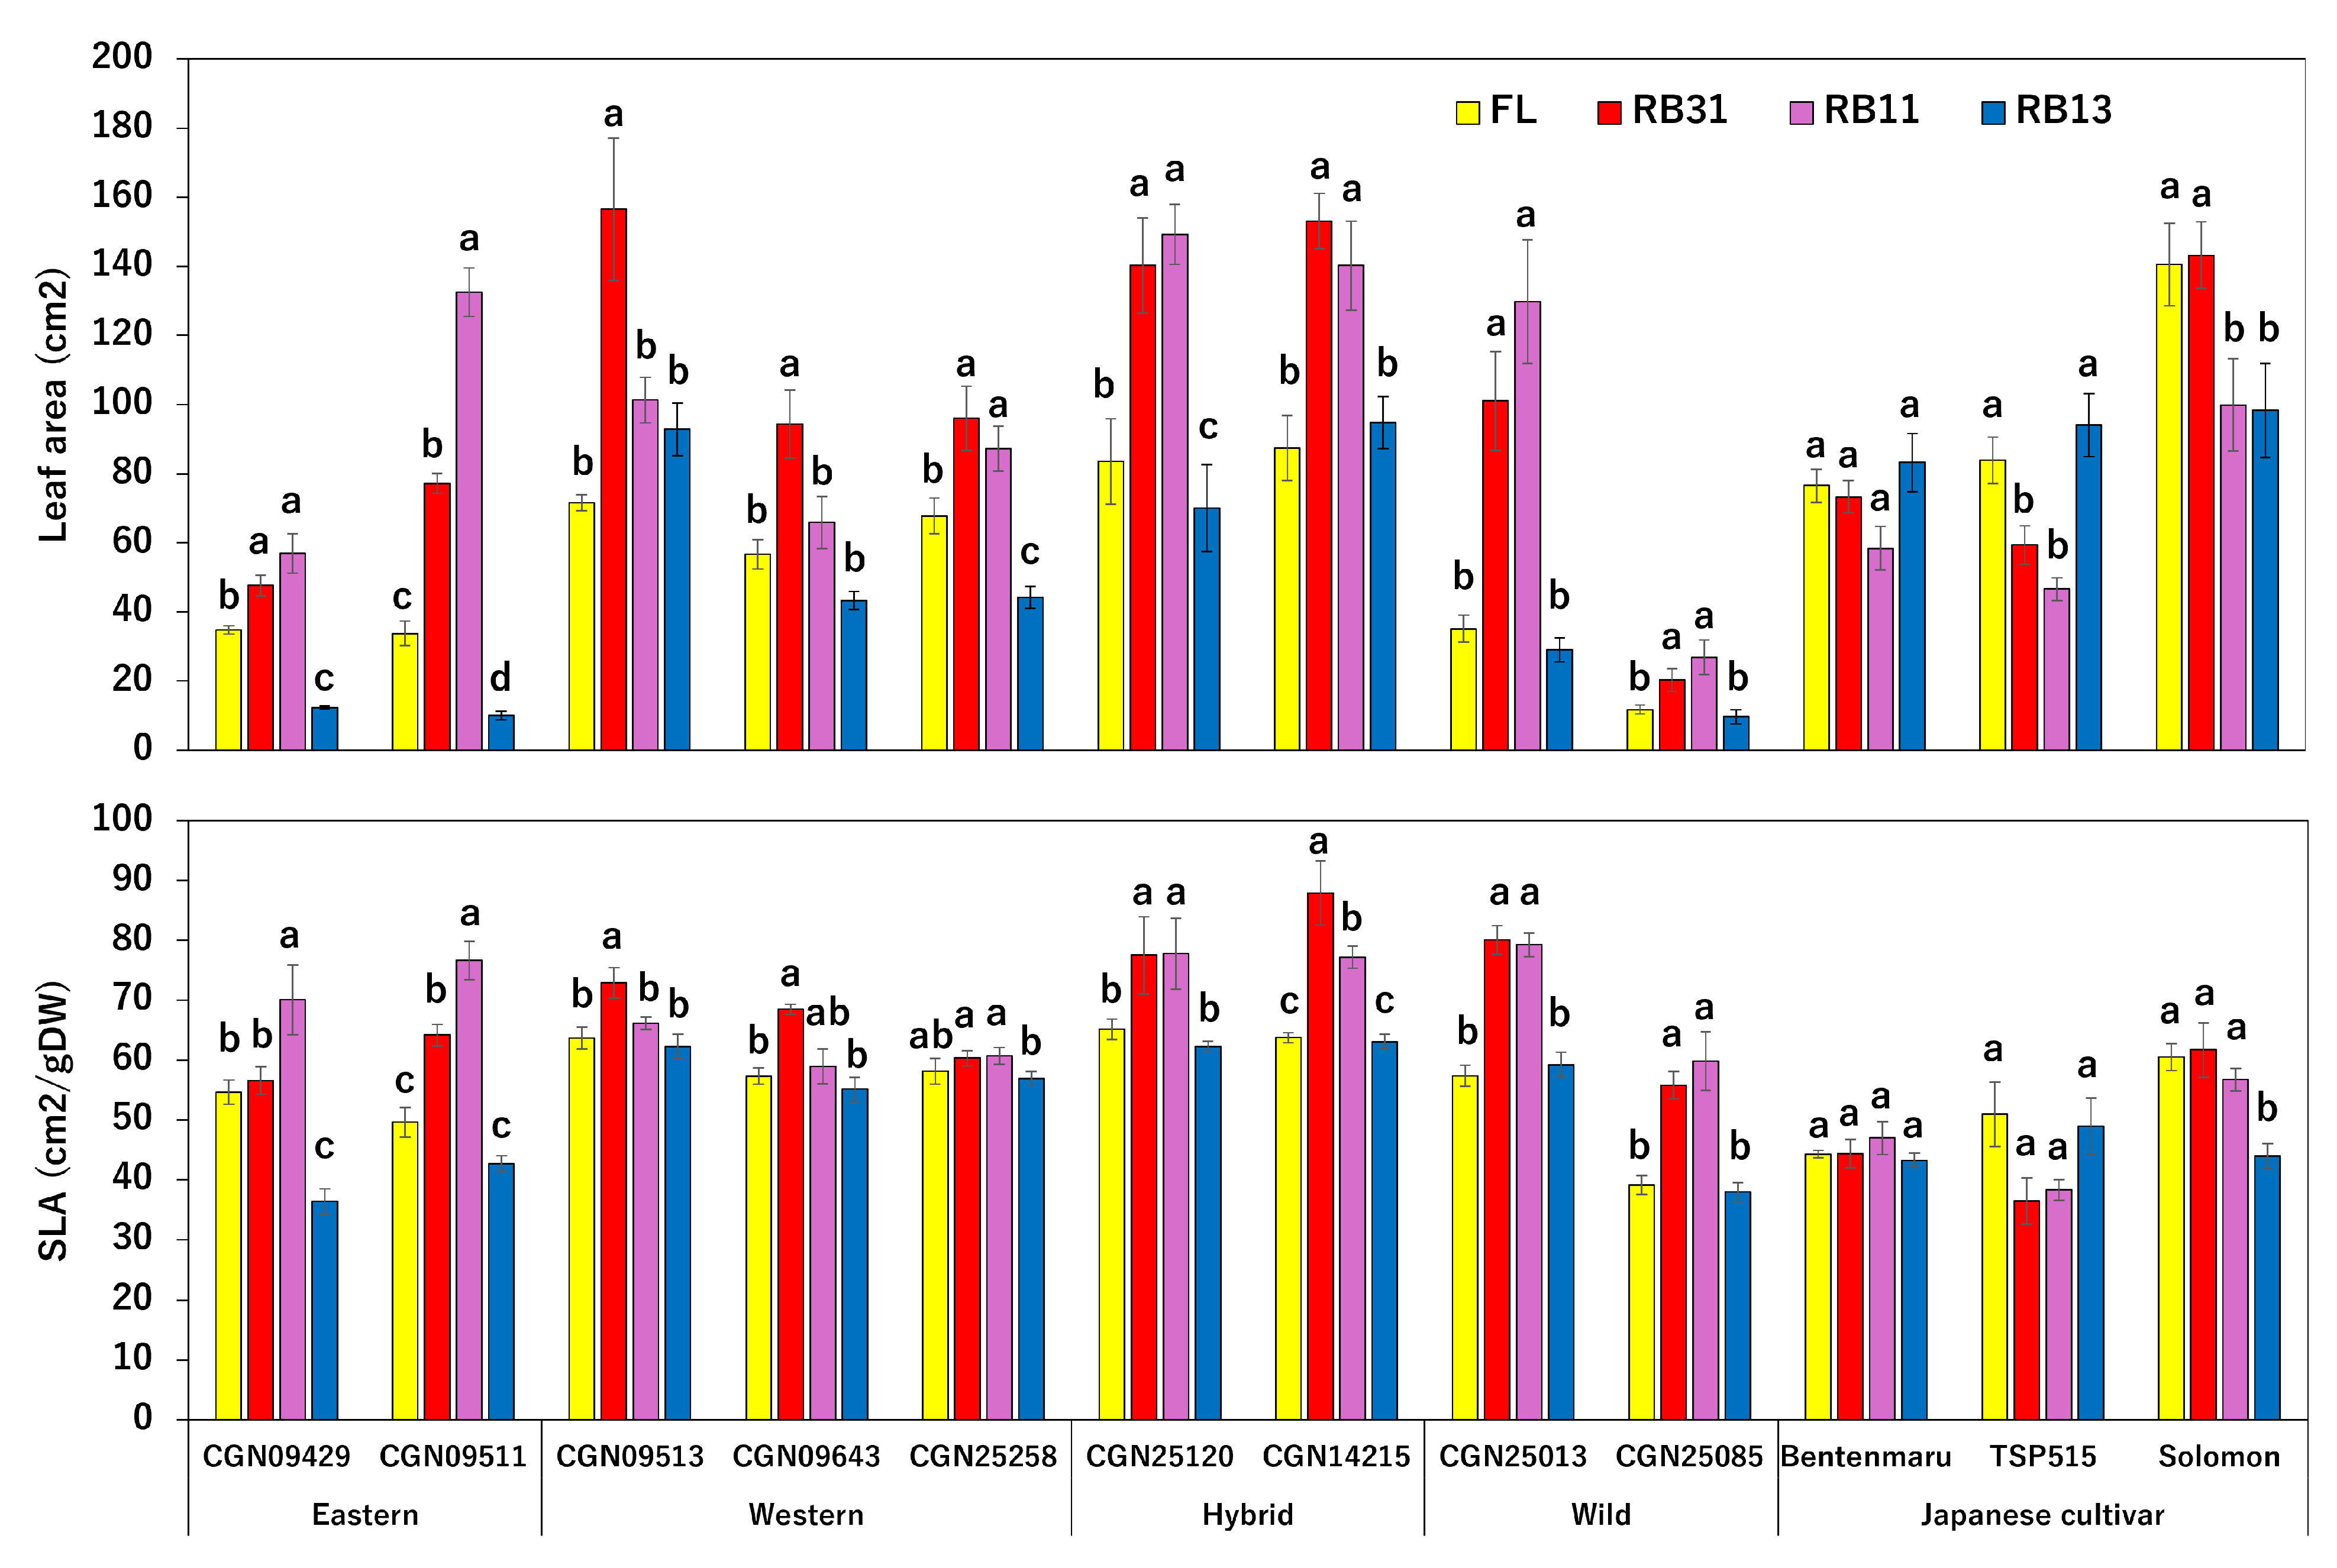
2.1. Growth Features
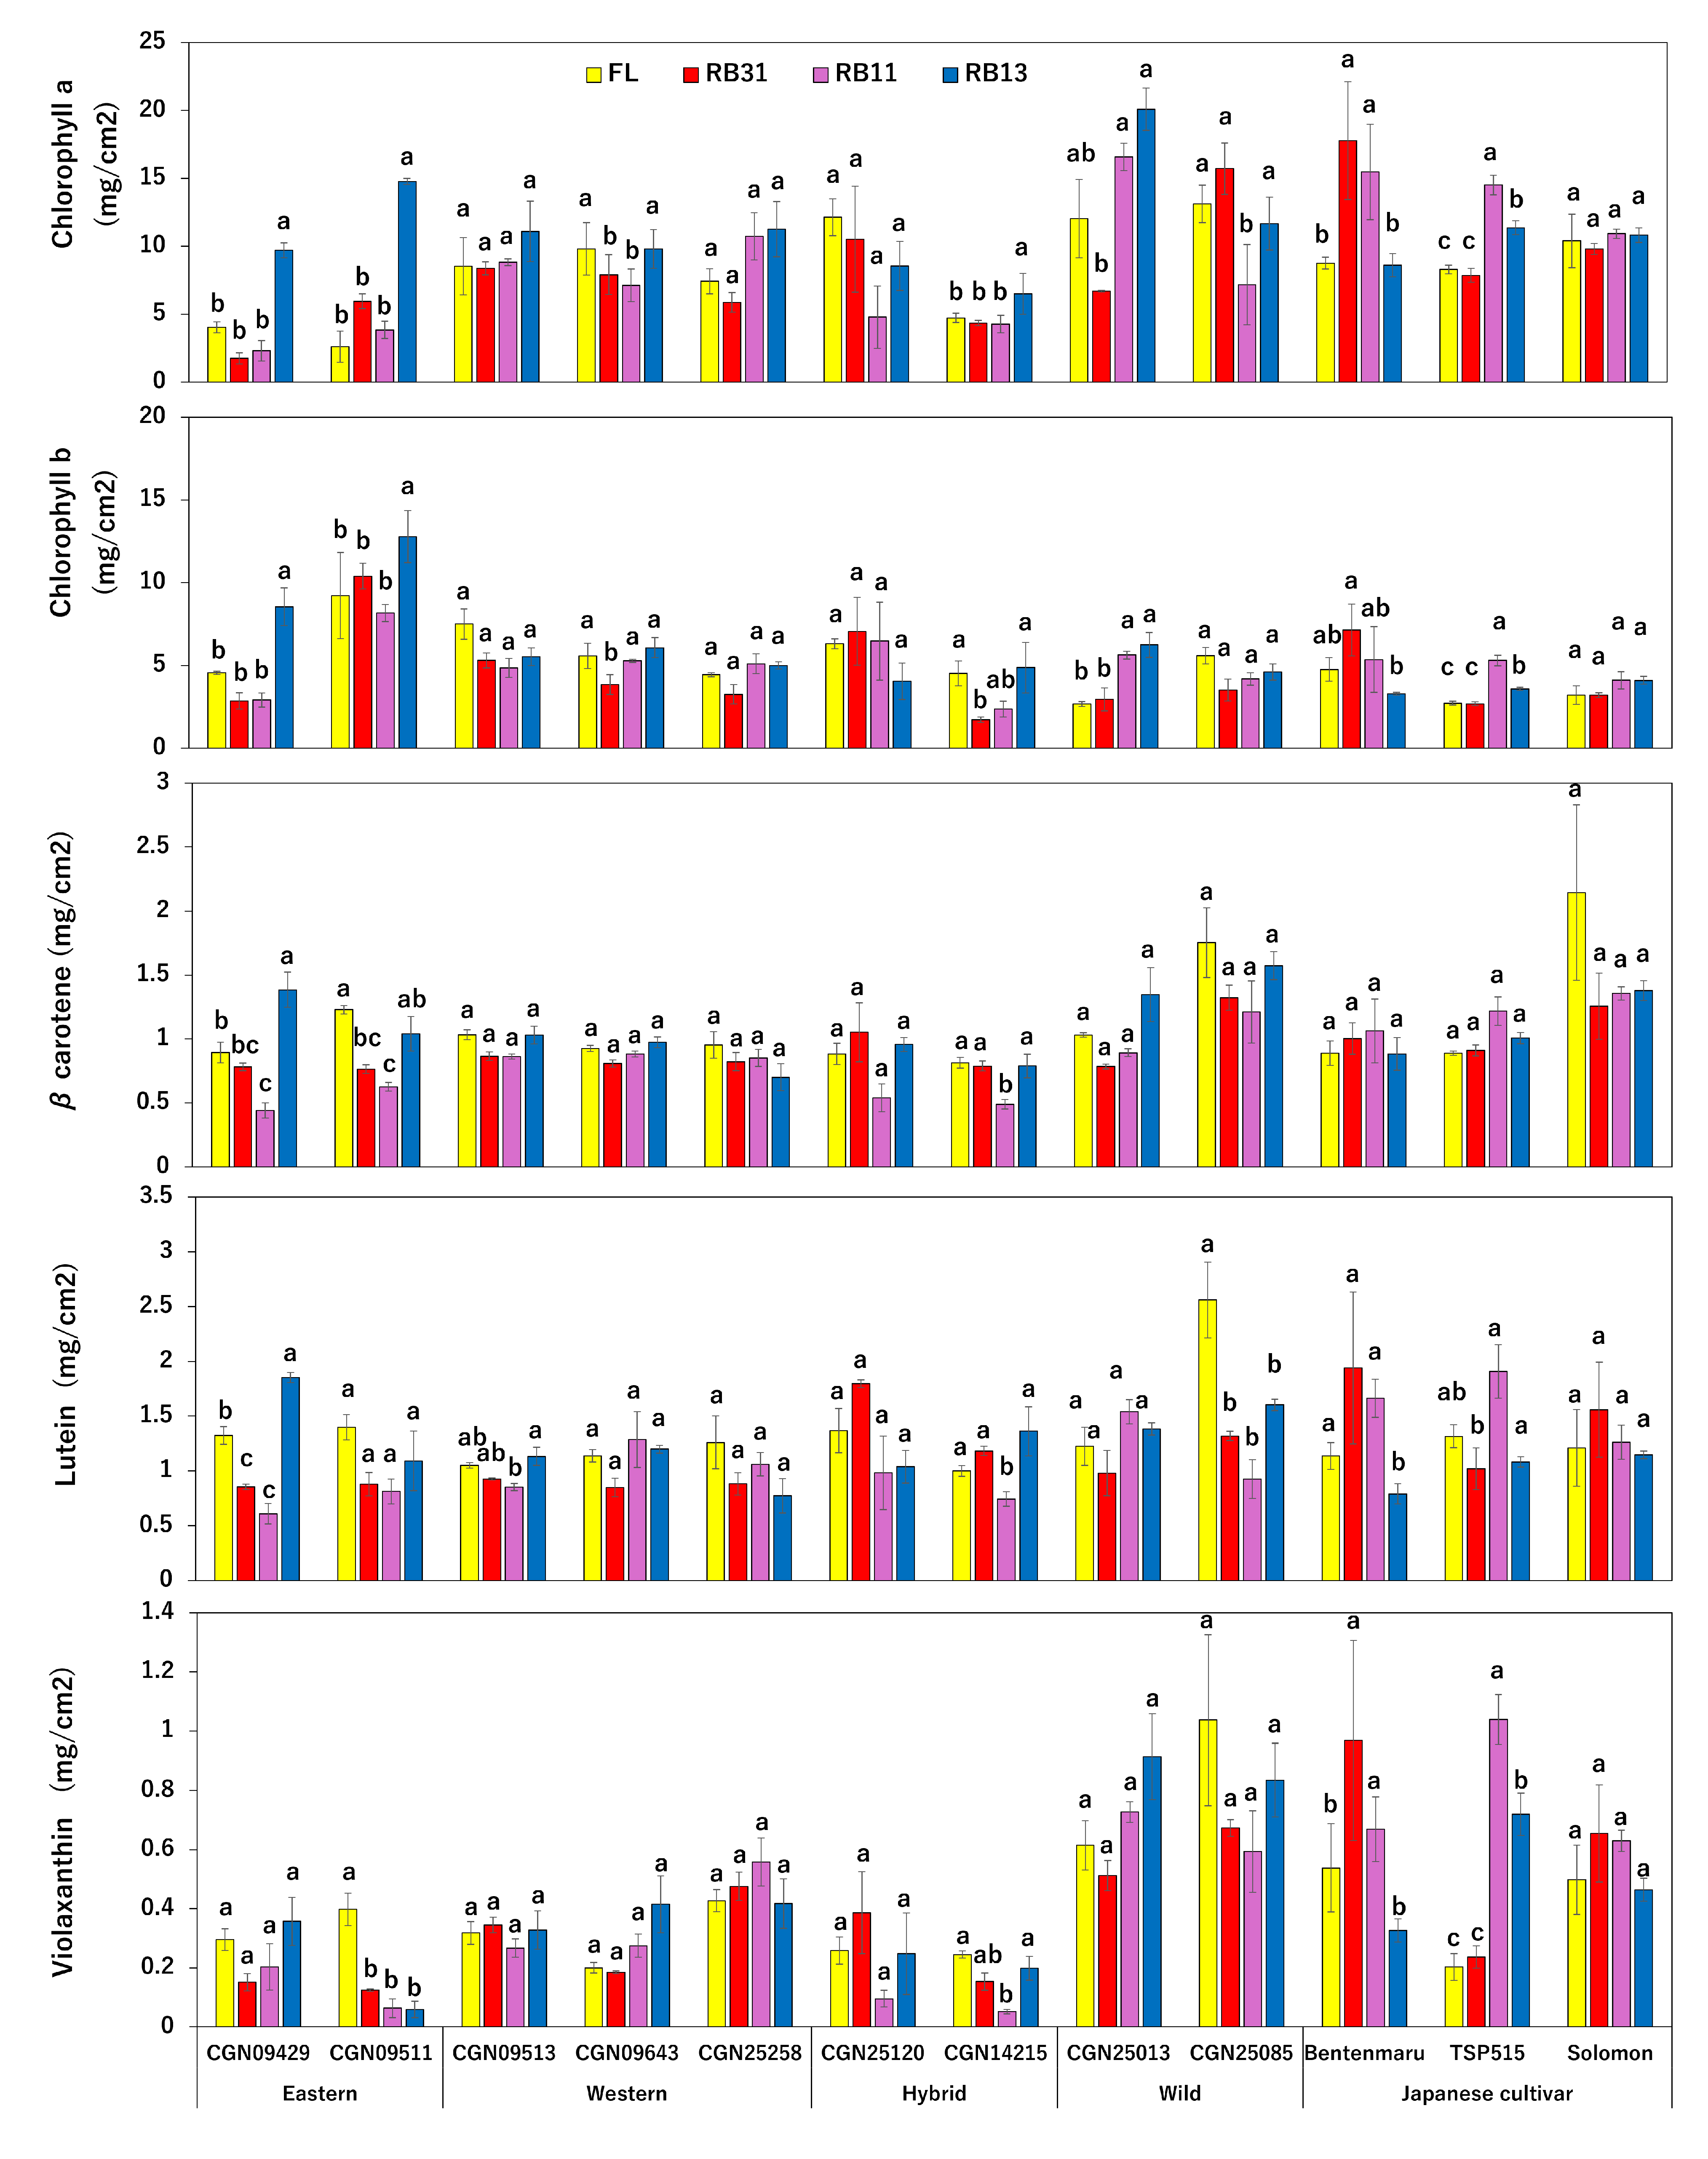
2.2. Phytopigment Content
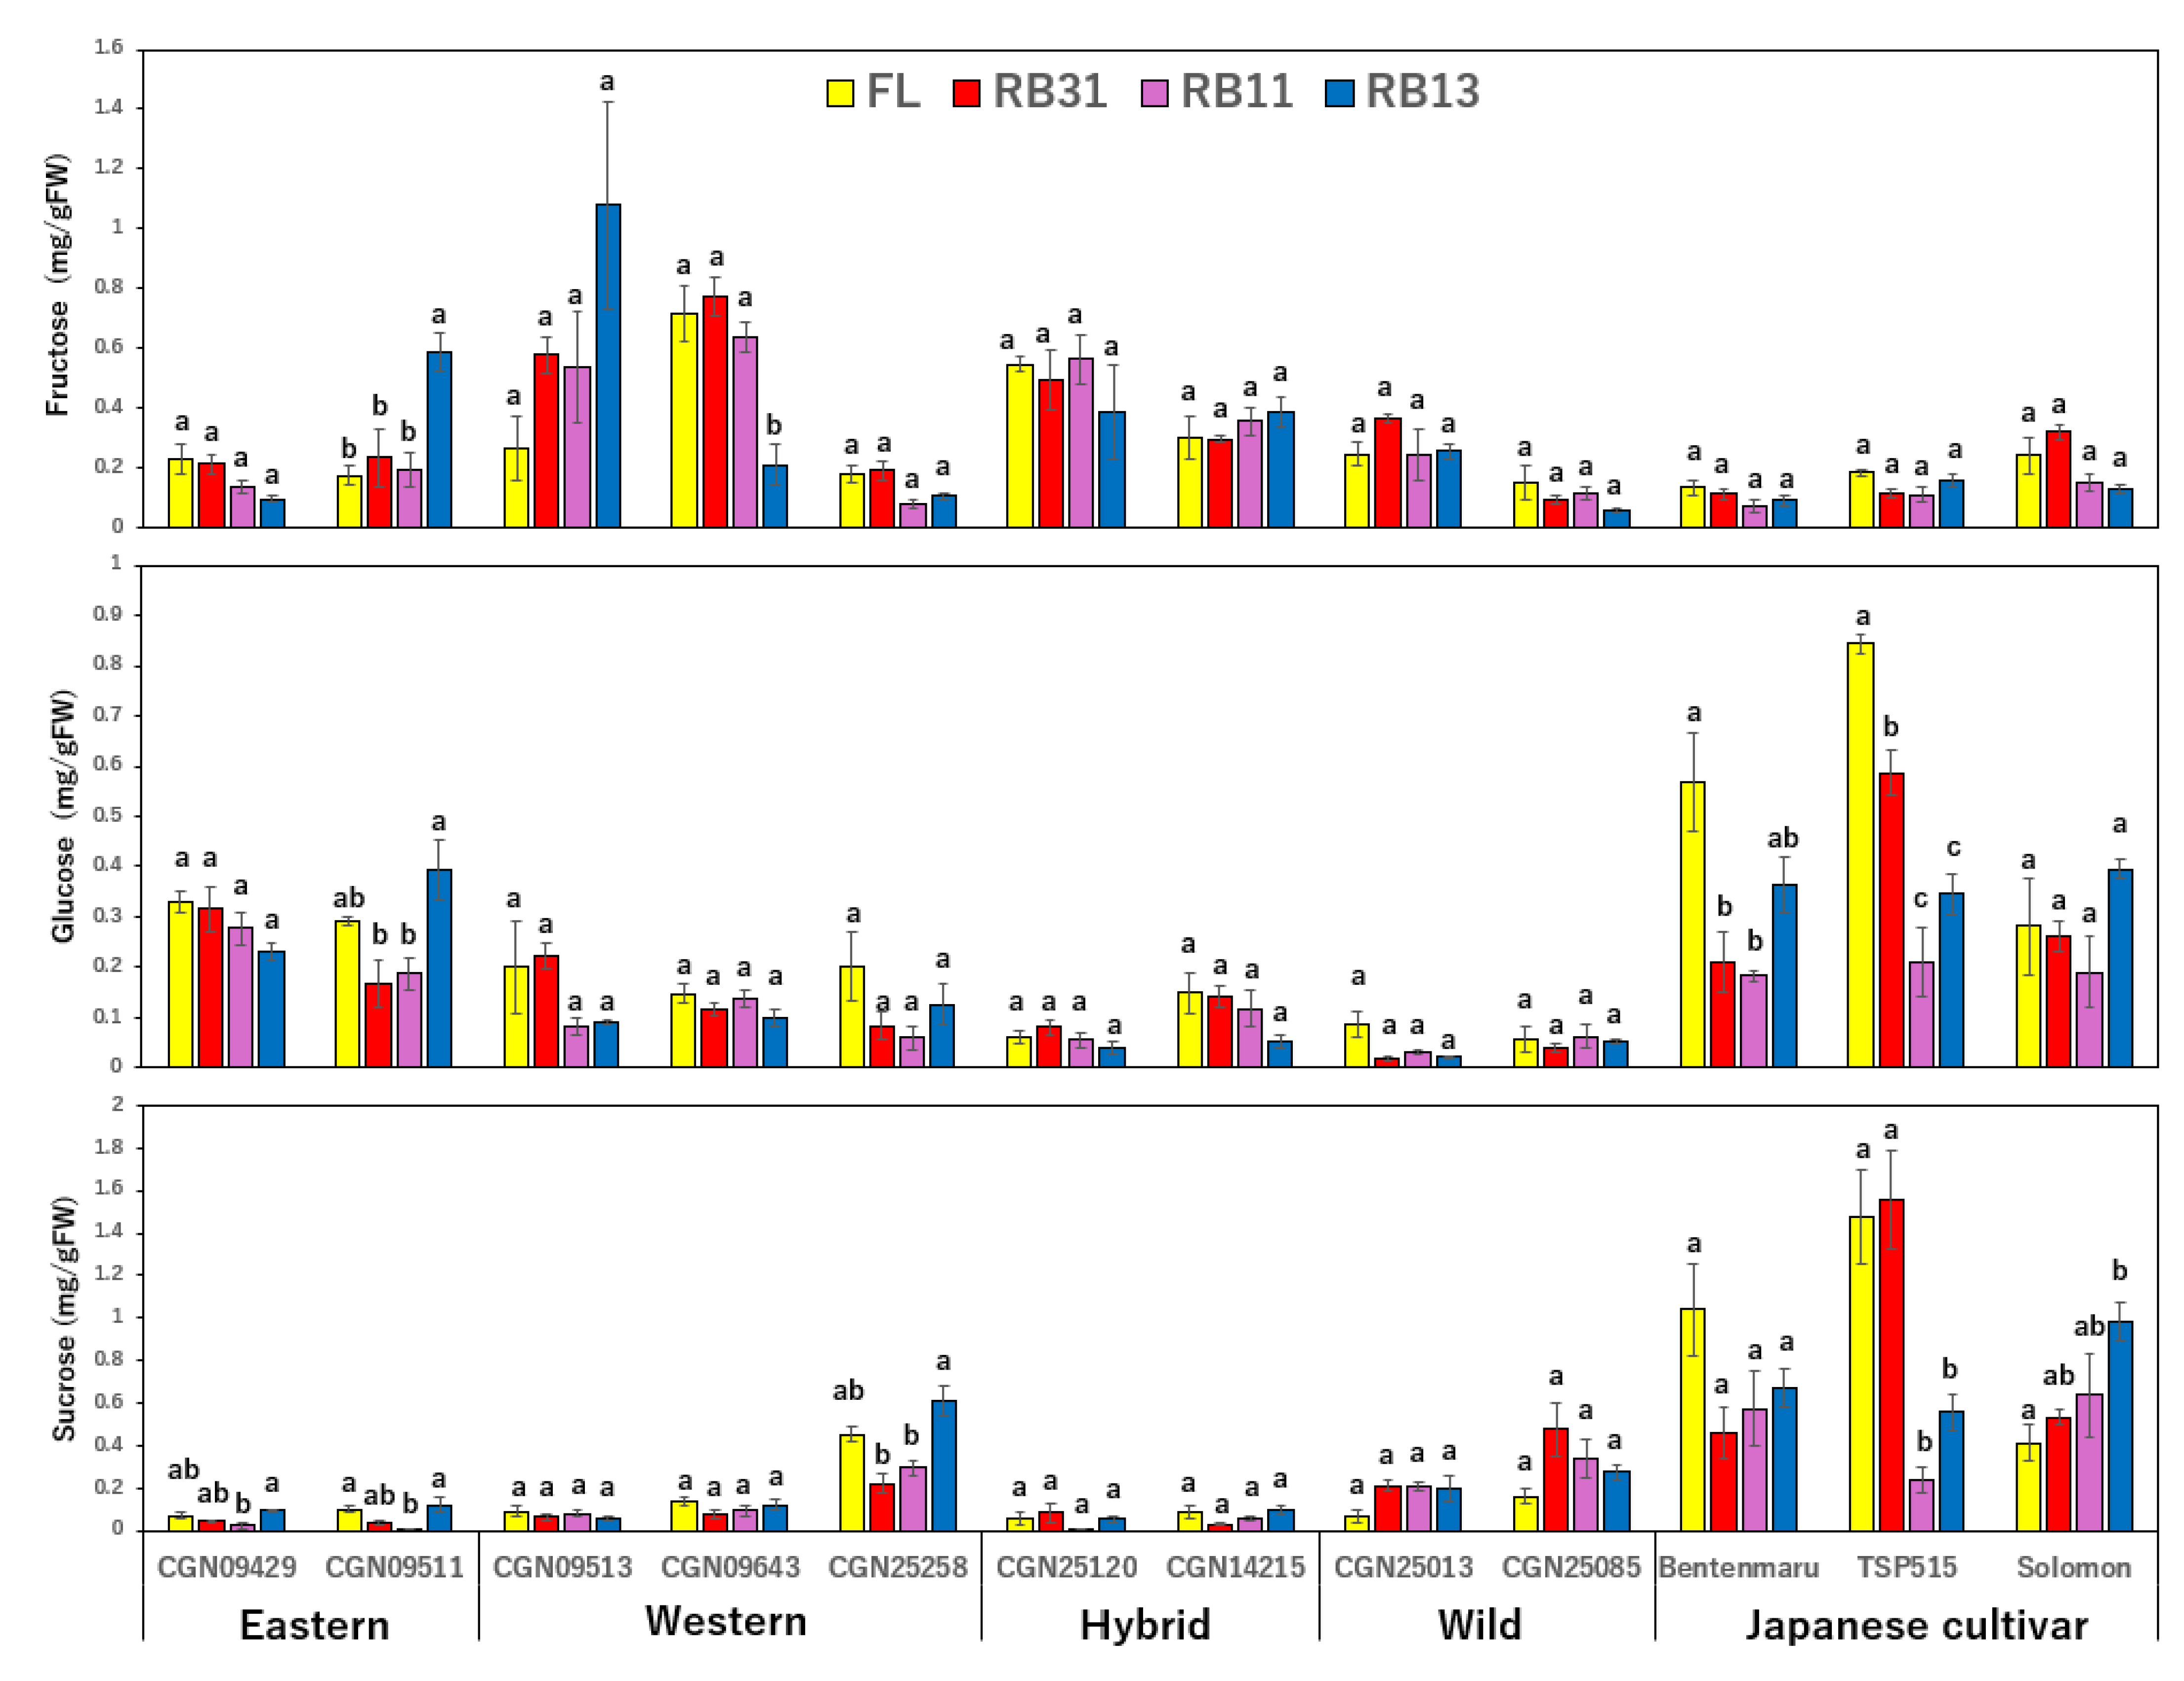
2.3. Sugar Content
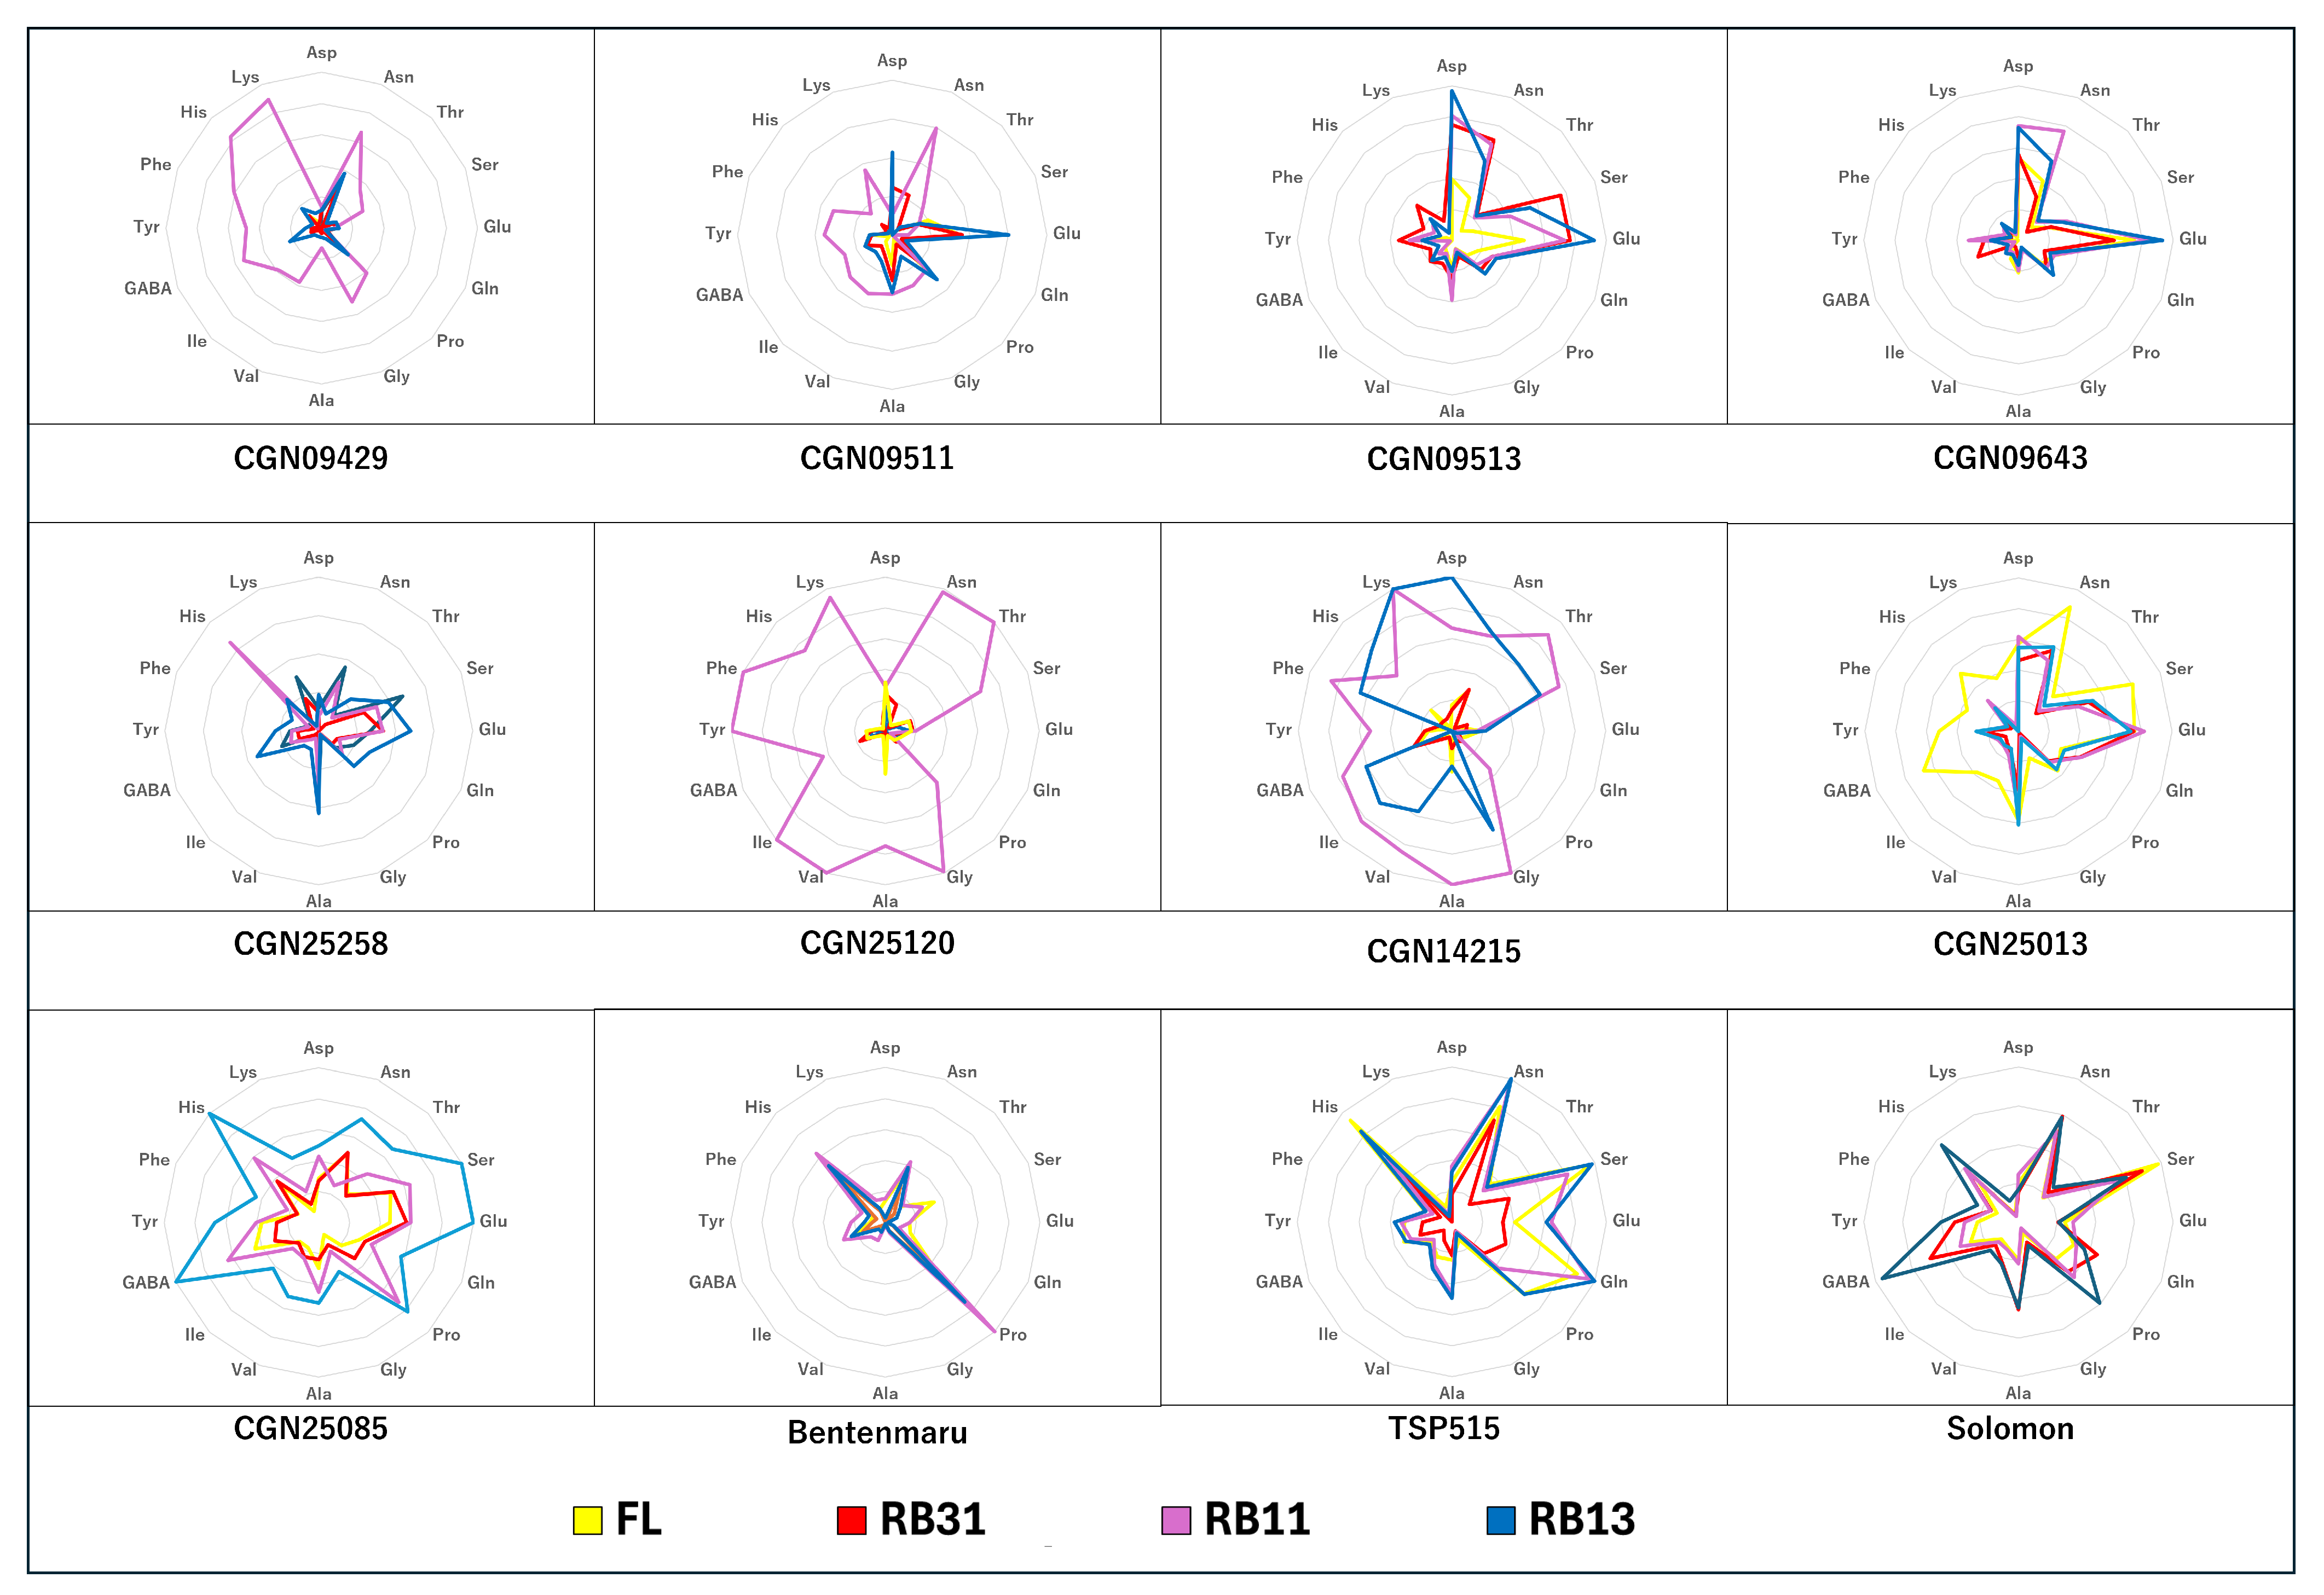
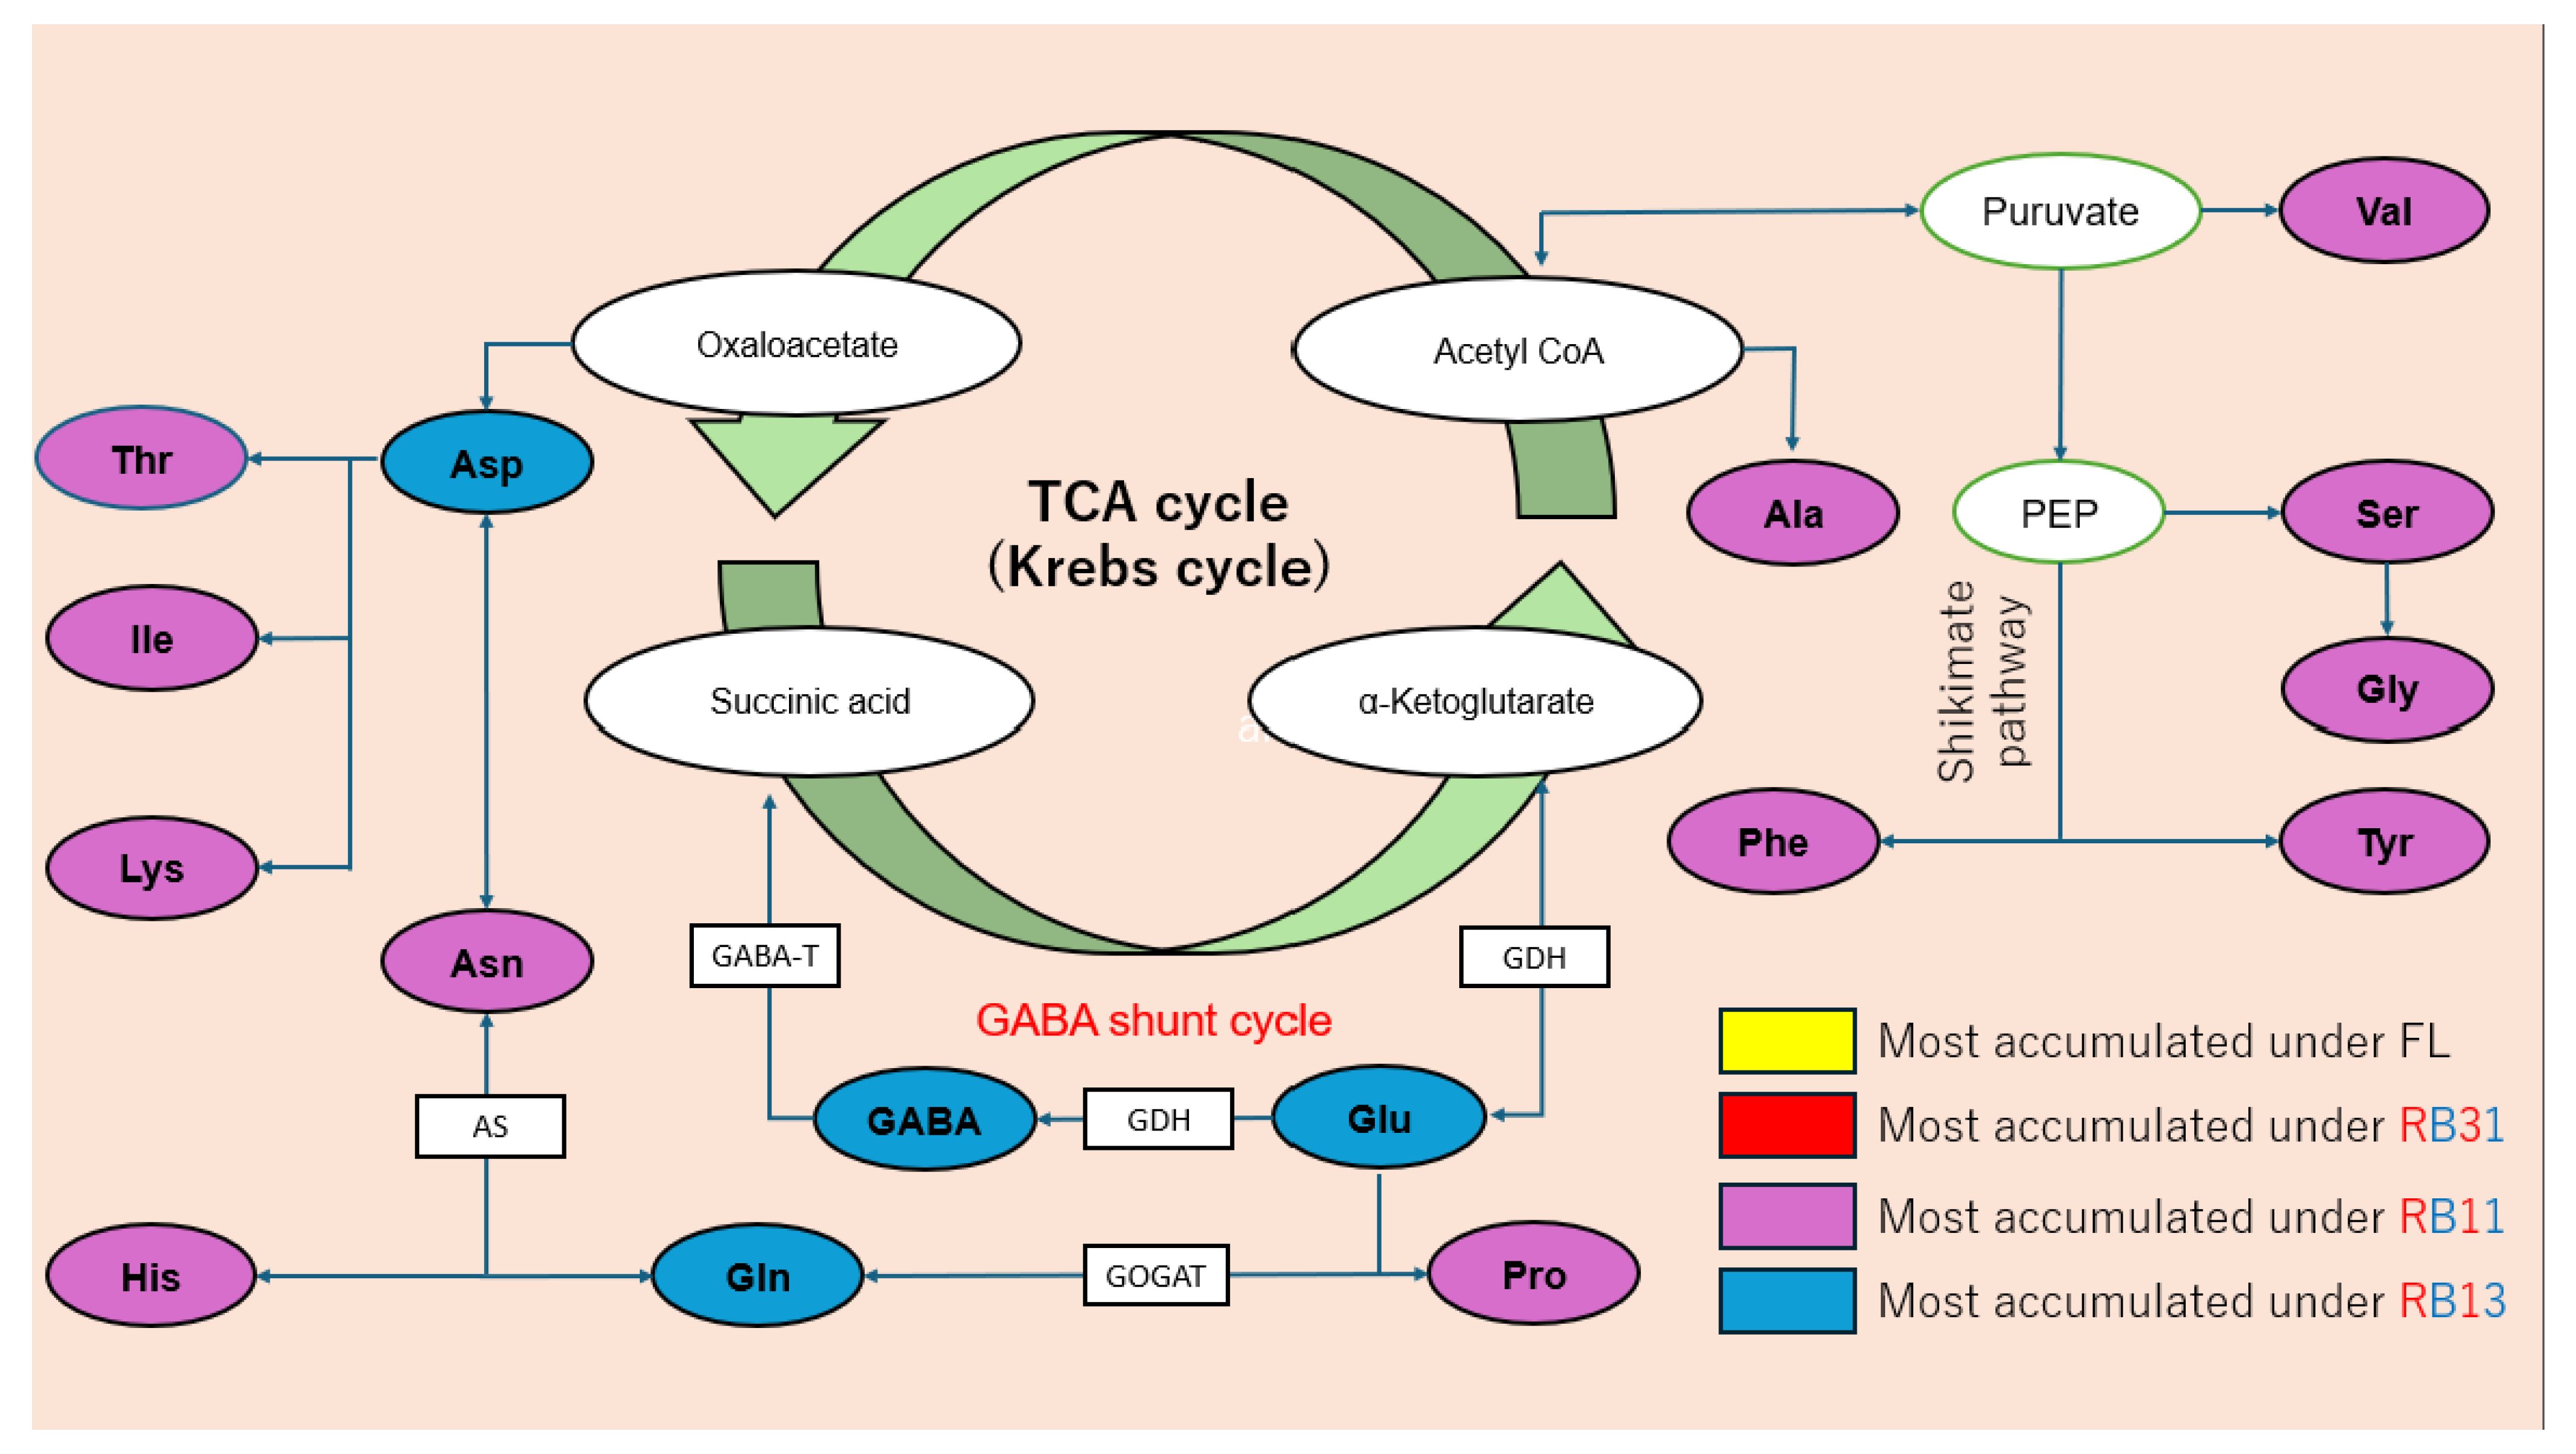
2.4. Amino Acid Content
3. Discussion
3.1. Growth Features
3.2. Phytopigment Content
3.3. Sugar Content
3.4. Amino Acid Content
3.5. Overall Review
4. Materials and Methods
4.1. Plant Materials
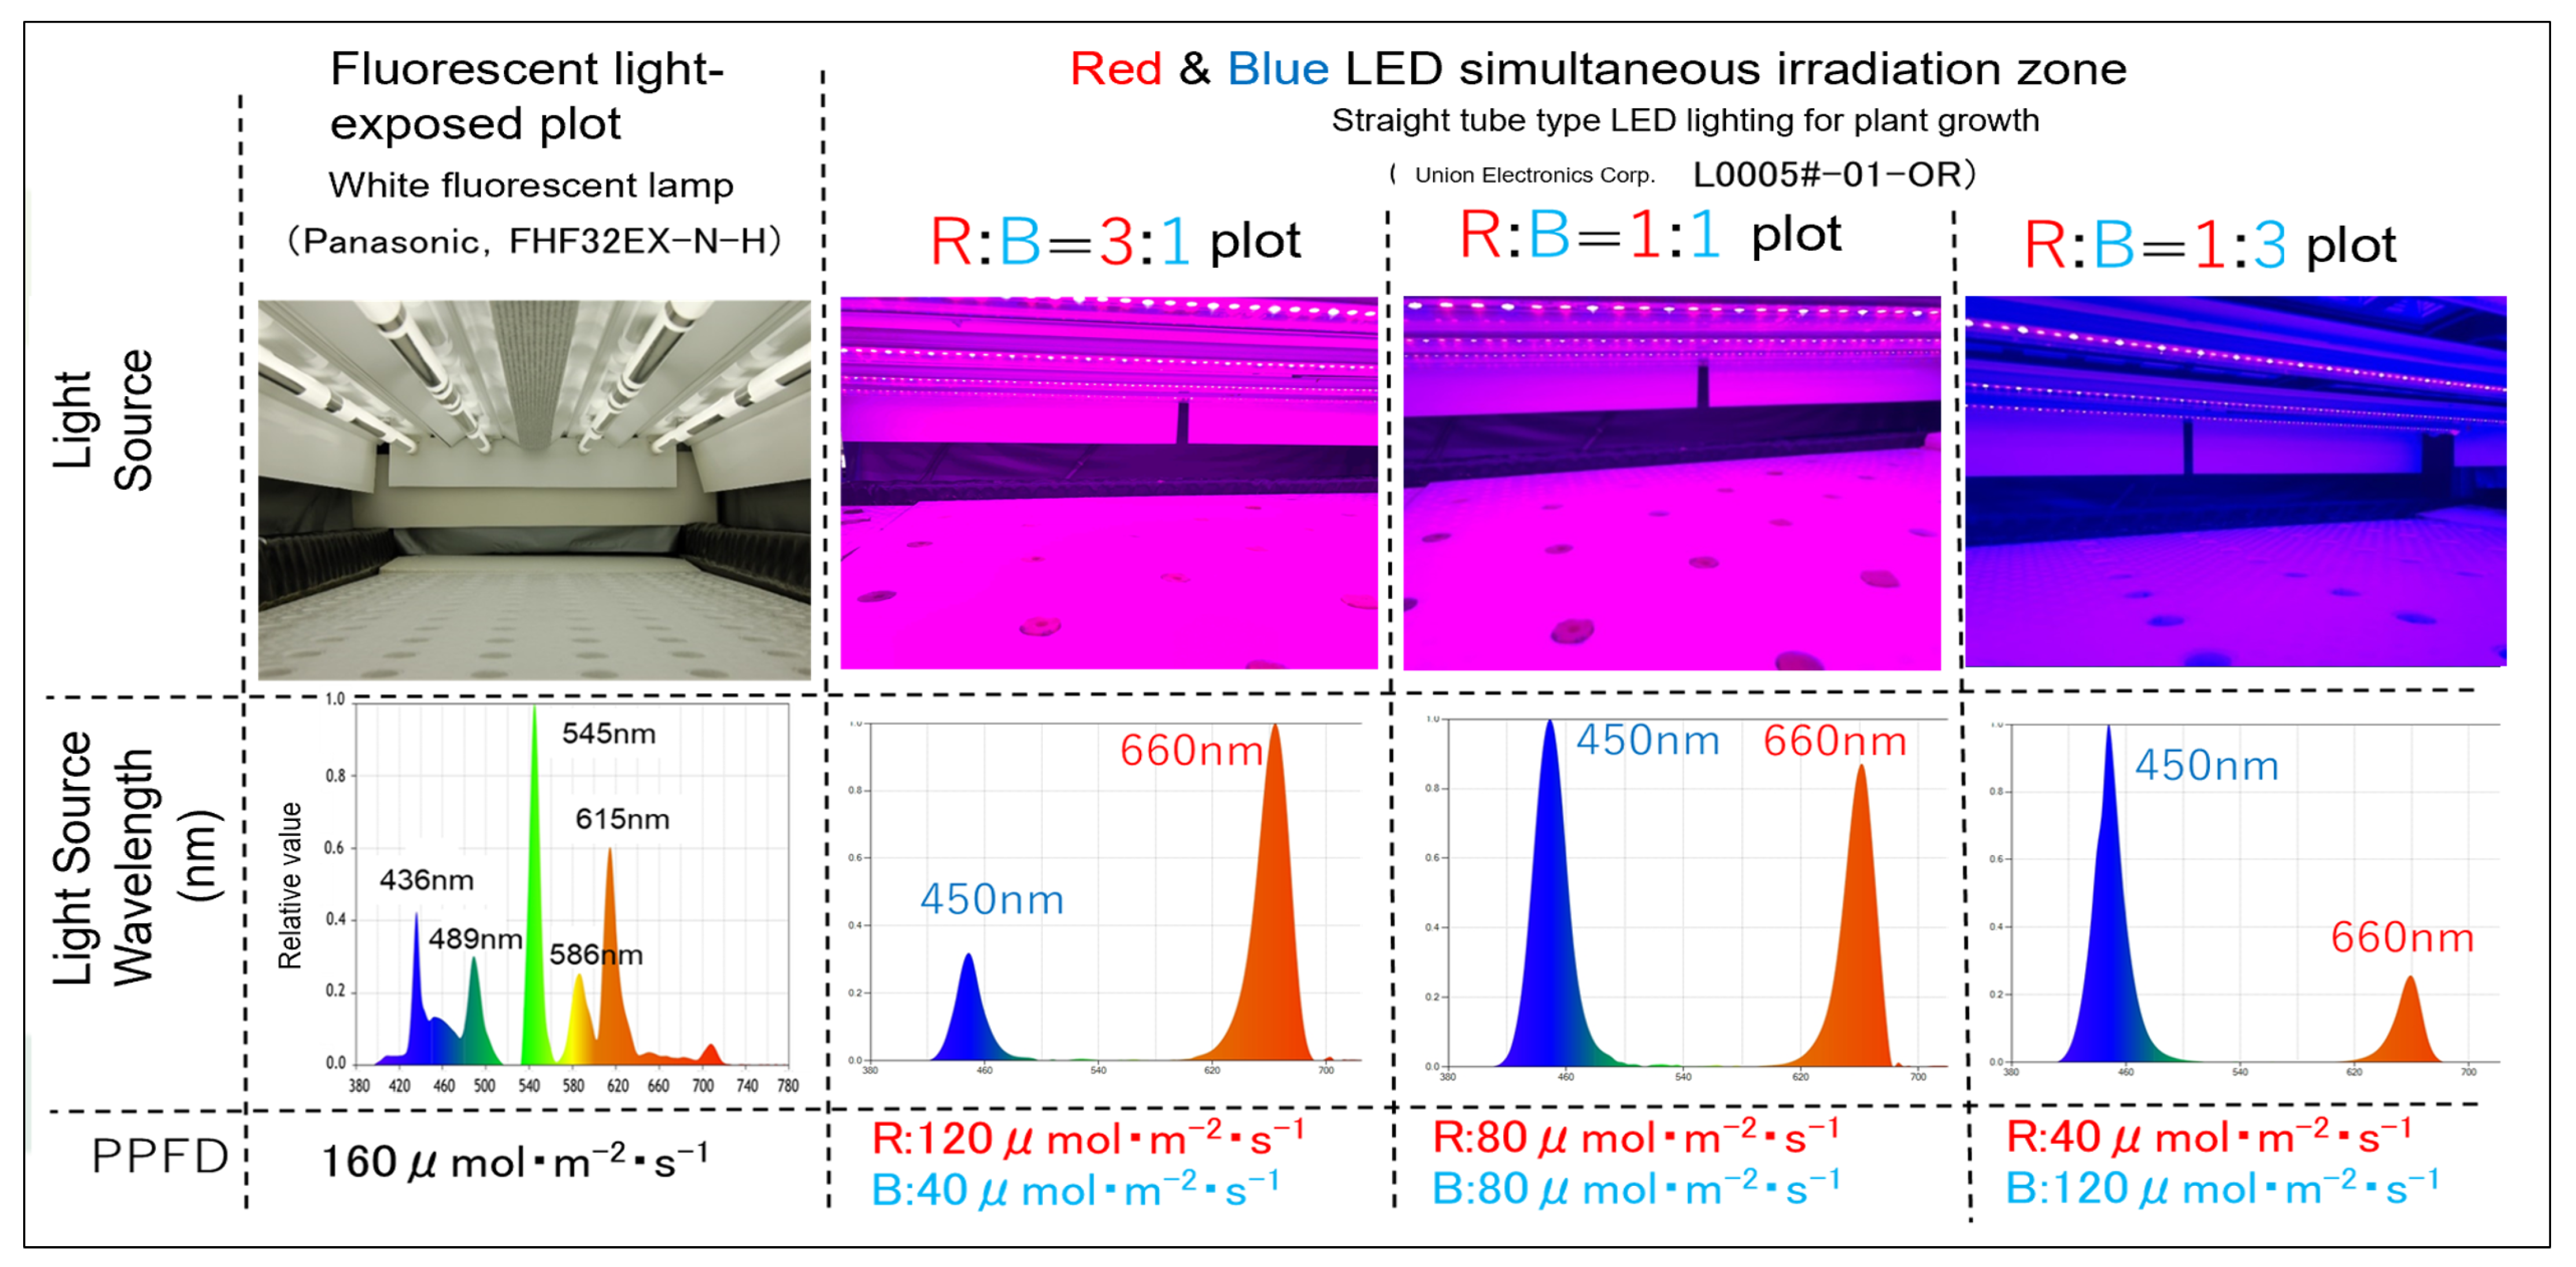
4.2. Growing Conditions
4.3. Irradiation Pattern
4.4. Plant Growth Measurement
4.5. Phytopigment Content Measurement
4.6. Sugar Content Measurement
4.7. Amino Acid Content Measurement
- Column: Shim-pack Amino-Li
- Mobile phase: Amino acid analysis mobile phase kit LI type
- Mobile phase A: Lithium ion, citric acid, 2-methoxyethanol, perchloric acid
- Mobile phase B: Lithium ion, citric acid, boric acid, hydroxide ion
- Mobile phase C: Lithium ion, hydroxide ion
- Reaction solution A: Sodium carbonate, boric acid, potassium sulfate, sodium hypochlorite
- Reaction solution B: Sodium carbonate, boric acid, potassium sulfate, OPA, ethanol, N-acetyl-L-cysteine
- Flow rate (initial conditions): 0.6 mL/min
- Column temperature (initial conditions): 39 °C
- Detector: Spectro fluorescence detector RF-20Axs
- Detection wavelength: 450 nm
- Gradient: Shimadzu high-performance liquid chromatography prominence amino acid analysis system
4.8. Statistical Analysis
5. Conclusions
Supplementary Materials
Author Contributions
Funding
Data Availability Statement
Acknowledgments
Conflicts of Interest
References
- Croce, R.; van Amerongen, H. Natural strategies for photosynthetic light harvesting. Nat. Chem. Biol. 2014, 10, 492–501. [Google Scholar] [CrossRef] [PubMed]
- Roberts, J.L.; Moreau, R. Functional properties of spinach (Spinacia oleracea L.) phytochemicals and bioactives. Food Funct. 2016, 7, 3337–3353. [Google Scholar] [CrossRef] [PubMed]
- Morelock, T.E.; Correll, J.C. Spinach. In Vegetables I: Asteraceae, Brassicaceae, Chenopodicaceae, and Cucurbitaceae; Springer: New York, NY, USA, 2008; pp. 189–218. [Google Scholar] [CrossRef]
- Ribera, A.; van Treuren, R.; Kik, C.; Bai, Y.; Wolters, A.M.A. On the origin and dispersal of cultivated spinach (Spinacia oleracea L.). Genet. Resour. Crop Evol. 2021, 68, 1023–1032. [Google Scholar] [CrossRef]
- Van der Vossen, H. Spinacia oleracea L. In PROTA 2: Vegetables/Légumes; PROTA: Wageningen, The Netherlands, 2004; Volume 2. [Google Scholar]
- Xu, C.; Jiao, C.; Sun, H.; Cai, X.; Wang, X.; Ge, C.; Zheng, Y.; Liu, W.; Sun, X.; Xu, Y.; et al. Draft genome of spinach and transcriptome diversity of 120 Spinacia accessions. Nat. Commun. 2017, 8, 15275. [Google Scholar] [CrossRef]
- Ribera, A.; Bai, Y.; Wolters, A.M.A.; van Treuren, R.; Kik, C. A review on the genetic resources, domestication and breeding history of spinach (Spinacia oleracea L.). Euphytica 2020, 216, 48. [Google Scholar] [CrossRef]
- Wang, J.; Lu, W.; Tong, Y.; Yang, Q. Leaf Morphology, Photosynthetic Performance, Chlorophyll Fluorescence, Stomatal Development of Lettuce (Lactuca sativa L.) Exposed to Different Ratios of Red Light to Blue Light. Front. Plant Sci. 2016, 7, 250. [Google Scholar] [CrossRef]
- Gao, W.; He, D.; Ji, F.; Zhang, S.; Zheng, J. Effects of Daily Light Integral and LED Spectrum on Growth and Nutritional Quality of Hydroponic Spinach. Agronomy 2020, 10, 1082. [Google Scholar] [CrossRef]
- Vaštakaitė-Kairienė, V.; Brazaitytė, A.; Miliauskienė, J.; Runkle, E.S. Red to Blue Light Ratio and Iron Nutrition Influence Growth, Metabolic Response, and Mineral Nutrients of Spinach Grown Indoors. Sustainability 2022, 14, 12564. [Google Scholar] [CrossRef]
- Naznin, M.T.; Lefsrud, M.; Gravel, V.; Azad, M.O.K. Blue Light added with Red LEDs Enhance Growth Characteristics, Pigments Content, and Antioxidant Capacity in Lettuce, Spinach, Kale, Basil, and Sweet Pepper in a Controlled Environment. Plants 2019, 8, 93. [Google Scholar] [CrossRef]
- Son, K.H.; Oh, M.M. Leaf shape, growth and antioxidant phenolic compounds of two lettuce cultivars grown under various combinations of Red and Blue LED. Hortic. Environ. Biotechnol. 2015, 56, 639–653. [Google Scholar] [CrossRef]
- Battistoni, B.; Amorós, A.; Tapia, M.L.; Escalona, V. Effect of LED lights on the antioxidants properties of baby spinach leaves. Rev. FCA UNCuyo 2021, 53, 98–108. [Google Scholar] [CrossRef]
- Gyawali, S.; Bhattarai, G.; Shi, A.; Kik, C.; du Toit, L.J. Genetic Diversity, Structure, and Selective Sweeps in Spinacia turkestanica Associated With the Domestication of Cultivated Spinach. Front. Genet. 2021, 12, 740437. [Google Scholar] [CrossRef] [PubMed]
- She, H.; Liu, Z.; Xu, Z.; Zhang, H.; Cheng, F.; Wu, J.; Wang, W.; Wei, Q. Comparative chloroplast genome analyses of cultivated spinach and two wild progenitors shed light on the phylogenetic relationships and variation. Sci. Rep. 2022, 12, 856. [Google Scholar] [CrossRef] [PubMed]
- Agarwal, A.; Dutta Gupta, S.; Barman, M.; Mitra, A. Photosynthetic apparatus plays a central role in photosensitive physiological acclimations affecting spinach (Spinacia oleracea L.) growth in response to blue and red photon flux ratios. Environ. Exp. Bot. 2018, 156, 170–182. [Google Scholar] [CrossRef]
- Dougher, T.A.; Bugbee, B. Long term Blue Light Effects on the Histology of Lettuce and Soybean Leaves and Stems. J. Am. Soc. Hortic. Sci. 2004, 129, 467–472. [Google Scholar] [CrossRef]
- Snowden, M.C.; Cope, K.R.; Bugbee, B. Sensitivity of Seven Diverse Species to Blue and Green Light: Interactions with Photon Flux. PLoS ONE 2016, 11, e0163121. [Google Scholar] [CrossRef]
- Kong, Y.; Stasiak, M.; Dixon, M.A.; Zheng, Y. Blue light associated with low phytochrome activity can promote elongation growth as shade-avoidance response: A comparison with red light in four bedding plant species. Environ. Exp. Bot. 2018, 155, 345–359. [Google Scholar] [CrossRef]
- Wang, Q.; Liu, Q.; Wang, X.; Zuo, Z.; Oka, Y.; Lin, C. New insights into the mechanisms of phytochrome-cryptochrome coaction. New Phytol. 2018, 217, 547–551. [Google Scholar] [CrossRef]
- Barnes, C.; Tibbitts, T.; Sager, J.; Deitzer, G.; Bubenheim, D.; Koerner, G.; Bugbee, B. Accuracy of quantum sensors measuring yield photon flux and photosynthetic photon flux. HortScience 1993, 28, 1197–1200. [Google Scholar] [CrossRef]
- Izzo, L.G.; Mickens, M.A.; Aronne, G.; Gomez, C. Spectral effects of blue and red light on growth, anatomy, and physiology of lettuce. Physiol. Plant 2021, 172, 2191–2202. [Google Scholar] [CrossRef]
- Akoyunoglou, G.; Anni, H. Blue light effect on chloroplast development in higher plant. In Blue Light Effects in Biological Systems; Springer: Berlin/Heidelberg, Germany, 1984. [Google Scholar]
- Christie, J.M.; Briggs, W.R. Blue light sensing in higher plants. J. Biol. Chem. 2001, 276, 11457–11460. [Google Scholar] [CrossRef] [PubMed]
- Ramezani, M.; Thompson, D.; Moreno, M.; Joshi, V. Biochemical repercussions of light spectra on nitrogen metabolism in spinach (Spinacia oleracea) under a controlled environment. Front. Plant Sci. 2023, 14, 1283730. [Google Scholar] [CrossRef] [PubMed]
- Hogewoning, S.W.; Trouwborst, G.; Maljaars, H.; Poorter, H.; van Ieperen, W.; Harbinson, J. Blue light dose-responses of leaf photosynthesis, morphology, and chemical composition of Cucumis sativus grown under different combinations of red and blue light. J. Exp. Bot. 2010, 61, 3107–3117. [Google Scholar] [CrossRef] [PubMed]
- Esther van Praag, D.M. Response of the carbohydrate metabolism and fructose 2, 6-bisphosphate to environmental changes. Effect of different light treatments. Bot. Helvenia 1997, 106, 103–112. [Google Scholar]
- Lee, S.W.; Hahn, T.R. Light-regulated differential expression of pea chloroplast and cytosolic fructose-1,6-bisphosphatases. Plant Cell Rep. 2003, 21, 611–618. [Google Scholar] [CrossRef]
- McCormick, A.J.; Kruger, N.J. Lack of fructose 2,6-bisphosphate compromises photosynthesis and growth in Arabidopsis in fluctuating environments. Plant J. 2015, 81, 670–683. [Google Scholar] [CrossRef]
- Wilson, D.G.; King, K.W.; Burris, R.H. Transamination Reactions in Plants. J. Biol. Chem. 1954, 208, 863–874. [Google Scholar] [CrossRef]
- Lea, P.J.; Miflin, B.J. Alternative route for nitrogen assimilation in higher plants. Nature 1974, 251, 614–616. [Google Scholar] [CrossRef]
- Azevedo, R.A.; Lancien, M.; Lea, P.J. The aspartic acid metabolic pathway, an exciting and essential pathway in plants. Amino Acids 2006, 30, 143–162. [Google Scholar] [CrossRef]


| Accession | Population Group x | Scientific Name | Origin y |
|---|---|---|---|
| CGN09429 | Eastern group | Spinacia oleracea | The Netherlands |
| CGN09511 | Eastern group | Spinacia oleracea | Ethiopia |
| CGN09513 | Western group | Spinacia oleracea | France |
| CGN09643 | Western group | Spinacia oleracea | Iran |
| CGN25258 | Western group | Spinacia oleracea | Ukraine |
| CGN25120 | Hybrid group | Spinacia oleracea | Azerbaijan |
| CGN14215 | Hybrid group | Spinacia oleracea | China |
| CGN25013 | Wild group | Spinacia turkestanica | Uzbekistan |
| CGN25085 | Wild group | Spinacia tetrandra | Georgia |
| Bentenmaru | Japanese cultivar | Spinacia oleracea | Japan |
| TSP515 | Japanese cultivar | Spinacia oleracea | Japan |
| Solomon | Japanese cultivar | Spinacia oleracea | Japan |
Disclaimer/Publisher’s Note: The statements, opinions and data contained in all publications are solely those of the individual author(s) and contributor(s) and not of MDPI and/or the editor(s). MDPI and/or the editor(s) disclaim responsibility for any injury to people or property resulting from any ideas, methods, instructions or products referred to in the content. |
© 2025 by the authors. Licensee MDPI, Basel, Switzerland. This article is an open access article distributed under the terms and conditions of the Creative Commons Attribution (CC BY) license (https://creativecommons.org/licenses/by/4.0/).
Share and Cite
Le, T.M.; Sago, Y.; Ibaraki, Y.; Harada, K.; Arai, K.; Ishizaki, Y.; Aoki, H.; Abdelrahman, M.; Kik, C.; van Treuren, R.; et al. Effect of LED Irradiation with Different Red-to-Blue Light Ratios on Growth and Functional Compound Accumulations in Spinach (Spinacia oleracea L.) Accessions and Wild Relatives. Plants 2025, 14, 700. https://doi.org/10.3390/plants14050700
Le TM, Sago Y, Ibaraki Y, Harada K, Arai K, Ishizaki Y, Aoki H, Abdelrahman M, Kik C, van Treuren R, et al. Effect of LED Irradiation with Different Red-to-Blue Light Ratios on Growth and Functional Compound Accumulations in Spinach (Spinacia oleracea L.) Accessions and Wild Relatives. Plants. 2025; 14(5):700. https://doi.org/10.3390/plants14050700
Chicago/Turabian StyleLe, Tri Manh, Yuki Sago, Yasuomi Ibaraki, Kazuhiro Harada, Kenta Arai, Yuichi Ishizaki, Hitoshi Aoki, Mostafa Abdelrahman, Chris Kik, Rob van Treuren, and et al. 2025. "Effect of LED Irradiation with Different Red-to-Blue Light Ratios on Growth and Functional Compound Accumulations in Spinach (Spinacia oleracea L.) Accessions and Wild Relatives" Plants 14, no. 5: 700. https://doi.org/10.3390/plants14050700
APA StyleLe, T. M., Sago, Y., Ibaraki, Y., Harada, K., Arai, K., Ishizaki, Y., Aoki, H., Abdelrahman, M., Kik, C., van Treuren, R., van Hintum, T., & Shigyo, M. (2025). Effect of LED Irradiation with Different Red-to-Blue Light Ratios on Growth and Functional Compound Accumulations in Spinach (Spinacia oleracea L.) Accessions and Wild Relatives. Plants, 14(5), 700. https://doi.org/10.3390/plants14050700