Communication

Light Intensity Dependence of CO2 Assimilation Is More Related to Biochemical Capacity Rather than Diffusional Conductance

1
Kunming Institute of Botany, Chinese Academy of Sciences, Kunming 650201, China
2
Yunnan Academy of Forestry and Grassland, Kunming 650201, China
*
Authors to whom correspondence should be addressed.
Plants 2025, 14(7), 986; https://doi.org/10.3390/plants14070986
Submission received: 21 February 2025 / Revised: 19 March 2025 / Accepted: 19 March 2025 / Published: 21 March 2025
(This article belongs to the Special Issue Advances in Plant Photobiology)

Abstract

The response of CO2 assimilation rate (AN) to incident light intensity reflects the efficiency of light utilization. The light intensity dependence of AN varies widely among different plant species, yet the underlying mechanisms remain poorly understood. To elucidate this issue, we measured the light intensity dependence of gas exchange and chlorophyll fluorescence in twelve tree species. The results indicated that (1) with increasing light intensity, the variation in AN was closely related to stomatal conductance (gs), mesophyll conductance (gm), the maximum velocity of Rubisco carboxylation (Vcmax), and electron transport rate (ETR); (2) compared with AN at sub-saturating light, the increase in AN at saturating light was more strongly associated with Vcmax and ETR than with gs and gm; and (3) the increase in Vcmax and AN from 600 to 2000 μmol photons m−2 s−1 were positively correlated with the maximum capacity of Vcmax. These findings suggest that Vcmax is an energy-dependent process that significantly regulates the light intensity dependence of AN in plants. This provides valuable insights for crop improvement through the manipulation of Vcmax.

1. Introduction

Plants utilize photosynthesis to convert light energy into chemical energy in the form of ATP and NADPH, which are used to assimilate CO2 and synthesize organic matter. The maximum AN largely varies among different plants due to changes in stomatal conductance (gs), mesophyll conductance (gm), and biochemical capacity [1,2,3,4,5]. Under field environments, natural light intensity usually fluctuates during the daytime due to changes in solar position and cloud cover [6,7]. Light intensity significantly influences the CO2 assimilation rate (AN) through effects on gs, gm, Rubisco activation state, and electron transport rate (ETR) [8,9,10]. The response of AN to incident light intensity plays a significant role in determining plant growth and crop yield [11].
With the increase in light intensity, AN usually increases gradually to reach the maximum value at saturating light. Many previous studies have measured the light response curves of AN in plants [8,12,13], pointing out that the light saturation point (LSP) of AN largely differs between species. For example, LSP is lower than 300 μmol photons m−2 s−1 in some low-photosynthesis plants, such as Paphiopedilum species and Pleione aurita [12,13]. By comparison, LSP is approximately 1500 μmol photons m−2 s−1 in some high-photosynthesis plants, such as tobacco and tomato [10,14]. Although such species-dependent LSP is related to the maximum AN under saturating light, mechanisms underlying the variation in light intensity dependence of AN have not been well clarified.
At a given incident light intensity, the value of AN can be limited by diffusional CO2 conductance and/or biochemical capacities [15]. Specifically, AN under low light is mainly limited by the availability of ATP and NADPH produced through ETR [16]. With the increase in light intensity, the major limitation of AN gradually shifts from ETR to RuBP carboxylation/regeneration [17]. According to the photosynthesis model, ETR = PPFD × ΦPSII × s, where PPFD is the photosynthetic photon flux density, ΦPSII is the effective quantum yield of photosystem II (PSII) photochemistry, and s is the proportion of light energy absorbed by leaves allocated to PSII, with a typical value of 0.45. At a moderate illumination of 600 μmol photons m−2 s−1, ETR can theoretically reach 189 μmol photons m−2 s−1 when ΦPSII is assumed to be 0.7. The value of AN can theoretically reach 23.6 μmol CO2 m−2 s−1 based on the assumption that AN = ETR/8. Since the saturating AN of most species is lower than 23.6 μmol CO2 m−2 s−1, their LSP of AN is theoretically lower than 600 μmol photons m−2 s−1. However, the actual LSP is usually higher than 600 μmol photons m−2 s−1. This discrepancy between theoretical and actual LSP is caused by the actual ΦPSII, which is related to the consumption rates of ATP and NADPH required for Rubisco carboxylation. As we know, the capacity of Rubisco carboxylation is determined by Vcmax and chloroplast CO2 concentration, the latter of which is tightly related to CO2 diffusional conductance (gs and gm) [18,19,20]. Therefore, the light intensity dependence of AN is theoretically determined by the light responses of Vcmax, gs, and/or gm. In angiosperms, Vcmax and gs usually increase with increasing illumination, but gm is maintained stable in some species and gradually increases in others [8,9,21,22,23]. However, it remains unclear whether the light intensity dependence of AN is mainly related to Vcmax or diffusional CO2 conductance (gs and gm).
In this study, we measured light response data of gas exchange and chlorophyll fluorescence in twelve tree species with the aim of systematically understanding the main factor influencing the light intensity dependence of AN. The results indicated that the relative increase in AN at saturating light compared with that at sub-saturating light was mainly determined by the increased kinetics of Vcmax rather than gs and gm. Therefore, optimizing the light intensity dependence of Vcmax has the potential to enhance crop yield.

2. Materials and Methods

2.1. Plant Materials and Growth Condition

In this study, we used the seedlings of twelve tree species with variation in the photosynthetic capacity: Chaenomeles cathayensis (Hemsl.) C. K. Schneid., Cercis glabra Pamp., Pterocarya stenoptera C. DC., Idesia polycarpa Maxim., Idesia polycarpa var. vestita Diels, Melia azedarach L., Pistacia chinensis Bunge, Fraxinus retusifoliolata Feng ex P. Y. Bai, Hypericum monogynum L., Styrax grandiflorus Griff., Sunhangia elegans (DC.) H. Ohashi and K. Ohashi, and Alnus nepalensis D. Don. All plants were cultivated in greenhouses in Kunming, Yunnan, China. The day/night temperature is 30/20 °C, relative humidity is about 60%, and the maximum light intensity to which leaves were exposed is approximately 1000 μmol photons m−2 s−1. To avoid any water and nutrient stress, plants were cultivated using a soilless substrate and drip irrigation techniques.

2.2. Gas Exchange and Chlorophyll Fluorescence Measurements

In the morning of clear days in summer, gas exchange and chlorophyll fluorescence were measured at 25 °C using the chlorophyll fluorescence probe of the LI-6400XT portable photosynthesis system (LI-COR Inc., Lincoln, NE, USA). Mature sun leaves were initially exposed to high light (1500 µmol photons m−2 s−1, composed of 90% red light and 10% blue light) for at least 30 min to complete photosynthetic induction. Subsequently, we measured the light intensity dependence of photosynthesis by gradually decreasing light intensity from 2000 to 100 µmol photons m−2 s−1. After exposure to each light intensity (2000, 1500, 1000, 600, 400, 200, and 100 µmol photons m−2 s−1) for 3 min, the data for gas exchange and chlorophyll fluorescence were then recorded.
In our study, we utilized the multi-phase flash (MPF) protocol following standard procedures to determine the parameters of chlorophyll fluorescence [24]. The light intensity for measurement was set at 1 µmol m−2 s−1, while the maximum flash intensity reached 8000 µmol m−2 s−1. During the second phase of the MPF, the flash intensity was reduced by 60%, with the three flash phases lasting 0.3 s, 0.7 s, and 0.4 s, respectively. Subsequently, we calculated the effective quantum yield of photochemistry for photosystem II (ΦPSII) and the total electron transport rate through photosystem II (ETR) using the following equations [25,26]:
Φ P S I I = F m F s F m
E T R = Φ P S I I × P P F D × 0.45
where PPFD represents the light intensity and 0.45 represents the proportion of light energy absorbed by leaves allocated to photosystem II.

2.3. Calculation of the Mesophyll Conductance

Mesophyll conductance (gm) was calculated by combining the gas exchange data and chlorophyll fluorescence data with the following equation [27]:
g m = A N C i Г * ( E T R + 8 A N + R d ) / ( E T R 4 A N + R d )
where AN represents the net photosynthetic rate, Ci represents the intercellular CO2 concentration, Г* represents the CO2 compensation point in the absence of mitochondrial respiration, and a typical value of 40 μmol mol−1 is used [9]; Rd represents the dark respiration rate measured at night.
The chloroplast CO2 concentration (Cc) was calculated as follows [28]:
C c = C i A N g m
The maximum carboxylation rate of Rubisco (Vcmax) was calculated as follows [18,29]:
V c m a x = ( A N + R d ) ( C c + K c ( 1 + O / K o ) ) ( C c Г * )
where Kc (404 μmol mol−1) and Ko (278 mmol mol−1) are the Rubisco Michaelis–Menten constants for CO2 and oxygen, respectively; O (210 mmol mol−1) is the oxygen concentration in the chloroplasts.

2.4. Quantitative Calculation of Photosynthetic Limitation

The quantitative calculation formula for the photosynthetic limiting factor is as follows [15]:
L s = g t o t / g s × A N / C c g t o t + A N / C c
L m = g t o t / g m × A N / C c g t o t + A N / C c
L b = g t o t g t o t + A N / C c
where Ls, Lm, and Lb represent the degree of limitation of photosynthesis by gs, gm, and biochemical capacity, respectively, and gtot represents the overall CO2 diffusive conductance, with gtot and ∂AN/∂Cc being calculated as follows, respectively:
g t o t = g s × g m g s + g m
A N / C c = V c m a x Г * + K c ( 1 + O / K o ) ( C c + K c ( 1 + O / K o ) ) 2

2.5. Calculation of Electron Flow for Photorespiration

The rate of electron flow for photorespiration (JO) was calculated according to the following equation [30]:
J O = 2 / 3 × ( E T R 4 × ( A N + R d ) )

2.6. Statistical Analysis

Six independent leaves from six different plants were used for each species. The software SigmaPlot 10.0 was used for graphing and fitting.

3. Results

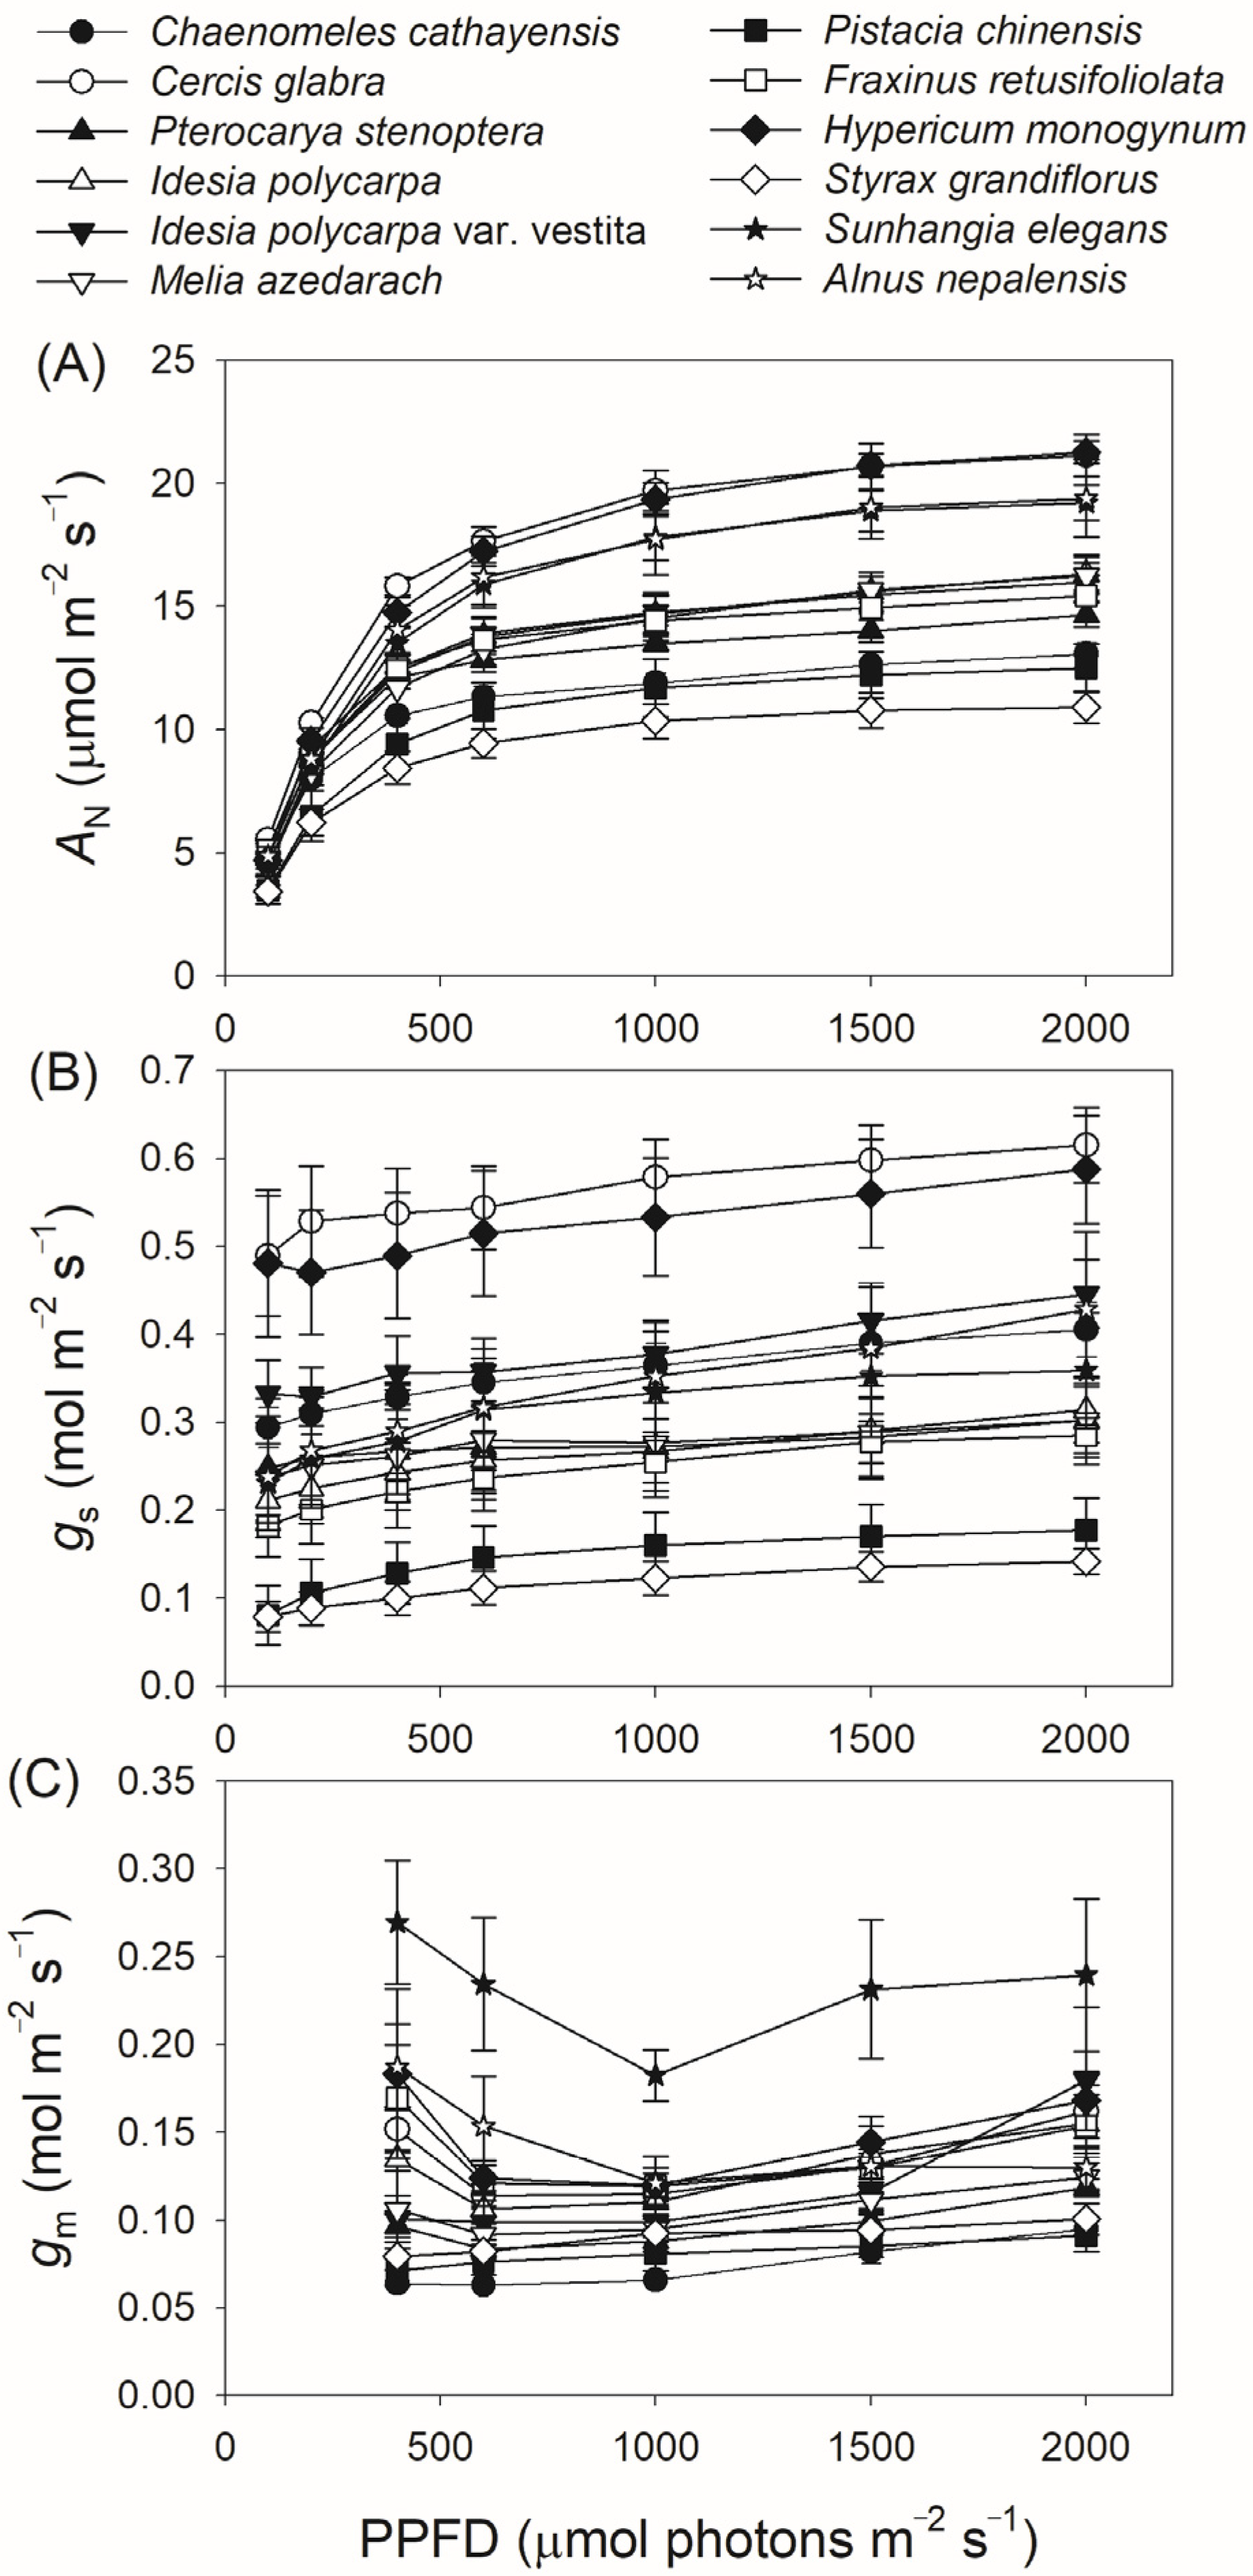
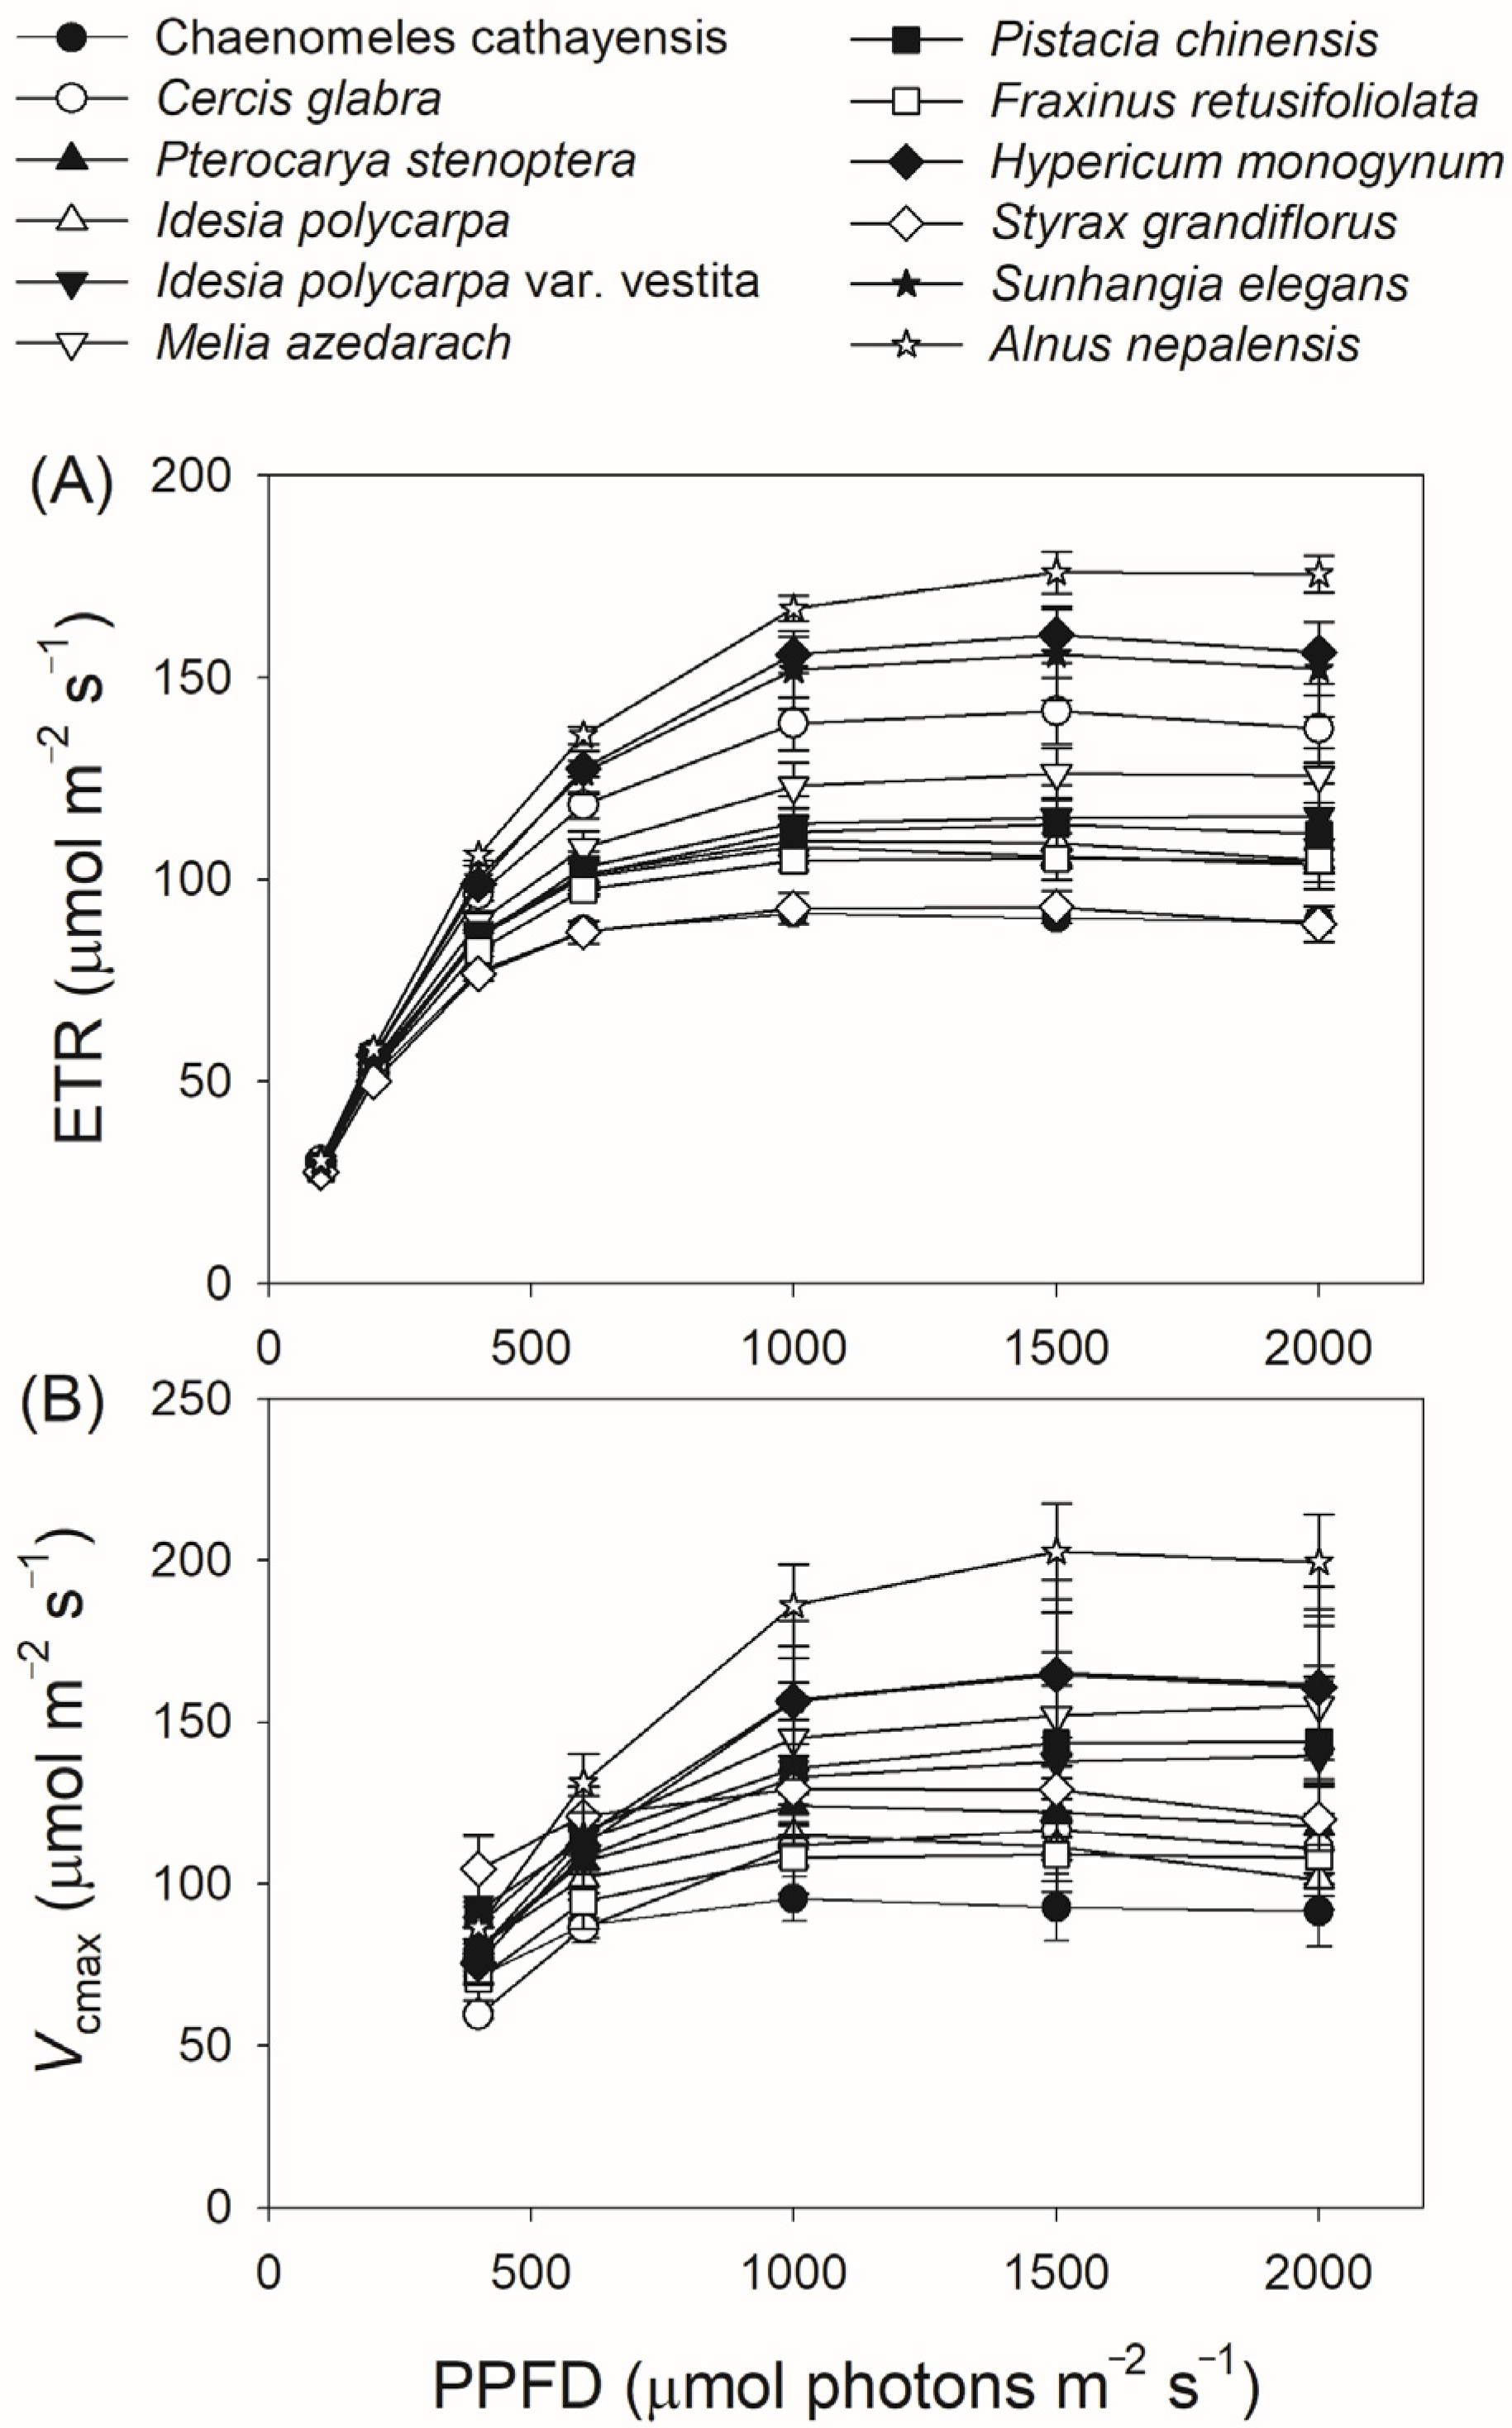
3.1. The Steady-State Photosynthesis at Saturating Light

We first measured steady-state photosynthesis at a saturating light intensity of 2000 μmol photons m−2 s−1. As shown in Table 1, the net CO2 assimilation rate (AN) ranged from 10.9 ± 0.66 to 21.3 ± 0.45 μmol m−2 s−1, stomatal conductance (gs) ranged from 0.14 ± 0.01 to 0.62 ± 0.04 mol m−2 s−1, mesophyll conductance (gm) ranged from 0.09 ± 0.01 to 0.24 ± 0.04 mol m−2 s−1, electron transport rate (ETR) ranged from 89.6 ± 2.8 to 175 ± 4.6 μmol m−2 s−1, and the maximum velocity of Rubisco carboxylation (Vcmax) ranged from 91.5 ± 11 to 199 ± 15 μmol m−2 s−1. These results indicated that photosynthetic capacity varied substantially among the studied tree species.

3.2. Light Intensity Dependence of Photosynthetic Parameters

We next measured gas exchange and chlorophyll fluorescence under light conditions ranging from 100 to 2000 μmol photons m−2 s−1. As shown in Figure 1A, AN increased rapidly with increasing light intensity from 100 to 400 μmol photons m−2 s−1, but increased by an average of 18% when light intensity increased from 600 to 2000 μmol photons m−2 s−1. At a high light intensity of 1500 μmol photons m−2 s−1, AN was almost saturated in all twelve tree species. Concomitantly, gs displayed a slight increase throughout the entire light response curve in all studied species (Figure 1B), while gm increased by an average of 32% with increasing light intensity from 600 to 2000 μmol photons m−2 s−1 (Figure 1C). For all studied species, ETR increased rapidly as light intensity increased from 100 to 600 μmol photons m−2 s−1. During the light course from 600 to 1000 μmol photons m m−2 s−1, ETR increased by an average of 12% (Figure 2A). In the twelve studied tree species, ETR was approximately saturated at a high light intensity of 1000 μmol photons m−2 s−1 (Figure 2A). Similar to the light response trend of ETR, Vcmax gradually increased with light intensity increasing from 400 to 1000 μmol photons m−2 s−1, and was almost saturated at 1000 μmol photons m−2 s−1 in these studied species (Figure 2B). Across the light intensity range from 400 to 2000 μmol photons m−2 s−1, the variation in AN was tightly correlated with the variations in gs (R2 = 0.66, p < 0.0001, Figure 3A), gm (R2 = 0.47, p < 0.0001, Figure 3B), Vcmax (R2 = 0.26, p < 0.0001, Figure 3C), and ETR (R2 = 0.76, p < 0.0001, Figure 3D). These results suggest that variation in AN among these tree species is related to variations in gs, gm, Vcmax, and ETR.

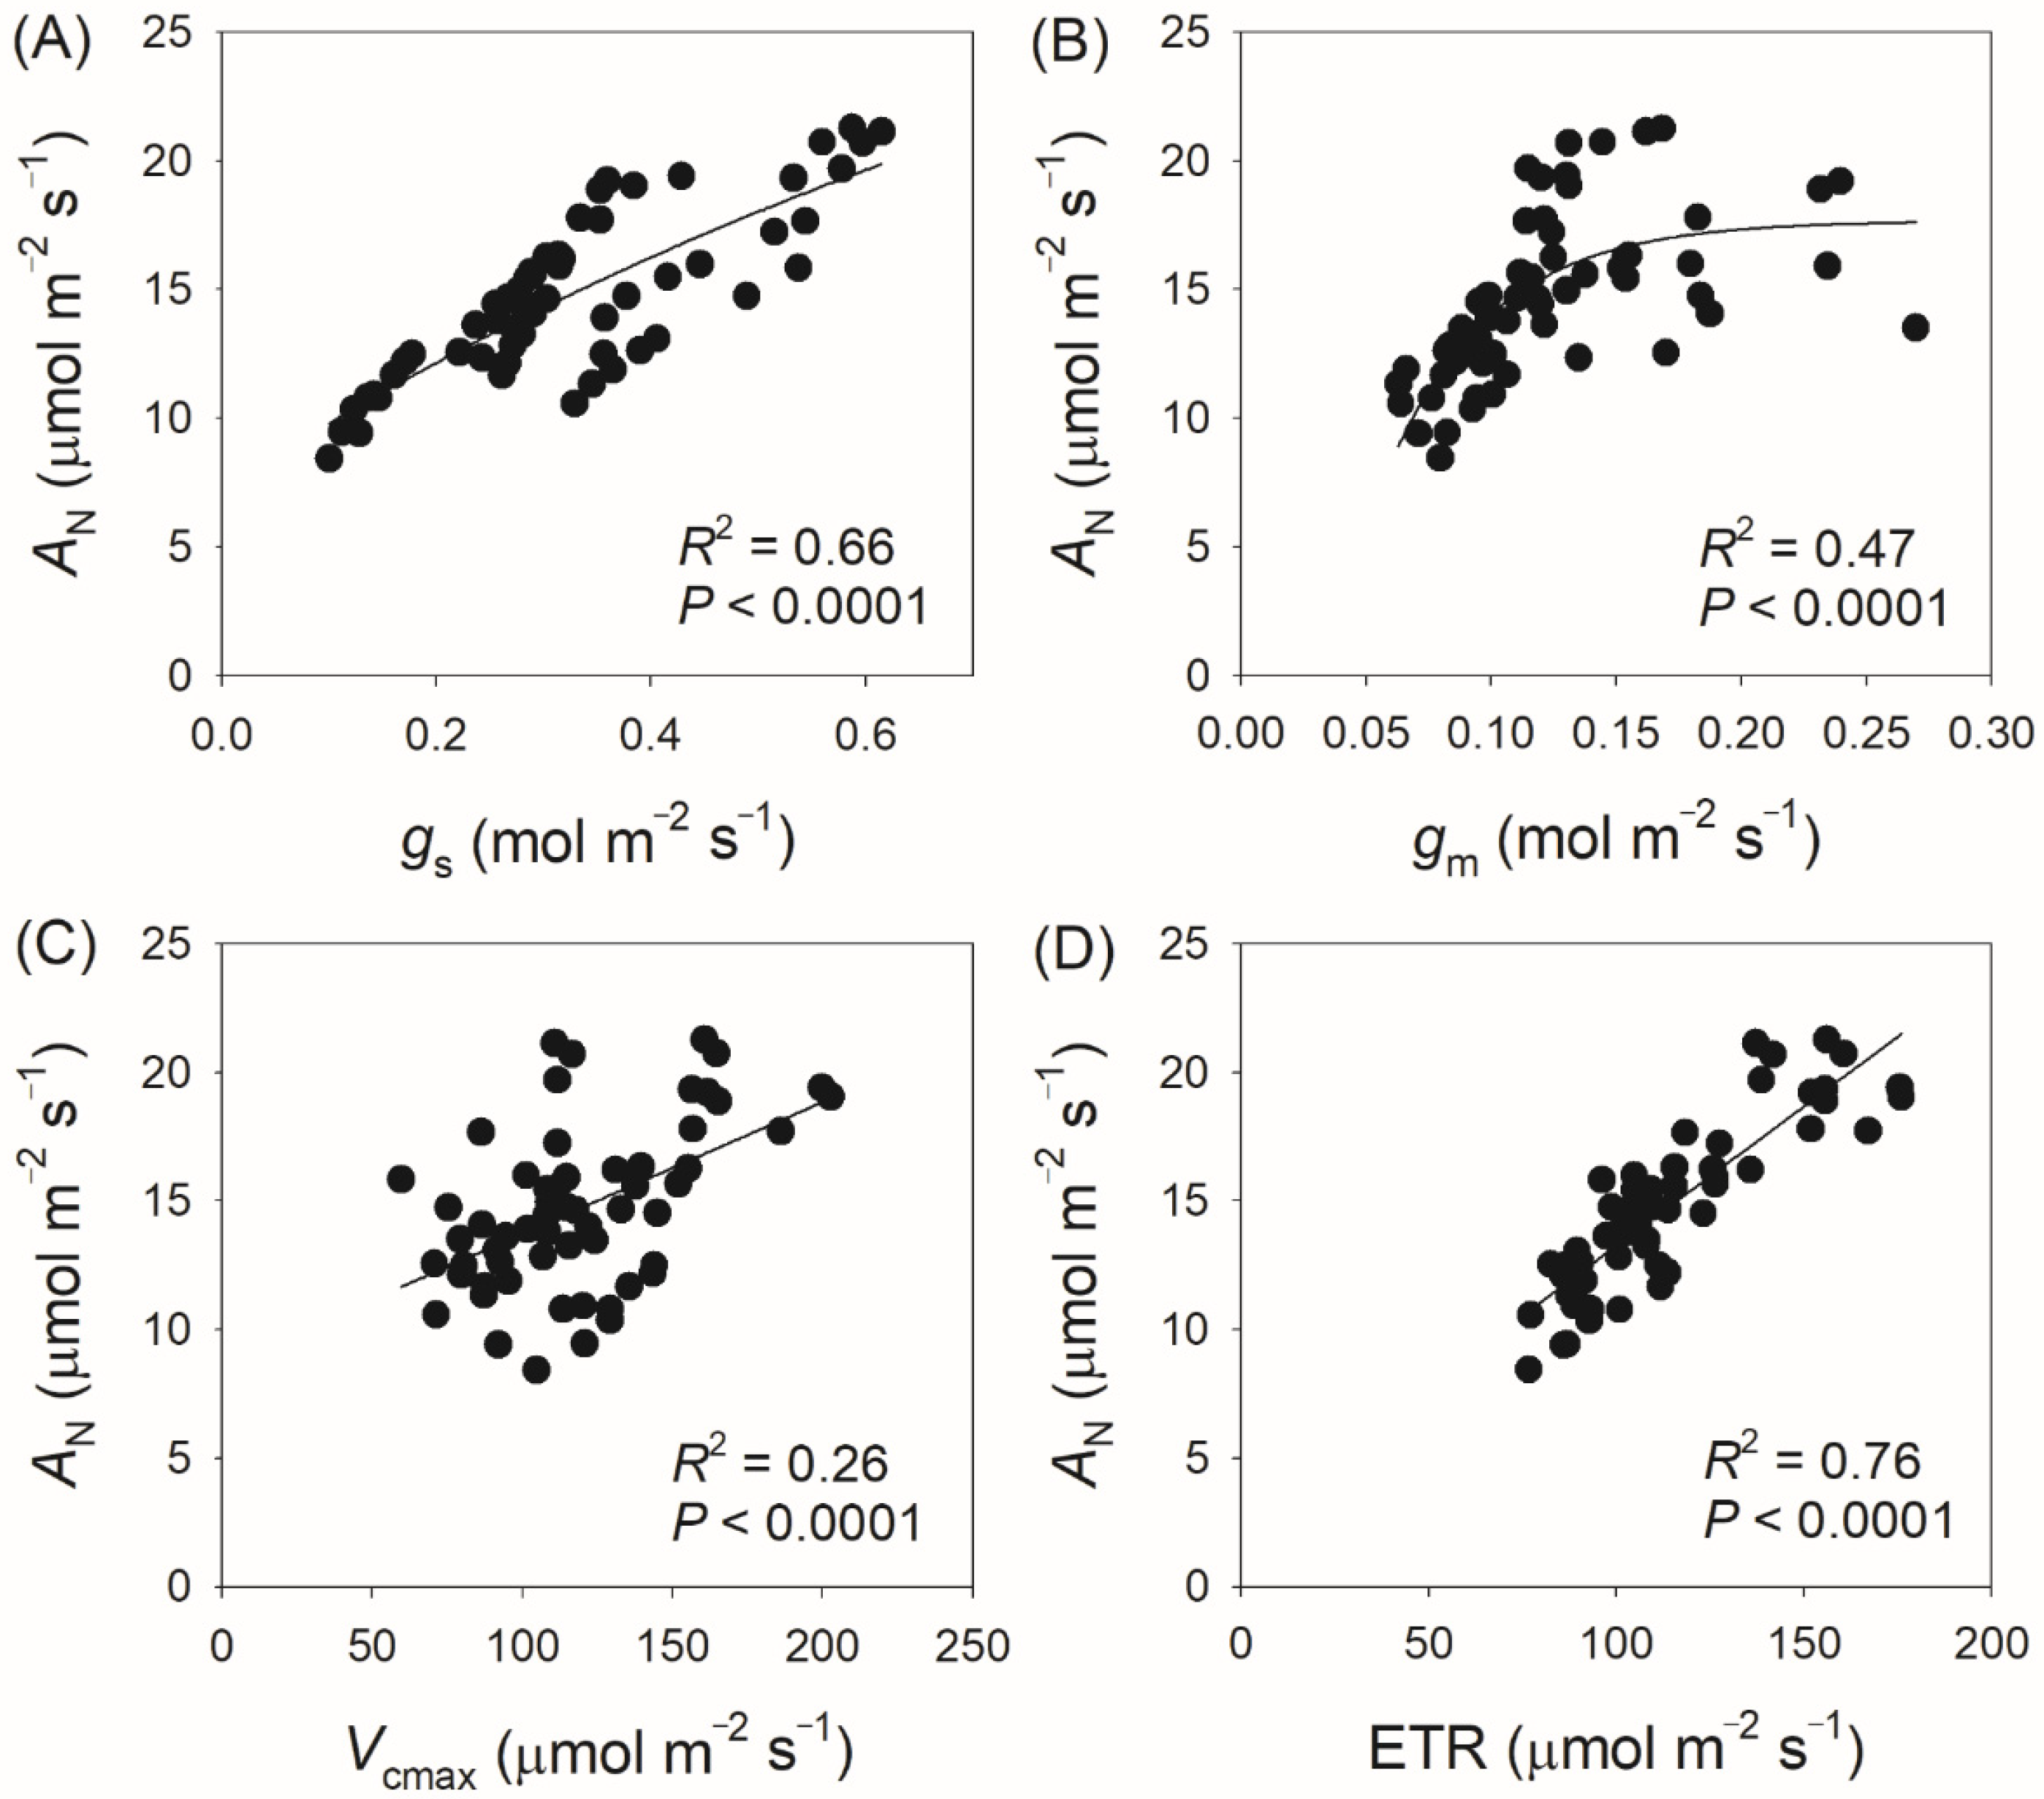
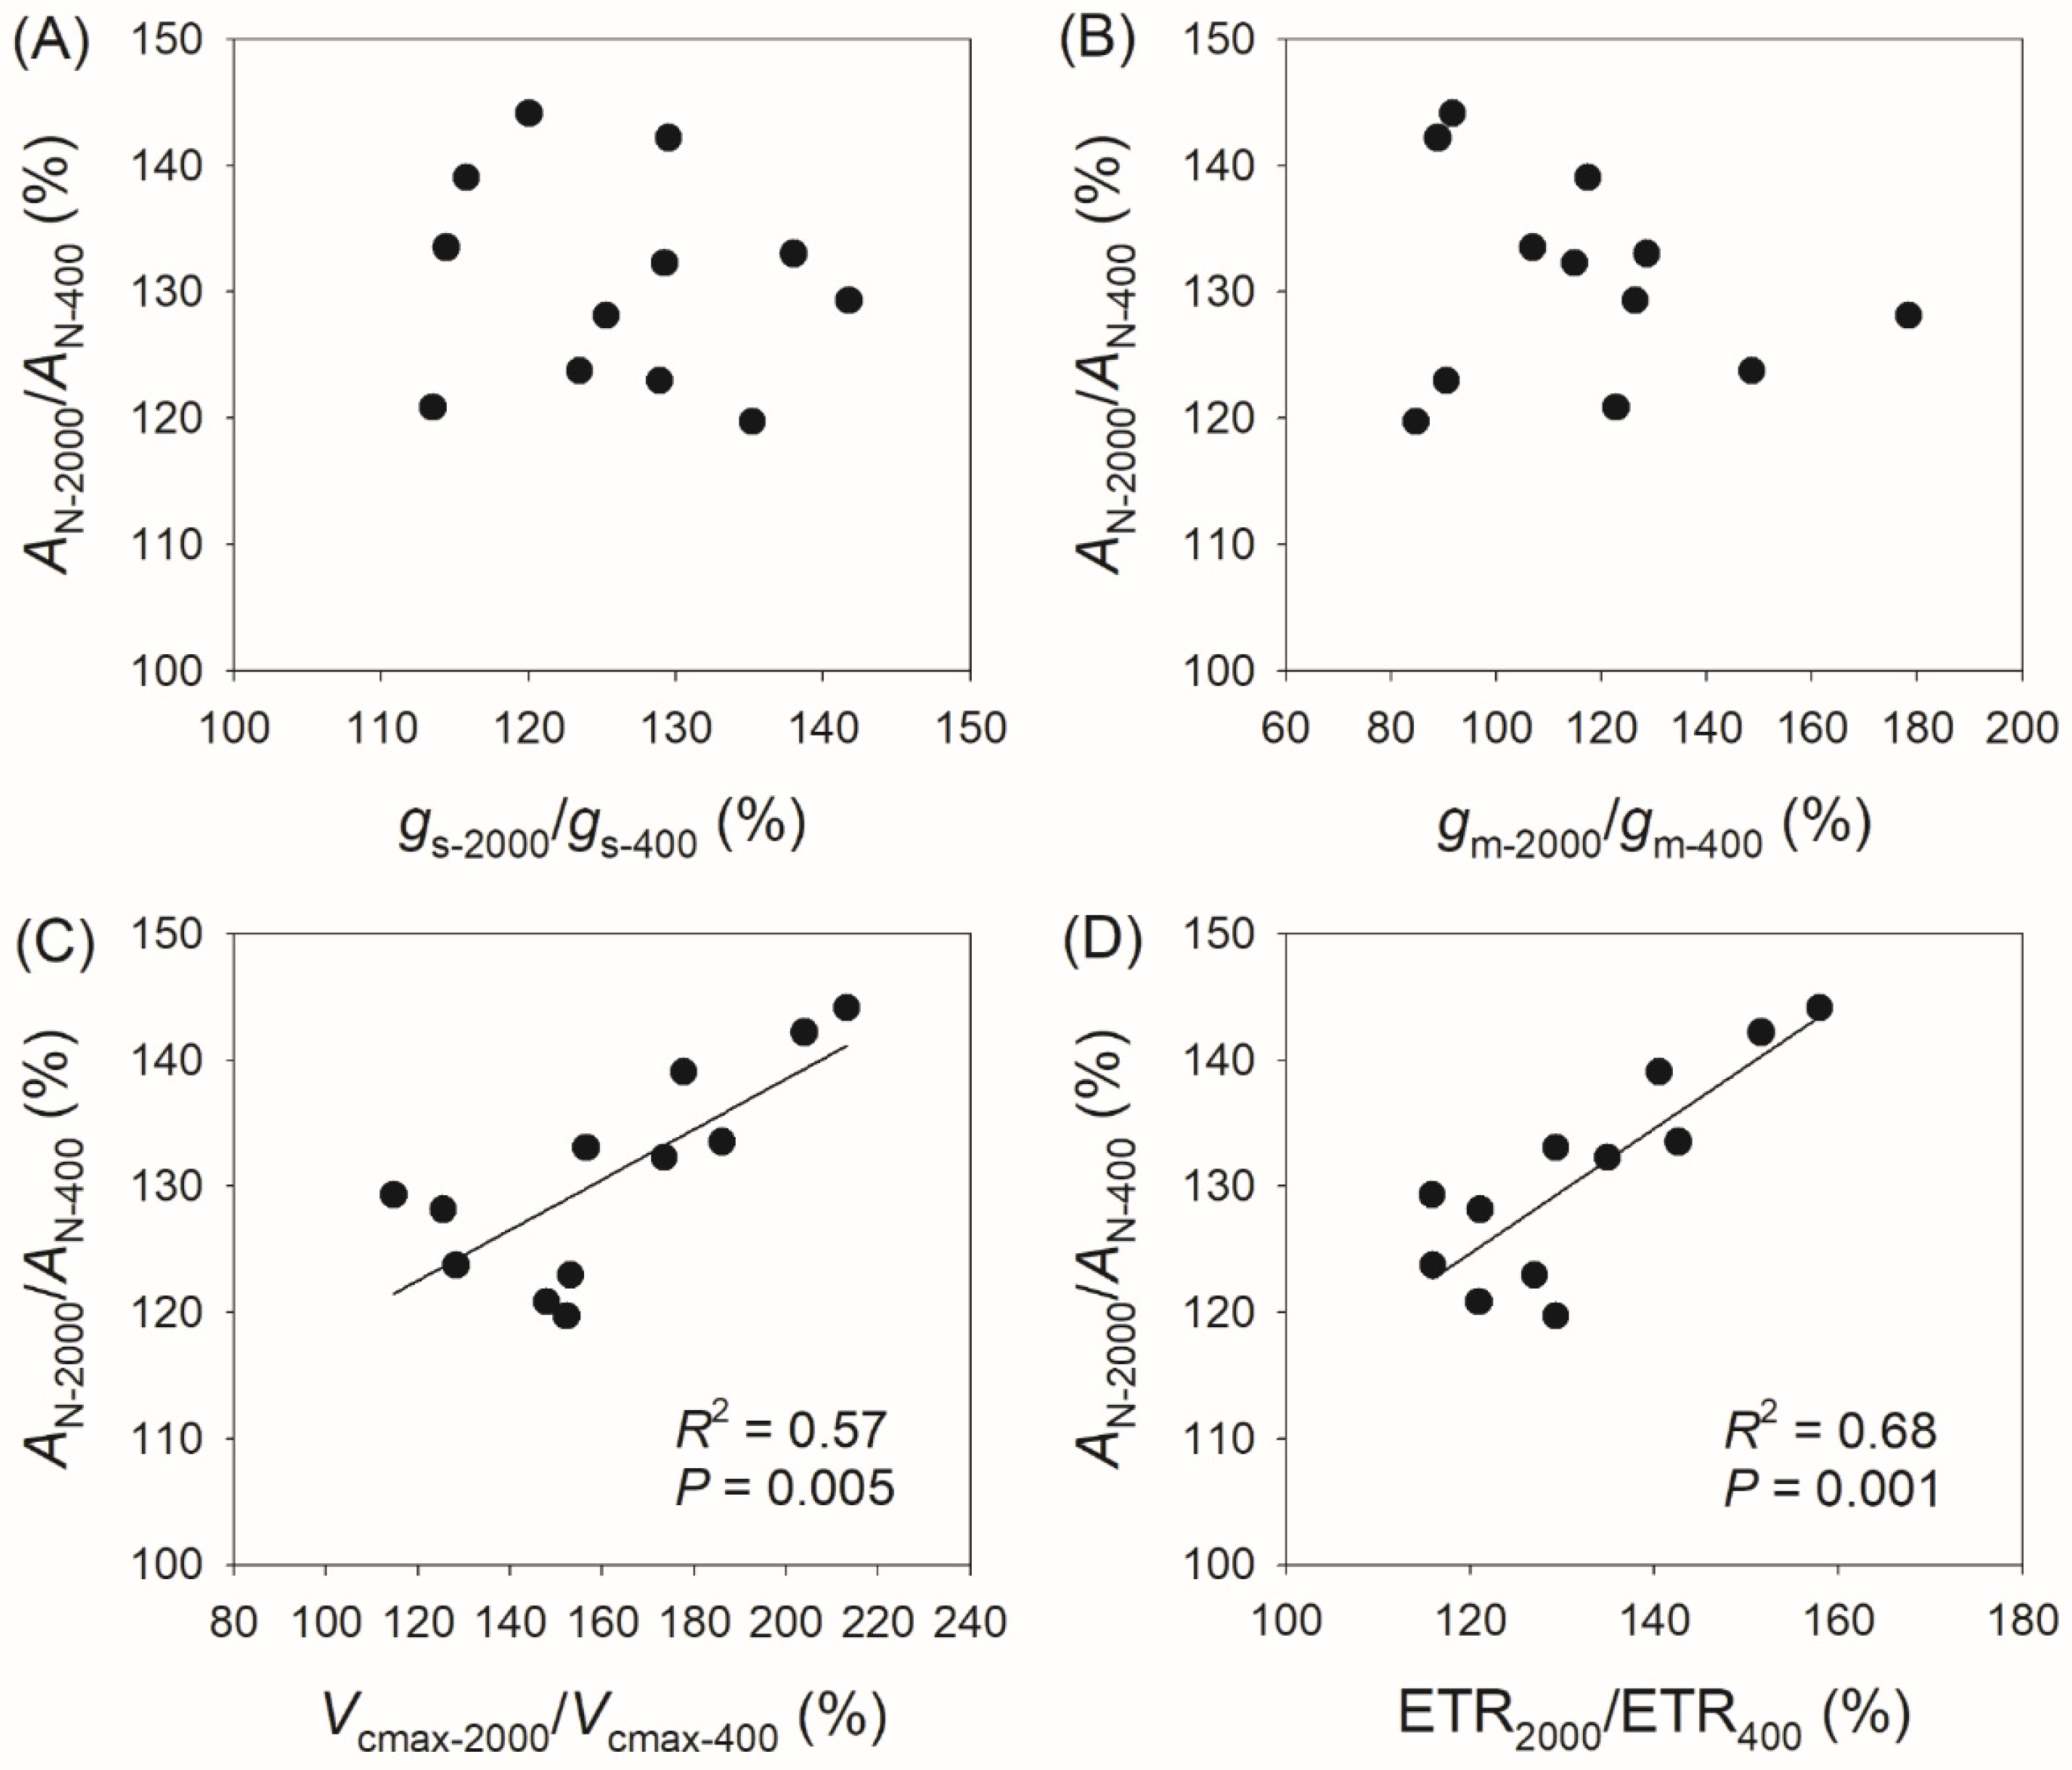
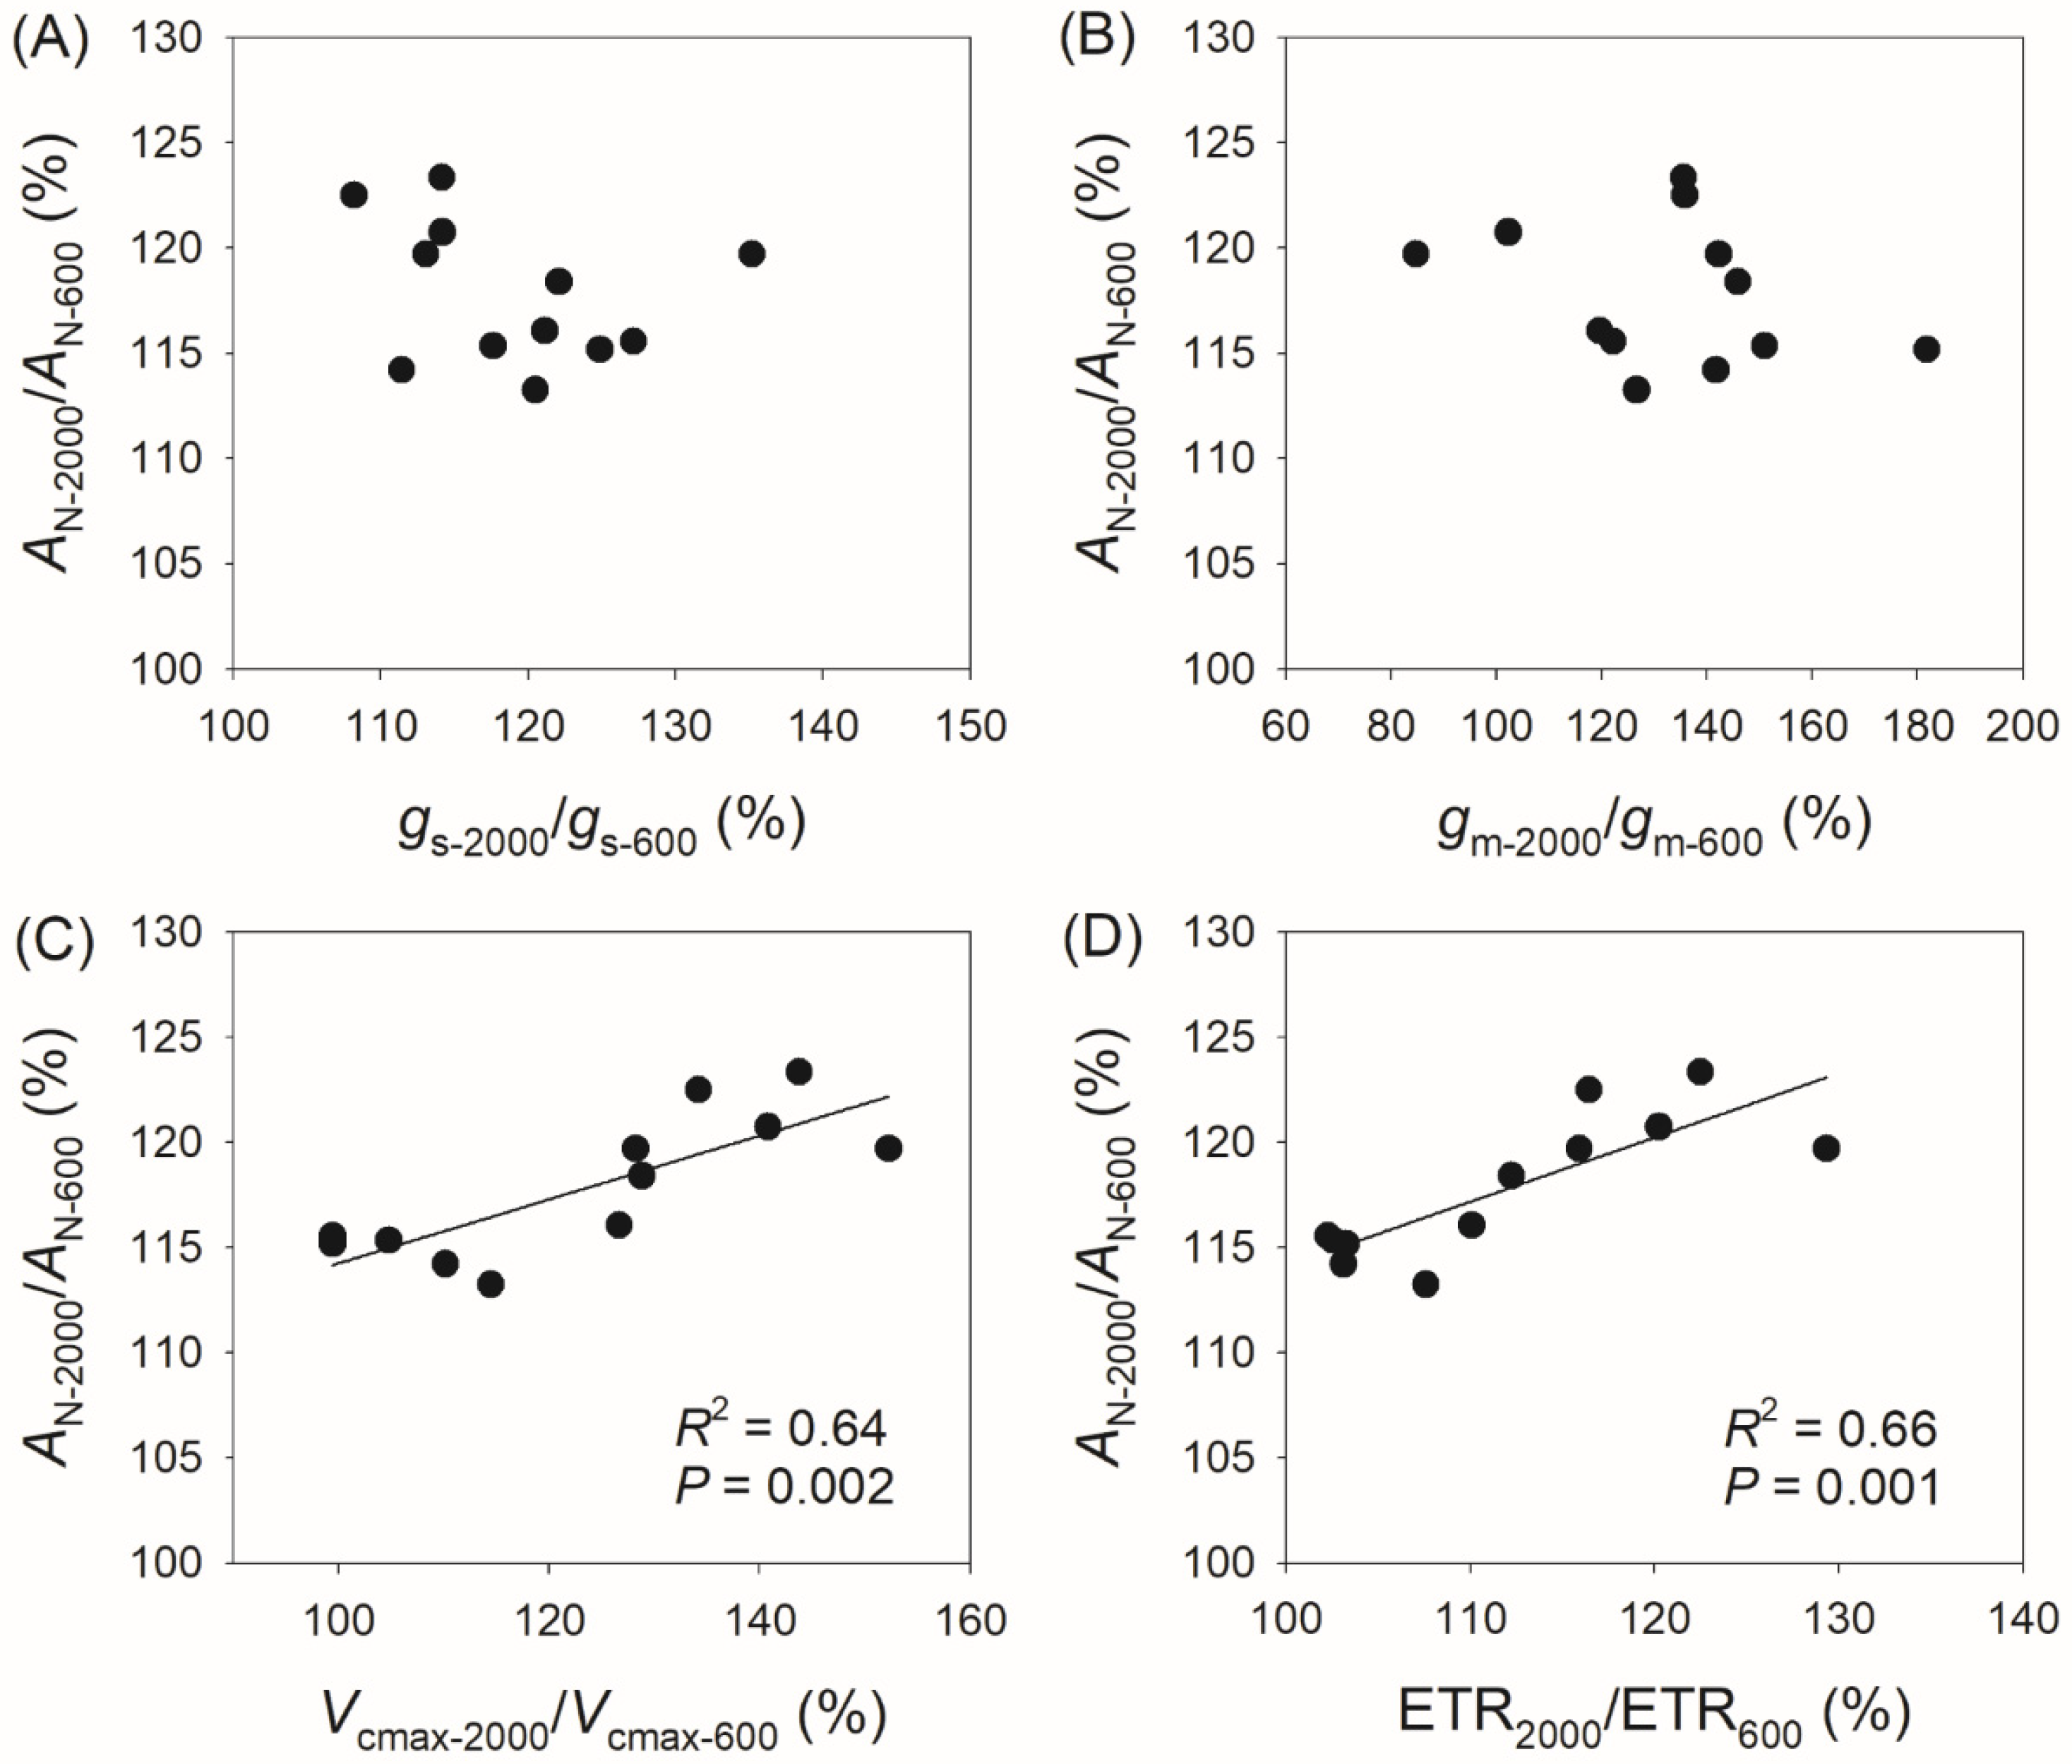
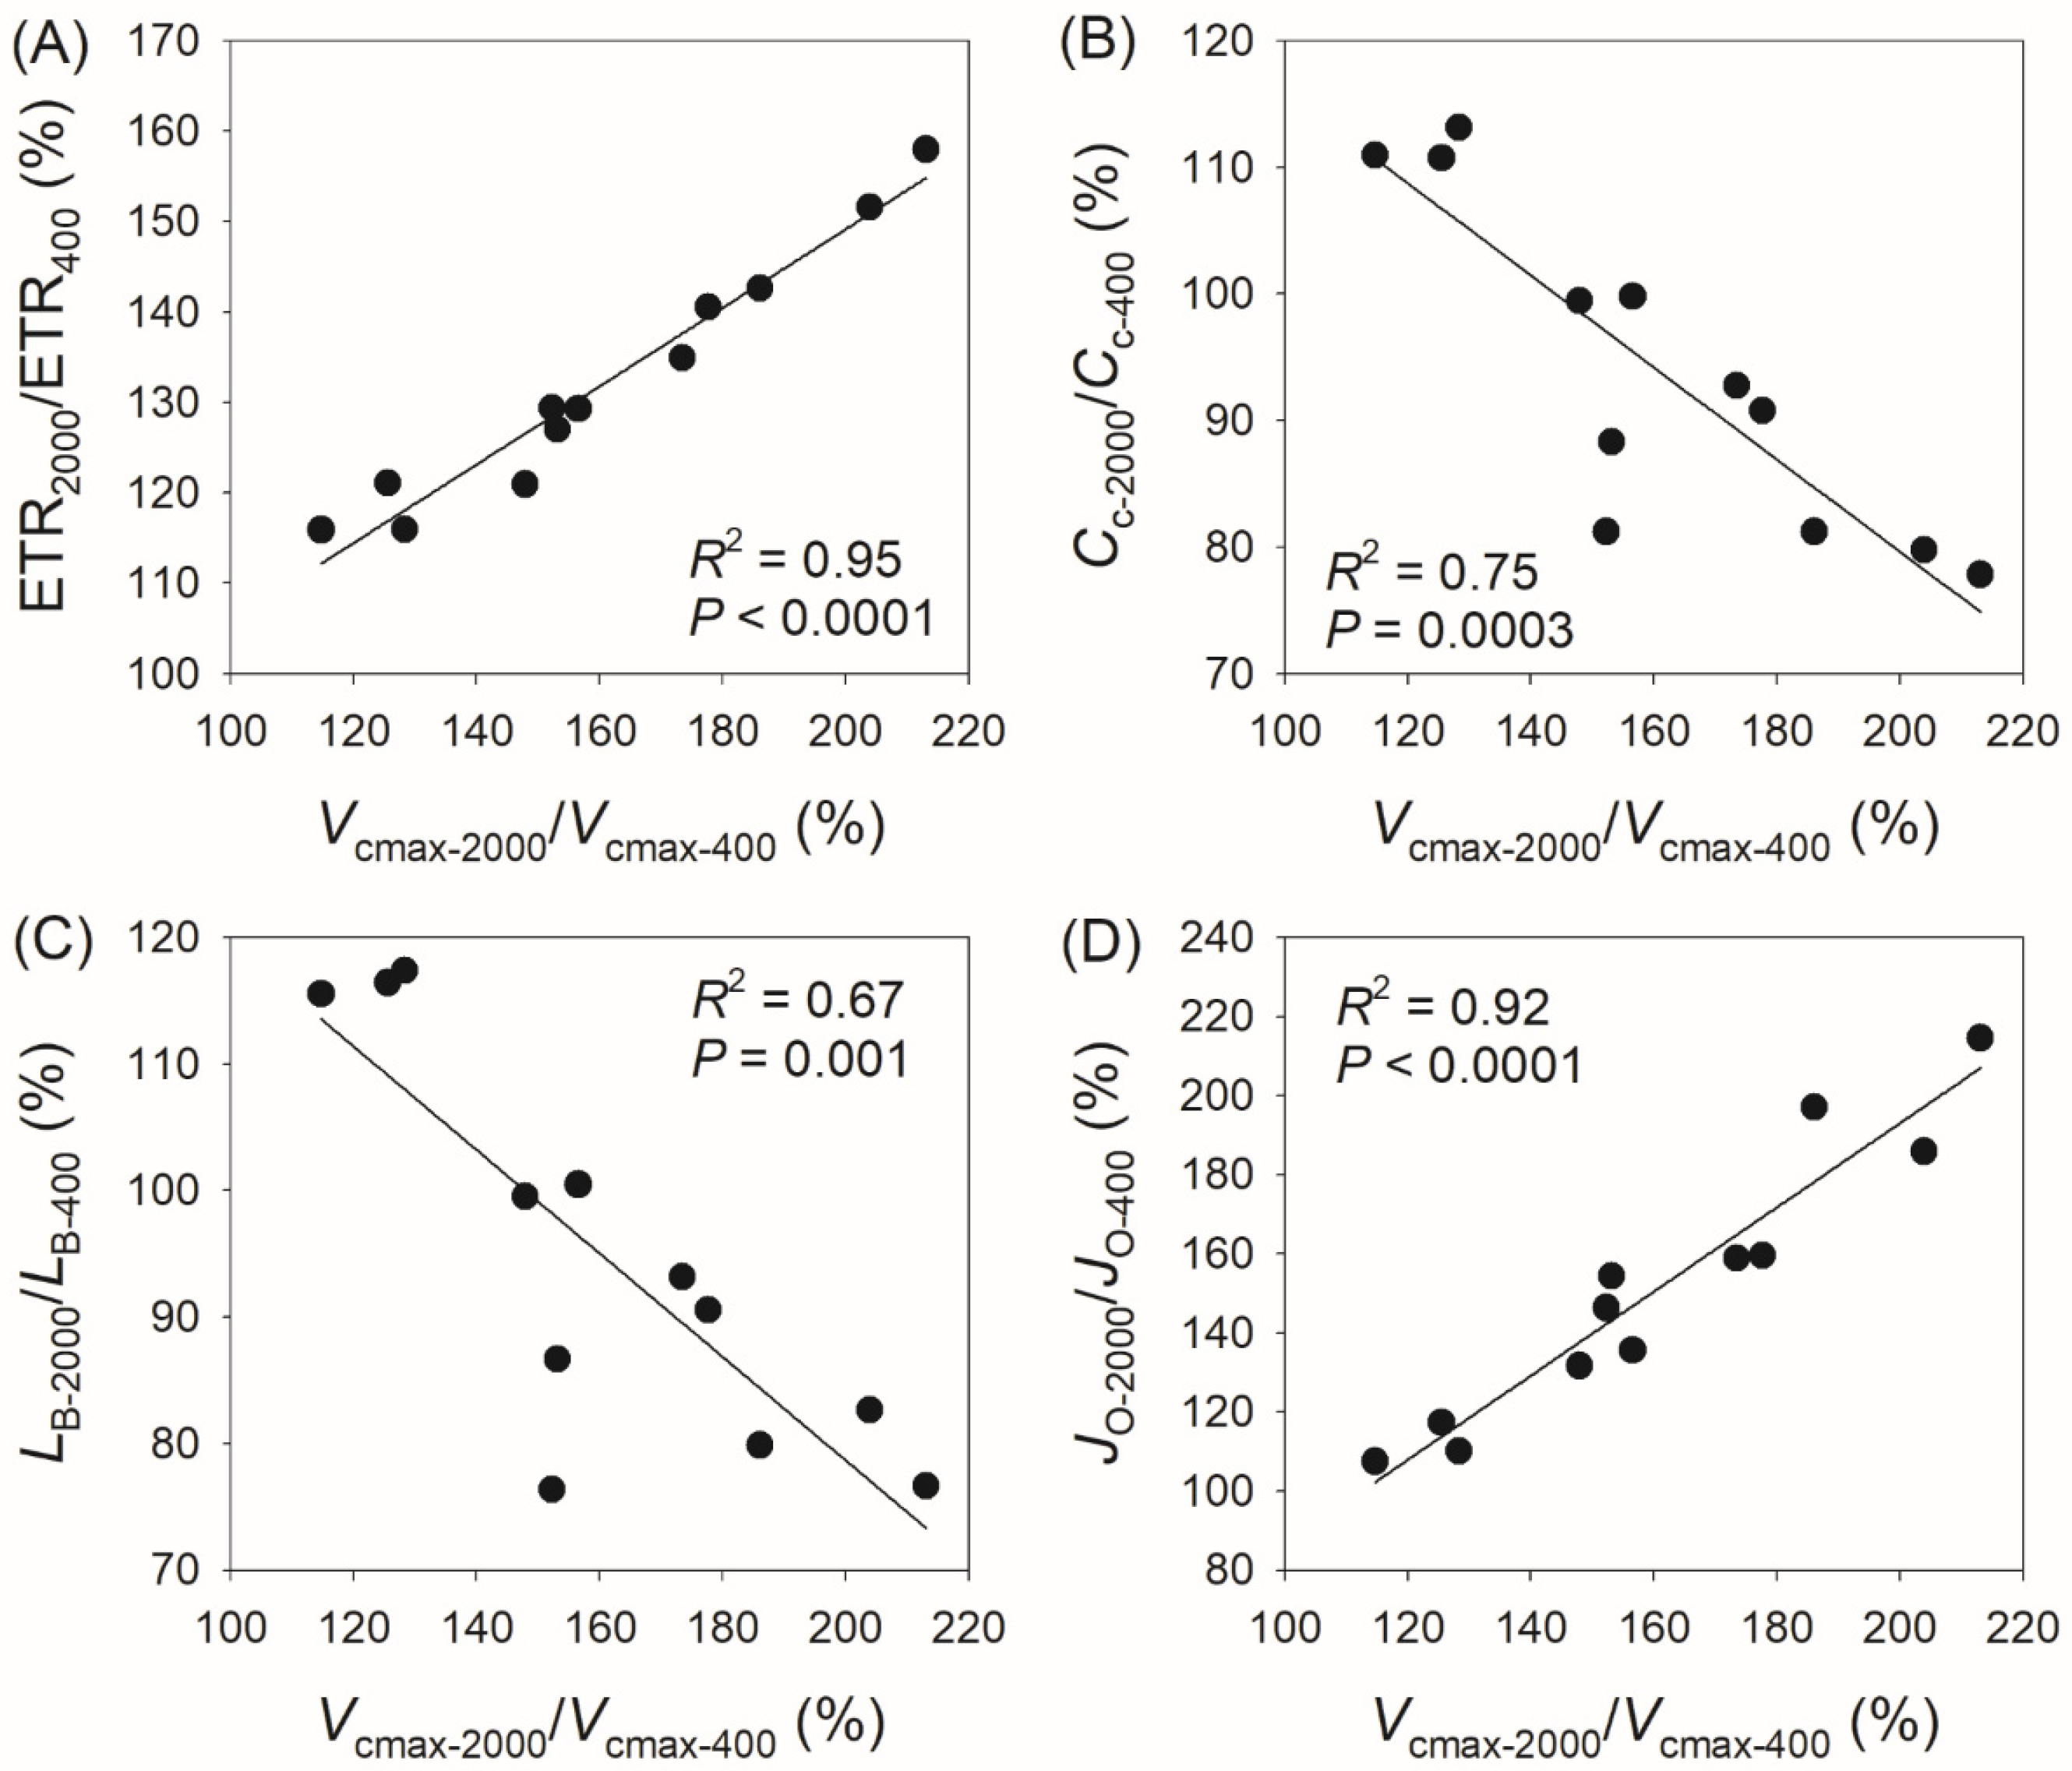
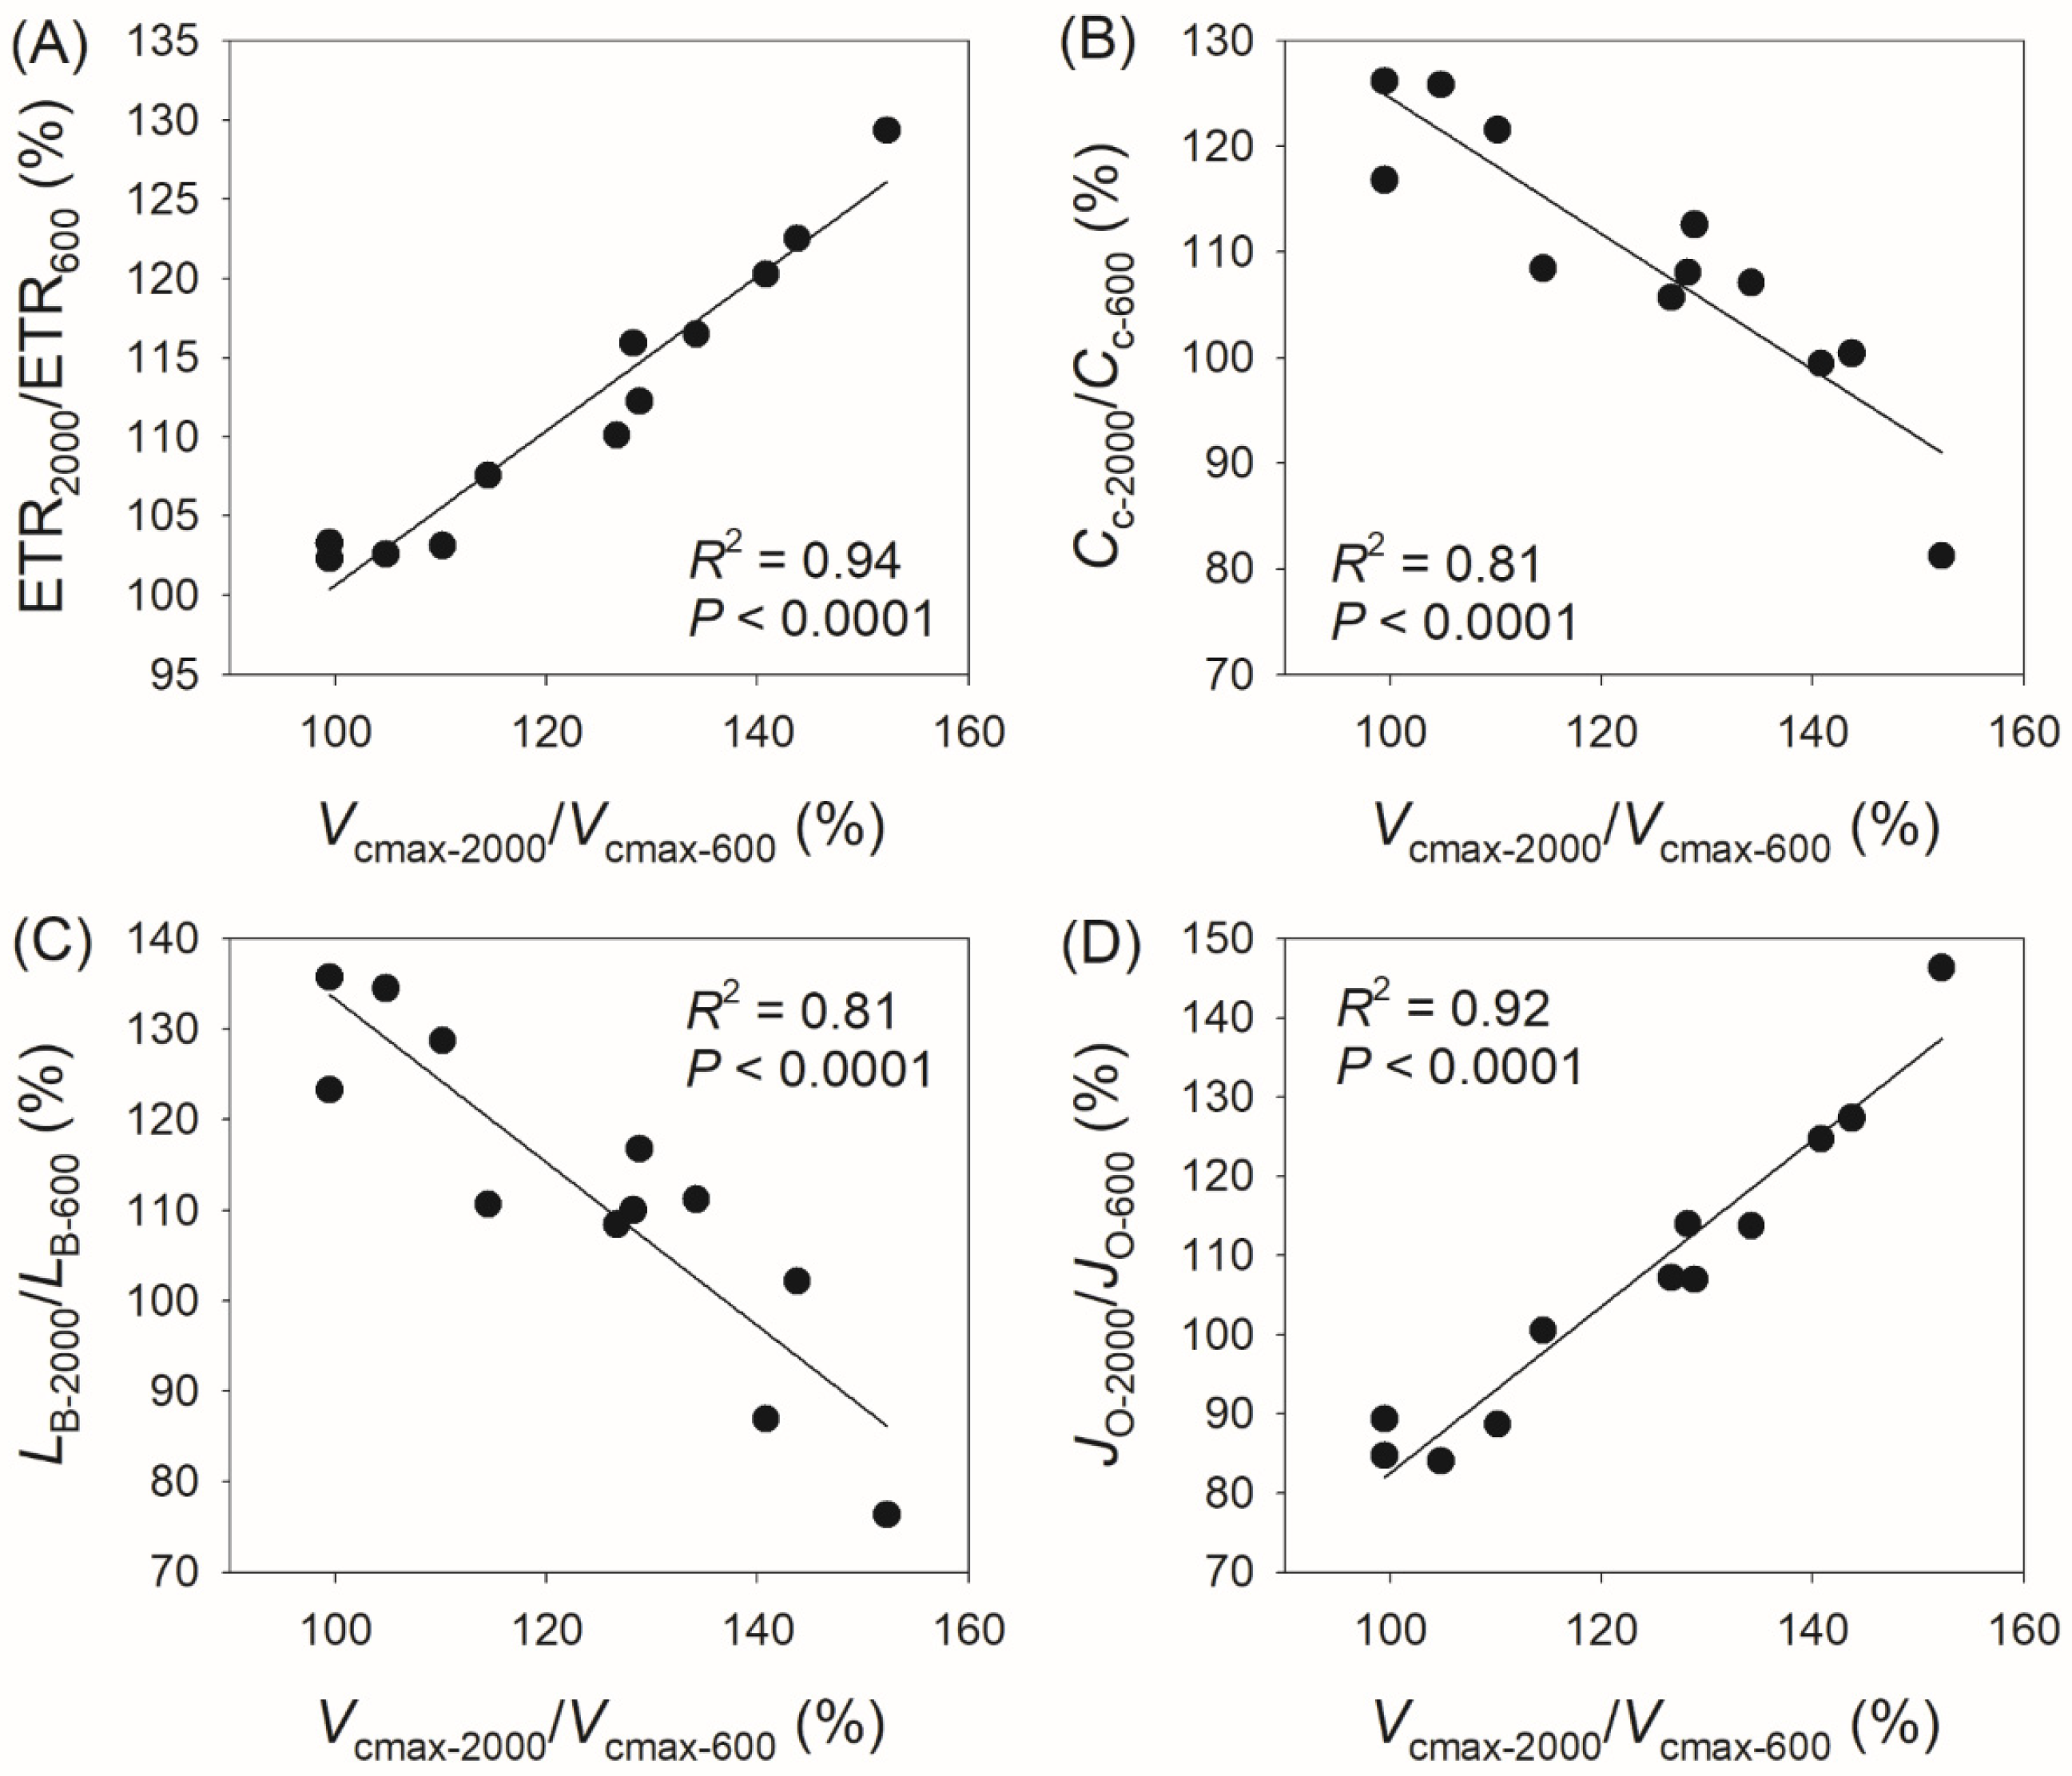
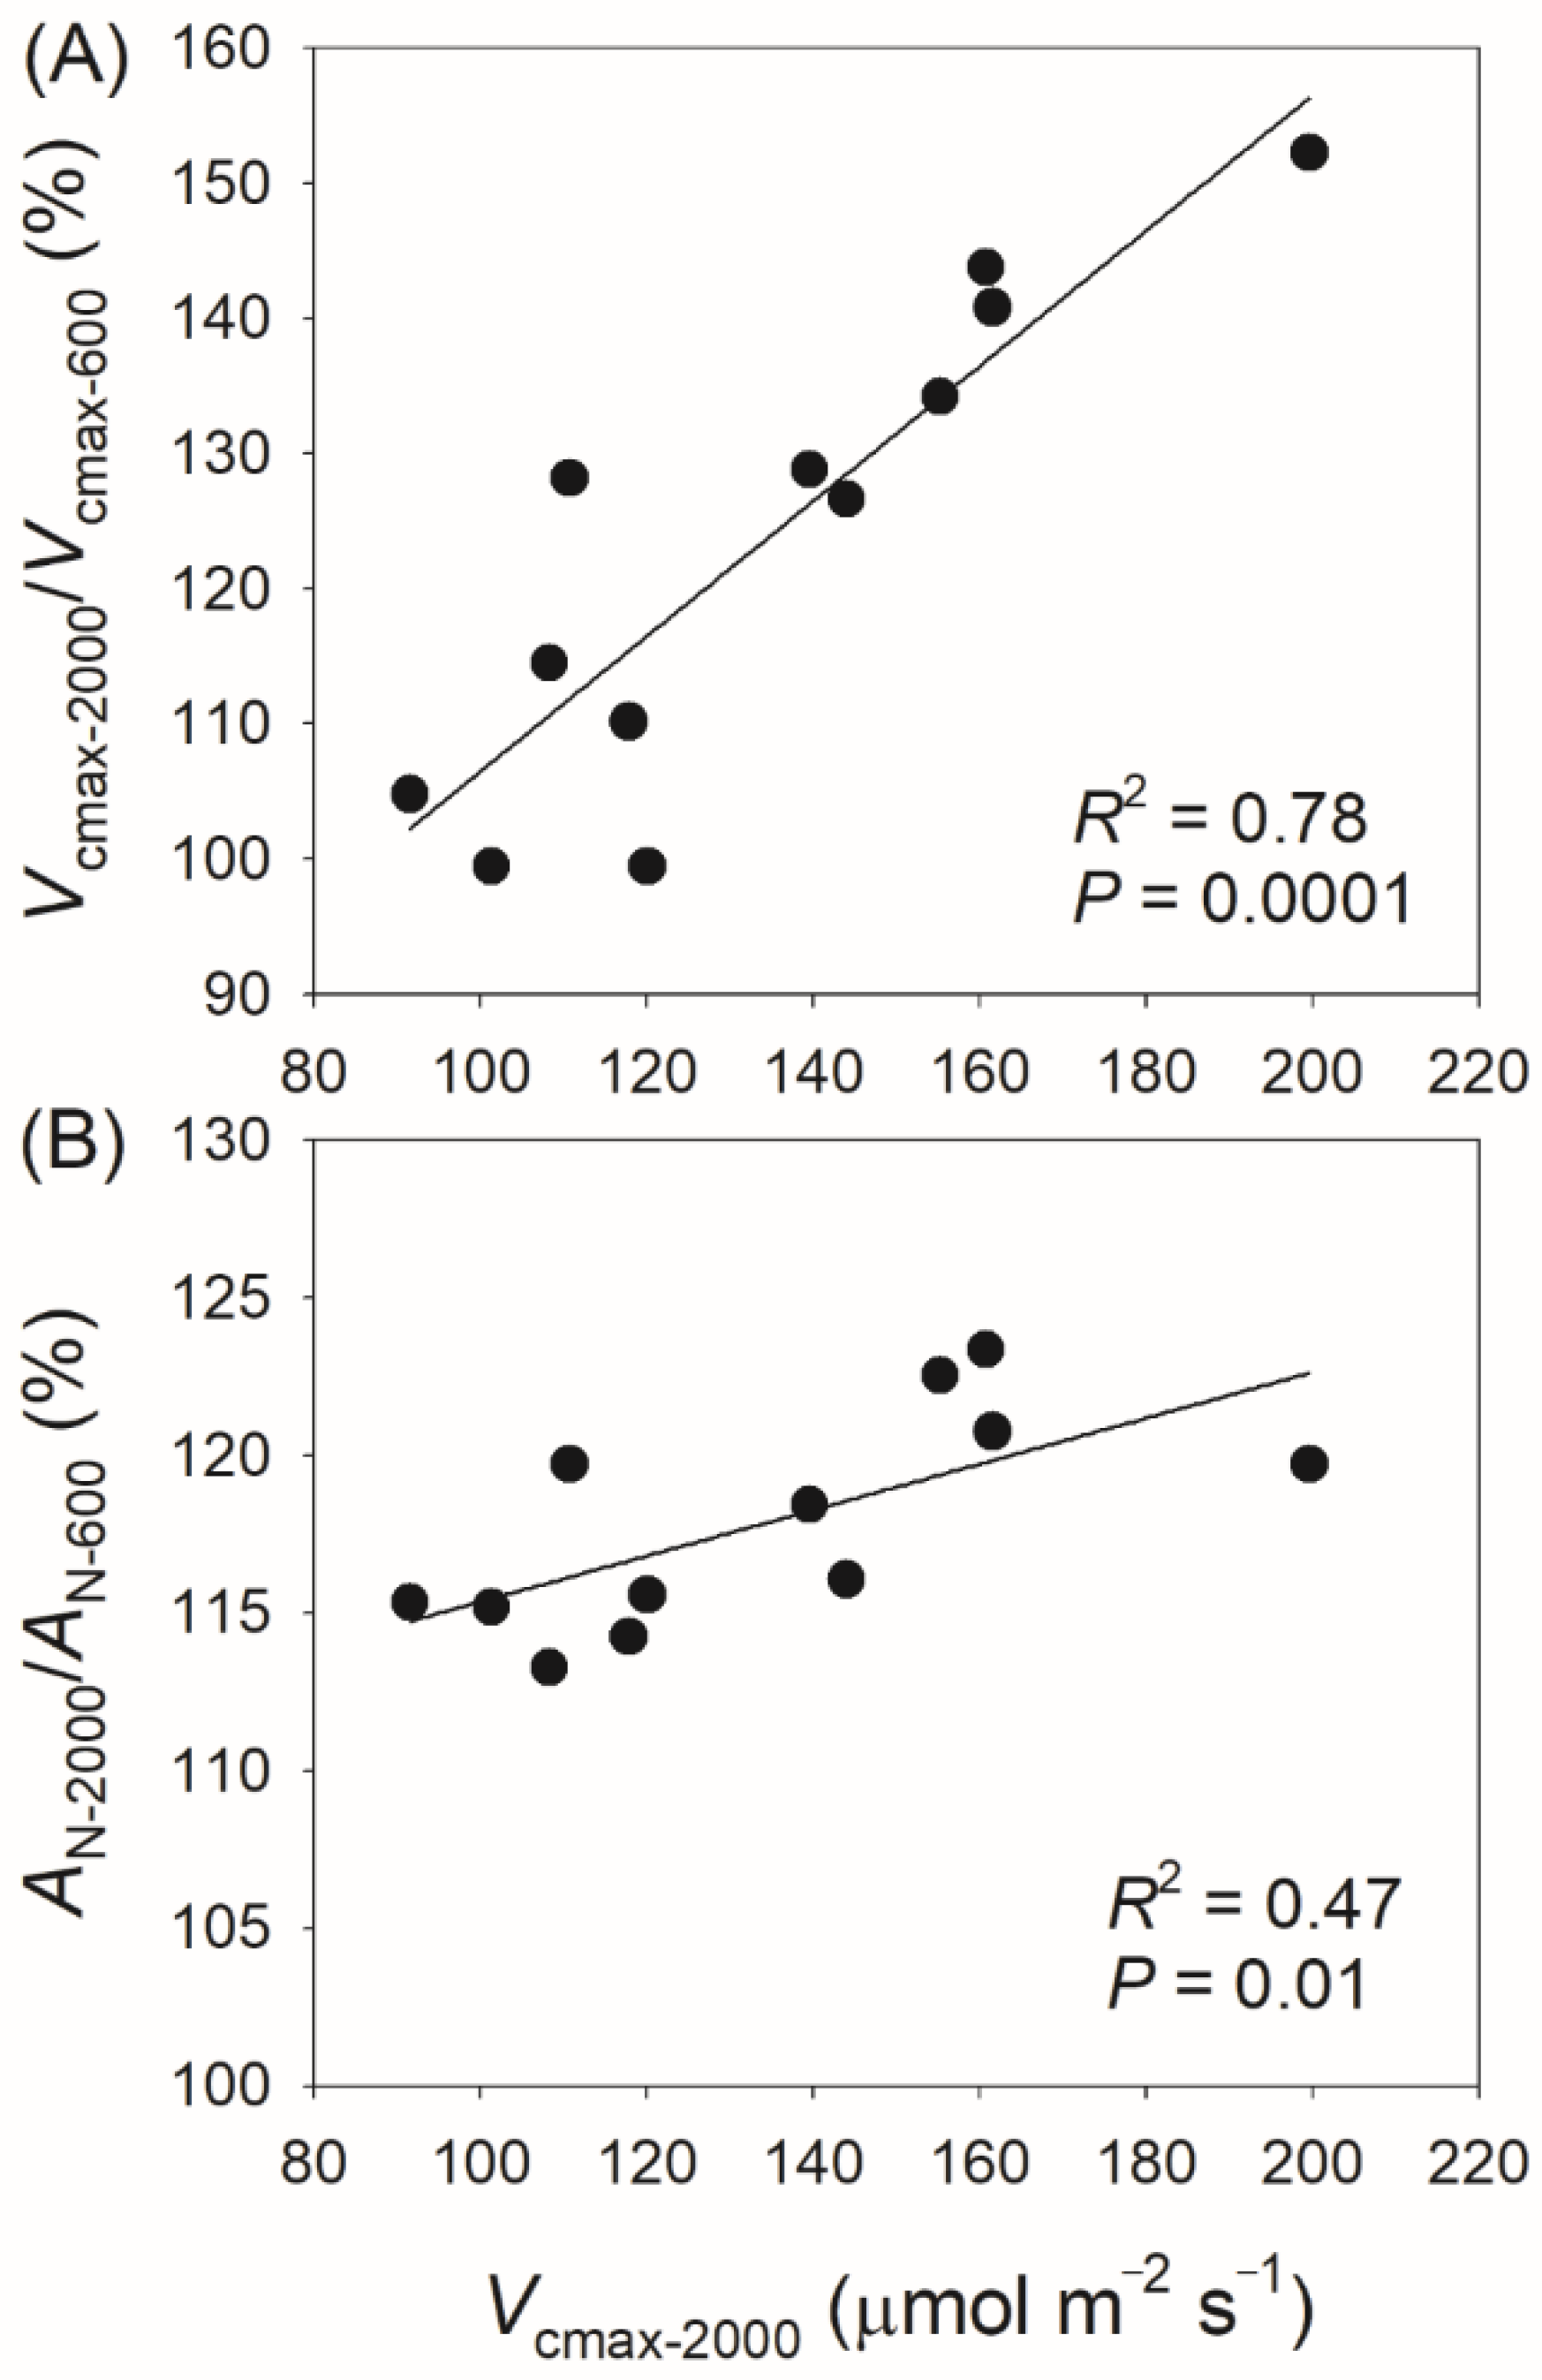
3.3. Correlation Between Physiological Parameters and CO2 Assimilation Rate

Compared with AN at 400 μmol photons m−2 s−1 (AN-400), AN at 2000 μmol photons m−2 s−1 (AN-2000) reached 120–144% in the studied species, with gs reaching 114–142%, gm reaching 85–178%, Vcmax reaching 115–213%, and ETR reaching 116–158% (Figure 4). The variation in AN-2000/AN-400 was not significantly correlated with gs-2000/gs-400 (Figure 4A) or gm-2000/gm-400 (Figure 4B), but was significantly correlated with Vcmax-2000/Vcmax-400 (R2 = 0.57, p = 0.005, Figure 4C) and ETR2000/ETR400 (R2 = 0.68, p = 0.001, Figure 4D). Similarly, the variation in AN-2000/AN-600 was not significantly correlated with gs-2000/gs-600 (Figure 5A) or gm-2000/gm-600 (Figure 5B), but was significantly correlated with Vcmax-2000/Vcmax-600 (R2 = 0.64, p = 0.002, Figure 5C) and ETR2000/ETR600 (R2 = 0.66, p = 0.001, Figure 5D). Therefore, the relative increase in AN at 2000 μmol photons m−2 s−1 compared with that at 400 and 600 μmol photons m−2 s−1 is mainly determined by the light intensity dependence of Vcmax and ETR rather than gs and gm.
In addition, we found a positive correlation between Vcmax-2000/Vcmax-400 and ETR2000/ETR400 (R2 = 0.95, p < 0.0001, Figure 6A), a negative correlation between Vcmax-2000/Vcmax-400 and Cc-2000/Cc-400 (R2 = 0.75, p = 0.0003, Figure 6B), a negative correlation between Vcmax-2000/Vcmax-400 and Lb-2000/Lb-400 (R2 = 0.67, p = 0.001, Figure 6C), and a positive correlation between Vcmax-2000/Vcmax-400 and JO-2000/JO-400 (R2 = 0.95, p < 0.0001, Figure 6D). Similarly, we observed a positive correlation between Vcmax-2000/Vcmax-600 and ETR2000/ETR600 (R2 = 0.94, p < 0.0001, Figure 7A), a negative correlation between Vcmax-2000/Vcmax-600 and Cc-2000/Cc-600 (R2 = 0.81, p < 0.0001, Figure 7B), a negative correlation between Vcmax-2000/Vcmax-600 and Lb-2000/Lb-600 (R2 = 0.81, p < 0.0001, Figure 7C), and a positive correlation between Vcmax-2000/Vcmax-600 and JO-2000/JO-600 (R2 = 0.92, p < 0.0001, Figure 7D). These results indicate that the coordinated changes in Vcmax and ETR compensate for the decrease in Cc and the increase in JO and diminish the biochemical limitation of AN.

4. Discussion

The light intensity dependence of photosynthesis varies widely among different plants and is tightly related to plant growth and crop yield [11]. According to the C3 photosynthesis model, the CO2 assimilation rate (AN) at a given incident light intensity can be limited by light energy (as indicated by ETR), diffusional CO2 conductance (gs and gm), and Vcmax [18]. With increasing illumination from sub-saturating to saturating light, angiosperms typically display gradual increases in ETR and gs, and gm remains stable in some species but gradually increases in others [8,9,21,22]. However, the major factor affecting the light intensity dependence of AN remains unclear.
In this study, we found that light intensity dependence of AN, Vcmax, and ETR varied among the twelve studied tree species (Figure 1 and Figure 2). Furthermore, the increase in AN from sub-saturating to saturating light among the twelve studied tree species was tightly related to changes in Vcmax and ETR, with no significant correlation to changes in gs and gm (Figure 4 and Figure 5). Therefore, variation in the light intensity dependence of AN among species is primarily determined by biochemical capacity rather than diffusional conductance. Compared with sub-saturating light, the increase in Vcmax under saturating light suggests an elevation in the Rubisco activation state [31], allowing for increases in Rubisco carboxylation and oxygenation. The ETR-dependent regeneration rates of ATP and NADPH are mainly determined by their consumption rates, which in turn are influenced by primary metabolism, including CO2 assimilation and photorespiration [32,33,34]. When CO2 assimilation is restricted, the inactivation of chloroplast ATP synthase results in an increase in proton gradient (ΔpH) across the thylakoid membranes, which slows down the electron flow at cytochrome b6/f complex [32,35]. Therefore, the coordination between Vcmax and ETR tightly determines the light intensity dependence of AN.
The biological significance of Vcmax in the light response of AN aligns with the general understanding that Vcmax is an energy-dependent process. For example, Vcmax gradually increases upon transition from low to high light, imposing a significant on AN [22,36]. With increasing maximum Vcmax, the time required to reach 95% of the maximum Vcmax during light induction also gradually increases [37]. In Arabidopsis thaliana, the value of Vcmax at 1200 μmol photons m−2 s−1 is 2-fold higher than that at 100 μmol photons m−2 s−1 [22]. Consistently, we found that Vcmax at 600 μmol photons m−2 s−1 was substantially higher than that at 400 μmol photons m−2 s−1 in the twelve tree species (Figure 2). Furthermore, as Vcmax-2000/Vcmax-400 and Vcmax-2000/Vcmax-600 increased, ETR2000/ETR400 and ETR2000/ETR600 also increased simultaneously (Figure 6 and Figure 7), suggesting that ETR provides the essential energy for the increase in Vcmax through Rubisco activation.
Accompanying the increase in Vcmax under saturating light, the value of Cc decreased (Figure 6 and Figure 7), resulting in an inevitable increase in the rate of Rubisco oxygenation (photorespiration). Photorespiration begins with the oxygenation of RuBP catalyzed by Rubisco, producing 2-phosphoglycolate (2-PG). Given that 2-PG inhibits central enzymes in the Calvin–Benson cycle and glycolysis, it must be converted into glycerate-3-P through the photorespiratory pathway. This process requires additional ATP and NADPH produced by ETR. Therefore, JO-2000/JO-400 and JO-2000/JO-600 positively increased with the increases in Vcmax-2000/Vcmax-400 and Vcmax-2000/Vcmax-600 (Figure 6 and Figure 7). Under conditions of high Vcmax, the rate of RuBP oxygenation was inevitably elevated in normal air. Such enhancement of photorespiration accelerates the consumption rate of ATP and NADPH. This process not only prevents substrate limitation of chloroplast ATP synthase but also favors electron transfer from PSI to NADP+ [38,39]. Therefore, photorespiration participates in the light intensity dependence of Vcmax and ETR.
Considering the strong effect of Vcmax on the light intensity dependence of AN, it is surprising that the light intensity dependence of Vcmax varies among different species (Figure 2). We found that the values of Vcmax-2000/Vcmax-600 and AN-2000/AN-600 were positively correlated with the steady-state Vcmax at 2000 μmol photons m−2 s−1 (Figure 8). As a result, the light intensity dependence of Vcmax and AN is largely determined by the maximum capacity of Vcmax. In plants with low Vcmax capacity, such as Chaenomeles cathayensis, Vcmax can reach its maximum value at 600 μmol photons m−2 s−1 (Figure 2). By comparison, in plants with high Vcmax capacity, such as Alnus nepalensis, Vcmax saturates at 1500 μmol photons m−2 s−1 (Figure 2). In wild-type plants, the maximum value of leaf Vcmax is tightly related to leaf Rubisco content or leaf nitrogen content [5,40,41]. Therefore, variation in the light intensity dependence of Vcmax and AN among tree species may be determined by leaf Rubisco content or leaf nitrogen content.

5. Conclusions

We document that the light intensity dependence of AN is more related to the light response of Vcmax rather than the light response of gs and gm. Furthermore, the light response of Vcmax is in turn influenced by its maximum capacity. Therefore, the maximum Vcmax plays a significant role in determining the light intensity dependence of AN. We propose that increasing the maximum Vcmax or enhancing the nitrogen distribution into Rubisco has the potential to improve AN under sub-saturating and saturating light conditions. This strategy provides insight into crop improvement.

Author Contributions

Conceptualization, W.H. and J.C.; Methodology, X.W., J.C. and W.H.; Software, X.W. and W.H.; Validation, X.W.; Formal analysis, W.H.; Investigation, X.W., Q.S. and N.L.; Resources, J.C.; Data curation, X.W.; Writing—original draft, W.H.; Project administration, W.H.; Funding acquisition, W.H. All authors have read and agreed to the published version of the manuscript.

Funding

This work was supported by the Major Science and Technology Projects in Yunnan Province (202202AE090012), by the National Natural Science Foundation of China (31971412, 32171505), and by West Light Foundation of the Chinese Academy of Sciences.

Data Availability Statement

The data presented in this study are available on request from the corresponding author. Data available on request due to privacy.

Conflicts of Interest

The authors declare no conflicts of interest.

References

  1. Carriquí, M.; Cabrera, H.M.; Conesa, M.; Coopman, R.E.; Douthe, C.; Gago, J.; Gallé, A.; Galmés, J.; Ribas-Carbo, M.; Tomás, M.; et al. Diffusional Limitations Explain the Lower Photosynthetic Capacity of Ferns as Compared with Angiosperms in a Common Garden Study. Plant Cell Environ. 2015, 38, 448–460. [Google Scholar] [CrossRef] [PubMed]
  2. Gago, J.; Daloso, D.; Figueroa, C.M.; Flexas, J.; Fernie, A.R.; Nikoloski, Z. Relationships of Leaf Net Photosynthesis, Stomatal Conductance, and Mesophyll Conductance to Primary Plant Metabolism: A Multi-Species Meta-Analysis Approach. Plant Physiol. 2016, 171, 265–279. [Google Scholar] [CrossRef] [PubMed]
  3. Peguero-Pina, J.J.; Sisó, S.; Flexas, J.; Galmés, J.; García-Nogales, A.; Niinemets, Ü.; Sancho-Knapik, D.; Saz, M.Á.; Gil-Pelegrín, E. Cell-Level Anatomical Characteristics Explain High Mesophyll Conductance and Photosynthetic Capacity in Sclerophyllous Mediterranean Oaks. New Phytol. 2017, 214, 585–596. [Google Scholar] [CrossRef] [PubMed]
  4. Sun, H.; Zhang, S.B.; Peguero-Pina, J.J.; Huang, W. Cell-Anatomical and Physiological Mechanisms Underlying the Faster Carbon Gain of Deciduous Trees Relative to Evergreen Trees. Environ. Exp. Bot. 2023, 209, 105286. [Google Scholar] [CrossRef]
  5. Shi, Q.; He, B.; Knauer, J.; Peguero-Pina, J.J.; Zhang, S.-B.; Huang, W. Leaf Nutrient Basis for the Differentiation of Photosynthetic Traits between Subtropical Evergreen and Deciduous Trees. Plant Physiol. 2025, 197, kiae566. [Google Scholar] [CrossRef]
  6. Pearcy, R.W. Sunflecks and Photosynthesis in Plant Canopies. Annu. Rev. Plant Physiol. Plant Mol. Biol. 1990, 41, 421–453. [Google Scholar] [CrossRef]
  7. Pearcy, R.W.; Krall, J.P.; Sassenrath-Cole, G.F. Photosynthesis in Fluctuating Light Environments. In Photosynthesis and the Environment; Kluwer Academic Publishers: Dordrecht, The Netherlands, 1996; pp. 321–346. [Google Scholar]
  8. Yang, Y.-J.; Hu, H.; Huang, W. The Light Dependence of Mesophyll Conductance and Relative Limitations on Photosynthesis in Evergreen Sclerophyllous Rhododendron Species. Plants 2020, 9, 1536. [Google Scholar] [CrossRef]
  9. Xiong, D.; Douthe, C.; Flexas, J. Differential Coordination of Stomatal Conductance, Mesophyll Conductance, and Leaf Hydraulic Conductance in Response to Changing Light across Species. Plant Cell Environ. 2018, 41, 436–450. [Google Scholar] [CrossRef]
  10. Yamori, W.; Evans, J.R.; Von Caemmerer, S. Effects of Growth and Measurement Light Intensities on Temperature Dependence of CO2 Assimilation Rate in Tobacco Leaves. Plant Cell Environ. 2010, 33, 332–343. [Google Scholar] [CrossRef]
  11. Long, S.P.; Taylor, S.H.; Burgess, S.J.; Carmo-Silva, E.; Lawson, T.; De Souza, A.P.; Leonelli, L.; Wang, Y. Into the Shadows and Back into Sunlight: Photosynthesis in Fluctuating Light. Annu. Rev. Plant Biol. 2022, 73, 617–648. [Google Scholar] [CrossRef]
  12. Chang, W.; Zhang, S.B.; Li, S.Y.; Hu, H. Ecophysiological Significance of Leaf Traits in Cypripedium and Paphiopedilum. Physiol. Plant. 2011, 141, 30–39. [Google Scholar] [CrossRef] [PubMed]
  13. Zhang, W.; Huang, W.; Zhang, S.-B. The Study of a Determinate Growth Orchid Highlights the Role of New Leaf Production in Photosynthetic Light Acclimation. Plant Ecol. 2017, 218, 997–1008. [Google Scholar] [CrossRef]
  14. Zeng, Z.-L.; Wang, X.-Q.; Zhang, S.-B.; Huang, W. Mesophyll Conductance Limits Photosynthesis in Fluctuating Light under Combined Drought and Heat Stresses. Plant Physiol. 2024, 194, 1498–1511. [Google Scholar] [CrossRef] [PubMed]
  15. Grassi, G.; Magnani, F. Stomatal, Mesophyll Conductance and Biochemical Limitations to Photosynthesis as Affected by Drought and Leaf Ontogeny in Ash and Oak Trees. Plant Cell Environ. 2005, 28, 834–849. [Google Scholar] [CrossRef]
  16. Yamori, W.; Sakata, N.; Suzuki, Y.; Shikanai, T.; Makino, A. Cyclic Electron Flow around Photosystem I via Chloroplast NAD(P)H Dehydrogenase (NDH) Complex Performs a Significant Physiological Role during Photosynthesis and Plant Growth at Low Temperature in Rice. Plant J. 2011, 68, 966–976. [Google Scholar] [CrossRef]
  17. Yamori, W.; Nagai, T.; Makino, A. The Rate-Limiting Step for CO2 Assimilation at Different Temperatures Is Influenced by the Leaf Nitrogen Content in Several C3 Crop Species. Plant Cell Environ. 2011, 34, 764–777. [Google Scholar] [CrossRef]
  18. Farquhar, G.D.; von Caemmerer, S.; Berry, J.A. A Biochemical Model of Photosynthetic CO2 Assimilation in Leaves of C3 Species. Planta 1980, 149, 78–90. [Google Scholar] [CrossRef]
  19. Zhu, X.-G.; Long, S.P.; Ort, D.R. Improving Photosynthetic Efficiency for Greater Yield. Annu. Rev. Plant Biol. 2010, 61, 235–261. [Google Scholar] [CrossRef]
  20. Long, S.P.; Bernacchi, C.J. Gas Exchange Measurements, What Can They Tell Us about the Underlying Limitations to Photosynthesis? Procedures and Sources of Error. J. Exp. Bot. 2003, 54, 2393–2401. [Google Scholar] [CrossRef]
  21. Yamori, W.; Kusumi, K.; Iba, K.; Terashima, I. Increased Stomatal Conductance Induces Rapid Changes to Photosynthetic Rate in Response to Naturally Fluctuating Light Conditions in Rice. Plant. Cell Environ. 2020, 43, 1230–1240. [Google Scholar] [CrossRef]
  22. Liu, T.; Barbour, M.M.; Yu, D.; Rao, S.; Song, X. Mesophyll Conductance Exerts a Significant Limitation on Photosynthesis during Light Induction. New Phytol. 2022, 233, 360–372. [Google Scholar] [CrossRef] [PubMed]
  23. Bunce, J.A. Light Dependence of Carboxylation Capacity for C3 Photosynthesis Models. Photosynthetica 2016, 54, 484–490. [Google Scholar] [CrossRef]
  24. Loriaux, S.D.; Avenson, T.J.; Welles, J.M.; Mcdermitt, D.K.; Eckles, R.D.; Riensche, B.; Genty, B. Closing in on Maximum Yield of Chlorophyll Fluorescence Using a Single Multiphase Flash of Sub-Saturating Intensity. Plant Cell Environ. 2013, 36, 1755–1770. [Google Scholar] [CrossRef] [PubMed]
  25. Krall, J.P.; Edwards, G.E. Relationship between Photosystem II Activity and CO2 Fixation in Leaves. Physiol. Plant. 1992, 86, 180–187. [Google Scholar] [CrossRef]
  26. Genty, B.; Briantais, J.-M.; Baker, N.R. The Relationship between the Quantum Yield of Photosynthetic Electron Transport and Quenching of Chlorophyll Fluorescence. Biochim. Biophys. Acta-Gen. Subj. 1989, 990, 87–92. [Google Scholar] [CrossRef]
  27. Harley, P.C.; Loreto, F.; Di Marco, G.; Sharkey, T.D. Theoretical Considerations When Estimating the Mesophyll Conductance to CO2 Flux by Analysis of the Response of Photosynthesis to CO2. Plant Physiol. 1992, 98, 1429–1436. [Google Scholar] [CrossRef]
  28. Flexas, J.; Ribas-Carbó, M.; Diaz-Espejo, A.; Galmés, J.; Medrano, H. Mesophyll Conductance to CO2: Current Knowledge and Future Prospects. Plant. Cell Environ. 2008, 31, 602–621. [Google Scholar] [CrossRef]
  29. De Kauwe, M.G.; Lin, Y.S.; Wright, I.J.; Medlyn, B.E.; Crous, K.Y.; Ellsworth, D.S.; Maire, V.; Prentice, I.C.; Atkin, O.K.; Rogers, A.; et al. A Test of the “one-Point Method” for Estimating Maximum Carboxylation Capacity from Field-Measured, Light-Saturated Photosynthesis. New Phytol. 2016, 210, 1130–1144. [Google Scholar] [CrossRef]
  30. Valentini, R.; Epron, D.; Angelis, P.D.E.; Matteucci, G.; Dreyer, E. In Situ Estimation of Net CO2 Assimilation, Photosynthetic Electron Flow and Photorespiration in Turkey Oak (Q. cerris L.) Leaves: Diurnal Cycles under Different Levels of Water Supply. Plant Cell Environ. 1995, 18, 631–640. [Google Scholar] [CrossRef]
  31. Yamori, W.; Masumoto, C.; Fukayama, H.; Makino, A. Rubisco Activase Is a Key Regulator of Non-Steady-State Photosynthesis at Any Leaf Temperature and, to a Lesser Extent, of Steady-State Photosynthesis at High Temperature. Plant J. 2012, 71, 871–880. [Google Scholar] [CrossRef]
  32. Kanazawa, A.; Kramer, D.M. In Vivo Modulation of Nonphotochemical Exciton Quenching (NPQ) by Regulation of the Chloroplast ATP Synthase. Proc. Natl. Acad. Sci. USA 2002, 99, 12789–12794. [Google Scholar] [CrossRef] [PubMed]
  33. Rott, M.; Martins, N.F.; Thiele, W.; Lein, W.; Bock, R.; Kramer, D.M.; Schöttler, M.A. ATP Synthase Repression in Tobacco Restricts Photosynthetic Electron Transport, CO2 Assimilation, and Plant Growth by Overacidification of the Thylakoid Lumen. Plant Cell 2011, 23, 304–321. [Google Scholar] [CrossRef] [PubMed]
  34. Murata, N.; Takahashi, S.; Nishiyama, Y.; Allakhverdiev, S.I. Photoinhibition of Photosystem II under Environmental Stress. Biochim. Biophys. Acta-Bioenerg. 2007, 1767, 414–421. [Google Scholar] [CrossRef]
  35. Zivcak, M.; Kalaji, H.M.; Shao, H.B.; Olsovska, K.; Brestic, M. Photosynthetic Proton and Electron Transport in Wheat Leaves under Prolonged Moderate Drought Stress. J. Photochem. Photobiol. B Biol. 2014, 137, 107–115. [Google Scholar] [CrossRef]
  36. Sakoda, K.; Yamori, W.; Groszmann, M.; Evans, J.R. Stomatal, Mesophyll Conductance, and Biochemical Limitations to Photosynthesis during Induction. Plant Physiol. 2021, 185, 146–160. [Google Scholar] [CrossRef]
  37. Salter, W.T.; Merchant, A.M.; Richards, R.A.; Trethowan, R.; Buckley, T.N. Rate of Photosynthetic Induction in Fluctuating Light Varies Widely among Genotypes of Wheat. J. Exp. Bot. 2019, 70, 2787–2796. [Google Scholar] [CrossRef]
  38. Smith, K.; Strand, D.D.; Kramer, D.M.; Walker, B.J. The Role of Photorespiration in Preventing Feedback Regulation via ATP Synthase in Nicotiana Tabacum. Plant. Cell Environ. 2024, 47, 416–428. [Google Scholar] [CrossRef]
  39. Walker, B.J.; VanLoocke, A.; Bernacchi, C.J.; Ort, D.R. The Costs of Photorespiration to Food Production Now and in the Future. Annu. Rev. Plant Biol. 2016, 67, 107–129. [Google Scholar] [CrossRef]
  40. Yamori, W.; Takahashi, S.; Makino, A.; Price, G.D.; Badger, M.R.; von Caemmerer, S. The Roles of ATP Synthase and the Cytochrome B6/f Complexes in Limiting Chloroplast Electron Transport and Determining Photosynthetic Capacity. Plant Physiol. 2011, 155, 956–962. [Google Scholar] [CrossRef]
  41. Wang, X.-Q.; Sun, H.; Zeng, Z.-L.; Huang, W. Within-Branch Photosynthetic Gradients Are More Related to the Coordinated Investments of Nitrogen and Water than Leaf Mass per Area. Plant Physiol. Biochem. 2023, 198, 107681. [Google Scholar] [CrossRef]
Figure 1. Light intensity dependence of net CO2 assimilation rate (AN) (A), stomatal conductance (gs) (B), and mesophyll conductance (gm) (C) in twelve tree species. Data are shown as means ± SE (n = 6).
Plants 14 00986 g001
Figure 2. Light intensity dependence of electron transport rate (ETR) (A) and the maximum velocity of Rubisco carboxylation (Vcmax) (B) in the twelve tree species. Data are shown as means ± SE (n = 6).
Plants 14 00986 g002
Figure 3. Relationship between AN, gs, gm, Vcmax, and ETR across light intensities from 400 to 2000 μmol photons m−2 s−1 among the twelve tree species. AN, net CO2 assimilation rate; gs, stomatal conductance; gm, mesophyll conductance; Vcmax, the maximum velocity of Rubisco carboxylation; ETR, electron transport rate. (A) relationship between AN and gs; (B) relationship between AN and gm; (C) relationship between AN and Vcmax; (D) relationship between AN and ETR.
Plants 14 00986 g003
Figure 4. Relationships between AN-2000/AN-400, gs-2000/gs-400, gm-2000/gm-400, Vcmax-2000/Vcmax-400, and ETR2000/ETR400 among the twelve tree species. AN-2000/AN-400, the ratio of net CO2 assimilation rate (AN) at 2000 μmol photons m−2 s−1 to that at 400 μmol photons m−2 s−1; gs-2000/gs-400, the ratio of stomatal conductance (gs) at 2000 μmol photons m−2 s−1 to that at 400 μmol photons m−2 s−1; gm-2000/gm-400, the ratio of mesophyll conductance (gm) at 2000 μmol photons m−2 s−1 to that at 400 μmol photons m−2 s−1; Vcmax-2000/Vcmax-400, the ratio of maximum velocity of Rubisco carboxylation (Vcmax) at 2000 μmol photons m−2 s−1 to that at 400 μmol photons m−2 s−1; ETR2000/ETR400, the ratio of electron transport rate (ETR) at 2000 μmol photons m−2 s−1 to that at 400 μmol photons m−2 s−1. (A) relationship between AN-2000/AN-400 and gs-2000/gs-400; (B) relationship between AN-2000/AN-400 and gm-2000/gm-400; (C) relationship between AN-2000/AN-400 and Vcmax-2000/Vcmax-400; (D) relationship between AN-2000/AN-400 and ETR2000/ETR400.
Plants 14 00986 g004
Figure 5. Relationships between AN-2000/AN-600, gs-2000/gs-600, gm-2000/gm-600, Vcmax-2000/Vcmax-600, and ETR2000/ETR600 among the twelve tree species. AN-2000/AN-600, the ratio of net CO2 assimilation rate (AN) at 2000 μmol photons m−2 s−1 to that at 600 μmol photons m−2 s−1; gs-2000/gs-600, the ratio of stomatal conductance (gs) at 2000 μmol photons m−2 s−1 to that at 600 μmol photons m−2 s−1; gm-2000/gm-600, the ratio of mesophyll conductance (gm) at 2000 μmol photons m−2 s−1 to that at 600 μmol photons m−2 s−1; Vcmax-2000/Vcmax-600, the ratio of maximum velocity of Rubisco carboxylation (Vcmax) at 2000 μmol photons m−2 s−1 to that at 600 μmol photons m−2 s−1; ETR2000/ETR600, the ratio of electron transport rate (ETR) at 2000 μmol photons m−2 s−1 to that at 600 μmol photons m−2 s−1. (A) relationship between AN-2000/AN-600 and gs-2000/gs-600; (B) relationship between AN-2000/AN-600 and gm-2000/gm-600; (C) relationship between AN-2000/AN-600 and Vcmax-2000/Vcmax-600; (D) relationship between AN-2000/AN-600 and ETR2000/ETR600.
Plants 14 00986 g005
Figure 6. Relationships between Vcmax-2000/Vcmax-400, ETR2000/ETR400, Cc-2000/Cc-400, LB-2000/LB-400, and JO-2000/JO-400 among the twelve tree species. Vcmax-2000/Vcmax-400, the ratio of maximum velocity of Rubisco carboxylation (Vcmax) at 2000 μmol photons m−2 s−1 to that at 400 μmol photons m−2 s−1; ETR2000/ETR400, the ratio of electron transport rate (ETR) at 2000 μmol photons m−2 s−1 to that at 400 μmol photons m−2 s−1; Cc-2000/Cc-400, the ratio of chloroplast CO2 concentration (Cc) at 2000 μmol photons m−2 s−1 to that at 400 μmol photons m−2 s−1; LB-2000/LB-400, the ratio of biochemical limitation (LB) at 2000 μmol photons m−2 s−1 to that at 400 μmol photons m−2 s−1; JO-2000/JO-400, the ratio of photorespiration (JO) at 2000 μmol photons m−2 s−1 to that at 400 μmol photons m−2 s−1. (A), relationship between ETR2000/ETR400 and Vcmax-2000/Vcmax-400; (B) relationship between Cc-2000/Cc-400 and Vcmax-2000/Vcmax-400; (C) relationship between LB-2000/LB-400 and Vcmax-2000/Vcmax-400; (D) relationship between JO-2000/JO-400 and Vcmax-2000/Vcmax-400.
Plants 14 00986 g006
Figure 7. Relationships between Vcmax-2000/Vcmax-600, ETR2000/ETR600, Cc-2000/Cc-600, LB-2000/LB-600, and JO-2000/JO-600 among the twelve tree species. Vcmax-2000/Vcmax-600, the ratio of maximum velocity of Rubisco carboxylation (Vcmax) at 2000 μmol photons m−2 s−1 to that at 600 μmol photons m−2 s−1; ETR2000/ETR600, the ratio of electron transport rate (ETR) at 2000 μmol photons m−2 s−1 to that at 600 μmol photons m−2 s−1; Cc-2000/Cc-600, the ratio of chloroplast CO2 concentration (Cc) at 2000 μmol photons m−2 s−1 to that at 600 μmol photons m−2 s−1; LB-2000/LB-600, the ratio of biochemical limitation (LB) at 2000 μmol photons m−2 s−1 to that at 600 μmol photons m−2 s−1; JO-2000/JO-600, the ratio of photorespiration (JO) at 2000 μmol photons m−2 s−1 to that at 600 μmol photons m−2 s−1. (A) relationship between ETR2000/ETR600 and Vcmax-2000/Vcmax-600; (B) relationship between Cc-2000/Cc-600 and Vcmax-2000/Vcmax-600; (C) relationship between LB-2000/LB-600 and Vcmax-2000/Vcmax-600; (D) relationship between JO-2000/JO-600 and Vcmax-2000/Vcmax-600.
Plants 14 00986 g007
Figure 8. Relationships between Vcmax-2000/Vcmax-600, AN-2000/AN-600, and Vcmax-2000 among the twelve tree species. Vcmax-2000/Vcmax-600, the ratio of maximum velocity of Rubisco carboxylation (Vcmax) at 2000 μmol photons m−2 s−1 to that at 600 μmol photons m−2 s−1; AN-2000/AN600, the ratio of net CO2 assimilation rate (AN) at 2000 μmol photons m−2 s−1 to that at 600 μmol photons m−2 s−1; Vcmax-2000, the value of Vcmax at 2000 μmol photons m−2 s−1. (A) relationship between Vcmax-2000/Vcmax-600 and Vcmax-2000; (B) relationship between AN-2000/AN-600 and Vcmax-2000.
Plants 14 00986 g008
Table 1. Area-based photosynthetic characteristics for evergreen and deciduous angiosperm tree species. Average values ± SE (n ≥ 5) are shown for area-based maximum net photosynthetic rate (AN), stomatal conductance (gs), mesophyll conductance (gm), maximum velocity of Rubisco carboxylation (Vcmax), and electron transport rate (ETR).
SpeciesAarea
(μmol m−2 s−1)
gs
(mol m−2 s−1)
gm
(mol m−2 s−1)
Vcmax
(μmol m−2 s−1)
ETR
(μmol m−2 s−1)
Ch. cathayensis13.1 ± 0.430.406 ± 0.0310.095 ± 0.0191.5 ± 1189.6 ± 2.8
Ce. glabra21.1 ± 0.850.615 ± 0.0430.16 ± 0.02111 ± 11137 ± 8.2
Pt. stenoptera14.7 ± 0.490.303 ± 0.0420.12 ± 0.005118 ± 14104 ± 6.0
Id. polycarpa16.3 ± 0.770.314 ± 0.0370.16 ± 0.01101 ± 9.1105 ± 5.4
Id. Polycarpa var. vestita16.0 ± 0.780.446 ± 0.0390.18 ± 0.04139 ± 25116±8.3
Me. azedarach16.3 ± 0.760.302 ± 0.050.12 ± 0.01155 ± 25126 ± 6.9
Pi. chinensis12.5 ± 0.970.177 ± 0.0370.091 ± 0.01144 ± 24111 ± 6.4
Fr. retusifoliolata15.4 ± 0.230.285 ± 0.020.15 ± 0.02108 ± 12105 ± 3.0
Hy. monogynum21.3 ± 0.450.588 ± 0.060.17 ± 0.02161± 22156 ± 7.6
St. grandiflorus10.9 ± 0.660.142 ± 0.010.10 ± 0.01120 ± 9.988.9 ± 4.3
Su. elegans19.2 ± 0.710.359± 0.070.24 ± 0.04162 ± 30152 ± 12
Al. nepalensis19.4 ± 1.60.428 ± 0.090.13 ± 0.01200 ±15176 ± 4.6
Disclaimer/Publisher’s Note: The statements, opinions and data contained in all publications are solely those of the individual author(s) and contributor(s) and not of MDPI and/or the editor(s). MDPI and/or the editor(s) disclaim responsibility for any injury to people or property resulting from any ideas, methods, instructions or products referred to in the content.

