Article

Synergistic Interactions Between Leaf Traits and Photosynthetic Performance in Young Pinus tabuliformis and Robinia pseudoacacia Trees Under Drought and Shade

1
College of Forestry, Hebei Agricultural University, Baoding 071001, China
2
Institute of Forestry and Pomology, Beijing Academy of Agriculture and Forestry Sciences, Beijing 100093, China
3
Beijing Yanshan Forest Ecosystem Research Station, National Forest and Grassland Administration, Beijing 100093, China
*
Authors to whom correspondence should be addressed.
These authors contributed equally to this work and should be considered co-first authors.
Plants 2025, 14(18), 2825; https://doi.org/10.3390/plants14182825
Submission received: 23 July 2025 / Revised: 14 August 2025 / Accepted: 19 August 2025 / Published: 10 September 2025
(This article belongs to the Special Issue Plant Stress Physiology and Molecular Biology (3rd Edition))

Abstract

Spring droughts, increasingly coinciding with canopy shade, interactively stress the growth of urban tree species and are poorly understood in Beijing. Three-year-old saplings of Pinus tabuliformis and Robinia pseudoacacia were subjected to comparative analysis under four drought–shade sequences, with a full-light, well-watered treatment serving as the control. During two periods encompassing the drought to wilting point and subsequent rewatering, we assessed leaf morphology, water status, photosynthetic gas exchange, and chlorophyll fluorescence. Both species exhibited losses in leaf water and carbon assimilation under drought, yet their adaptive strategies substantially differed. P. tabuliformis conserved water through the stable leaf anatomy and conservative stomatal control. In particular, P. tabuliformis under full-light and drought conditions decreased their specific leaf area (SLA) by 23%, as well as showing reductions in stomatal conductance (Gs) and transpiration rate (Tr) along with the drought duration (p < 0.01). As the duration of post-drought rewatering increased, the reductions in the net photosynthetic rates (Pn) of P. tabulaeformis showed that the shade condition intensified its photosynthetic limitation and slowed recovery after drought. Under low-light drought, R. pseudoacacia exhibited a 52% increase in SLA and a 77% decline in Gs; the latter was markedly smaller than the reduction observed under full-light drought. After rewatering, Gs displayed an overcompensation response. The rise in specific leaf area and the greater flexibility of stomatal regulation partly offset the adverse effects of drought. Nevertheless, post-drought Pn recovered to only 40%, significantly lower than the 61% recovery under full-light drought. Moreover, the negative correlation between SLA and Pn became significantly stronger, indicating that the “after-effects” of shade–drought hindered photosynthetic recovery once the stress was relieved. Drought duration eroded the phenotypic performance in both species, while the light environment during drought and subsequent rehydration determined the time trajectory and completeness of recovery. These results validate a trade-off between shade mitigation and drought legacy, and guide species selection: plant shade-tolerant R. pseudoacacia in light-limited urban pockets and reserve sun-dependent P. tabuliformis for open, high-light sites to enhance drought resilience of Beijing’s urban forests.

Graphical Abstract

1. Introduction

Global climate change and irregular afforestation have made drought and shading two major bottlenecks restricting tree growth [1,2,3,4]. Beijing is located in a semi-arid region, where approximately 80% of annual precipitation is concentrated in July and August, and the phenomenon of “spring drought” between late spring and early summer has become increasingly prominent [5]. Meanwhile, high-density urban greening, as well as shading from buildings and elevated structures, results in insufficient light in understory and street areas. When water deficit and limited light supply occur simultaneously, leaves, as the core organs for plant carbon assimilation and water regulation and with their synergistic relationship between morphological development and physiological functions, will directly determine the survival and recovery potential of trees [6,7].
Drought and shade exert complex and variable effects on plants, and interspecific variation in adaptive mechanisms is pronounced [8]. When the two stressors act simultaneously, plants must balance growth against survival by flexibly modulating physiological traits such as leaf area, leaf thickness, and photosynthetic efficiency to cope with adverse conditions [9]. Regarding the combined influence of drought and shade on tree photosynthetic physiology, four competing hypotheses have emerged: the interaction hypothesis [10], the trade-off hypothesis [11,12], the facilitation hypothesis [13], and the independent-effect hypothesis [14]. Through multiple regulatory pathways, drought and shade jointly modulate the interplay between leaf traits and photosynthetic–fluorescence physiology [15], enabling plants to sustain growth and survival under severe conditions.
In general, drought reduces the relative water content of plants, induces stomatal closure, and even damages mesophyll cells [16,17,18]. Under shaded conditions, insufficient light limits electron transport and carbon assimilation in plants [19]. However, when these two stressors act simultaneously, plants need to make a trade-off between “morphological plasticity” and “photosynthetic system stability”—that is, adjusting traits such as specific leaf area and leaf dry weight to improve light acquisition efficiency, or adopting a conservative strategy to maintain photosystem activity and carbon assimilation capacity to ensure survival. At present, it is still unclear how different water–light combinations reshape this trade-off relationship, and there is a lack of interspecific comparison of trade-off strategies between urban evergreen trees (Pinus tabuliformis) and deciduous broad-leaved trees (Robinia pseudoacacia).
The coupling of leaf traits and photosynthetic performance is not a static template but a trade-off curve that constantly “slides” with the water–light environment. Prolonged drought duration or increased drought severity will compress the hydraulic safety margin of leaves, and plants tend to reduce transpiration water consumption by decreasing specific leaf area, thickening leaves, or reducing leaf dry weight [16,17]. In contrast, shading induces an increase in specific leaf area and thinning of leaves to enhance light interception in low-light environments [20]. Although shading can provide space for morphological plasticity, the expanded specific leaf area may be difficult to translate into actual carbon gains due to insufficient substrates for photochemical reactions [21,22]. When the two stressors are superimposed, the “water-saving” demand of drought and the “light-capturing” demand of shading are antagonistic. Therefore, it is of great significance to clarify the correlation and changes between leaf traits and photosynthetic physiological indices under “drought-shading” [4,23,24].
This study takes three-year-old Pinus tabuliformis and Robinia pseudoacacia saplings as the experimental objects. By simulating shading and drought conditions, the leaf traits, photosynthetic parameters, and chlorophyll fluorescence indicators of the two tree species were measured to characterize the changes in leaf growth and photosynthetic performance under drought and shading conditions, and to study the response patterns and adaptation strategies of the two tree species to water and light constraints. This study aims to provide theoretical support for the protection and restoration of forest ecosystems in the Beijing area under regional climate change, and intends to address the following issues: (1) How do drought and shade interactively alter leaf traits and photosynthetic performance? (2) Does shade during drought modify the trade-off between trait plasticity and photosynthetic efficiency? (3) Which species exhibits stronger resilience under combined stress?

2. Results

2.1. Effects of Drought and Shade on Leaf Traits of P. tabuliformis and R. pseudoacacia

2.1.1. Specific Leaf Area

Under gradual natural drought stages in all groups, light intensity significantly impacted the changes in the specific leaf area (SLA) of both tree species (Table 1). In the full-light groups (T1, T2), the SLA in the saplings of P. tabuliformis and R. pseudoacacia decreased by 23.14% and 15.95%, respectively, compared to the control (CK). In the low-light groups (T3, T4), the SLA of both species increased with drought intensity. However, the increases were significantly greater in R. pseudoacacia than in P. tabuliformis.
The significant differences in recovery capacity among species were investigated in the rewatering stages in this study (Table 1). In P. tabuliformis, SLA gradually recovered to the pre-drought level during the post-drought rehydration in the T3 and T4 groups, which remained lower than the control levels in the T1 and T2 groups. Compared to non-shaded stages, shading during both the drought and rehydration stages increased SLA recovery in R. pseudoacacia.

2.1.2. Relative Leaf Water Content

Under the drought stress, both species showed a decrease in leaf relativewater content (RWC) (Figure 1). In the full-light drought groups (T1, T2), RWC decreased by 33.23% for P. tabuliformis and by 25.1% for R. pseudoacacia, while it declined by 30.51% and 31% in the low-light drought groups (T3, T4), respectively.
The post-drought rehydration highlighted the interspecies differences in RWC recovery capacity (Figure 1). In P. tabuliformis, RWC in the T1 group recovered to the control (CK) levels first, followed by T3 and T4, with T2 being the last to recover. In all treatment groups, RWC in R. pseudoacacia eventually recovered to the control levels, though the recovery timelines varied among the groups. The recovery of RWC for R. pseudoacacia to control levels took longer in T3, T4 groups than those in T1/T2 groups after drought rewatering.

2.1.3. Leaf Dry Weight

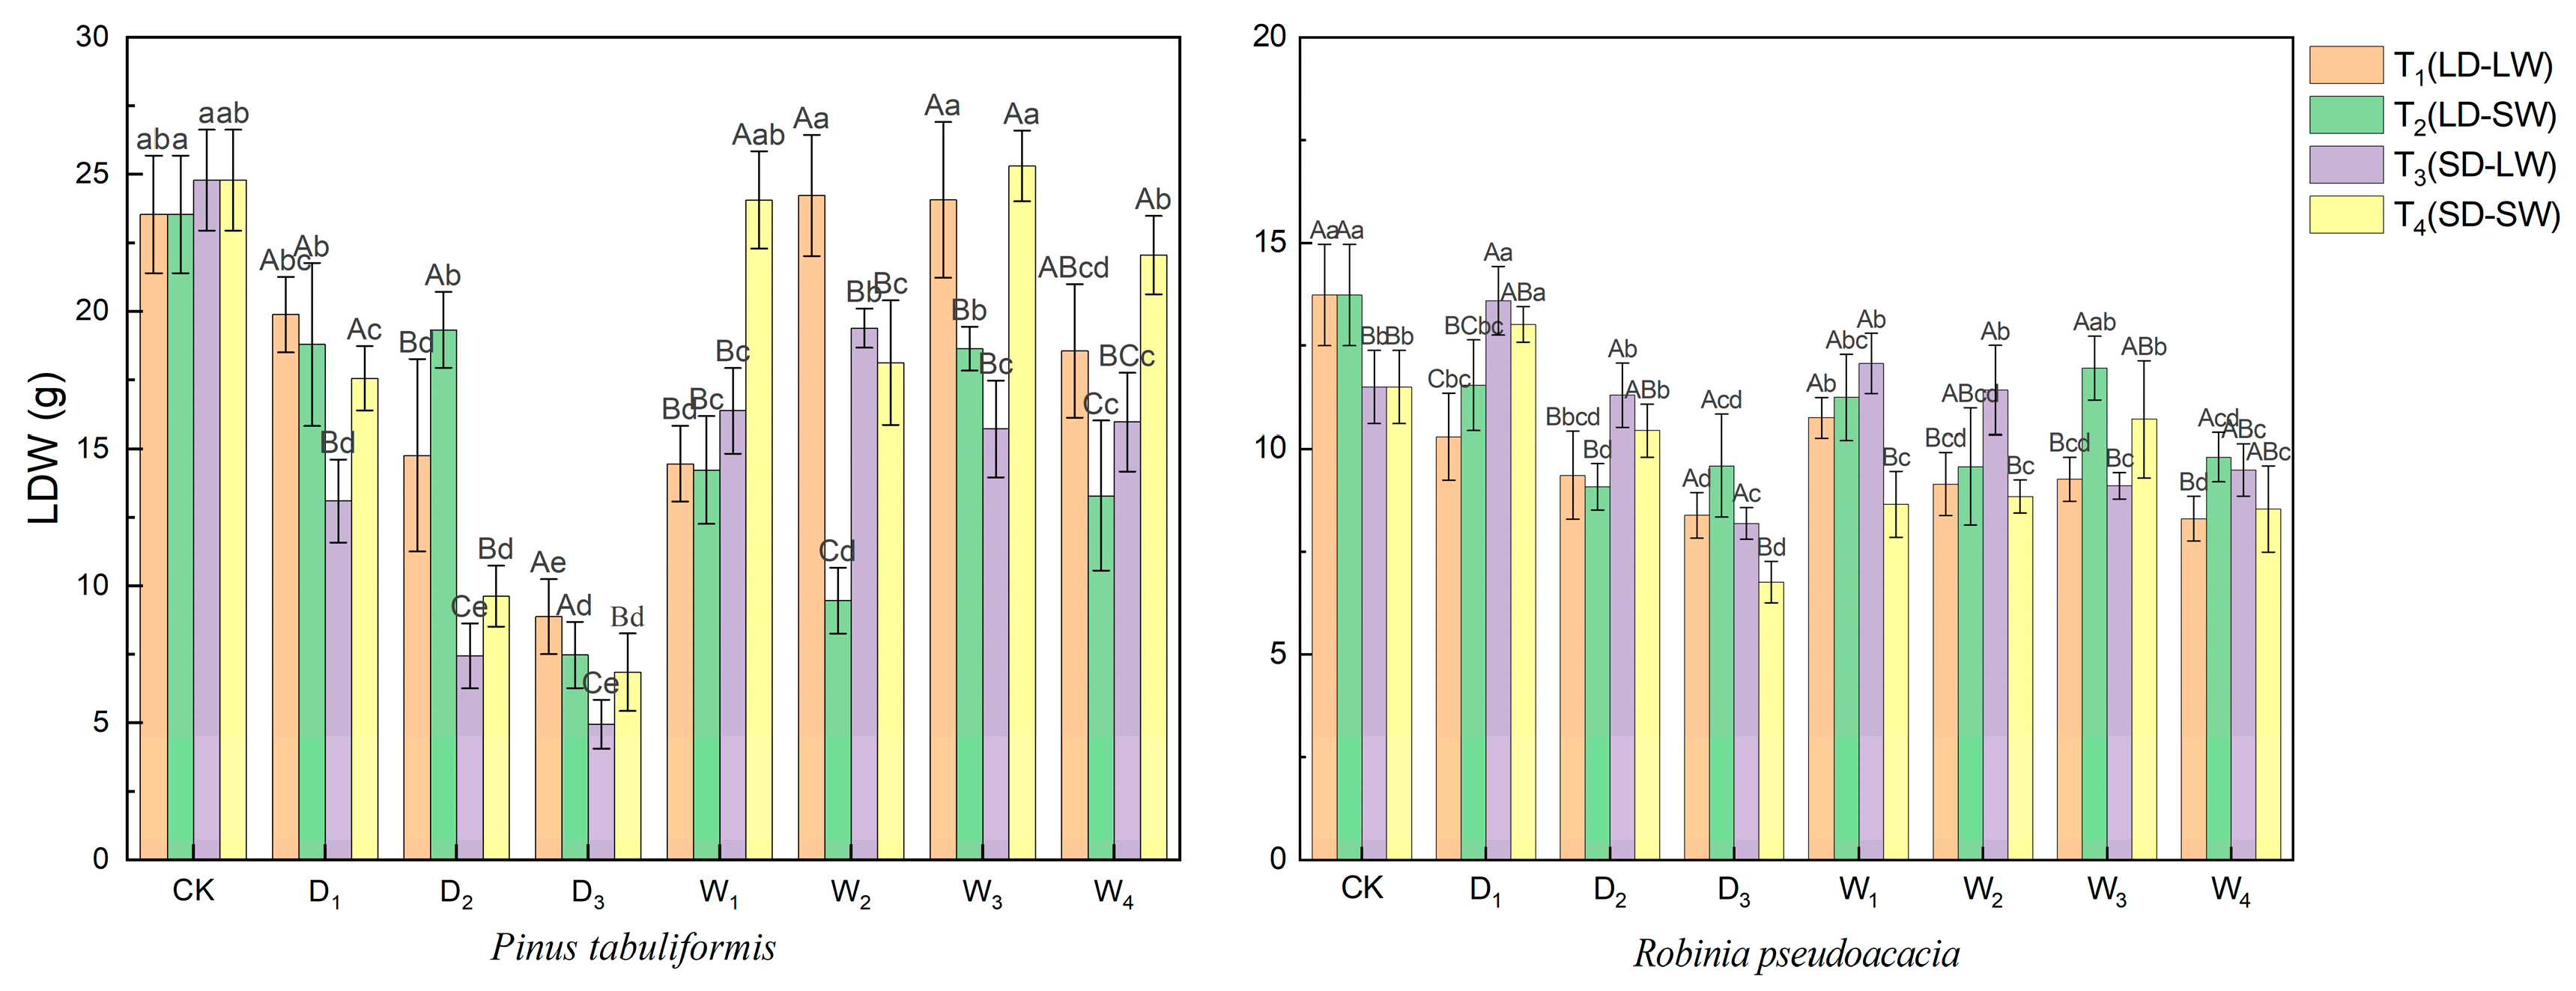
Drought stress significantly suppressed the leaf dry weight (LDW) accumulation in both species (Figure 2). In full-light stages, the LDW of P. tabuliformis decreased by 65.25%, while that of R. pseudoacacia decreased by 34.55%. Under shaded–drought conditions, the LDW of P. tabuliformis further dropped by 76.20%, while that of R. pseudoacacia decreased by 34.99%.
The two species exhibited divergent sensitivity to post-drought light environments in LDW recovery dynamics (Figure 2). LDW in the consistent light groups (T1, T4) was 24.92% higher than that in the altered light conditions (T2, T3) by the end of rehydration. In contrast, R. pseudoacacia exhibited superior LDW recovery under the low-light rehydration conditions. T2, T4 groups (low-light rehydration) had 12.61% higher LDW than T1, T3 groups (full-light rehydration) at the endpoint.

2.2. Effects of Drought and Shade on Photosynthetic Parameters of P. tabuliformis and R. pseudoacacia

2.2.1. Photosynthetic Rate

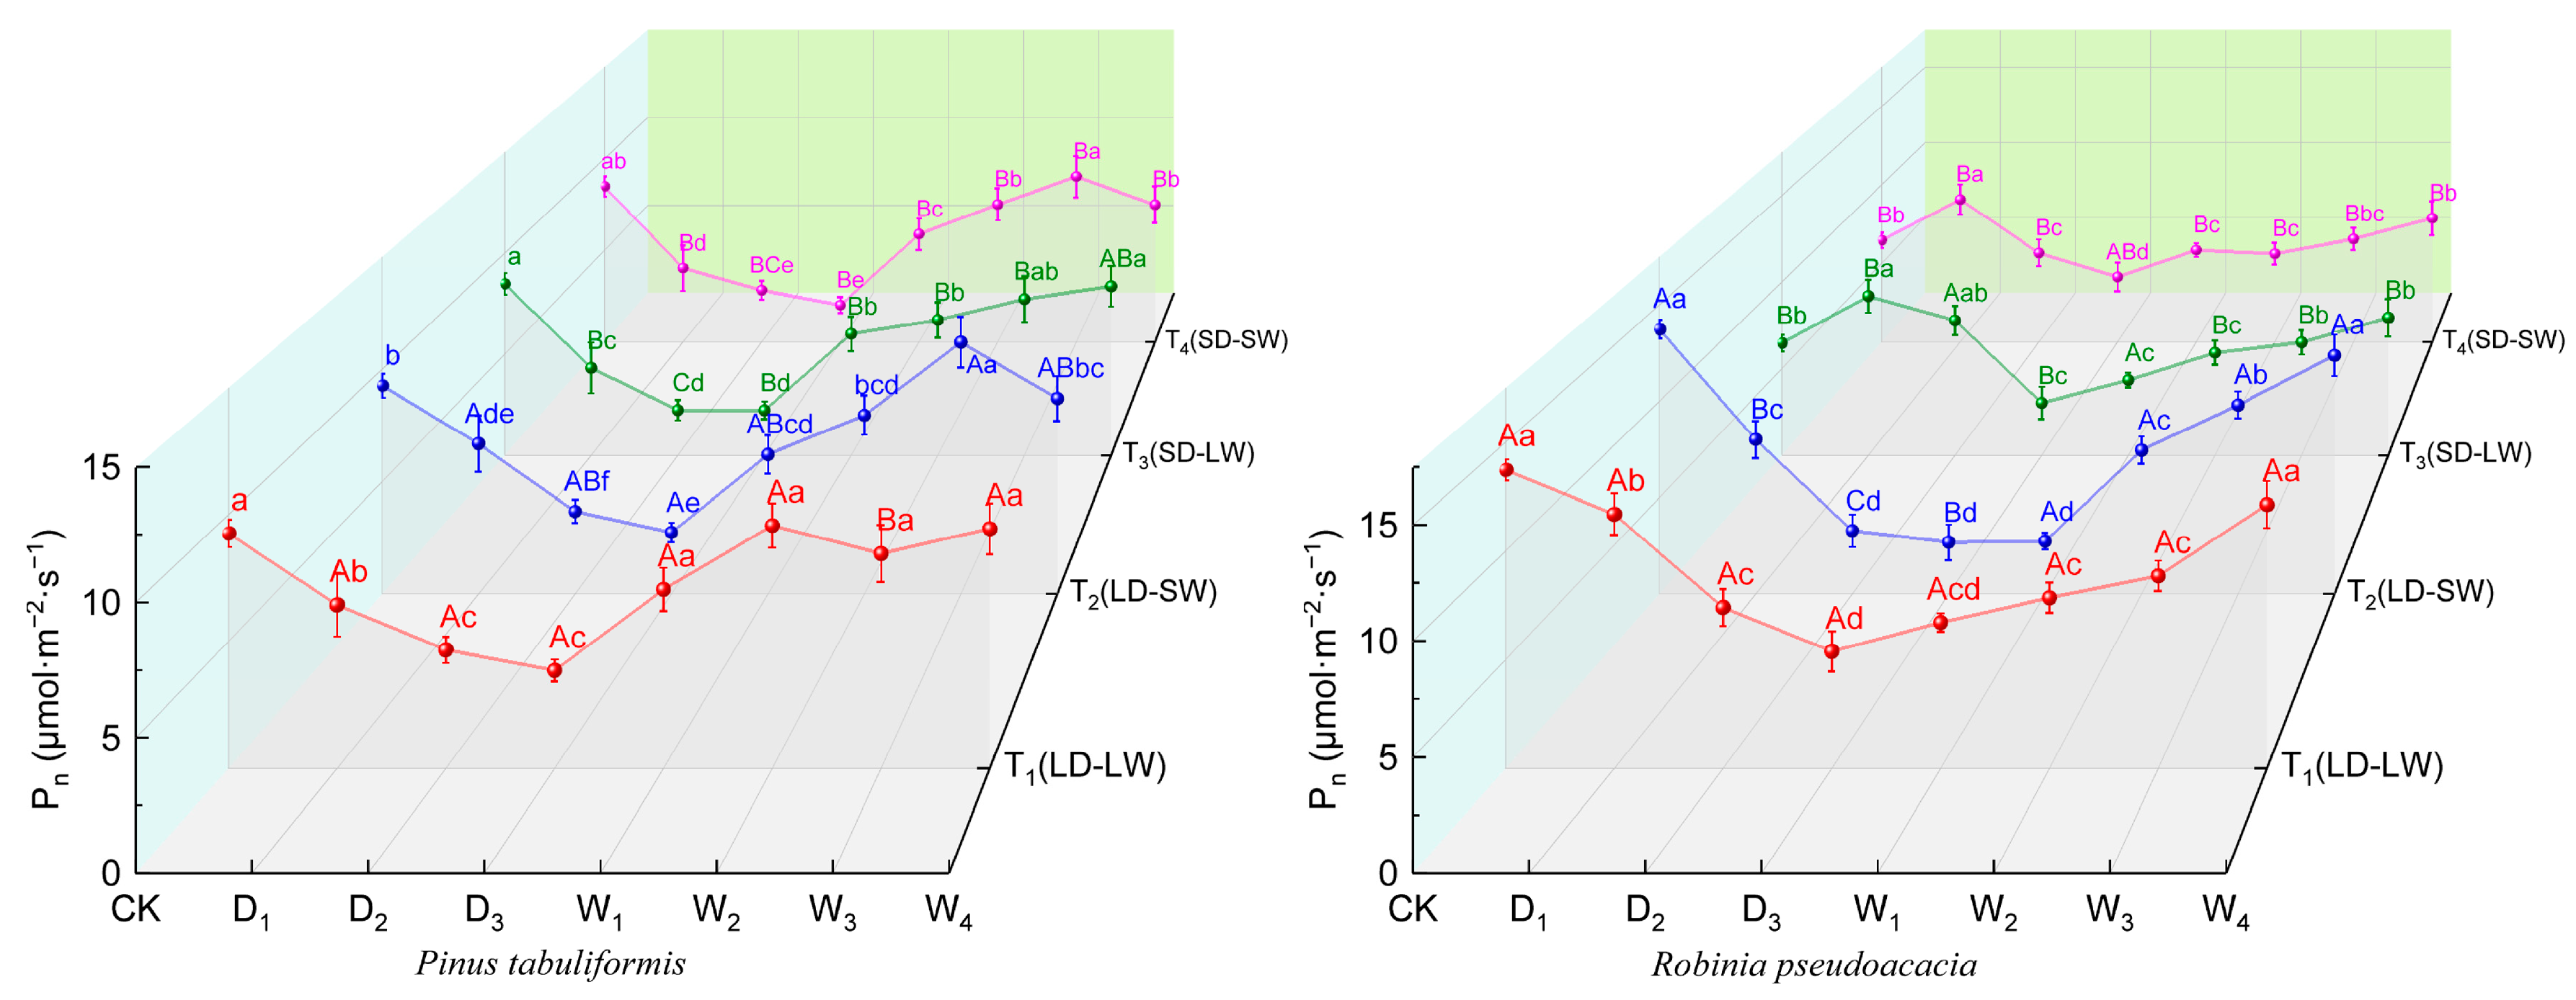
During drought progression, the two species showed divergent patterns in photosynthetic responses (Figure 3). By the final drought stage, P. tabuliformis and R. pseudoacacia in the full-light groups (T1, T2) exhibited reductions of 64.41% and 70.86% in the photosynthetic rate (Pn), respectively. Notably, P. tabuliformis in shading drought conditions (T3, T4) experienced greater declines in Pn of 76.82%, while R. pseudoacacia in the low-light groups showed the relatively lower reduction of 44.78%.
The rehydration process in this study revealed the distinct stress-memory effects on the photosynthesis derived from the pre-drought light exposure (Figure 3). In P. tabuliformis, low-light rewatering groups (T2, T4) attained the peaks of the Pn during W3, whereas the full-light rewatering groups (T1, T3) only achieved the maximal recovery by W4. In contrast, non-shaded drought groups (T1, T2) of R. pseudoacaci exhibited a 61.45% increase in Pn from drought-end to rehydration completion, significantly outperforming the shaded–drought groups (T3, T4), which only achieved a 39.98% increase.

2.2.2. Stomatal Conductance

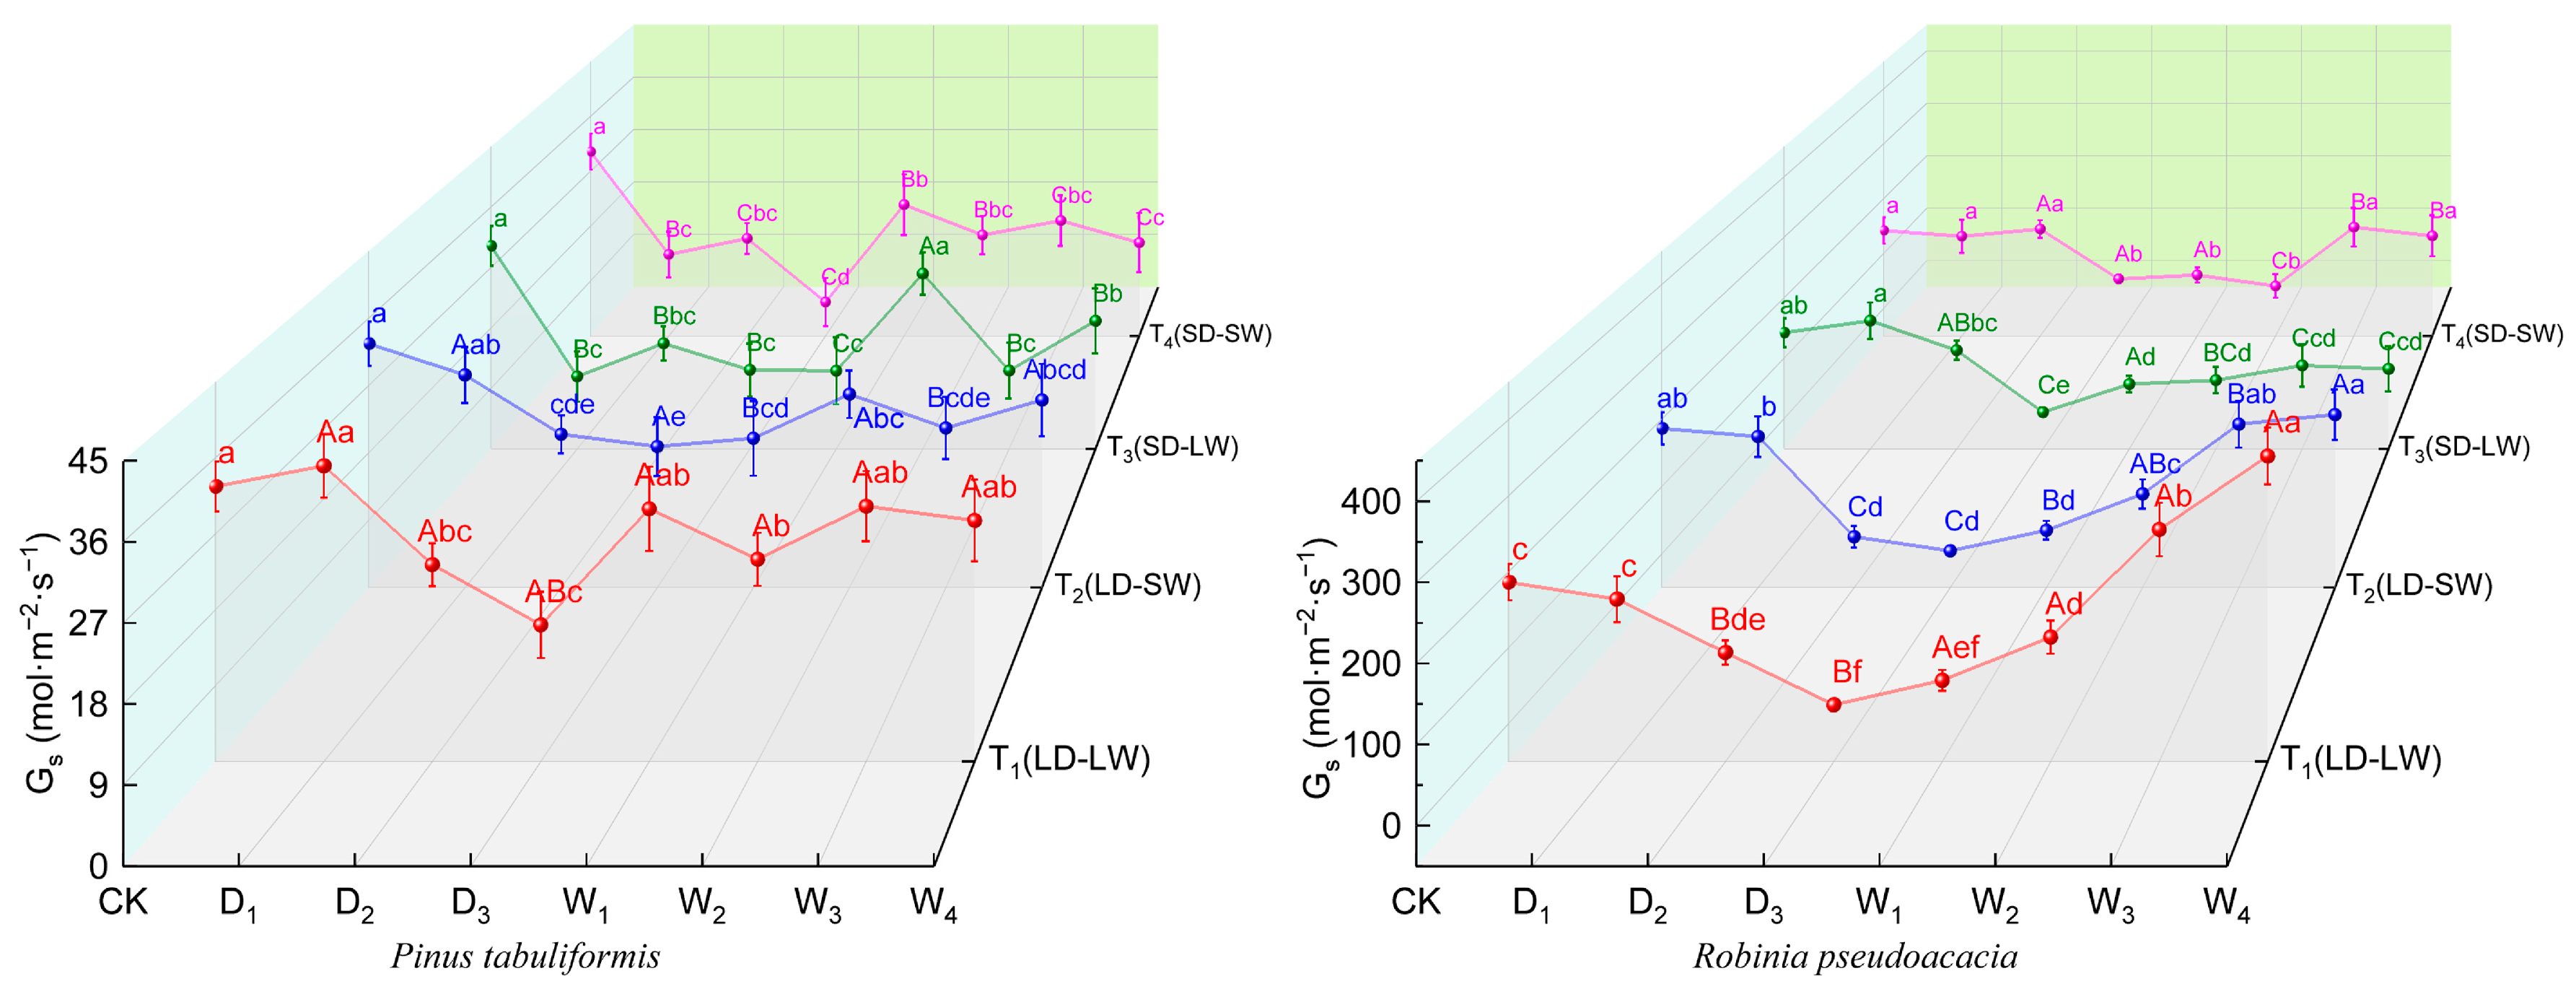
During drought progression, stomatal conductance (Gs) responses in both species showed significant interactions with the light environment (Figure 4). Under full-light, P. tabuliformis exhibited a 46.33% reduction in Gs, whereas R. pseudoacacia exhibited a reduction of 92.16%. In shading drought conditions, declines in Gs intensified to 71.19% in P. tabuliformis and 77.29% in R. pseudoacacia.
The rehydration after drought highlighted the species-specific adaptive differences in recovery patterns (Figure 4). In P. tabuliformis, Gs recovery was significantly lower in low-light drought groups (T3, T4) compared to full-light drought groups (T1, T2). In contrast, R. pseudoacacia in full-light drought groups (T1, T2) exceeded the Gs in CK by 50.09%, while shading drought groups (T3, T4) remained 24.61% below the controls.

2.2.3. Transpiration Rate

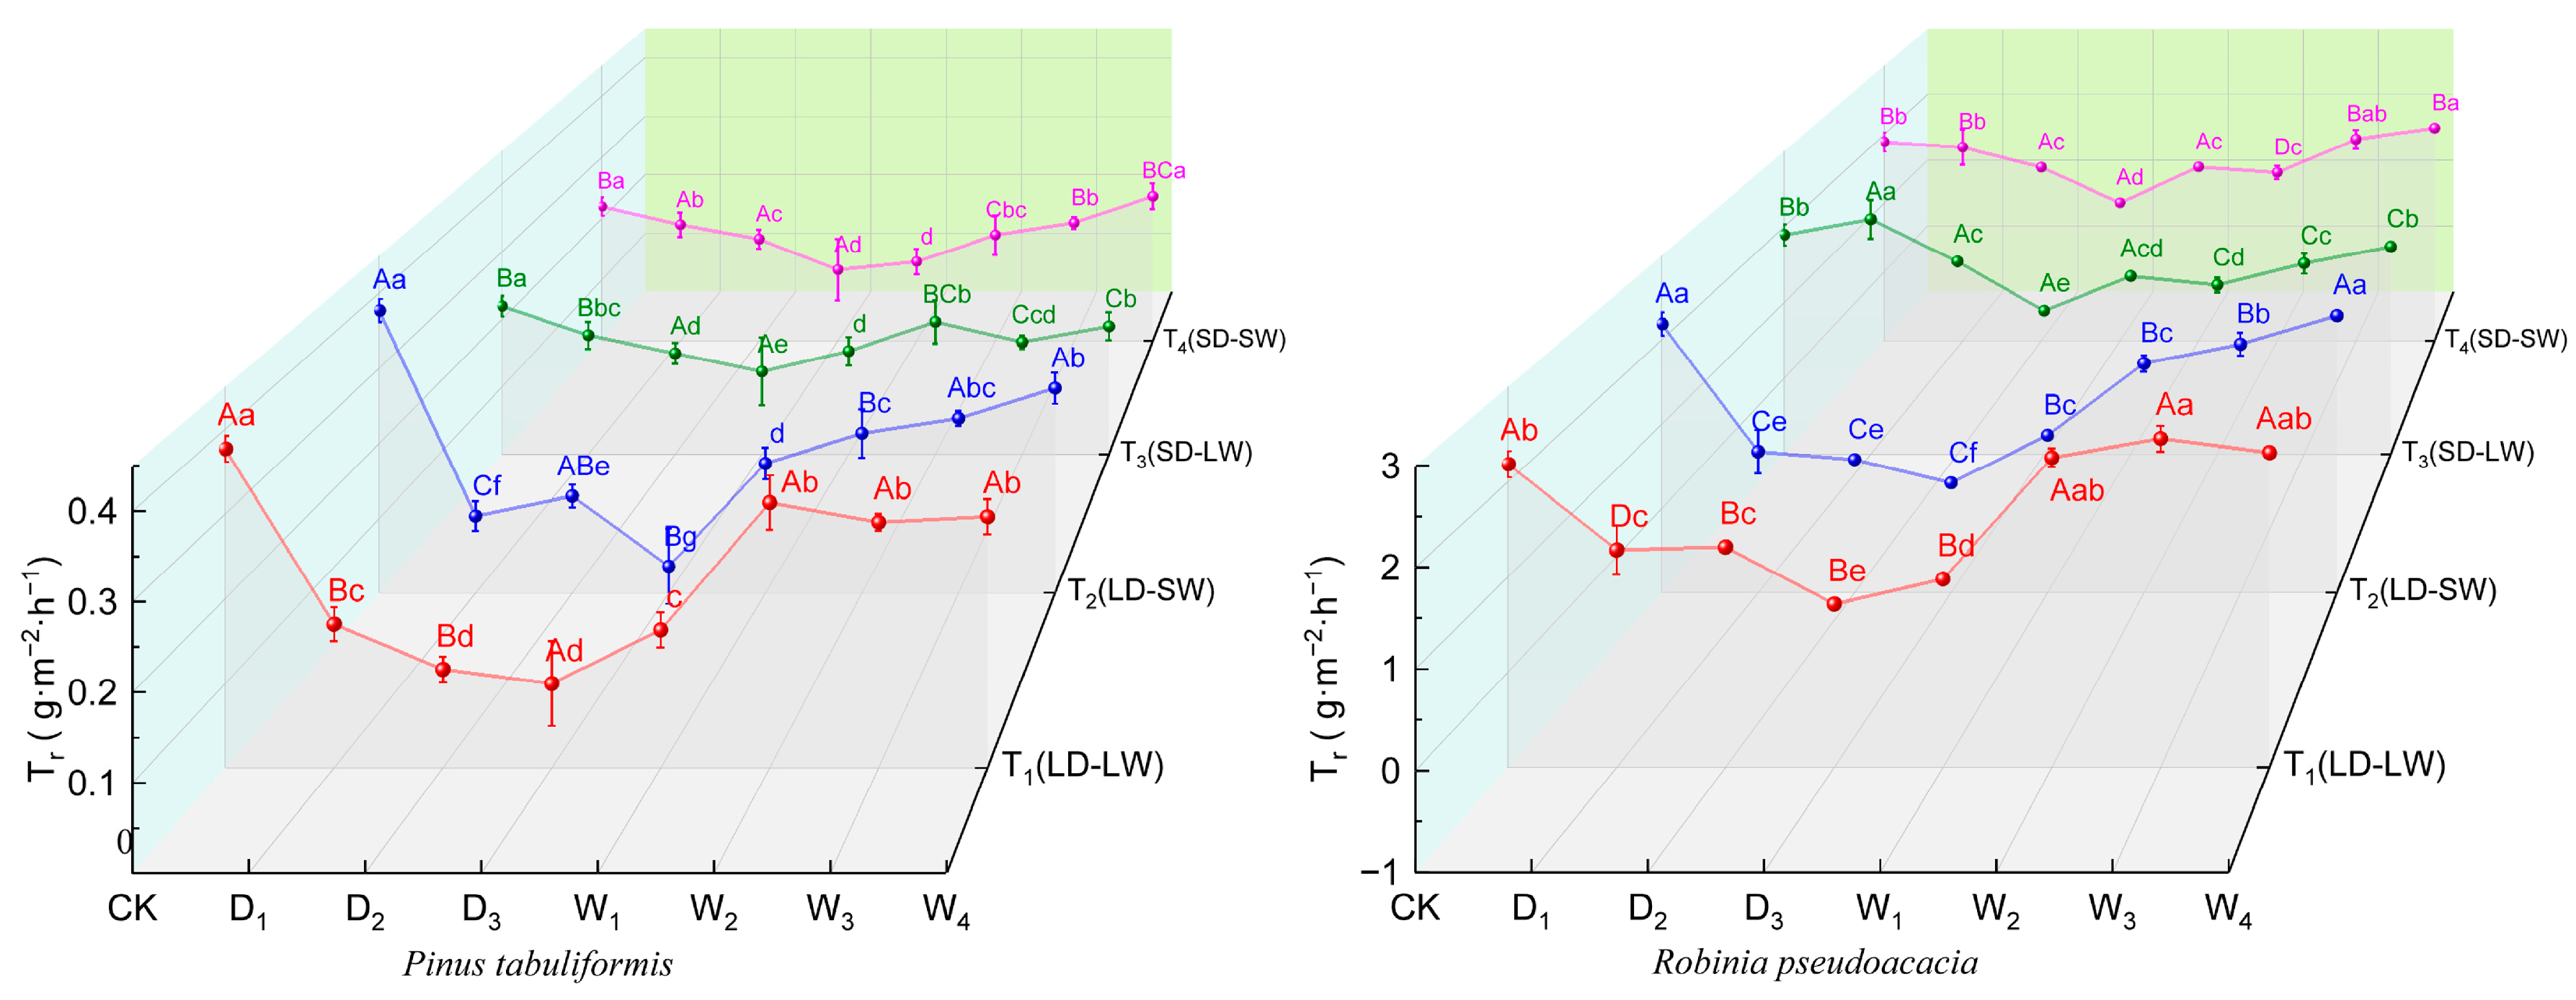
Under drought stress, both P. tabuliformis and R. pseudoacacia exhibited significant reductions in transpiration rate (Tr) with the distinct light environment interactions (Figure 5). In full-light conditions, P. tabuliformis showed an 81.85% reduction in Tr, which reduced to 77.05% in R. pseudoacacia. These reductions were 45.45% in P. tabuliformis and 49.82% in R. pseudoacacia in the shading–drought conditions.
During rewatering after drought, P. tabuliformis in the shaded drought groups (T3, T4) fully restored the Tr to the control levels, while the full-light drought groups (T1/T2) remained 27.05% below the controls (Figure 5). Although all treatment groups for R. pseudoacacia restored the Tr to the control levels, the consistently low-light rewatering group (T4) exhibited 17.22% higher Tr than the light-altered group (T3) in the rewatering stages.

2.3. Effects of Drought and Shade on Fluorescence Parameters of P. tabuliformis and R. pseudoacacia

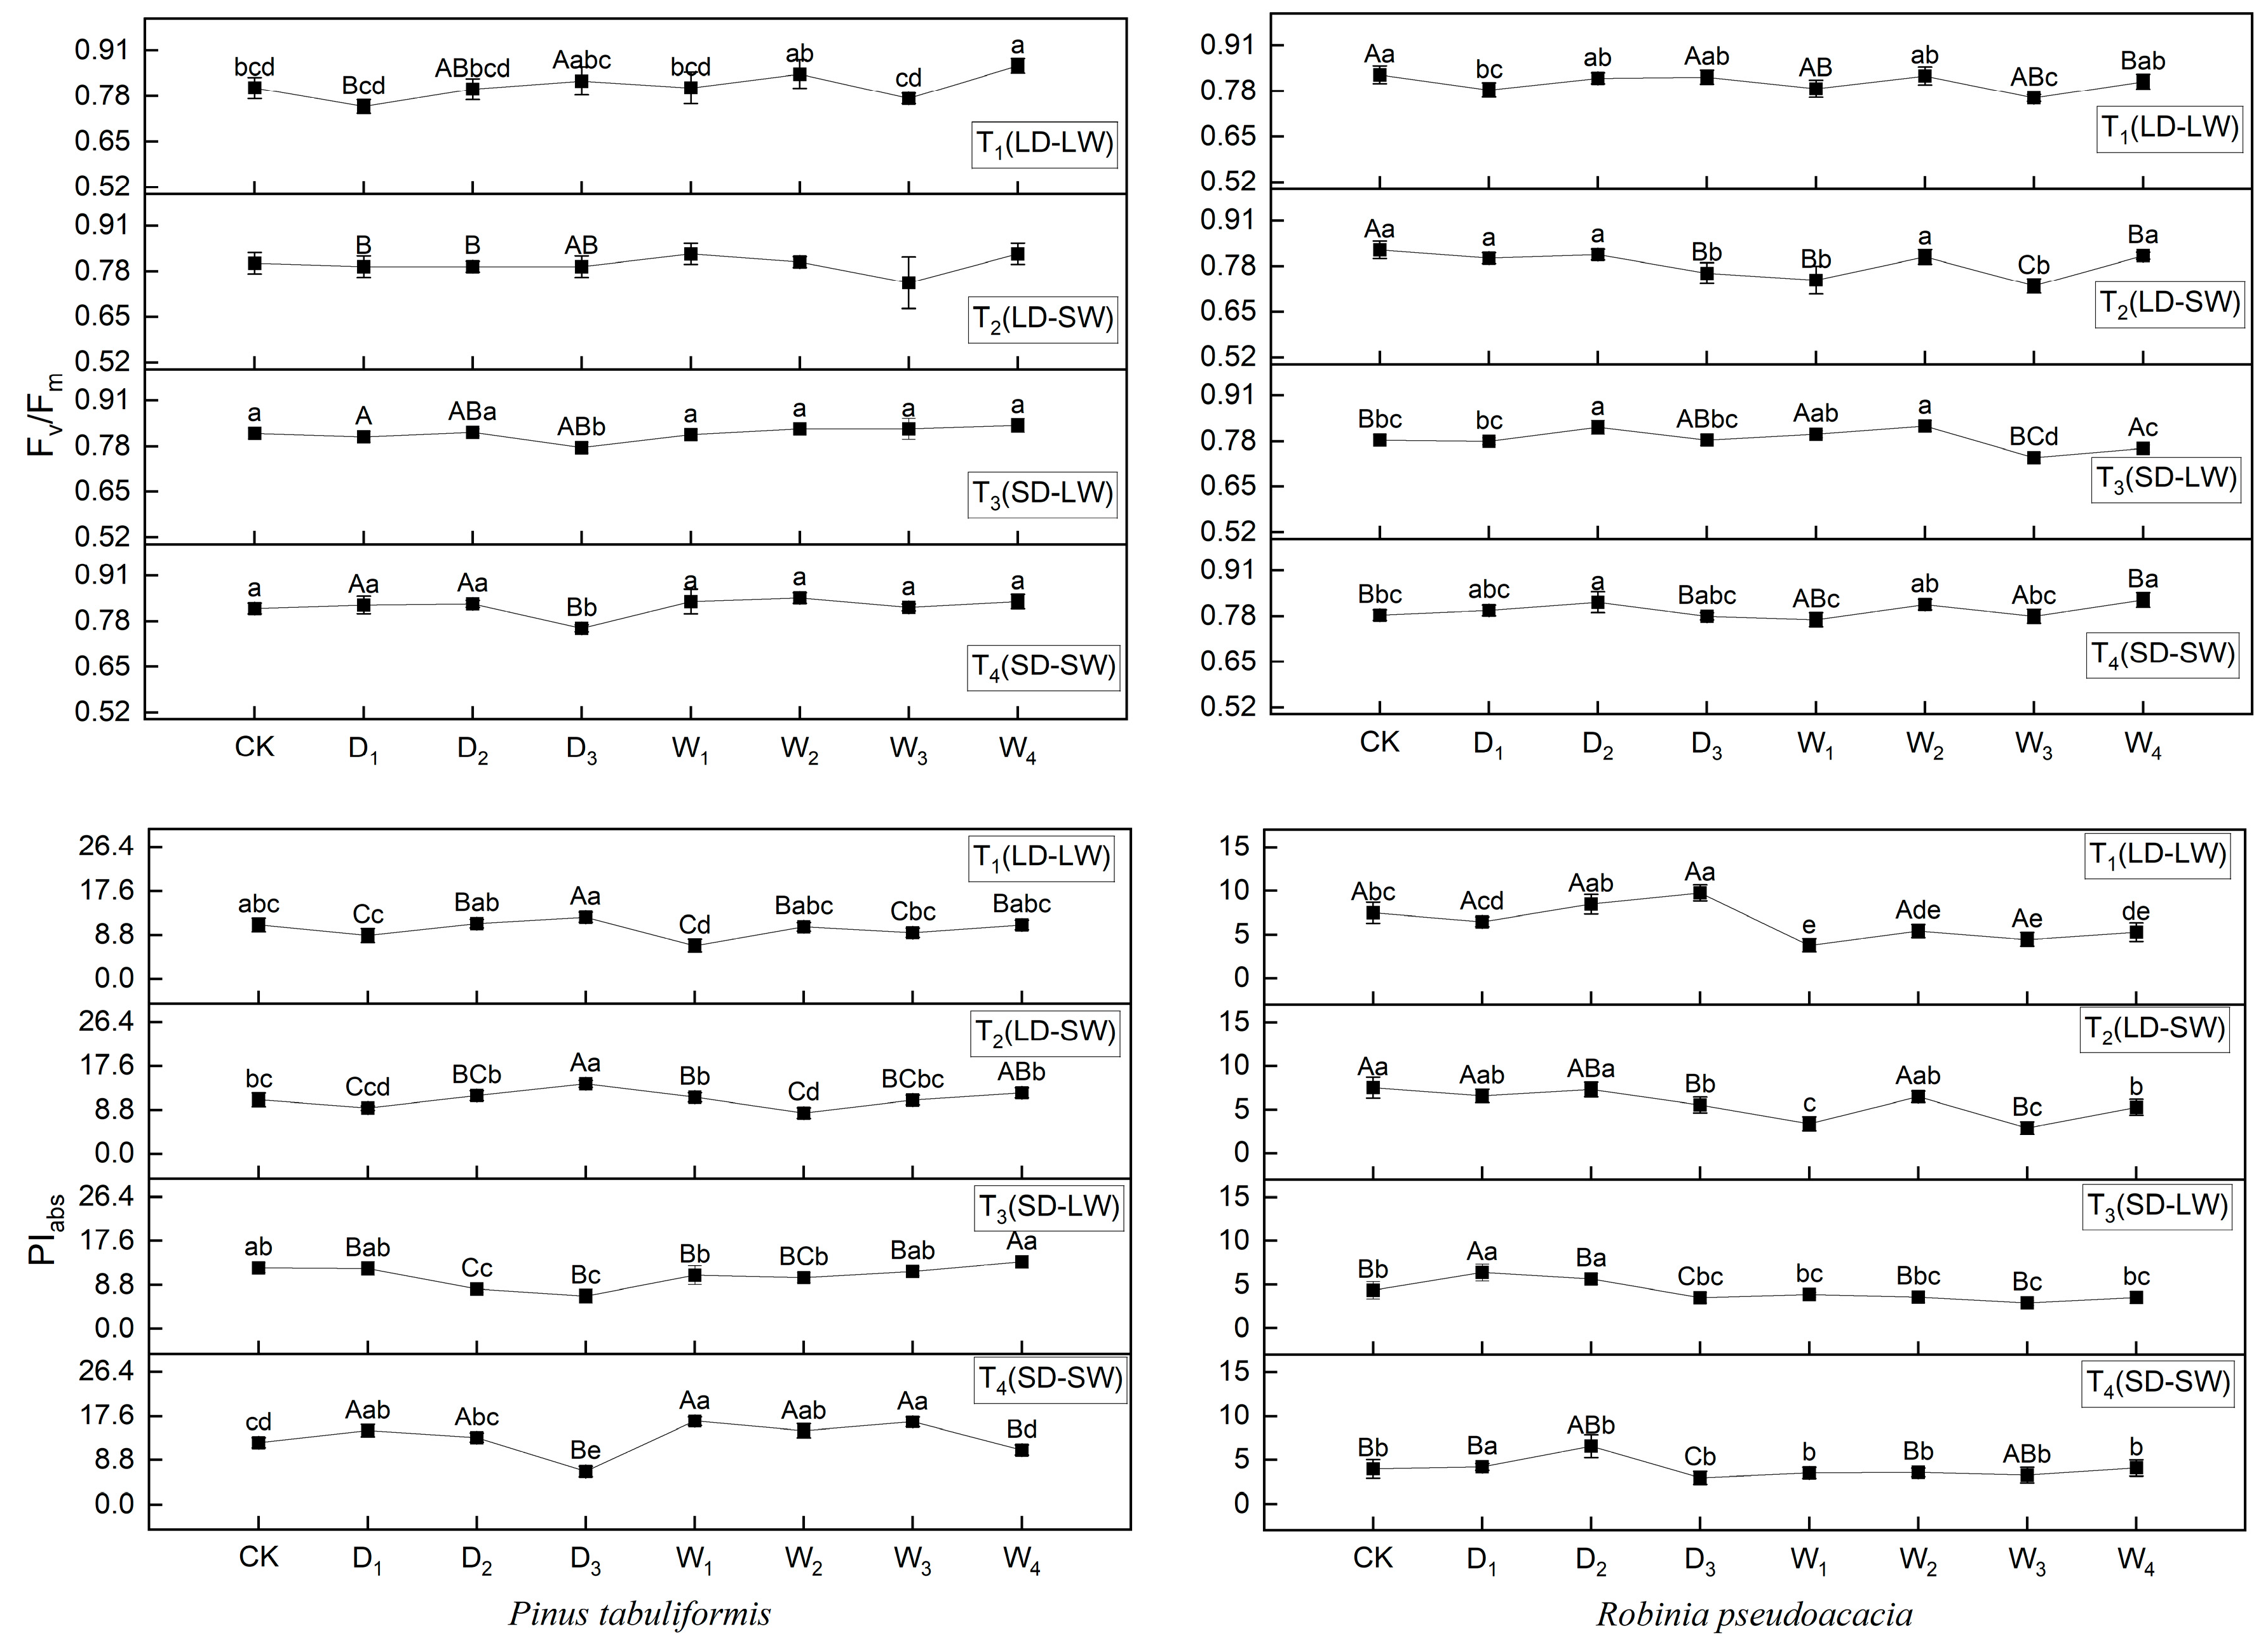
During drought, shading significantly affected the maximum photochemical efficiency and photosynthetic performance index (PIabs) of P. tabuliformis, with marked differences between full-light (T1, T2) and shaded (T3, T4) groups. PIabs increased under full-light conditions but decreased under shaded conditions. For R. pseudoacacia, PIabs was also significantly influenced by shading, showing substantial differences between full-light (T1, T2) and shaded (T3, T4) groups (Figure 6).
During rehydration, both species’ PIabs were essentially restored to control levels. However, significant differences in PIabs remained between the previously full-light (T1, T2). and shaded–drought (T3, T4) groups for both species by the end of rehydration.

2.4. Synergistic Effects of Drought and Shade on Plant Performance—Interaction Analysis

As shown in Table 2, during the drought stage, the SLA, LDW, Gs, Fv/Fm, and PIabs of P. tabuliformis were significantly affected by light conditions; during the rewatering stage, light conditions significantly influenced the recovery of LDW, Pn, and PIabs. During the drought stage, the LDW and Fv/Fm of R. pseudoacacia were significantly affected by light conditions; during the rewatering stage, these two parameters also showed significant recovery.
A simple effect analysis was conducted on the indicators with significant interactions in Table 2. The results show (Tables S1–S4) that regardless of the light conditions, the key indicators (SLA, LDW, Gs, Pn, Fv/Fm, PIabs) of the two tree species during the drought duration and the rehydration stage mostly show significant differences over time, indicating that the drought stage, rehydration time, and light jointly determine the physiological response trajectory.

2.5. Correlations Between Drought-Restoration Duration and Plant Physiological Indicators

2.5.1. Correlations Between Drought-Rehydration Duration and Physiological Indicators in P. tabuliformis

The shading stages during drought showed significantly different physiological effects (Table 3). In full-light drought conditions (T1, T2), dry matter accumulation and photosynthetic capacity were affected, with drought duration (Dn) showing highly significant negative correlations (p < 0.01) with most physiological parameters (RWC, LDW, Gs, Tr). Under shading (T3, T4), drought duration not only significantly affected photosynthetic parameters but also showed more pronounced negative correlations with chlorophyll fluorescence parameters (T3, Dn-Fv/Fm: −0.578 *, Dn-PIabs: −0.884 **; T4, D2–3-Fv/Fm and PIabs: −0.974 **).
Shading during drought significantly influenced physiological responses (Table 3). Under full-light drought (T1, T2), Dn showed highly significant negative correlations (p < 0.01) with most physiological parameters (RWC, LDW, Gs, Tr). Under shaded conditions (T3, T4), drought duration not only significantly affected photosynthetic parameters but also showed more pronounced negative correlations with chlorophyll fluorescence parameters (T3, Dn-Fv/Fm: −0.578 *; Dn-PIabs: −0.884 **; T4, D2–3-Fv/Fm: −0.974 **, D2–3-PIabs: −0.974 **).
The impacts of light conditions during rehydration on post-drought physiological recovery in P. tabuliformis varied significantly (Table 3). Full-light rehydration (T1) significantly enhanced short-term transpiration recovery (W0.25–0.5-Tr: 0.959 **). By contrast, low-light rehydration promoted superior long-term transpiration recovery (T2, Wn-Tr: 0.658 *). Comparing rehydration stages after shaded drought (T3, T4), full-light rehydration (T3) rapidly activated short-term stomatal recovery (W0.25–0.5-Gs: 0.955 **). In T4, prolonged low-light rehydration had highly significant negative correlations with Pn and PIabs (W1–7-Pn: −0.923 **, W1–7- PIabs: −0.959 **).
The legacy effects of pre-drought light conditions differentially influenced rehydration outcomes (Table 3). Comparing full-light rehydration groups with pre-drought light exposures (T1, T3), plants with full-light drought exposure showed better photosystem stability recovery (T1, W1–7-Fv/Fm: 0.953 **) than those with shaded drought. Analysis of low-light rehydration groups (T2, T4) revealed that prolonged low-light rehydration consistently impaired Pn in P. tabuliformis (T2, W1–7-Pn: −0.918 **; T4, W1–7-Pn: −0.923 **).

2.5.2. Correlations Between Drought-Rehydration Duration and Physiological Indicators in R. pseudoacacia

The physiological impacts of shading during drought varied (Table 4). Under full-light drought (T1, T2), drought duration (Dn, D1–2) showed highly significant negative correlations (p < 0.01) with most physiological parameters (RWC, LDW, Pn, Gs, Tr). Conversely, shaded drought stages promoted dry matter accumulation (T3, Dn-SLA: 0.963 **; T4, Dn-SLA: 0.958 **). Prolonged shaded drought still exacerbated photosystem damage (T3, D2–3-PIabs: −0.904 *; T4, D2–3-PIab: −0.901 *).
The impacts of light conditions during rehydration on post-drought physiological recovery in R. pseudoacacia varied significantly (Table 4). Comparing rehydration stages after full-light drought (T1, T2), prolonged low-light rehydration more effectively restored the light–energy utilization system (T1, W1–7-Fv/Fm: 0.868 *; T2, W1–7-Fv/Fm: 0.956 **, W1–7-PIabs: 0.870 *). Comparing rehydration stages after shaded drought (T3, T4), low-light rehydration showed a highly significant positive correlation between W1–7 and Pn (0.974 **).
The legacy effects of pre-drought light conditions differentially influenced rehydration outcomes in R. pseudoacacia (Table 4). For full-light rehydration groups (T1, T3), plants with prior full-light drought (T1) showed greater relative increase. For low-light rehydration groups (T2, T4), full-light drought plants (T2) maintained strong positive Wn-SLA correlations (0.771 **), and shaded–drought plants (T4) showed negative associations (−0.707 *).

2.6. Analysis of Synergistic Effects Between Leaf Traits, Photosynthesis, and Fluorescence Parameters in P. tabuliformis and R. pseudoacacia

2.6.1. Correlation of Parameters of P. tabuliformis in Four Treatment Groups

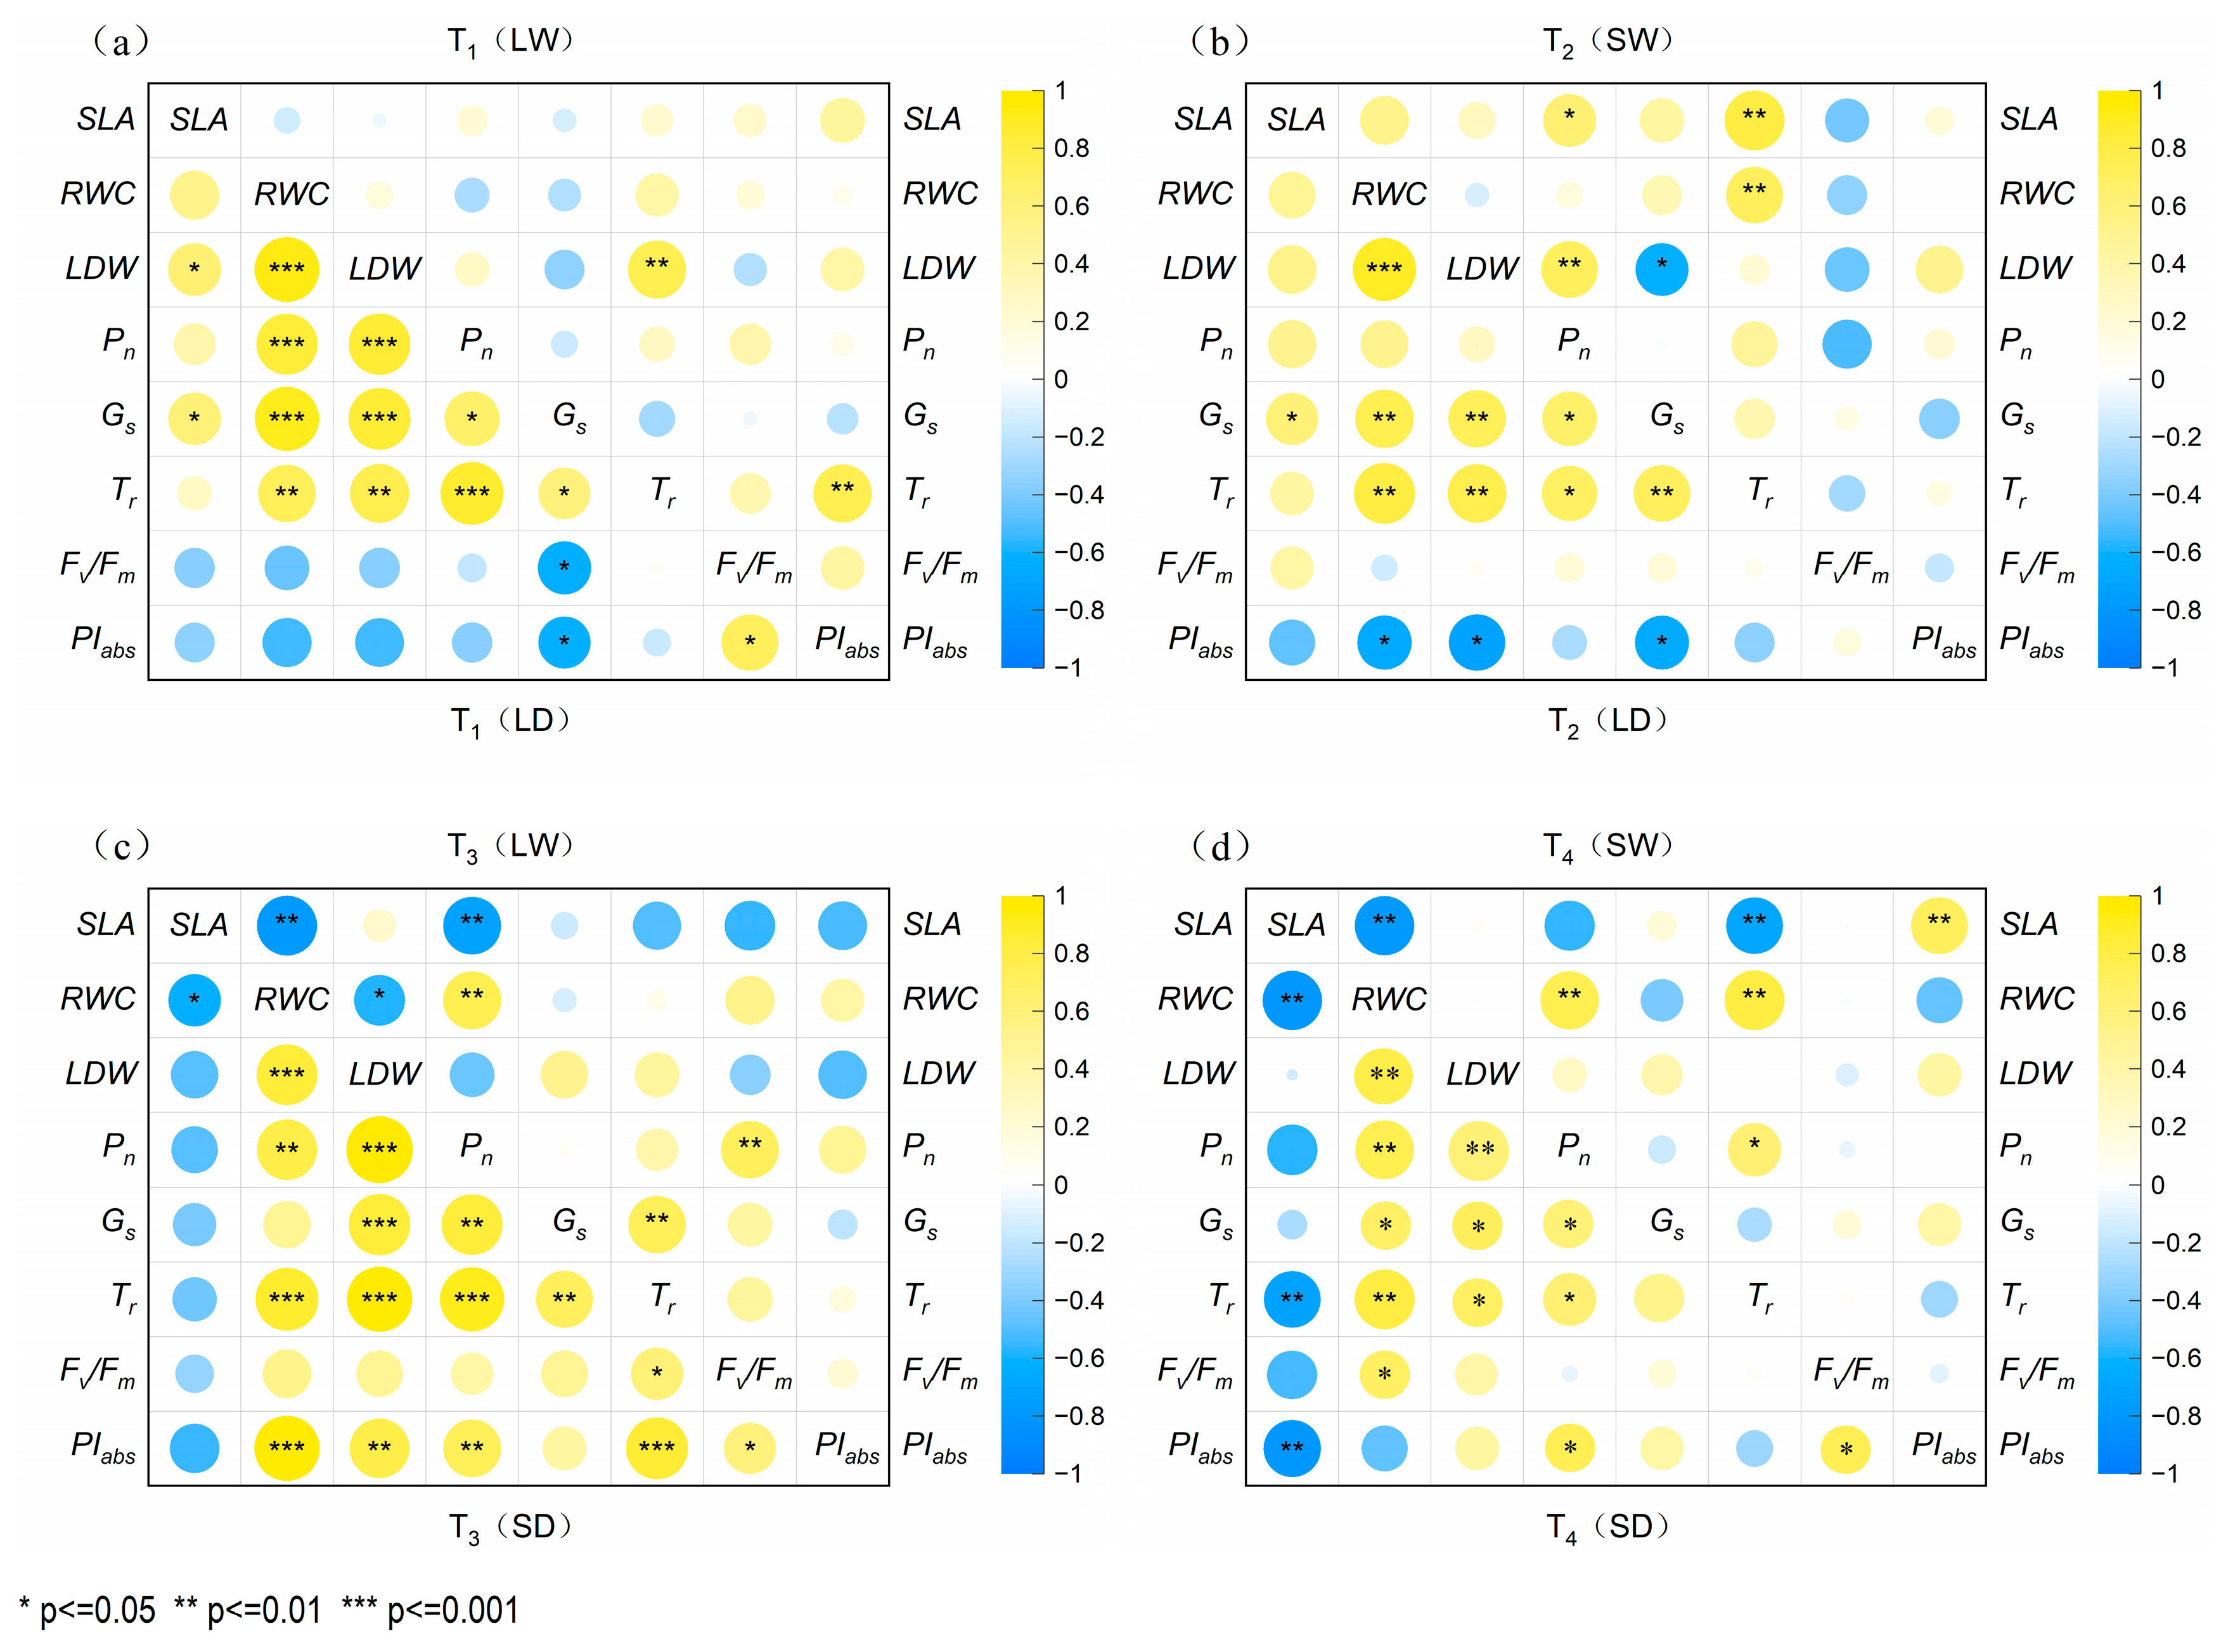
As shown in Figure 7a,b, parameter correlations were significantly altered by low-light rehydration following full-light drought (T2). In the full-light rehydration group (T1), Tr showed highly significant positive correlations with both LDW and PIabs (p < 0.01). Low-light rehydration induced significant positive correlations between Pn and LDW/SLA (p < 0.05), while establishing a negative correlation between Gs and LDW.
As shown in Figure 7c,d, the pre-shaded drought stage groups exhibited distinct response patterns during rehydration. Full-light rehydration (T3) resulted in highly significant negative correlations (p < 0.01) between SLA and both Pn and RWC. In contrast, low-light rehydration (T4) established a highly significant positive correlation (p < 0.01) between SLA and PIabs.
Under full-light rehydration (Figure 7a,c), the T3 group with prior shading showed inhibited SLA recovery, exhibiting significantly stronger negative correlations with photosynthetic parameters than the T1 group. Under low-light rehydration (Figure 7b,d), the T4 group with prior shading demonstrated significantly stronger positive SLA-PIabs correlations after continuous low-light rehydration than the non-shaded T2 group.

2.6.2. Correlation of Parameters of R. pseudoacacia in Four Treatment Groups

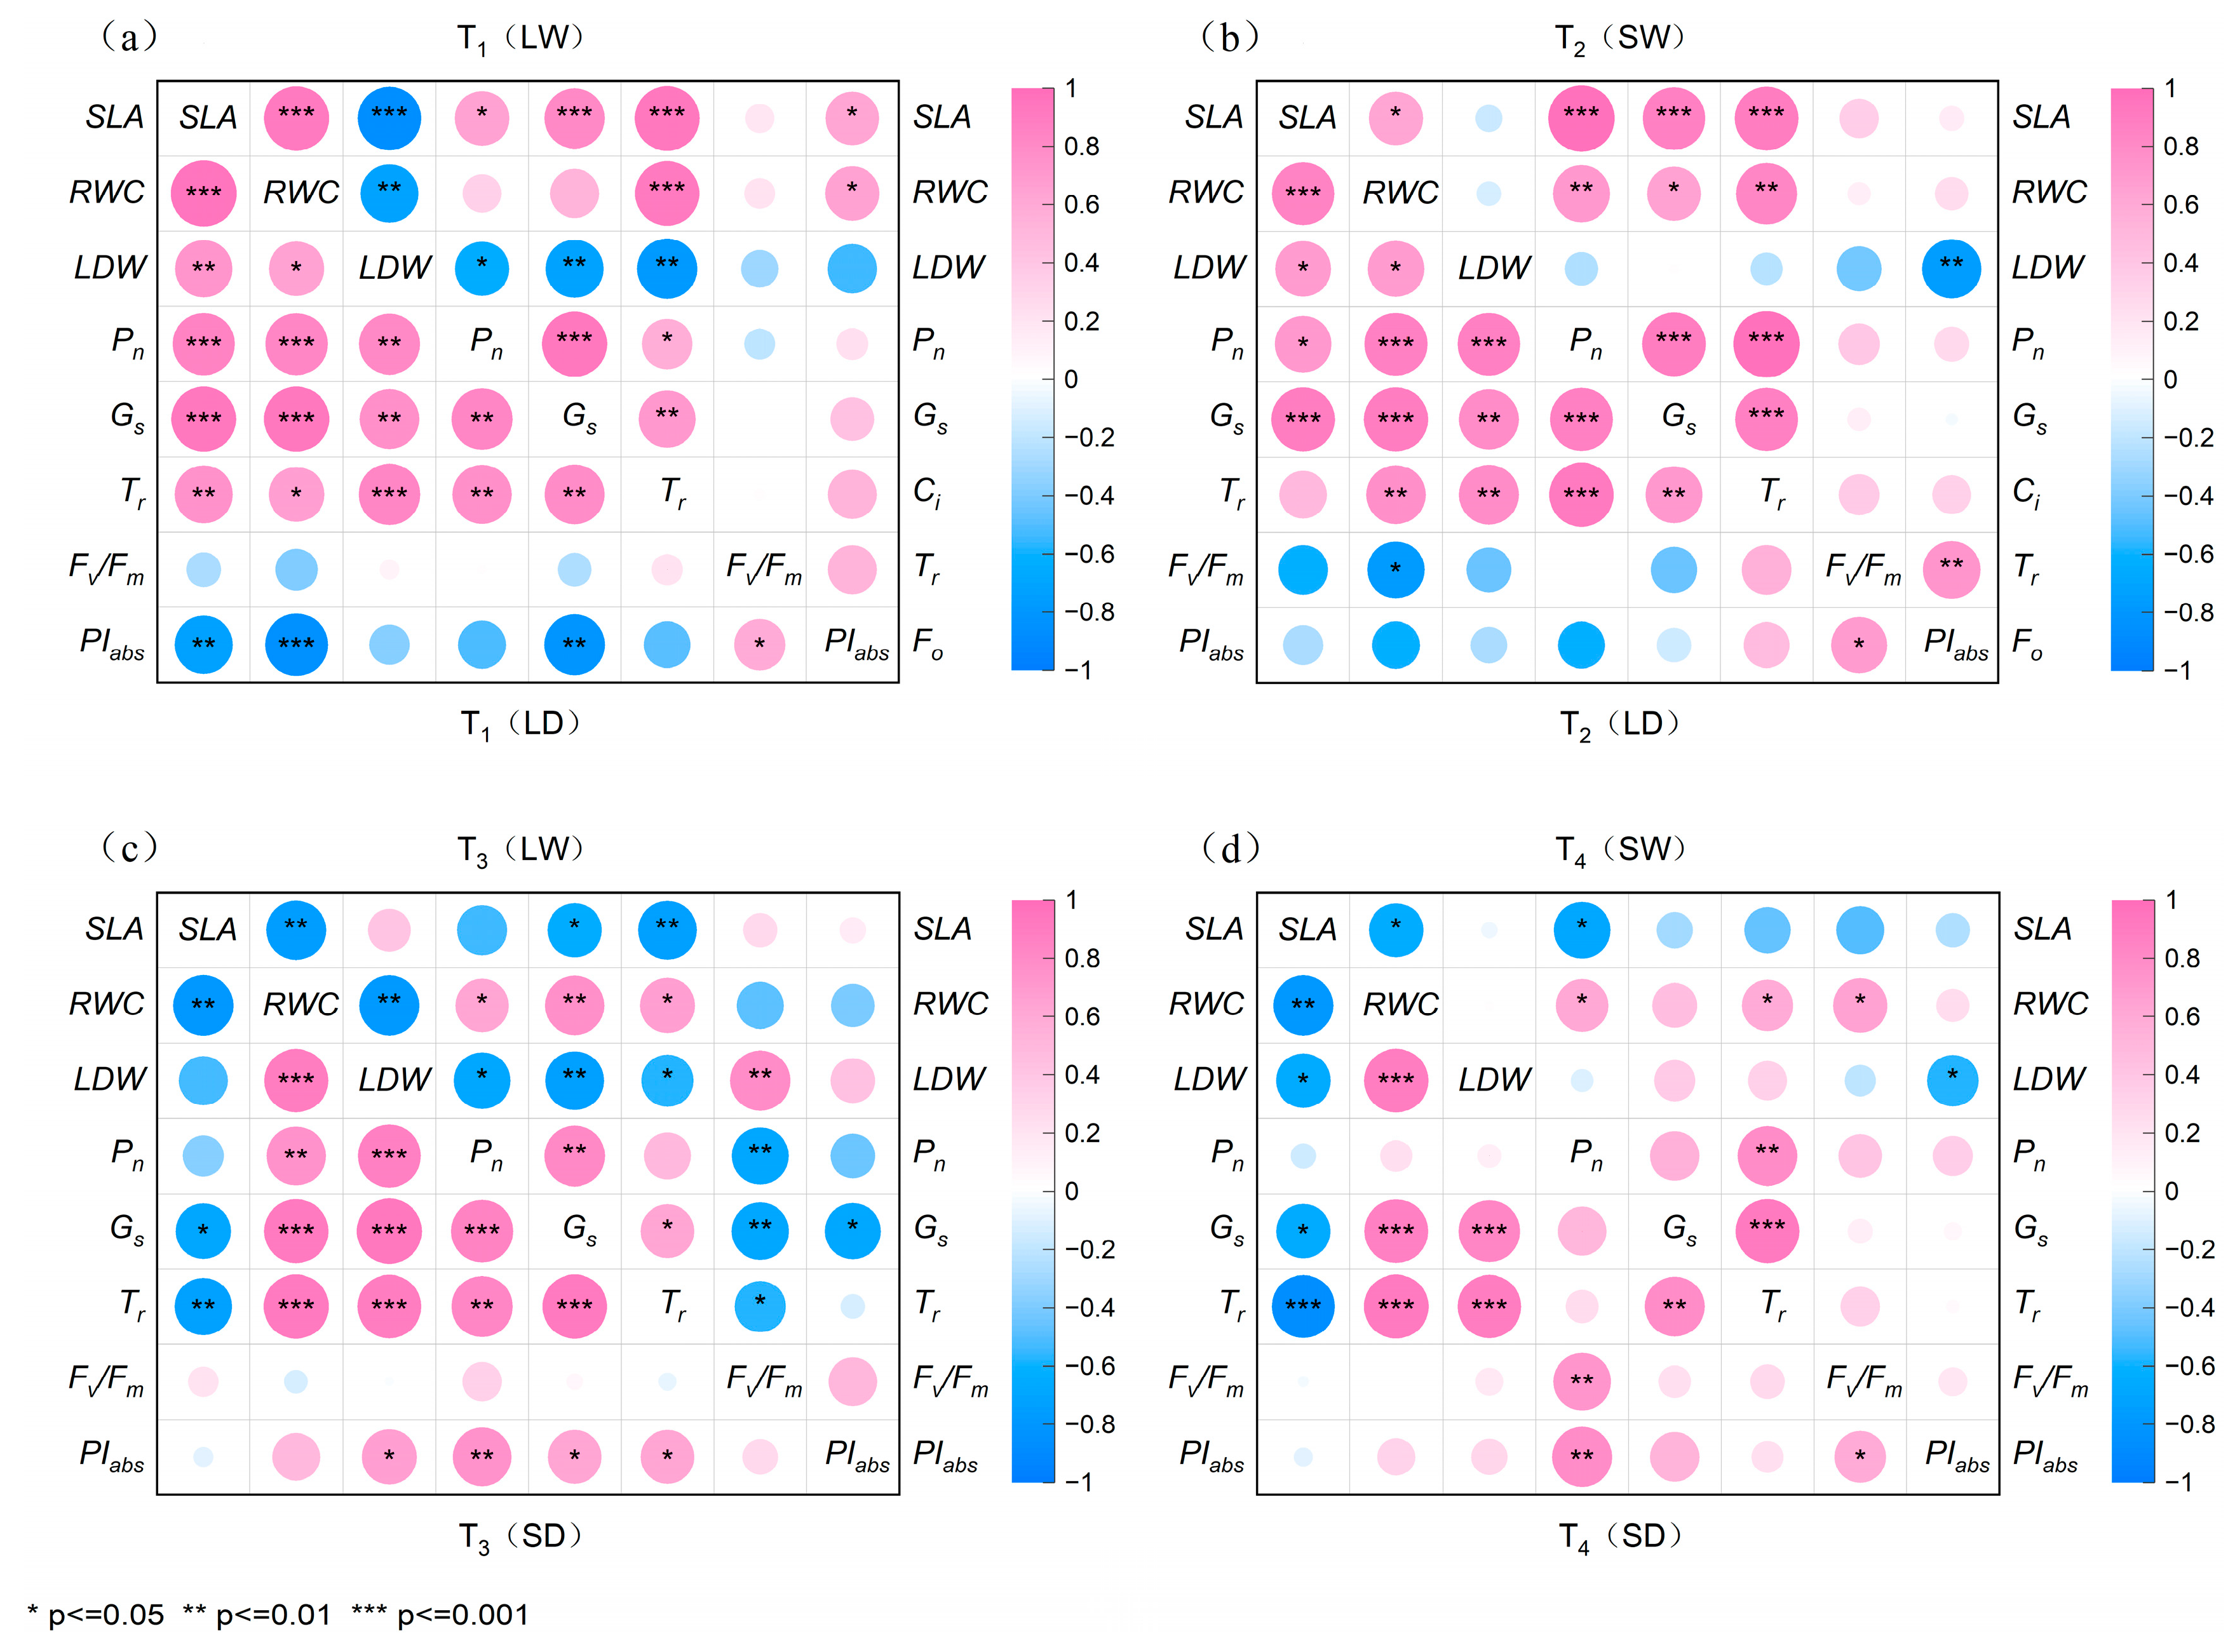
As shown in Figure 8a,b, full-light rehydration (T1) showed significant negative correlations between LDW and other parameters while weakening the associations between fluorescence parameters and other physiological indicators. In contrast, low-light rehydration (T2) reduced the correlation strength between LDW/fluorescence parameters and other metrics, with LDW and PIabs exhibiting a highly significant negative correlation (p < 0.01).
As shown in Figure 8c,d, full-light rehydration (T3) preserved the predominant negative correlations between SLA and other parameters, while significantly strengthening negative relationships involving both LDW and Fv/Fm with other metrics. Notably, LDW and Fv/Fm showed a highly significant positive correlation (p < 0.01) under T3. Under low-light rehydration (T4), inter-parameter correlations generally weakened. However, Tr and Pn developed a highly significant positive relationship (p < 0.01), and PIabs and LDW showed a significant negative correlation (p < 0.05).
Under full-light rehydration (Figure 8a,c), the T3 group with prior shaded drought showed significantly stronger negative correlations between SLA and photosynthetic parameters than those in the T1 group (p < 0.01). Under low-light rehydration (Figure 8b,d), the continuously shaded T4 group had a significantly weaker negative correlation between PIabs and LDW than the T2 group.

3. Discussion

3.1. Differential Effects of Full-Light/Shade Drought and Rehydration on Leaf Traits and Photosynthetic and Fluorescence Parameters

Leaves serve as the primary sites for photosynthesis and respiration in plants, and they are the organs most sensitive to environmental changes [24]. Specific leaf area (SLA), defined as the ratio of leaf area to leaf dry mass, is a key indicator reflecting a plant’s capacity to utilize light resources. Under shading, plants often increase their SLA to enhance light capture, thereby improving the efficiency of light—energy capture per unit of leaf dry weight [25]. Previous research has demonstrated significant differences in shading—adaptation strategies between evergreen and deciduous species. Deciduous saplings are more sensitive than evergreen ones to changes in light effectiveness in growth characteristics, SLA, and dry-weight allocation [26]. In the present study, during the drought phase, shading assisted P. tabuliformis in maintaining its SLA but led to a substantial increase in the SLA of R. pseudoacacia. During the post-drought rehydration period, appropriate shading may be beneficial for R. pseudoacacia. It can mitigate photoinhibition at the initial stage of rehydration and promote leaf-area expansion, thus enhancing the plant’s adaptability to fluctuating-water environments.
Leaf relative water content (RWC) represents a critical indicator of plant water status and drought tolerance. As stress intensifies, RWC exhibits a downward trend. In the current investigation, the leaf RWC of P. tabuliformis and R. pseudoacacia demonstrated a significant decrease with the escalation of drought stress, which aligns with findings from prior studies [27,28]. During the drought phase, shading exacerbated the suppression of RWC in R. pseudoacacia, whereas it exerted a lesser impact on P. tabuliformis. The results of the rehydration experiment indicated that a stable shaded environment facilitated the recovery of RWC in P. tabuliformis, potentially attributed to the lag in chloroplast elastic regulation in this species.
In the present study, drought stress significantly reduced the leaf dry weight (LDW) of P. tabuliformis and R. pseudoacacia, with additional shading exacerbating this reduction. This finding is consistent with previous investigations [29,30]. Notably, the LDW of P. tabuliformis demonstrated high sensitivity to shading stress under drought conditions, whereas R. pseudoacacia exhibited minimal LDW variation. This suggests that for P. tabuliformis in drought-prone habitats, continuous light availability is critical to maintain the carbon source required for LDW accumulation. In contrast, R. pseudoacacia appears to accumulate leaf dry weight by regulating leaf growth, increasing specific leaf area, and optimizing light capture in shaded environments. Following rewatering, the LDW of both species failed to recover to control levels, which may be attributed to irreversible adjustments in carbon allocation strategies [31,32,33].
Drought and shading are key environmental factors that suppress plant photosynthesis. Drought stress induces stomatal closure, reduces photosynthetic enzyme activity, and decreases CO2 permeability of the cuticular cell wall, collectively leading to suppressed photosynthetic capacity [34]. Excessively low-light intensities also hinder the accumulation of photosynthetic products [35]. In this study, as soil water content declined, the photosynthetic parameters—net photosynthetic rate (Pn), stomatal conductance (Gs), and transpiration rate (Tr)—of young trees of all species gradually decreased, aligning with previous research results [36,37]. When shading occurs during drought, it exacerbates drought damage and stomatal closure in P. pseudotabulacea. In contrast, R. pseudoacacia uses shading to mitigate photo-oxidative stress. Compared to P. tabuliformis, P. pseudotabulacea exhibits more extreme stomatal restriction to avoid photodamage risks.
Changes in transpiration rates indicate that stomatal regulation in P. tabuliformis and R. pseudoacacia is more sensitive to light-environment changes. This reflects a conservative strategy in both species to maintain water transport through a shaded environment during drought stress [38,39]. The Pn of both tree species did not recover to the control level after rewatering. The Gs recovery of P. tabuliformis in the shaded drought stage groups (T3, T4) was significantly lower than that in the full-light drought groups (T1, T2), a discrepancy attributed to the delayed recovery of chloroplast ultrastructure damage and Rubisco enzyme activity [40,41]. However, R. pseudoacacia showed a super compensatory effect after rewatering in the full-light drought group [40,42]. In P. pseudotabulacea and R. pseudoacacia, resetting the light environment after rewatering may positively regulate P. pseudotabulacea’s stomatal function recovery. Transpiration recovery results show that a stable shaded environment favors water transport system restoration. The stomatal regulation strategy and transpiration recovery of R. pseudoacacia suggest the presence of an environmental memory effect [11,43].
In plant physiological ecology, Fv/Fm serves as a key indicator of PSII primary light–energy conversion efficiency in leaves, which is typically in the range of 0.75 to 0.85 for normally growing plants [44]. In this study, the Fv/Fm of both P. tabuliformis and R. pseudoacacia remained above 0.75, indicating strong adaptability under the given conditions. Despite fluctuations, Fv/Fm showed overall stability, suggesting that plant growth could normalize if stressors are removed [33,45]. PIabs indicates the efficiency of light–energy utilization during photosynthesis and the ability to adapt to environmental stresses. In this study, under full-light drought, P. tabuliformis and R. pseudoacacia showed significantly more effectively PIabs than under shade drought. Additionally, the pre-drought environmental conditions influenced the recovery dynamics during rehydration. This implies healthier photosynthetic apparatus and better photosynthetic acclimatization under full-light drought, while shading worsened drought damage [46,47].

3.2. Correlation of Full-Light/Shade Drought and Rehydration Time Dynamics with Physiological Response

In the drought stage, the degree of photosynthetic inhibition, water loss, and photosystem damage in plants progressively intensifies with the prolongation of stress duration. The efficiency of recovery after rehydration is contingent upon the physiological repair capacity within different time windows [48,49,50]. In this study, drought duration (Dn) exhibited a significant negative correlation with most physiological indices in both P. tabuliformis and R. pseudoacacia (p < 0.01). This indicates that the cumulative effect of stress intensifies with increasing drought duration, which is consistent with the findings of Diawara [51], Nawaz [52], and Li [53]. P. tabuliformis showed no significant positive correlation between SLA and Dn under shading drought. This suggests that the conservative light–energy utilization strategy of P. tabuliformis relies more on functional stability than morphological adjustments—a finding also supported by Wang [54] and Deng [55]. In contrast, R. pseudoacacia exhibited a highly significant positive correlation between SLA and Dn under shading drought stages. This implies that R. pseudoacacia enhances light-capture capacity through morphological plasticity to partially offset photosystem damage caused by drought stress [56].
During the rehydration phase, the light environment regulated recovery efficiency in a species-specific way. For P. tabuliformis during short-term rehydration (W0.25–0.5), full-light rehydration significantly promoted the rapid recovery of stomatal conductance (Gs), while continuous low-light rehydration (W1–7) inhibited the restoration of its photosystem. This suggests that the photosystem restoration of P. tabuliformis is highly dependent on sustained light input during the later stages of rehydration [57]. Conversely, R. pseudoacacia showed higher light–energy utilization efficiency under shaded and rehydration conditions, which might be related to shading alleviating photo-oxidative stress and maintaining PSII stability [58].
In addition, the legacy effects of pre-existing light environments significantly impacted the rewetting recovery potential. Following rehydration of the pre-shaded drought group, the negative correlation between SLA and photosynthetic parameters was stronger in P. tabuliformis (T3) than in the full-light drought group (T1). This indicates that pre-stress shading weakened the synergistic restoration of leaf morphology and photosynthetic function. In R. pseudoacacia, shading and rewetting following the initial full-light drought (T2) enhanced the positive correlation between SLA and Pn, thereby optimizing resource allocation efficiency. This confirms the flexibility of its spatio-temporal compensation strategy.

3.3. Synergistic Mechanisms of Leaf Traits and Photosynthetic Performance Under Full-Light/Shade Drought and Recurring Water

The ability of plants to survive under multiple stresses is intimately associated with the synergistic efficiency of leaf traits and photosynthetic performance [59,60]. This study reveals that P. tabuliformis and R. pseudoacacia employ very different strategies to mitigate combined drought and shade stress. P. tabuliformis prioritizes protecting photosystem integrity by maintaining stable leaf morphology, while R. pseudoacacia achieves efficient resource use through rapid adjustments of morphological plasticity and physiological flexibility [54]. This divergence is deeply rooted in the evolutionary trajectories of the two species. P. tabuliformis, an evergreen conifer with a needle-like structure, has limited plasticity adjustments and relies on functional stability. Its strategy focuses on maintaining leaf water content to adapt to drought and sustain normal physiological activity [61]. In contrast, R. pseudoacacia, a deciduous broad-leaved tree, can expand leaf area to enhance light–energy capture and balance light and water use through dynamic stomatal regulation [62,63]. However, shading only slowed the decline in photosynthesis of R. pseudoacacia under drought, still causing irreversible damage and impaired its post-drought photosynthetic recovery under normal moisture conditions. These findings validate Holmgren’s “trade-off theory” [14] and reveal species-specific ‘temporal-spatial compensatory strategies’ in stress synergism.
P. tabuliformis exhibits more dry matter by increasing photosynthesis under shading and rehydration, potentially mediated by leaf area expansion to facilitate light capture [8,64]. However, large stomatal openings may increase water loss, thereby imposing trade-offs on dry matter accumulation [65]. Under the combined shade–rewatering treatment, the Pn of R. pseudoacacia was markedly suppressed. This “down-regulation” alleviated photoinhibition by reducing excessive excitation pressure on PSII reaction centers [66]. The shade-induced increase in SLA enhances light interception, yet this increment constrains the supply of ATP for stomatal regulation in low-light environments. Consequently, psbA transcription–translation slows, hindering D1 protein cleavage and replacement, and prolonging the restoration of the PSII repair cycle [67,68]. As a result, although leaves capture more photons and the proportion of fully functional PSII declines, photochemical quenching (ΦPSII) and Pn remain low, and the net accumulation of photosynthetic products actually decreases.
P. tabuliformis enhanced its low-light adaptive response through morphological and physiological adjustments following shading exposure, increasing the efficiency of photosynthesis and growth potential under rehydrated conditions [69]. At this stage, the guard cells of P. tabuliformis moderately restrict stomatal aperture, thereby balancing carbon gain with water loss [70]. However, shading pre-stress exacerbated the asynchronous nature of R. pseudoacacia leaf anatomy reconstruction and photosynthetic function recovery. This may be because shading enhances its light-absorbing capacity, yet insufficient light limits the ATP supply to Rubisco activase, lowering photosynthetic enzyme activity and reducing the efficiency of converting light into dry-mass gain; this reduction is partially alleviated after rewatering [71,72,73].

4. Materials and Methods

4.1. Materials

The study used three-year-old saplings of two typical Beijing urban trees: P. tabuliformis and R. pseudoacacia. In late March 2021, the saplings were transplanted into 45 cm × 45 cm pots with soil from Beijing’s Xishan Mountain. Placed in the nursery of the Institute of Forestry and Fruit Tree Research, Beijing Academy of Agricultural and Forestry Sciences (39°59′ N, 116°13′ E, 88 m above sea level), the saplings were grown under uniform light and water conditions.

4.2. Treatment Design

Saplings Preparation: At the end of February 2021, a total of 130 three-year-old saplings of P. tabuliformis and R. pseudoacacia were selected and planted in 45 cm × 45 cm plastic pots measuring at Institute of Forestry and Fruit Research, Beijing Academy of Agriculture and Forestry Sciences. During the acclimatization period, the saplings were irrigated to the 80–90% field capacity of potted soil to homogenize the height and basal diameter of saplings of two tree species, ensuring the uniformity of growth and physiological consistency. During the entire domestication and treatment period, the air temperature and relative humidity were continuously recorded every 1 h using the Weather Meter meteorological Station. The average daily temperature was 25.4 °C, and the average relative humidity was 50.3%. The environmental conditions for the growth of plant seedlings are natural light.
Treatment Design: In July 2021, all the above potted saplings were moved to a plastic shade house with both rain and shade functions. Four treatment groups and one control group (CK) were set up to carry out the experiment, with 30 young trees in each group and 10 in the control group. The treatment groups were T1 (LD-LW): 100% natural light radiation (full-light) throughout, with soil dried to wilting point (drought) followed by rewatering to field capacity (FC) of potted soil (recovery); T2 (LD-SW): full-light during drought, switched to low-light during recovery; T3 (SD-LW): 20% natural light radiation (low-light) during drought, switched to full-light during recovery; and T4 (SD-SW): low-light throughout, with soil rewatered to field capacity post-wilting.
The above treatments all included two stages: drought and rewatering. In the drought stage, 30 tree saplings of P. tabuliformis and R. pseudoacacia were respectively placed in a full-light or low-light shade house, and after irrigating to 80–90% field capacity of potted soil, watering was withheld to allow natural drought stress until the soil volumetric water content of the potted soil reached the preset threshold. During the rewatering stage, drought-stressed saplings were irrigated to field capacity under either full- or low-light, with soil moisture maintained at 80–90% field capacity thereafter. Shade condition was achieved using HDPE material shading nets, which have a shading rate of 80% and do not change the spectral characteristics, with the light intensity monitored by a TES1339 illuminance meter during shading. Drought condition was induced via natural soil drying, and the soil volumetric water content (SWC) of potted soil was measured using a portable soil sensor (WET-2, Delta T, Richfield, WI, USA).
Sampling Nodes: For the four treatment groups, the drought stage had three sampling points: pre-drought (D1, SWC at about 20–26%), mid-drought (D2, SWC at about 12–14%), and late drought (D3, SWC at about 4–6%). After the drought stage, rewatering was performed, and the post-drought rewatering stage had four sampling time points: 6 h (W1), 12 h (W2), 24 h (W3), and 7 days (W4) after rewatering. During the rewatering stage, SWC was monitored in real-time to maintain soil at 80–90% FC. Sampling and measurements were taken at each sampling nodes (D1, D2, D3, W1, W2, W3, W4) to analyze the growth and photosynthetic responses of saplings to different treatments. The SWC values for each sampling node were consistent across the four treatment groups.

4.3. Indicator Measurement

Specific Leaf Area (SLA): At each sampling node during the drought and rehydration stages, 20 fully expanded leaves were collected from the upper-middle and sunny-side canopy of each potted sapling of both species. These leaves were scanned indoors, and leaf area was measured using IMAGEJ 1.53 software (Wayne Rasband, National Institute of Health, Bethesda, MD, USA).
Leaf dry weight (LDW) and leaf relative water content (RWC): At each sampling time point for each tree species, leaves to be tested were randomly selected and quickly collected and sealed to prevent water evaporation. A portion of each leaf (avoiding the midrib) was cut and weighed to determine fresh weight (LFW). The sample was then killed in a 105 °C oven for 30 min. Subsequently, the temperature was lowered to 80 °C, and the sample was dried in an oven for 48 h until a constant weight was achieved. After cooling, the weight was measured to obtain the LDW.
R W C = L F W L D W L F W × 100 %
Leaf photosynthetic parameters: During the experiments under shaded, full-light, and control conditions, the photosynthetic parameters of young trees [net photosynthetic rate (Pn, µmol·m−2·s−1), transpiration rate (Tr, mmol·m−2·s−1), and stomatal conductance (Gs, mol·m−2·s−1)] were measured between 8:00 and 10:00 a.m. on sunny days at each sampling time point using a CI-340 portable photosynthesis meter, CID Bio-Science Inc., Camas, WA, USA (the leaf age is selected as fully developed mature leaves of the current year).
Chlorophyll fluorescence parameters: At each sampling time point, chlorophyll fluorescence parameters of young trees were measured between 8:00 and 10:00 a.m. using a high-speed continuous-excitation fluorometer (Handy PEA, Norfolk, UK). Parameters included the maximum photochemical efficiency (Fv/Fm) and photosynthetic performance index (PIabs). These measurements helped evaluate the distinct effects of combined shade and drought stresses on the photosynthetic apparatus and the restoration process during rehydration.

4.4. Data Processing

All raw data were organized in Excel 2021 and subsequently analyzed in SPSS 24.0. Differences within and among groups in Section 2.1, Section 2.2 and Section 2.3 were tested for significance using the LSD method. Section 2.4 employed a two-factor (drought/rewatering × light) linear mixed-effects model to examine the main effects and interactions; indicators exhibiting significant interactions were further subjected to simple-effects analysis with Bonferroni correction. Correlation analyses in Section 2.5 and Section 2.6 were conducted using Pearson’s method. All figures were generated with Origin 2024.

5. Conclusions

This study elucidates the differential mechanisms through which combined drought and shading stress impact leaf traits and photosynthetic performance in juvenile P. tabuliformis and R. pseudoacacia. Combined drought and shade reduced SLA, RWC, and LDW in both juvenile P. tabuliformis and R. pseudoacacia, but shade buffered these declines only in R. pseudoacacia by relieving photoinhibition, demonstrating its greater morphological plasticity. Shade exacerbated drought-driven reductions in Pn and Gs in P. tabuliformis while mitigating them in R. pseudoacacia, underscoring divergent light-use strategies. Upon rehydration, plants previously subjected to shaded drought recovered less than those under full-light drought, especially P. tabuliformis, indicating that shade hampers PSII repair and prolongs drought damage. These findings suggest deploying shade-tolerant R. pseudoacacia in low-light urban microhabitats and reserving sun-dependent P. tabuliformis for open areas, thereby optimizing light–water use efficiency, enhancing drought resilience and improving the ecological restoration potential of Beijing’s urban forests. In the future, in-depth research is needed on the synergistic changes of biochemical indicators such as plant osmolytes, antioxidant enzymes, and gene expression to unravel the underlying mechanisms.

Supplementary Materials

The following supporting information can be downloaded at: https://www.mdpi.com/article/10.3390/plants14182825/s1, Table S1: Simple-effects analysis of SLA, Gs, Fv/Fm and PIabs in P. tabuliformis during drought under full/low light conditions; Table S2: Simple-effects analysis of LDW, Pn and PIabs recovery in P. tabuliformis during re-watering under full/low light conditions; Table S3: Simple-effects analysis of LDW and Fv/Fm in R. pseudoacacia during drought under full/low light conditions; Table S4: Simple-effects analysis of LDW and Fv/Fm recovery in R. pseudoacacia during rewatering under full/low-light conditions.

Author Contributions

Conceptualization, N.Z. and X.Y.; Methodology, N.Z. and S.L. (Shaowei Lu); Validation, S.L. (Shaowei Lu), X.X., and B.L.; Investigation, C.L. and M.T.; Resources, S.L. (Shaowei Lu); Data Curation, X.X., and B.L.; Writing—Original Draft Preparation, C.L.; Writing—Review and Editing, N.Z., X.Y. and X.X.; Visualization, C.L.; Supervision, S.L. (Shaowei Lu) and S.L. (Shaoning Li); Project Administration, N.Z. and S.L. (Shaowei Lu), Funding Acquisition, S.L. (Shaoning Li). All authors have read and agreed to the published version of the manuscript.

Funding

This study was supported by the National Natural Science Foundation of China (32171537), Innovation Capacity Building Project of Beijing Academy of Agriculture and Forestry Sciences (KJCX20251202 and KJCX20230602).

Acknowledgments

We thank the Shiying Liu, Jiamei Wen, Bin Song and Junfang Yang for their assistance during the trial period of this research.

Conflicts of Interest

The authors declare no conflict of interest.

References

  1. IPCC. Climate Change 2021: The Physical Science Basis; IPCC: Geneva, Switzerland, 2021. [Google Scholar]
  2. Brunner, I.; Herzog, C.; Dawes, M.A.; Arend, M.; Sperisen, C. How tree roots respond to drought. Front. Plant Sci. 2015, 6, 547. [Google Scholar] [CrossRef]
  3. Nguyen, H.; Vanclay, J.; Herbohn, J.; Firn, J. Drivers of tree growth, mortality and harvest preferences in species-rich plantations for smallholders and communities in the tropics. PLoS ONE 2016, 11, e0164957. [Google Scholar] [CrossRef] [PubMed]
  4. Sevanto, S.; Mcdowell, N.G.; Dickman, L.T.; Pangle, R.; Pockman, W.T. How do trees die? A test of the hydraulic failure and carbon starvation hypotheses. Plant Cell Environ. 2014, 37, 153–161. [Google Scholar] [CrossRef]
  5. Fu, C.; Liu, J.; Wang, H.; Xiang, C.; Fu, X.; Luan, Q. Urban Storm Flooding: Characteristics and Management in Beijing. MATEC Web Conf. 2018, 246, 01042. [Google Scholar] [CrossRef]
  6. Kwon, M.Y.; Woo, S.Y. Plants’ responses to drought and shade environments. Afr. J. Biotechnol. 2016, 15, 29–31. [Google Scholar] [CrossRef]
  7. Evans, J.R. Photosynthesis and nitrogen relationships in leaves of C3 plants. Oecologia 1989, 78, 9–19. [Google Scholar] [CrossRef]
  8. Van Hees, A.F.M. Growth and morphology of pedunculate oak (Quercus robur L.) and beech (Fagus sylvatica L.) seedlings in relation to shading and drought. Ann. Sci. For. 1997, 54, 9–18. [Google Scholar] [CrossRef]
  9. Amissah, L.; Mohren, G.M.; Kyereh, B.; Poorter, L. The effects of drought and shade on the performance, morphology and physiology of Ghanaian tree species. PLoS ONE 2015, 10, e0121004. [Google Scholar] [CrossRef]
  10. Holmgren, M.; Scheffer, M.; Huston, A.M. The interplay of facilitation and competition in plant communities. Ecology 1997, 78, 1966–1975. [Google Scholar] [CrossRef]
  11. Smith, T.; Huston, M. A theory of the spatial and temporal dynamics of plant communities. Vegetatio 1989, 83, 49–69. [Google Scholar] [CrossRef]
  12. Poorter, H.; Niklas, K.J.; Reich, P.B.; Oleksyn, J.; Poot, P.; Mommer, L. Biomass allocation to leaves, stems and roots: Meta-analyses of interspecific variation and environmental control. New Phytol. 2012, 193, 30–50. [Google Scholar] [CrossRef]
  13. Quero, J.L.; Villar, R.; Maraón, T.; Zamora, R. Interactions of drought and shade effects on seedlings of four Quercus species: Physiological and structural leaf responses. New Phytol. 2006, 170, 819–834. [Google Scholar] [CrossRef] [PubMed]
  14. Holmgren, M. Combined effects of shade and drought on tulip poplar seedlings: Trade-off in tolerance or facilitation? Oikos 2000, 90, 67–78. [Google Scholar] [CrossRef]
  15. Naseer, M.A.; Hussain, S.; Mukhtar, A.; Rui, Q.; Ru, G.; Ahmad, H.; Zhang, Z.Q.; Shi, L.B.; Asad, M.S.; Chen, X.; et al. Chlorophyll fluorescence, physiology, and yield of winter wheat under different irrigation and shade durations during the grain-filling stage. Front. Plant Sci. 2024, 15, 1396929. [Google Scholar] [CrossRef] [PubMed]
  16. Liu, Y.; He, Z.; Xie, Y.; Su, L.; Zhang, R.; Wang, H.; Li, C.; Long, S. Drought resistance mechanisms of Phedimus aizoon L. Sci. Rep. 2021, 11, 13600. [Google Scholar] [CrossRef]
  17. Yavas, I.; Jamal, M.A.; Ul Din, K.; Ali, S.; Hussain, S.; Farooq, M. Drought-Induced Changes in Leaf Morphology and Anatomy: Overview, Implications and Perspectives. Pol. J. Environ. Stud. 2024, 33, 1517–1530. [Google Scholar] [CrossRef]
  18. Lawlor, D.W.; Cornic, G. Photosynthetic carbon assimilation and associated metabolism in relation to water deficits in higher plants. Plant Cell Environ. 2002, 25, 275–294. [Google Scholar] [CrossRef] [PubMed]
  19. Yang, H.; Dong, B.; Wang, Y.; Qiao, Y.; Shi, C.; Jin, L.; Liu, M. Photosynthetic base of reduced grain yield by shading stress during the early reproductive stage of two wheat cultivars. Sci. Rep. 2020, 10, 14353. [Google Scholar] [CrossRef]
  20. Chen, X.; Ye, K.; Xu, Y.; Zhao, Y.; Zhao, D. Effect of shading on the morphological, physiological, and biochemical characteristics as well as the transcriptome of matcha green tea. Int. J. Mol. Sci. 2022, 23, 14169. [Google Scholar] [CrossRef]
  21. Prerostova, S.; Dobrev, P.I.; Knirsch, V.; Jarosova, J.; Gaudinova, A.; Zupkova, B.; Prášil, I.T.; Janda, T.; Brzobohatý, B.; Skalák, J.; et al. Light quality and intensity modulate cold acclimation in Arabidopsis. Int. J. Mol. Sci. 2021, 22, 2736. [Google Scholar] [CrossRef]
  22. Shafiq, I.; Hussain, S.; Hassan, B.; Raza, A.; Ahmad, I.; Asghar, M.A.; Wang, Z.; Tan, T.; Li, S.; Tan, X.; et al. Crop responses and management strategies under shade and drought stress. Photosynthetica 2021, 59, 664–682. [Google Scholar] [CrossRef]
  23. Maguire, A.J.; Kobe, R.K. Drought and shade deplete nonstructural carbohydrate reserves in seedlings of five temperate tree species. Ecol. Evol. 2015, 5, 5711–5721. [Google Scholar] [CrossRef] [PubMed]
  24. Sack, L.; Grubb, P.J. The combined impacts of deep shade and drought on the growth and biomass allocation of shade-tolerant woody seedlings. Oecologia 2002, 131, 175–185. [Google Scholar] [CrossRef] [PubMed]
  25. Guo, X.; Guo, W.; Luo, Y.; Tan, X.; Du, N.; Wang, R. Morphological and biomass characteristic acclimation of trident maple (Acer buergerianum Miq.) in response to light and water stress. Acta Physiol. Plant. 2013, 35, 1149–1159. [Google Scholar] [CrossRef]
  26. Guo, K.; Werger, M.J.A. Different responses to shade of evergreen and deciduous oak seedlings and the effect of acorn size. Acta Oecologica 1999, 20, 579–586. [Google Scholar] [CrossRef]
  27. Cailleret, M.; Nourtier, M.; Amm, A.; Durand-Gillmann, M.; Davi, H. Drought-induced decline and mortality of silver fir differ among three sites in Southern France. Ann. For. Sci. 2014, 71, 643–657. [Google Scholar] [CrossRef]
  28. Sperry, J.S.; Hacke, U.G.; Oren, R.; Comstock, J.P. Water deficits and hydraulic limits to leaf water supply. Plant Cell Environ. 2002, 25, 251–263. [Google Scholar] [CrossRef]
  29. Maggard, A.; Will, R.; Wilson, D.; Meek, C. Response of mid-rotation loblolly pine (Pinus taeda L.) physiology and productivity to sustained, moderate drought on the western edge of the range. Forests 2016, 7, 203. [Google Scholar] [CrossRef]
  30. Eziz, A.; Yan, Z.; Tian, D.; Han, W.; Tang, Z.; Fang, J. Drought effect on plant biomass allocation: A meta-analysis. Ecol. Evol. 2017, 7, 11002–11010. [Google Scholar] [CrossRef]
  31. Hartmann, H.; Bahn, M.; Carbone, M.; Richardson, A.D. Plant carbon allocation in a changing world—Challenges and progress. New Phytol. 2020, 227, 981–988. [Google Scholar] [CrossRef]
  32. Wegener, F.; Beyschlag, W.; Werner, C. High intraspecific ability to adjust both carbon uptake and allocation under light and nutrient reduction in Halimium halimifolium L. Front. Plant Sci. 2015, 6, 609. [Google Scholar] [CrossRef]
  33. Russo, S.E.; Ledder, G.; Muller, E.B.; Nisbet, R.M. Dynamic Energy Budget models: Fertile ground for understanding resource allocation in plants in a changing world. Conserv. Physiol. 2022, 10, coac061. [Google Scholar] [CrossRef]
  34. Farooq, M.; Wahid, A.; Kobayashi, N.; Fujita, D.; Basra, S.M.A. Plant drought stress: Effects, mechanisms and management. Agron. Sustain. Dev. 2009, 29, 185–212. [Google Scholar] [CrossRef]
  35. Kuronuma, T.; Wang, Q.; Ando, M.; Watanabe, H. Effects of Different Light Intensities on the Growth and Accumulation of Photosynthetic Products in Panax ginseng C.A. Meyers. Environ. Control Biol. 2020, 58, 131–135. [Google Scholar] [CrossRef]
  36. Eamus, D.; Boulain, N.; Cleverly, J.; Breshears, D.D. Global change-type drought-induced tree mortality: Vapor pressure deficit is more important than temperature per se in causing decline in tree health. Ecol. Evol. 2013, 3, 2711–2729. [Google Scholar] [CrossRef] [PubMed]
  37. Yan, W.; Zhong, Y.; Shangguan, Z. A meta-analysis of leaf gas exchange and water status responses to drought. Sci. Rep. 2016, 6, 20917. [Google Scholar] [CrossRef]
  38. Yao, K.; Wang, Y.; Wu, Y. Competition and niche differentiation of water and nutrients between Broussonetia papyrifera and Platycladus orientalis under prolonged drought stress. Agronomy 2022, 12, 1489. [Google Scholar] [CrossRef]
  39. Yan, W.; Zheng, S.; Zhong, Y.; Shangguan, Z. Contrasting dynamics of leaf potential and gas exchange during progressive drought cycles and recovery in Amorpha fruticosa and Robinia pseudoacacia. Sci. Rep. 2017, 7, 4470. [Google Scholar] [CrossRef]
  40. Xu, Z.; Zhou, G.; Shimizu, H. Are plant growth and photosynthesis limited by pre-drought following rewatering in grass? J. Exp. Bot. 2009, 60, 3737–3749. [Google Scholar] [CrossRef]
  41. Li, X.; Bao, J.; Wang, J.; Blackman, C.; Tissue, D. Antecedent drought condition affects responses of plant physiology and growth to drought and post-drought recovery. Front. For. Glob. Change 2021, 4, 704470. [Google Scholar] [CrossRef]
  42. Zhou, H.; Hou, L.; Lv, X.; Yang, G.; Wang, Y.; Wang, X. Compensatory growth as a response to post-drought in grassland. Front. Plant Sci. 2022, 13, 1004553. [Google Scholar] [CrossRef]
  43. Aidar, S.D.T.; Meirelles, S.T.; Oliveira, R.F.D.; Chaves, A.D.M.; Fernandes-Júnior, P.I. Photosynthetic response of poikilochlorophyllous desiccation-tolerant Pleurostima purpurea (Velloziaceae) to dehydration and rehydration. Photosynthetica 2014, 52, 124–133. [Google Scholar] [CrossRef]
  44. Yamazaki, J.Y.; Kamata, K.; Maruta, E. Seasonal changes in the excess energy dissipation from Photosystem II antennae in overwintering evergreen broad-leaved trees Quercus myrsinaefolia and Machilus thunbergia. J. Photochem. Photobiol. B 2011, 104, 348–356. [Google Scholar] [CrossRef] [PubMed]
  45. Bechtold, U.; Field, B. Molecular mechanisms controlling plant growth during abiotic stress. J. Exp. Bot. 2018, 69, 2753–2758. [Google Scholar] [CrossRef] [PubMed]
  46. Montanaro, G.; Dichio, B.; Xiloyannis, C. Shade mitigates photoinhibition and enhances water use efficiency in kiwifruit under drought. Photosynthetica 2009, 47, 363–371. [Google Scholar] [CrossRef]
  47. Georgieva, K.; Solti, Á.; Mészáros, I.; Keresztes, Á.; Sárvári, É. Light sensitivity of Haberlea rhodopensis shade adapted phenotype under drought stress. Acta Physiol. Plant. 2017, 39, 164. [Google Scholar] [CrossRef]
  48. Kapoor, D.; Bhardwaj, S.; Landi, M.; Sharma, A.; Ramakrishnan, M.; Sharma, A. The impact of drought in plant metabolism: How to exploit tolerance mechanisms to increase crop production. Appl. Sci. 2020, 10, 5692. [Google Scholar] [CrossRef]
  49. Tezara, W.; Marín, O.; Rengifo, E.; Martínez, D.; Herrera, A. Photosynthesis and photoinhibition in two xerophytic shrubs during drought. Photosynthetica 2005, 43, 37–45. [Google Scholar] [CrossRef]
  50. Bortolheiro, F.P.; Silva, M.A. Physiological response and productivity of safflower lines under water deficit and rehydration. An. Acad. Bras. Ciênc. 2017, 89, 3051–3066. [Google Scholar] [CrossRef]
  51. Diawara, S.; Savadogo, P.; Ouedraogo, A.; Lamien, N.; Bouda, H.N. Water stress responses of Saba senegalensis provenances during the seedling stage. Bois For. Trop. 2023, 355, 5–19. [Google Scholar] [CrossRef]
  52. Nawaz, M.; Li, L.; Azeem, F.; Shabbir, S.; Zohaib, A.; Ashraf, U.; Yang, H.; Wang, Z. Insight of transcriptional regulators reveals the tolerance mechanism of carpet-grass (Axonopus compressus) against drought. BMC Plant Biol. 2021, 21, 71. [Google Scholar] [CrossRef] [PubMed]
  53. Li, C.; Chen, S.; Wang, Y. Physiological and proteomic changes of Castanopsis fissa in response to drought stress. Sci. Rep. 2023, 13, 12567. [Google Scholar] [CrossRef] [PubMed]
  54. Wang, Z.; Wang, C. Individual and interactive responses of woody plants’ biomass and leaf traits to drought and shade. Glob. Ecol. Biogeogr. 2023, 32, 35–48. [Google Scholar] [CrossRef]
  55. Deng, X.; Xiao, W.; Shi, Z.; Zeng, L.; Lei, L. Combined effects of drought and shading on growth and non-structural carbohydrates in Pinus massoniana Lamb. seedlings. Forests 2019, 11, 18. [Google Scholar] [CrossRef]
  56. Visser, E.J.W.; Zhang, Q.; De Gruyter, F.; Martens, S.; Huber, H. Shade affects responses to drought and flooding–acclimation to multiple stresses in bittersweet (Solanum dulcamara L.). Plant Biol. 2016, 18, 112–119. [Google Scholar] [CrossRef]
  57. Gao, S.; Wang, G. The enhancement of cyclic electron flow around photosystem I improves the recovery of severely desiccated Porphyra yezoensis (Bangiales, Rhodophyta). J. Exp. Bot. 2012, 63, 4349–4358. [Google Scholar] [CrossRef]
  58. Cai, J.G.; Wei, M.Q.; Zhang, Y.; Wei, Y.L. Effects of shading on photosynthetic characteristics and chlorophyll fluorescence parameters in leaves of Hydrangea macrophylla. Chin. J. Plant Ecol. 2017, 41, 570. [Google Scholar] [CrossRef]
  59. Dai, Y.M.; Li, M.L.; Xu, M.Z.; Tian, Y.; Zhao, H.X.; Gao, S.J.; Hao, S.R.; Liu, P.; Jia, X.; Zha, T.S. Leaf traits of Artemisia ordosica at different dune fixation stages in Mau Us Sandy Land. Chin. J. Plant Ecol. 2022, 46, 1376. [Google Scholar] [CrossRef]
  60. Li, J.; Bai, X.; Ran, F.; Li, P.; Sadiq, M.; Chen, H. Photosynthetic and physiological responses to combined drought and low-temperature stress in Poa annua seedlings from different provenances. Agriculture 2023, 13, 1781. [Google Scholar] [CrossRef]
  61. Galdina, T.; Khazova, E. Adaptability of Pinus sylvestris L. to various environmental conditions. In IOP Conference Series: Earth and Environmental Science; IOP Publishing: Bristol, UK, 2019; Volume 316, p. 012002. [Google Scholar] [CrossRef]
  62. Rawat, M.; Arunachalam, K.; Arunachalam, A.; Alatalo, J.M.; Pandey, R. Assessment of leaf morphological, physiological, chemical and stoichiometry functional traits for understanding the functioning of Himalayan temperate forest ecosystem. Sci. Rep. 2021, 11, 23807. [Google Scholar] [CrossRef]
  63. Kruijt, B.; Barton, C.; Rey, A.; Jarvis, P.G. The sensitivity of stand-scale photosynthesis and transpiration to changes in atmospheric CO2 concentration and climate. Hydrol. Earth Syst. Sci. 1999, 3, 55–69. [Google Scholar] [CrossRef]
  64. Chen, J.; Li, T.; Cai, J.; Yu, P.; Guo, Y. Physiological and molecular response of Liriodendron chinense to varying stand density. Plants 2024, 13, 508. [Google Scholar] [CrossRef]
  65. Moore, C.E.; Meacham-Hensold, K.; Lemonnier, P.; Slattery, R.A.; Benjamin, C.; Bernacchi, C.J.; Lawson, T.; Cavanagh, A.P. The effect of increasing temperature on crop photosynthesis: From enzymes to ecosystems. J. Exp. Bot. 2021, 72, 2822–2844. [Google Scholar] [CrossRef] [PubMed]
  66. Ruban, A.V. Plants in light. Commun. Integr. Biol. 2009, 2, 50–55. [Google Scholar] [CrossRef] [PubMed]
  67. Murchie, E.H.; Niyogi, K.K. Manipulation of photoprotection to improve plant photosynthesis. Plant Physiol. 2011, 155, 86–92. [Google Scholar] [CrossRef]
  68. Allakhverdiev, S.I.; Nishiyama, Y.; Takahashi, S.; Miyairi, S.; Suzuki, I.; Murata, N. Systematic analysis of the relation of electron transport and ATP synthesis to the photodamage and repair of photosystem II in Synechocystis. Plant Physiol. 2005, 137, 263–273. [Google Scholar] [CrossRef]
  69. Hu, W.H.; Zhang, S.S.; Xiao, Y.A.; Yan, X.H. Physiological responses and photo-protective mechanisms of two Rhododendron plants to natural sunlight after long-term shading. Chin. J. Plant Ecol. 2015, 39, 1093. [Google Scholar] [CrossRef]
  70. Lawson, T.; Matthews, J. Guard cell metabolism and stomatal function. Annu. Rev. Plant Biol. 2020, 71, 273–302. [Google Scholar] [CrossRef]
  71. Liu, M.X.; Liang, G.L. Research progress on leaf mass per area. Chin. J. Plant Ecol. 2016, 40, 847. [Google Scholar] [CrossRef]
  72. Wang, J.; Yao, R.; Sun, Z.; Wang, M.; Jiang, C.; Zhao, X.; Liu, X.; Zhong, C.; Zhang, H.; Zhao, S.; et al. Effects of shading on morphology, photosynthesis characteristics, and yield of different shade-tolerant peanut varieties at the flowering stage. Front. Plant Sci. 2024, 15, 1429800. [Google Scholar] [CrossRef]
  73. Hussain, S.; Iqbal, N.; Raza, M.A.; Khan, M.N.; Yang, W. Distribution and effects of ionic titanium application on energy partitioning and quantum yield of soybean under different light conditions. Photosynthetica 2019, 57, 572–580. [Google Scholar] [CrossRef]
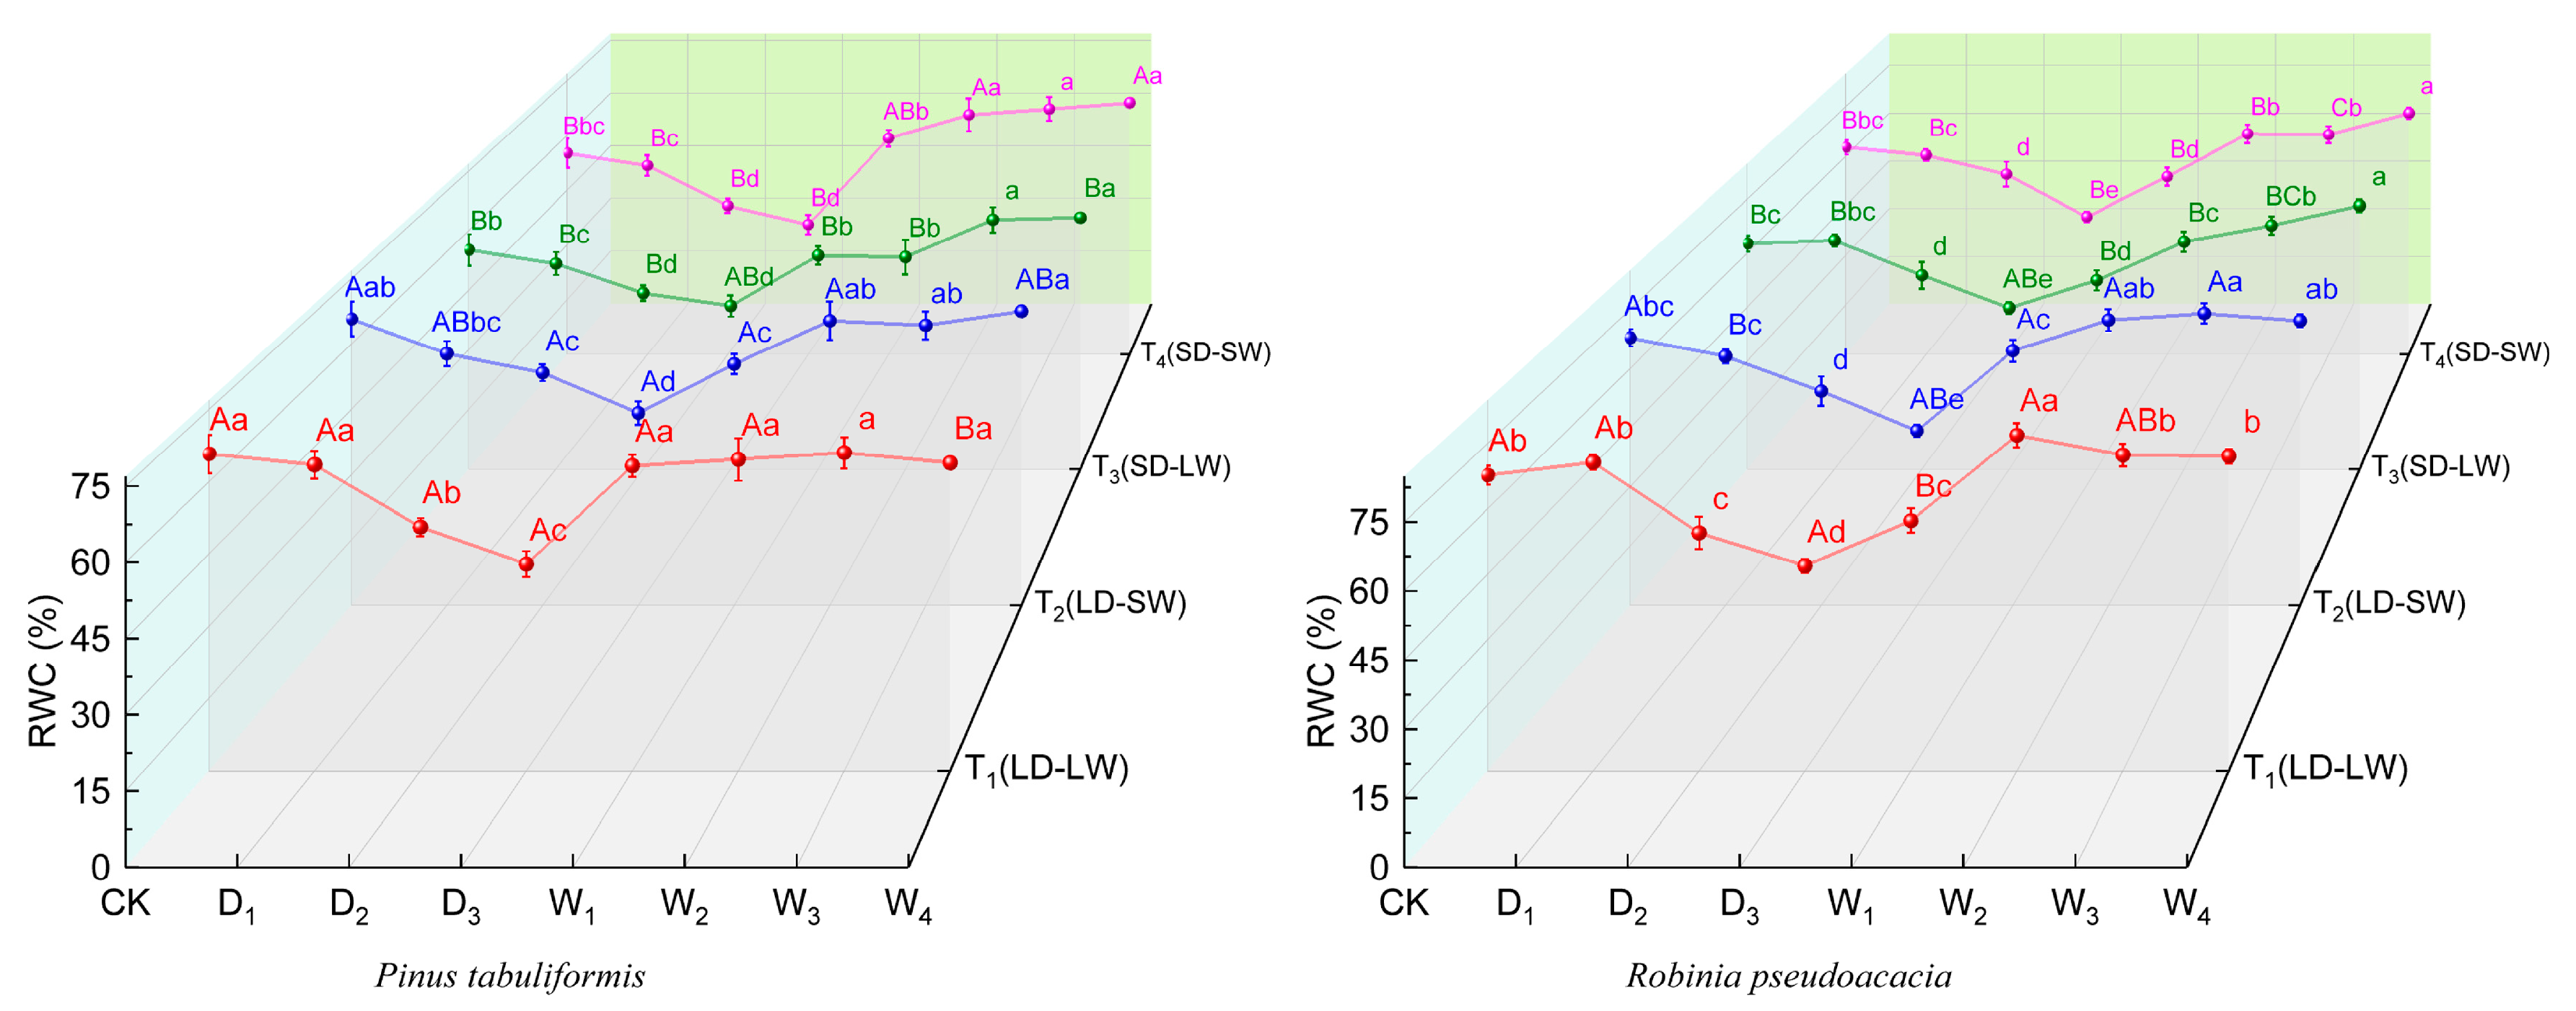
Figure 1. Leaf relative water content (RWC, %) of P. tabuliformis and R. pseudoacacia leaves under four treatment groups during continuous drought and subsequent rewatering. (left) P. tabuliformis. (right) R. pseudoacacia. The data is the mean ± standard deviation. Dx represents the drought stage, and Wx represents the rehydration stage. Different uppercase letters in the figure indicate significant differences among T1, T2, T3, and T4 at each sampling node at the p < 0.05 level, while different lowercase letters indicate significant differences within the same group at different nodes at the p < 0.05 level.
Plants 14 02825 g001
Figure 2. Leaf dry weight (LDW, g) of P. tabuliformis and R. pseudoacacia leaves under four treatment groups during continuous drought and subsequent rewatering. (left) P. tabuliformis. (right) R. pseudoacacia. The data is the mean ± standard deviation. Dx represents the drought stage, and Wx represents the rehydration stage. Different uppercase letters in the figure indicate significant differences among T1, T2, T3, and T4 at each sampling node at the p < 0.05 level, while different lowercase letters indicate significant differences within the same group at different nodes at the p < 0.05 level.
Plants 14 02825 g002
Figure 3. Photosynthetic rates (Pn, µmol·m−2·s−1) of P. tabuliformis and R. pseudoacacia leaves under four treatment groups during continuous drought and subsequent rewatering. (left) P. tabuliformis. (right) R. pseudoacacia. The data is the mean ± standard deviation. Dx represents the drought stage, and Wx represents the rehydration stage. Different uppercase letters in the figure indicate significant differences among T1, T2, T3, and T4 at each sampling node at the p < 0.05 level, while different lowercase letters indicate significant differences within the same group at different nodes at the p < 0.05 level.
Plants 14 02825 g003
Figure 4. Stomatal conductance (Gs, mol·m−2·s−1) of P. tabuliformis and R. pseudoacacia leaves under four treatment groups during continuous drought and subsequent rewatering. (left) P. tabuliformis. (right) R. pseudoacacia. The data is the mean ± standard deviation. Dx represents the drought stage, and Wx represents the rehydration stage. Different uppercase letters in the figure indicate significant differences among T1, T2, T3, and T4 at each sampling node at the p < 0.05 level, while different lowercase letters indicate significant differences within the same group at different nodes at the p < 0.05 level.
Plants 14 02825 g004
Figure 5. Transpiration (Tr, g·m−2·h−1) of P. tabuliformis and R. pseudoacacia leaves under four treatment groups during continuous drought and subsequent rewatering. (left) P. tabuliformis. (right) R. pseudoacacia. The data is the mean ± standard deviation. Dx represents the drought stage, and Wx represents the rehydration stage. Different uppercase letters in the figure indicate significant differences among T1, T2, T3, and T4 at each sampling node at the p < 0.05 level, while different lowercase letters indicate significant differences within the same group at different nodes at the p < 0.05 level.
Plants 14 02825 g005
Figure 6. Photochemical efficiency (Fv/Fm) and photosynthetic performance index (PIabs) of P. tabuliformis and R. pseudoacacia leaves under four treatment groups during continuous drought and subsequent rewatering. (left) P. tabuliformis. (right) R. pseudoacacia. The data is the mean ± standard deviation. Dx represents the drought stage, and Wx represents the rehydration stage. Different uppercase letters in the figure indicate significant differences among T1, T2, T3, and T4 at each sampling node at the p < 0.05 level, while different lowercase letters indicate significant differences within the same group at different nodes at the p < 0.05 level.
Plants 14 02825 g006
Figure 7. The correlation between leaf traits and photosynthetic performance of young P. tabuliformis under full-light and shade drought and rehydration conditions. (a) Correlation matrix for T1 (LD-LW) during the drought and rehydration phases. (b) Correlation matrix for T2 (LD-SW) during the drought and rehydration phases. (c) Correlation matrix for T3 (SD-LW) during the drought and rehydration phases. (d) Correlation matrix for T4 (SD-SW) during the drought and rehydration phases. The lower left part of each figure represents the drought phase of each treatment group, and the upper right part represents the rehydration phase. * indicates a significant correlation at the 0.05 level, ** indicates significant correlation at the 0.01 level, *** indicates significant correlation at the 0.001 level.
Plants 14 02825 g007
Figure 8. The correlation between leaf traits and photosynthetic performance of young R. pseudoacacia under full-light and shade drought and rehydration conditions. (a) Correlation matrix for T1 (LD-LW) during the drought and rehydration phases. (b) Correlation matrix for T2 (LD-SW) during the drought and rehydration phases. (c) Correlation matrix for T3 (SD-LW) during the drought and rehydration phases. (d) Correlation matrix for T4 (SD-SW) during the drought and rehydration phases. The lower left part of each figure represents the drought phase of each treatment group, and the upper right part represents the rehydration phase. * indicates a significant correlation at the 0.05 level, ** indicates significant correlation at the 0.01 level, *** indicates significant correlation at the 0.001 level.
Plants 14 02825 g008
Table 1. Specific leaf area (SLA, cm2/g) of P. tabuliformis and R. pseudoacacia leaves under four treatment groups during continuous drought and subsequent rewatering.
SpeciesStageSpecific Leaf Area (cm2/g)
T1 (LD-LW)T2 (LD-SW)T3 (SD-LW)T4 (SD-SW)
P. tabuliformisCK54 ± 5.51 a54 ± 5.51 a53 ± 5.29 d53 ± 5.29 bc
D154 ± 5.13 a54 ± 5.86 a55 ± 5.03 cd51 ± 3.21 c
D253 ± 2.00 Aa48 ± 2.00 Cabcd57 ± 2.00 Abcd52 ± 2.00 Babc
D338 ± 4.93 Cb45 ± 4.04 Bbc59 ± 1.53 Abc59 ± 2.08 Aa
W137 ± 10.21 Cb41 ± 2.08 Cc74 ± 3.79 Aa57 ± 1.53 Bab
W237 ± 2.65 Db45 ± 3.06 Cbc62 ± 2.08 Ab55 ± 1.00 Babc
W342 ± 2.52 Bb52 ± 2.65 Aab52 ± 2.00 Ade53 ± 1.53 Abc
W448 ± 5.69 b52 ± 4.58 ab47 ± 1.00 e51 ± 1.53 c
R. pseudoacaciaCK155 ± 4.93 b155 ± 4.93 de159 ± 4.04 d159 ± 4.04 d
D1157 ± 1.53 Cb165 ± 6.03 Ccd187 ± 6.81 Ac205 ± 6.66 Bc
D2134 ± 3.61 Cc137 ± 4.36 Cf194 ± 4.16 Ab224 ± 5.03 Bc
D3111 ± 1.00 Ce118 ± 4.16 Cg214 ± 1.53 Aa245 ± 8.14 Ba
W1125 ± 5.00 Cd152 ± 10.69 Bd222 ± 7.55 Ab229 ± 9.02 Aa
W2158 ± 4.73 Cb171 ± 3.51 Bc214 ± 4.58 Ab223 ± 7.02 Aa
W3157 ± 2.52 Cb192 ± 7.21 Bb215 ± 5.00 Ab221 ± 7.81 Aa
W4169 ± 2.52 Ba200 ± 10.58 Aa204 ± 6.66 Ac206 ± 3.21 Ab
The data is the mean ± standard deviation. Dx represents the drought stage, and Wx represents the rehydration stage. Different uppercase letters in the figure indicate significant differences between the T1, T2, T3, and T4 groups at each sampling node at the p < 0.05 level, while different lowercase letters indicate significant differences within the same group at different nodes at the p < 0.05 level.
Table 2. The interaction effect (p value) of shading during the drought period and shading during the rehydration period on various physiological indicators.
SpeciesParameterDrought × LightRewatering × LightSpeciesParameterDrought × LightRewatering × Light
P. tabuliformisSLA0.0000.550R. pseudoacaciaSLA0.5810.922
RWC0.3440.150RWC0.5930.575
LDW0.0250.007LDW0.0000.001
Pn0.2350.015Pn0.4520.235
Gs0.0000.868Gs0.2220.844
Tr0.8870.675Tr0.1250.855
Fv/Fm0.0000.518Fv/Fm0.0290.006
PIabs0.0000.029PIabs0.2950.549
The data is the p-value of the interaction term output by the linear mixed-effects model; “drought × light” indicates “the interaction between drought and light”, and “rewatering × light” indicates “the interaction between rewatering and light”; The significance level α = 0.05; The bold value p < 0.05 indicates a significant interaction.
Table 3. Correlation between drought-restoration duration and physiological indices of P. tabuliformis.
PearsonP. tabuliformis
SLARWCLDWPnGsTrFv/FmPIabs
T1Dn−0.586 *−0.941 **−0.943 **−0.929 **−0.852 **−0.875 **0.3320.476
D1–20.464−0.956 **−0.762−0.751−0.913 *−0.878 *0.7680.778
D2–3−0.954 **−0.898 *−0.805−0.722−0.797−0.2660.3730.646
Wn0.782 **−0.084−0.1630.2410.0580.3410.5450.511
W0.25–0.5−0.0270.2260.956 **0.545−0.5600.959 **0.4970.900 *
W1–70.845 *−0.468−0.7870.490−0.2240.2430.953 **0.707
T2Dn−0.672 *−0.888 **−0.862 **−0.707 *−0.873 **−0.859 **−0.1460.703 *
D1–20.036−0.796−0.746−0.818 *−0.536−0.996 **−0.197−0.708
D2–3−0.409−0.713−0.984 **0.867 *−0.355−0.962 **0.0000.859 *
Wn0.4280.480−0.1870.0540.5530.658 *0.1400.312
W0.25–0.50.6010.802−0.3220.1050.3940.915 *−0.260−0.206
W1–70.0000.433−0.852 *−0.918 **0.6500.7280.4590.664
T3Dn0.608 *−0.899 **−0.942 **−0.917 **−0.694 *−0.951 **−0.578 *−0.884 **
D1–20.258−0.850 *−0.931 **−0.959 **0.758−0.7840.535−0.916 *
D2–30.676−0.590−0.824 *−0.328−0.755−0.784−0.899 *−0.614
Wn−0.712 **0.593 *−0.2910.592 *0.1570.3970.3780.707 *
W0.25–0.5−0.923 **−0.0740.836 *0.0600.955 **0.891 *0.620−0.212
W1–7−0.889 *0.1040.0860.3640.827 *0.868 *0.2340.735
T4Dn0.532−0.907 **−0.913 **−0.906 **−0.860 **−0.841 **−0.595 *−0.647 *
D1–20.151−0.848 *−0.903 *−0.7510.443−0.6260.106−0.619
D2–30.917 *−0.804−0.348−0.884 *−0.958 **−0.955 **−0.974 **−0.974 **
Wn−0.720 **0.541−0.0330.096−0.4550.4540.013−0.871 **
W0.25–0.5−0.7420.795−0.872 *0.814 *−0.6400.5790.221−0.708
W1–7−0.6260.357−0.825 *−0.923 **−0.5880.6830.530−0.959 **
The bold value p < 0.05 indicates a significant interaction. * indicates a significant correlation at the 0.05 level (two-tailed), ** indicates significant correlation at the 0.01 level (two-tailed).
Table 4. Correlation between drought-restoration duration and physiological indices of R. pseudoacacia.
PearsonR. pseudoacacia
SLARWCLDWPnGsTrFv/FmPIabs
T1Dn−0.922 **−0.889 **−0.872 **−0.920 **−0.944 **−0.908 **0.0630.673 *
D1–2−0.982 **−0.959 **−0.479−0.946 **−0.872 *0.0990.7450.814 *
D2–3−0.983 **−0.850 *−0.573−0.014−0.958 **−0.993 **0.1140.606
Wn0.633 *0.236−0.650 *0.818 **0.822 **0.3730.2020.339
W0.25–0.50.973 **0.974 **−0.836 *−0.6730.887 *0.995 **0.6660.799
W1–70.946 **−0.071−0.7360.911 *0.853 *−0.6680.868 *0.478
T2Dn−0.847 **−0.944 **−0.819 **−0.941 **−0.922 **−0.870 **−0.686 *−0.533
D1–2−0.958 **−0.803−0.864 *−0.923 **−0.984 **−0.8060.3720.489
D2–3−0.937 **−0.835 *0.307−0.726−0.961 **−0.966 **−0.808−0.777
Wn0.771 **0.255−0.3460.740 **0.672 *0.590 *0.4970.249
W0.25–0.50.830 *0.879 *−0.6370.954 **0.975 **0.987 **0.7880.934 **
W1–70.755−0.385−0.885 *0.845 *0.3360.7570.956 **0.870 *
T3Dn0.963 **−0.892 **−0.675 *−0.531−0.806 **−0.853 **0.216−0.285
D1–20.892 *−0.906 *−0.867 *−0.493−0.697−0.973 **0.840 *−0.491
D2–30.885 *−0.868 *−0.951 **−0.889 *−0.952 **−0.982 **−0.784−0.904 *
Wn−0.830 **0.731 **−0.5010.577 *0.4640.783 **−0.3760.005
W0.25–0.5−0.4140.940 **−0.392−0.2180.436−0.4800.742−0.347
W1–7−0.872 *0.873 *0.4260.196−0.4070.7830.7840.597
T4Dn0.958 **−0.902 **−0.793 **−0.043−0.714 **−0.927 **0.067−0.053
D1–20.605−0.656−0.946 **0.948 **0.499−0.826 *0.5150.833 *
D2–30.968 **−0.967 **−0.969 **−0.973 **−0.982 **−0.929 **−0.739−0.901 *
Wn−0.707 *0.675 *−0.2470.966 **0.5190.744 **0.600 *0.384
W0.25–0.5−0.6170.935 **0.180−0.205−0.720−0.3350.831 *0.066
W1–7−0.7430.813 *−0.7290.974 **−0.4680.7580.814 *0.485
The bold value p < 0.05 indicates a significant interaction. * indicates a significant correlation at the 0.05 level (two-tailed), ** indicates significant correlation at the 0.01 level (two-tailed).
Disclaimer/Publisher’s Note: The statements, opinions and data contained in all publications are solely those of the individual author(s) and contributor(s) and not of MDPI and/or the editor(s). MDPI and/or the editor(s) disclaim responsibility for any injury to people or property resulting from any ideas, methods, instructions or products referred to in the content.