Article

Effects of Subsurface Drip Irrigation Depth on Growth Characteristics and Yield Quality of Apples (Malus pumila Mill.) in Northwest China

1
Institute of Water Resources and Hydropower, Xi’an University of Technology, Xi’an 710048, China
2
Xinjiang Institute of Water Resources and Hydropower Research, Urumqi 830049, China
3
College of Resources and Environment, Xinjiang Agricultural University, Urumqi 830052, China
*
Authors to whom correspondence should be addressed.
Plants 2025, 14(17), 2702; https://doi.org/10.3390/plants14172702
Submission received: 15 July 2025 / Revised: 14 August 2025 / Accepted: 27 August 2025 / Published: 29 August 2025

Abstract

Subsurface drip irrigation can improve crop water and fertilizer use efficiency, but it can cause soil hypoxia. We report on experiments performed in Aksu Prefecture, Xinjiang (41°17′ N latitude, 80°17′ E longitude), from April 2023 to October 2024 using oxygenated drip irrigation from the surface to 50 cm depth in an apple (Malus pumila Mill.) orchard, to examine the effects of drip irrigation on inter-root hypoxia, tree growth, fruit quality, and yield. Compared with surface oxygenated drip irrigation (CK), irrigating at 10 and 30 cm increased soil water content in the root system, elevated gibberellin, zeatin ribosides, and indoleacetic acid contents and reduced abscisic acid contents in new shoot tips. Compared with CK, branch and leaf nitrogen, phosphorus, and potassium contents were increased with irrigation at depths of 10 and 30 cm. The leaf nitrogen (N), phosphorus (P), and potassium (K) contents were increased by 18.03%, 22.42%, and 16.63%, respectively, in the treatment with a burial depth of 30 cm. Among treatments, irrigation at 30 cm produced the highest average daily plant water potential, and irrigation at 50 cm was the lowest. Maximum leaf soil–plant analysis development (SPAD) values occurred when irrigated at 30 cm, and minimum values occurred at 50 cm. For both years, the largest range of light flux utilization occurred when irrigated at 30 cm and the lowest when irrigated at 50 cm. Significant correlations between indoleacetic acid (IAA), total gibberellin (GA), zeatin riboside (ZRs), leaf N content, leaf K content, plant water potential (PWP), net photosynthetic rate (Pn), SPAD, and apple yield were determined by partial mantel analysis. A significant correlation was found between abscisic acid (ABA), IAA, GA, leaf P and K content, and apple quality. Principal component analysis revealed a burial depth of 30 cm had the highest principal component composite score, indicating that this burial depth, and oxygenation and fertilization regime most favored apple growth, yield, and quality.

1. Introduction

Water resources limit agricultural production, and this affects sustainability and economic development [1]. Increasing demand for limited water resources necessitates improved irrigation management and techniques. Surface drip irrigation can more effectively conserve water resources than conventional surface irrigation, but soil evaporation is high, crop water-use efficiency is low, and rapid weed growth can occur. It is difficult to remove weeds without damaging the irrigation system except for suspended drip irrigation systems, because weeds and their roots entangle or otherwise block the irrigation belt drip head, and mowers can sever the irrigation belt itself. More practical and efficient, water-saving drip irrigation technologies for orchards is required.
Subsurface drip irrigation not only reduces the amount of ineffective evaporation from surface soils, but also delivers water and nutrients directly to the crop roots. This more effectively provides water and nutrients to the crop root system, reduces fertilizer loss and does not promote weed growth, enhances crop water use efficiency [2], and improves fruit quality and yield [3]. Such subsurface devices are usually buried at depths of 10–40 cm, depending on the crop [4,5,6]. However, drip irrigation can produce a wetting front, resulting in the forced expulsion of soil gases [7]. High-frequency drip irrigation scenarios in particular may lead to prolonged inter-root oxygen deprivation in crops [8,9], especially in clay soils [10]. This affects, among other things, soil fertility [11], and causes stomatal closure and reduces plant water potential, which can affect a crop’s normal physiological functions [12,13]. The plant then reduces water and nutrient uptake and transportation to above-ground parts, reducing crop water and nutrient utilization efficiency, and decreasing crop biomass [14]. This is a major limiting condition for high-crop yields.
Oxygenated irrigation is a new technology that increases dissolved oxygen concentrations in irrigation water through a water–fertilizer–air integration system. The water and air mixture is delivered to the soil in the crop’s root zone through drip irrigation pipes [15]. This technology is low cost and simple to operate, especially when irrigation and air injection are performed through the same drip irrigation pipe-line. This can promote crop growth and resolve the problem of reduced loam and clay loam soil oxygen content caused by short-term high irrigation saturation. Soil oxygen enables plant root to metabolize normally [16], relieves the plant of hypoxic stress, improves the root system structure to increase the plant water supply, and thus increases leaf photosynthesis rates [17]. However, with increased burial depth of the drip irrigation system, oxygen diffusion from the inter-root wetting front decreases and the crop remains potentially hypoxic [18]. No detailed studies on the effects of oxygenated irrigation and subsurface drip irrigation depth on the physiology and growth of fruit trees exist, especially under different irrigation conditions.
For apples (Malus pumila Mill.), we (1) study the effects of different drip irrigation depths + oxygenated drip irrigation on plant endogenous hormones; (2) analyze the effects of drip irrigation depth + oxygenated drip irrigation on soil–plant analysis development (SPAD), plant water potential, and photosynthetic characteristics, and analyze the correlation between physiological indicators and yield and quality; (3) explore the optimal drip irrigation depth for maximum yield and quality scores using principal component analysis.

2. Materials and Methods

2.1. Overview of the Experimental Area

Experiments were performed from April 2023 to October 2024 in a field at the Experimental Base of Specialty Forest Fruit of Xinjiang Agricultural University, Hongqipo Farm, Aksu Region, Xinjiang, China (41°17′ N latitude, 80°17′ E longitude, Figure 1). The test site has a continental temperate arid climate, according to local meteorological data statistics, with the last ten years averages for temperature (11.2 °C), effective cumulative temperature (3950 °C), average annual rainfall over the last ten years (about 74.4 mm), evaporation (about 2100 mm), total solar radiation (544.11–590.16 kJ cm−2), sunshine (2855–2967 h), and frost-free period (205–219 d). Soil average bulk weight is 1.51 g cm−3, soil texture is powdery loam, the field capacity of soil saturation a is 34.67%, the permanent wilting point is 15.42%. The clay, silt, and sand of soil content are 18.07%, 61.49%, and 20.45%, respectively. The water table is at 37 m.

2.2. Experimental Characteristics

Fruit tree variety is red fuji variety New Red 2, rootstock is Malus robusta Rehder, tree shape is free fusiform, tree age 10a (2023), fruit tree plant spacing is 3 m, row spacing is 4 m, prior to the experiment, there was little variability in the growth status of all trees. The experimental design of the different drip irrigation buried depth gradient (Complete Random Design), drip irrigation pipe depth are surface drip irrigation (CK) and underground 10 cm (Z1), 30 cm (Z2) and 50 cm (Z3) drip irrigation, a total of four experimental treatments. Each experimental treatment had 1 row of trees (7 fruit trees, 7 repetitions) and each experimental treatment covered an area of 84 m2. We arranged a 16 mm diameter drip irrigation pipe (Figure 2) along the center line of a row of trees 30 cm to the left and 30 cm to the right, with drip holes spaced 50 cm apart and a drip head flow rate of 2 L h−1.
We connected a micro-nano-generation device (Irrigation water aerator, China, Summer Spring Technology Corporation) to the irrigation main pipeline common to the four experimental treatments to oxygenate the irrigation water, which could mix the water and air in the irrigation pipeline (increase the gaseous oxygen and dissolved oxygen in the irrigation water) to form micro-nano-bubbly water, and the micro-nano-bubbles in the irrigation water had particle sizes ranging from 200 nm to 4000 nm, with bubble content ranging from 84% to 90%, as a result of our measurements, we determined that the four treatments had the same concentration of micro- and nano-bubbled water and the same amount of irrigation water. Moreover, we installed a water meter at the front of the water inlet of the micro-nano generation device to measure the amount of pure irrigation water (the amount of water without air). The total amount of irrigation water for all treatments in the experiment was 5250 m3 ha−1, of which 164.1 m3 ha−1 was irrigated each time from flowering and fruiting stage to young fruit stage, and 273.3 m3 ha−1 from fruit expansion stage to maturation stage, and the irrigation cycle was determined based on the local drip irrigation cycle for apple orchards, which was set at 7 days, with a total of 24 irrigations in the annual cycle. Water-soluble fertilizers were applied dropwise with each irrigation, and the total amount of N:P2O5:K2O fertilizers applied to apples during the whole life cycle was 150:90:150 kg ha−1. We installed a fertilizer tank (shared by the four experimental treatments) at the outlet of the ultra-micro-nano aerator for drip application of water-soluble fertilizer. Pruning, combing, spraying and other management techniques were the same in all treatments.

2.3. Measurements of Soil and Plant

(1)
Soil water content
Hydra sensors (FDR, Stevens Water Monitoring Systems, Inc., Portland, OR, USA) were buried at six depths in the upper 100 cm of soil (10, 20, 40, 60, 80 and 100 cm); data were recorded at 30 min intervals. Hydra sensors measurement were the volumetric water content of soil, and we used the soil drying method and soil bulk density data to calibrate the data measured by the Hydra sensors instrument to ensure the reliability and accuracy of the soil water content measurement data.
(2)
Leaf nitrogen (N), phosphorus (P), and potassium (K) contents
During the fruit expansion stage, 3 groups of leaves were randomly collected from each treatment (across 3 trees), then dried in an oven at 105 °C for 30 min, dried to constant weight at 80 °C, and then crushed and sieved (0.1 mm). Total N was determined using the Kjeldahl method, total P by vanadium-molybdenum yellow colorimetry, and total K by flame photometry.
(3)
New shoot tip abscisic acid (ABA), indoleacetic acid (IAA), total gibberellin (GA), and zeatin riboside (ZRs) contents
Five new tips were randomly picked each treatment during the fruit expansion stage, and frozen in liquid N. An appropriate amount of liquid N was then added to 0.5 g samples for grinding. After sample extraction, sample purification, and separation using liquid chromatography, ABA, IAA, GA, and ZRs contents were determined by liquid chromatography-mass spectrometry (LC-MS).
(4)
Plant water potential
On a sunny day, three leaves with the same orientation were randomly picked from three sample trees. Approximately 1.5 to 2 h prior to Psi measurements, leaves were placed in aluminized bags to bring them into equilibrium with the xylem potential. Plant water potential was determined using a plant water potential meter (ZWS-I, Beijing Jinyang Wanda Technology Co., Ltd., Beijing, China) between 8:00 and 20:00, with measurements made every 2 h for 3 d during each vegetation season.
(5)
Leaf SPAD
Three leaves of the same age as the environment subjected to the light were randomly selected from three branches of three trees, and all leaves were labeled. The same leaf was measured each time, using a chlorophyll meter (SPAD-502, Minolta, Tokyo, Japan).
(6)
Photosynthetic data
Typical sunny weather was selected, and a Portable Photosynthesis System (Li-6800, LI-COR Inc., Lincoln, NE, USA) was used to determine the light-response characteristics of leaves between 10:00 and 12:00. The relative humidity of the air in the leaf chamber was 55%, and air temperature was 30 °C; and CO2 cylinders provided the air, with a 400 ppm CO2 concentration in the leaf chamber. Photosynthetically active radiation flux density was con-trolled at 2000, 1800, 1600, 1400, 1200, 1000, 800, 600, 400, 200, 100, 50, and 0 μmol m−2 s−1 using an artificial light source, and measured for 120 s at each intensity.
The expression for the right-angle hyperbolic modified model is
P n = α 1 β I 1 + γ I I R d
P n m a x = α β + γ β γ 2 R d
L S P = ( β + γ ) / β 1 γ
where α is the initial slope, β is the photoinhibition coefficient, γ is the light saturation coefficient, and I is the photosynthetically active radiation intensity (μmol m−2 s−1).
(7)
Yield
At the maturation stage, all fruit was picked from three randomly sampled trees in each treatment. Average fruit weight was determined to calculate the yield of a single tree; yield per hectare was obtained by multiplying the yield of a single tree by the number of trees per hectare.
(8)
Fruit quality
Fruit quality indexes were determined from mature apples. Fruit quality was determined from three randomly selected apples per treatment, and all fruit quality measurements were taken from three apples randomly selected from each treatment group. Each apple was measured once for each quality indicator, and each treatment had three sets of repeated data. The fruit individual fresh weight (FW) was measured using an electronic scale with an accuracy of 0.1 g. Fruit longitudinal and transverse diameters were measured by Vernier calipers (0.01 mm). A fruit shape index (FSI) was obtained by dividing the fruit longitudinal diameter by the fruit transverse diameter.
F S I = L D T D
where F S I is the fruit shape index, LD is the longitudinal diameter (mm), TD is the transverse diameter (mm).
Fruit hardness (FH) was determined using a fruit hardness tester (Ed-berg GY-4, Dongguan Yongqi Electronic Equipment Co., Ltd., Dongguan, China); fruit color (L, a, b) was determined by colorimeter (NH310 Portable Colorimeter, Shenzhen San En Shi Technology Co. Ltd., Shenzhen, China); soluble solids (SS) were determined using a Sowei Brix Meter (SW-93T, Sowei Instruments, Guangzhou, China); Determination of titratable acids (TA) using NaOH at a concentration of 0.1 N; the solid–acid ratio (SAR) was obtained from the ratio of soluble solids to titratable acid content; and VC content was determined by spectrophotometry.

2.4. Data Processing

Microsoft Excel 2019 was used to organize data; Origin 2021 was used for plotting, data fitting, and principal components analysis (PCA); one-way ANOVA (p < 0.05), and the least significant difference (LSD) test were performed in SPSS19.0. GENESCLOUD (https://www.genescloud.cn/home) (accessed on 2 April 2025) is used as a partial mantel correlation analysis and generates a heat map of the correlation network. Partial mantel analysis allows direct analysis of the direct correlation between two sets of variables, controlling for the effect of a third variable on the others, and thus more accurately assess the true correlation between two variables.

3. Results

3.1. Soil Water Content

Figure 3 showed the distribution of soil moisture content during the fruit expansion stage of different treatments. Soil water contents at 10 cm in the control (CK) were higher than in treatments; soil evaporation would also be higher in the CK. The highest water contents occurred at 20 cm (Z1 treatment) and 40 cm (Z2 treatment) at the main rooting depth. The highest water contents in treatment Z3 were at 60 and 100 cm.

3.2. New Shoot Endogenous Hormone Contents

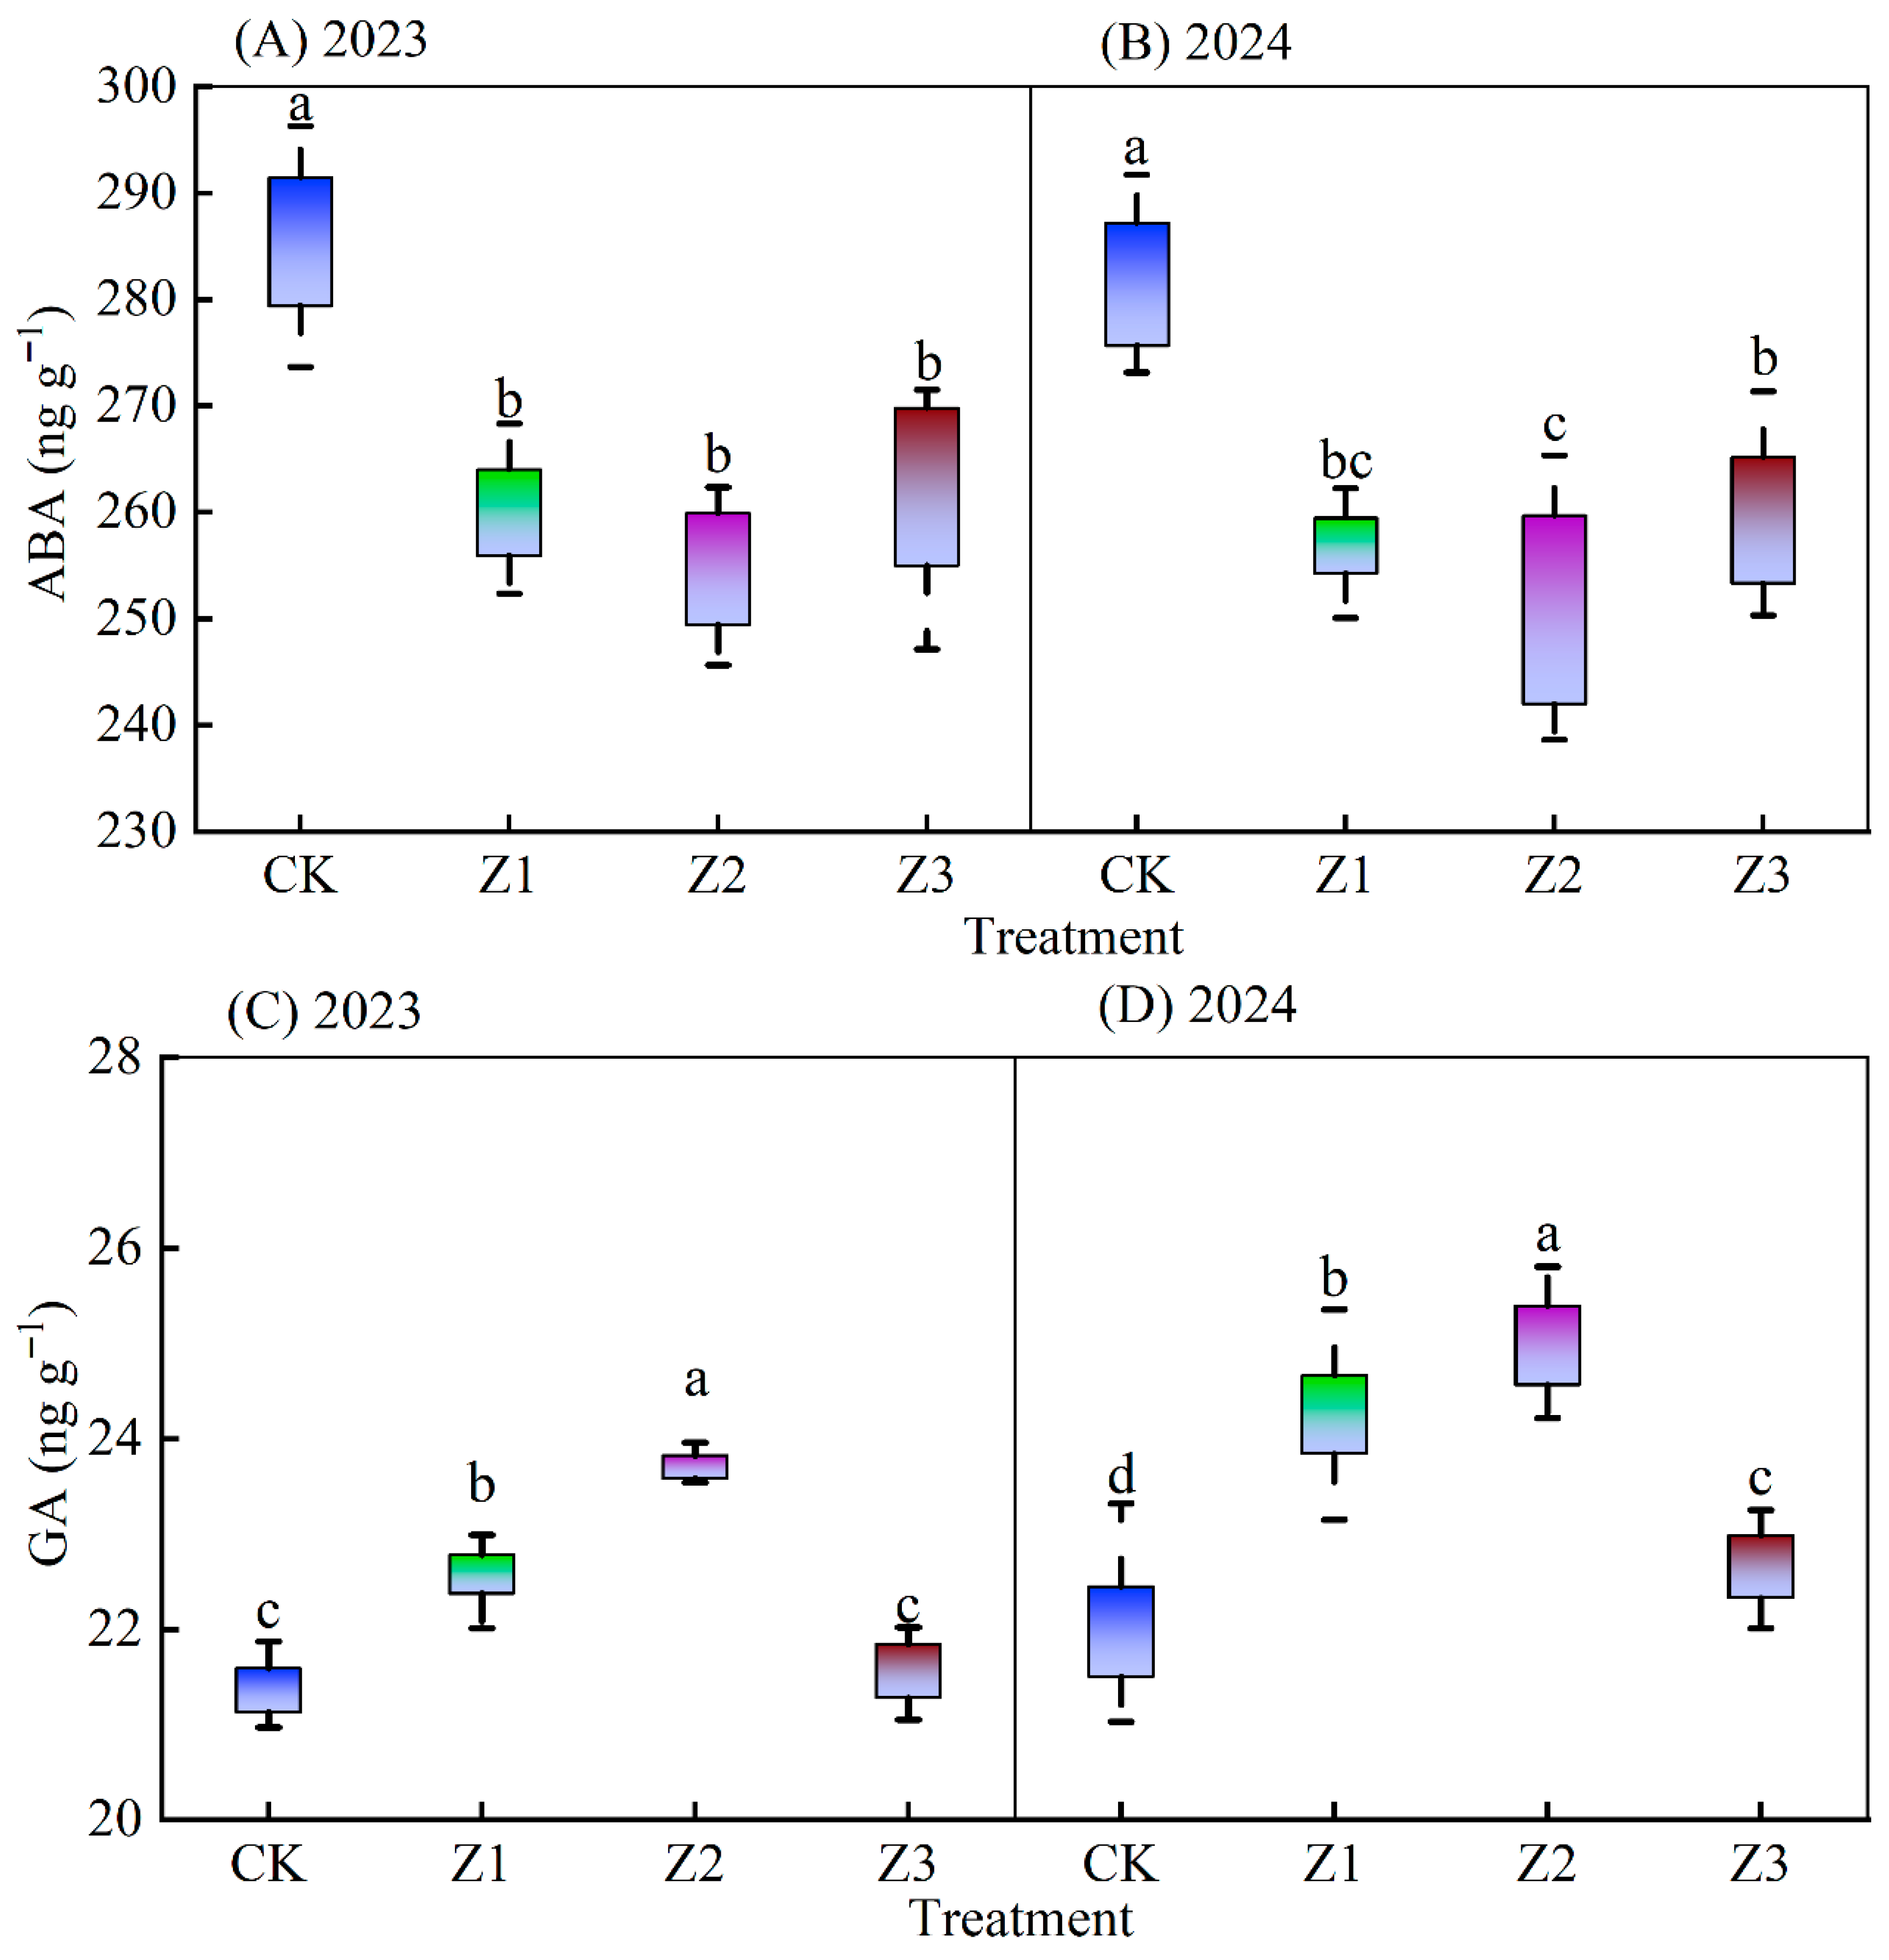
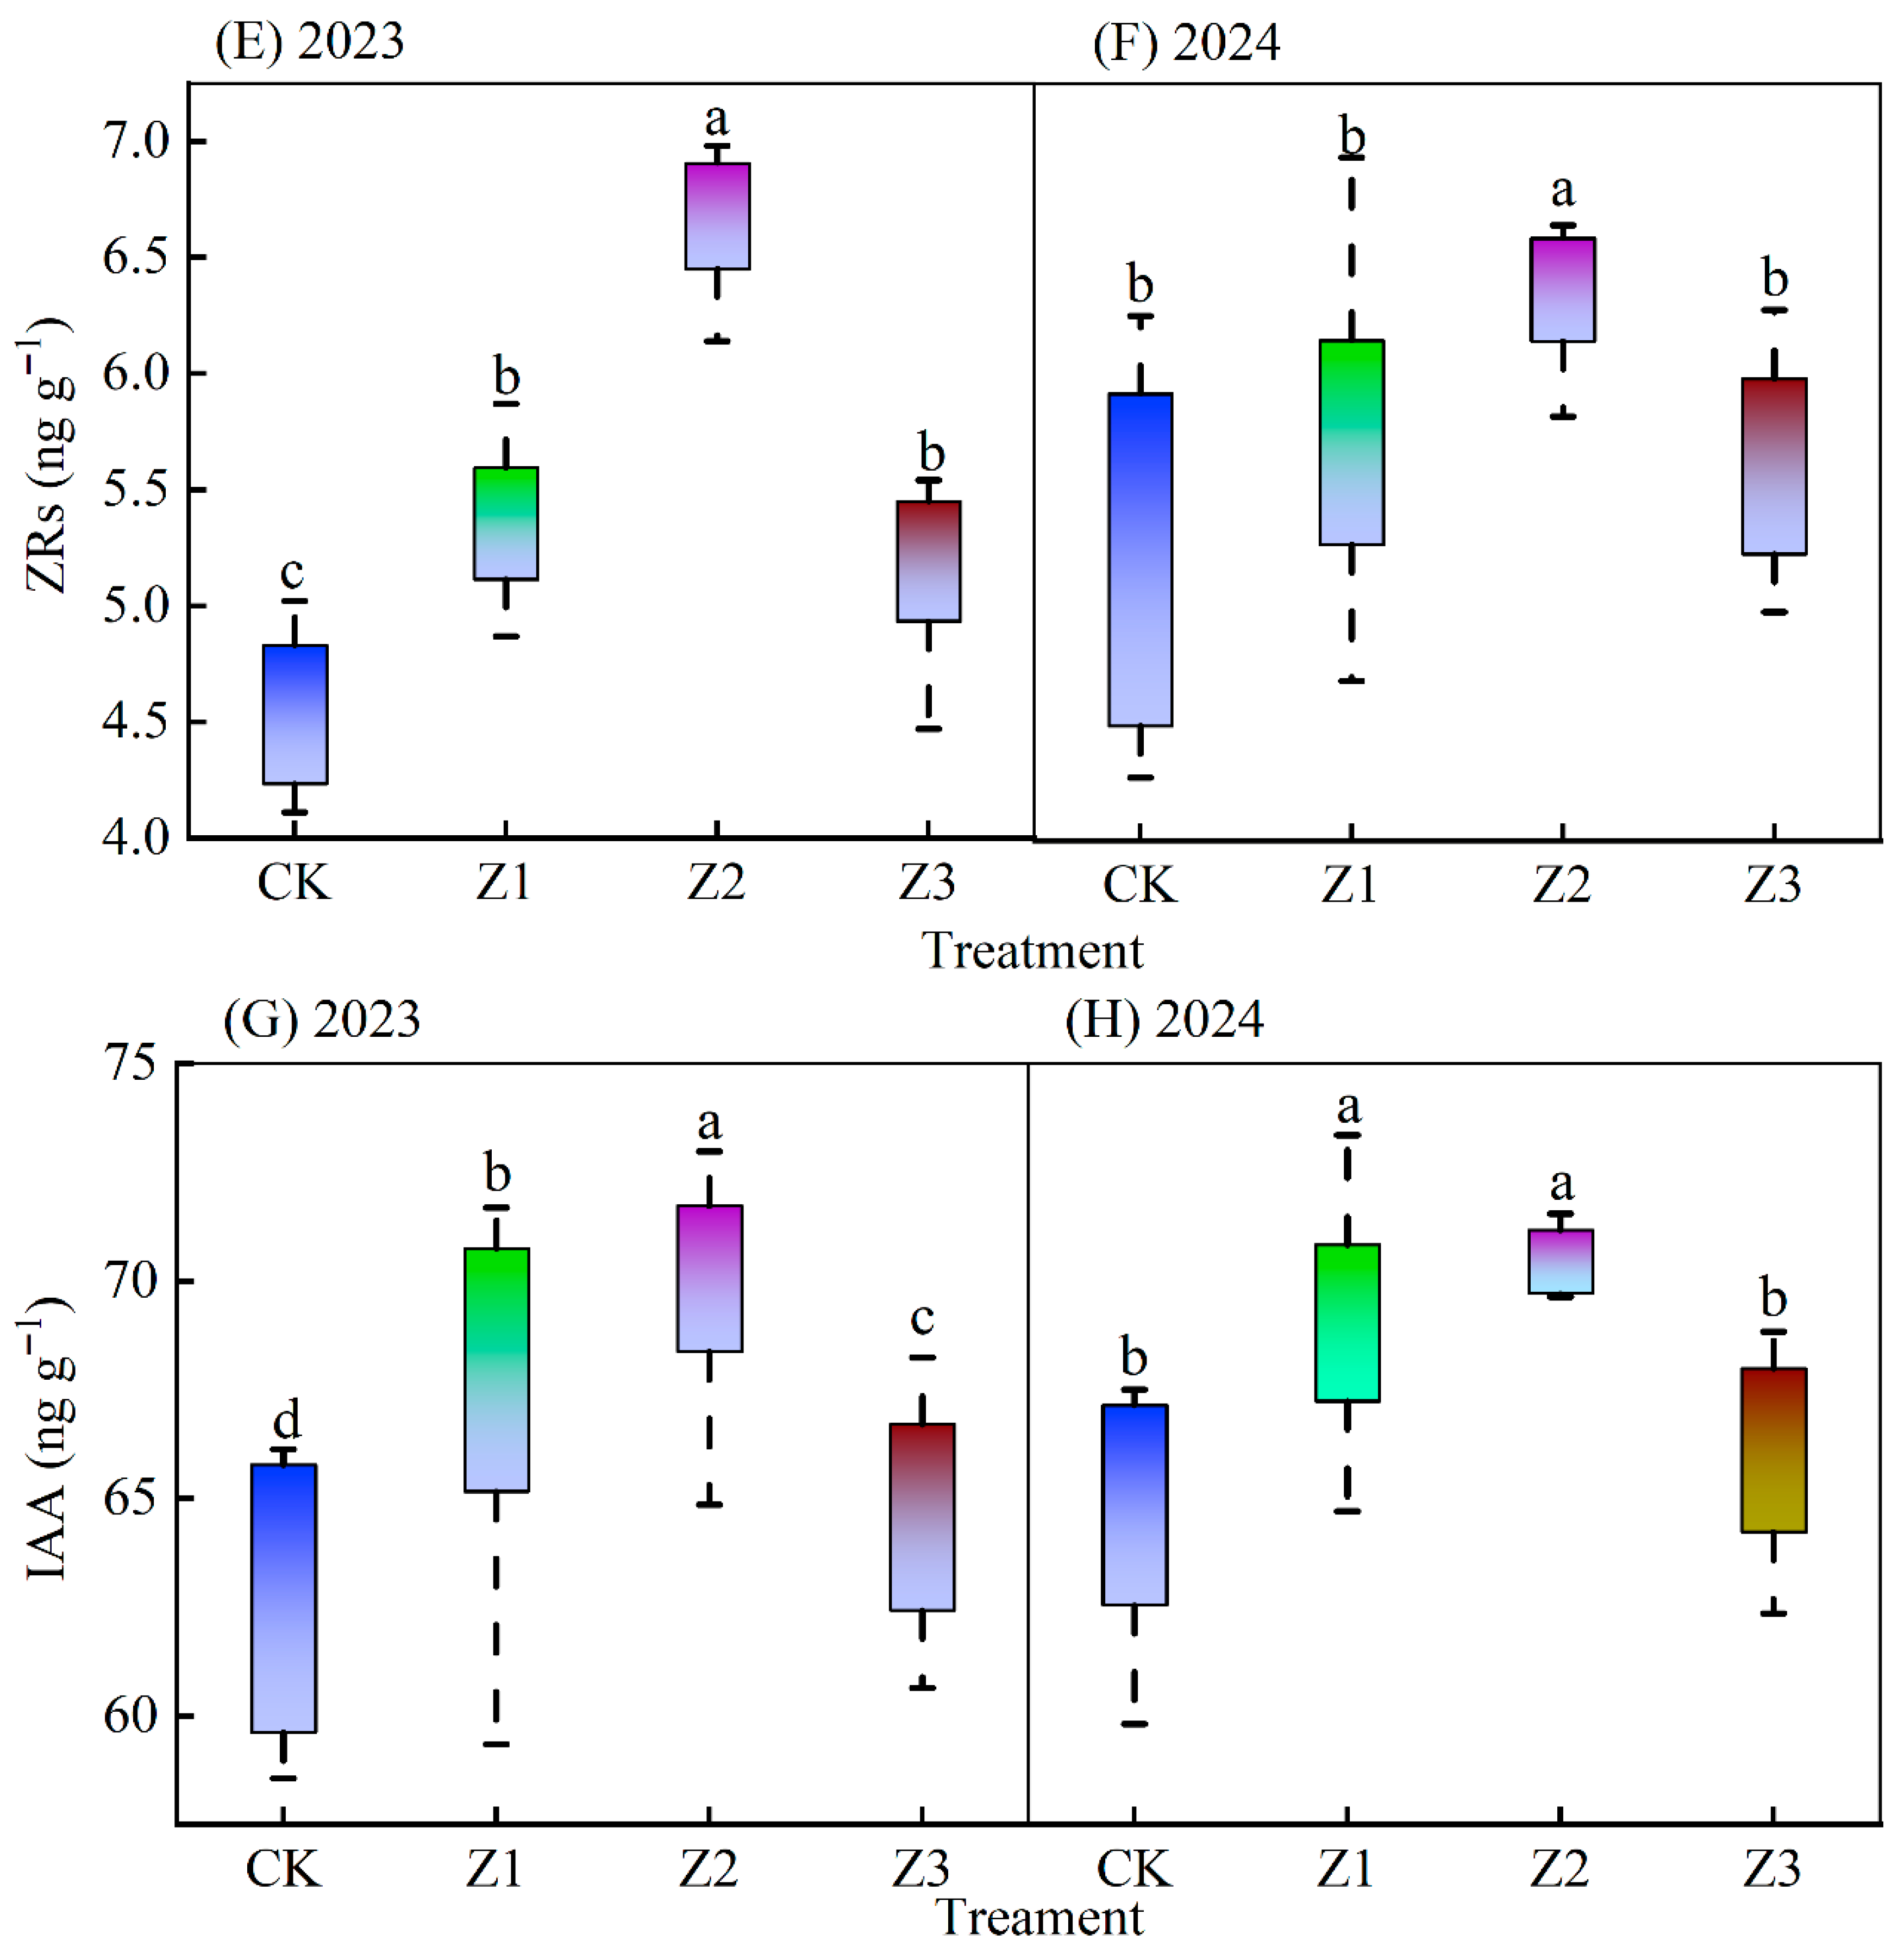
ABA content of new stem tips in each vegetation season and treatment trended upwards, then downwards with increased drip irrigation tube burial depth (Figure 4). Compared with the CK, new stem tip ABA contents were reduced on average by 9.06% (Z1), 11.04% (Z2), and 8.18% (Z3) for the two vegetation seasons. Differences in ABA content between the CK and Z1, Z2, Z3treatments were significant (p < 0.05). Differences in ABA between the Z1, Z2, and Z3 treatments were not significant. The GA content of Z1 and Z2 treatments in both years was enhanced by an average of 7.92% and 12.30%, respectively, compared with that of CK, and showed significant differences with CK treatment. The IAA content of Z1 and Z2 treatments increased by an average of 7.80% and 11.13%, respectively, compared with the CK treatment, and showed significant differences with CK and Z3. The Z2 treatment had the highest ZRs content among all treatments, with an average enhancement of 37.88% over the CK treatment, which was significantly different from the values of CK, Z1 and Z3 treatments.

3.3. Leaf Nutrient Contents

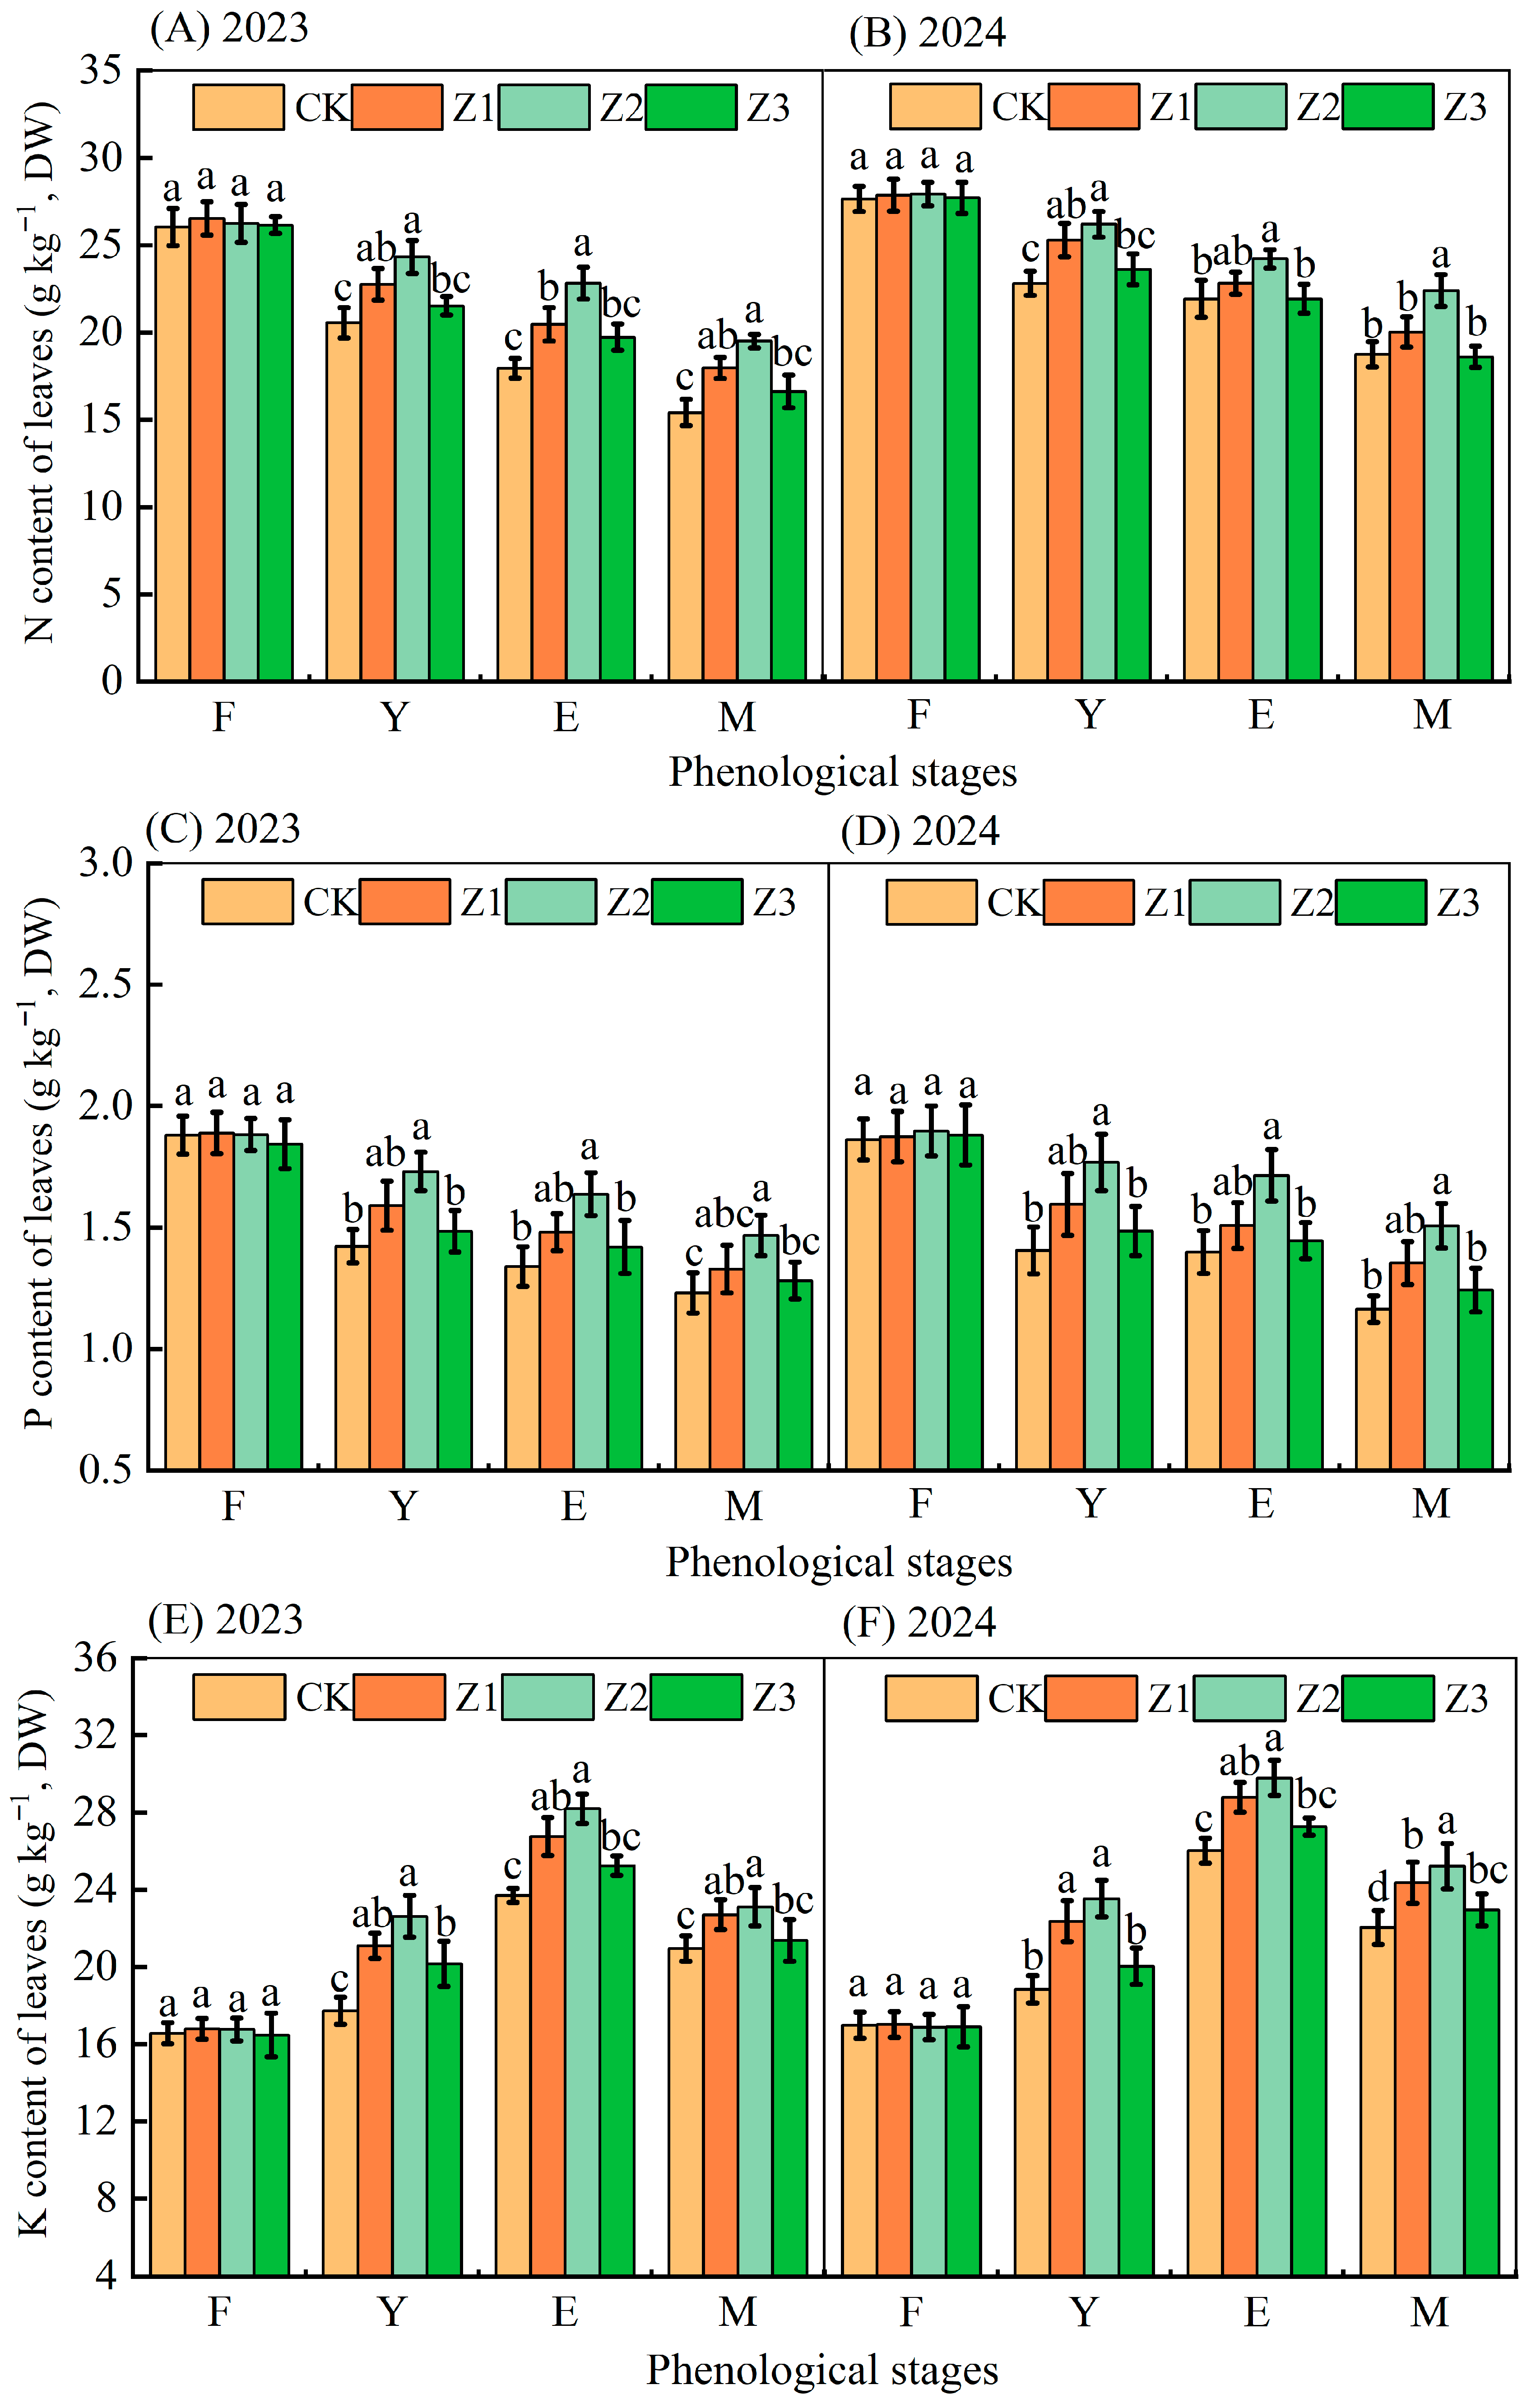
Characteristics of N, P, and K contents of leaves during vegetation season differed between treatments (Figure 5). Leaf N and P content of different treatments gradually decreased with the advancement of fruit development, and leaf K content showed a pattern of first increasing and then decreasing with the advancement of fruit development. N, P, and K contents of leaves in the four treatments did not differ between treatments both years at the flowering and fruiting stage (p > 0.05), but they did differ significantly during flowering and fruit set stage, fruit expansion stage, and maturation stage (p < 0.05). For both years, taking the fruit expansion stage as an example, compared with CK, mean leaf N contents increased in treatments Z1, Z2, and Z3 by 8.63%, 18.03%, and 4.51%, respectively; mean P contents increased by 9.21%, 22.42%, and 4.69%, respectively; and mean K contents increased by 11.68%, 16.63% and 5.62%, respectively, while treatments Z1 and Z2 enhanced leaf N, P, and K contents.

3.4. Plant Water Potential

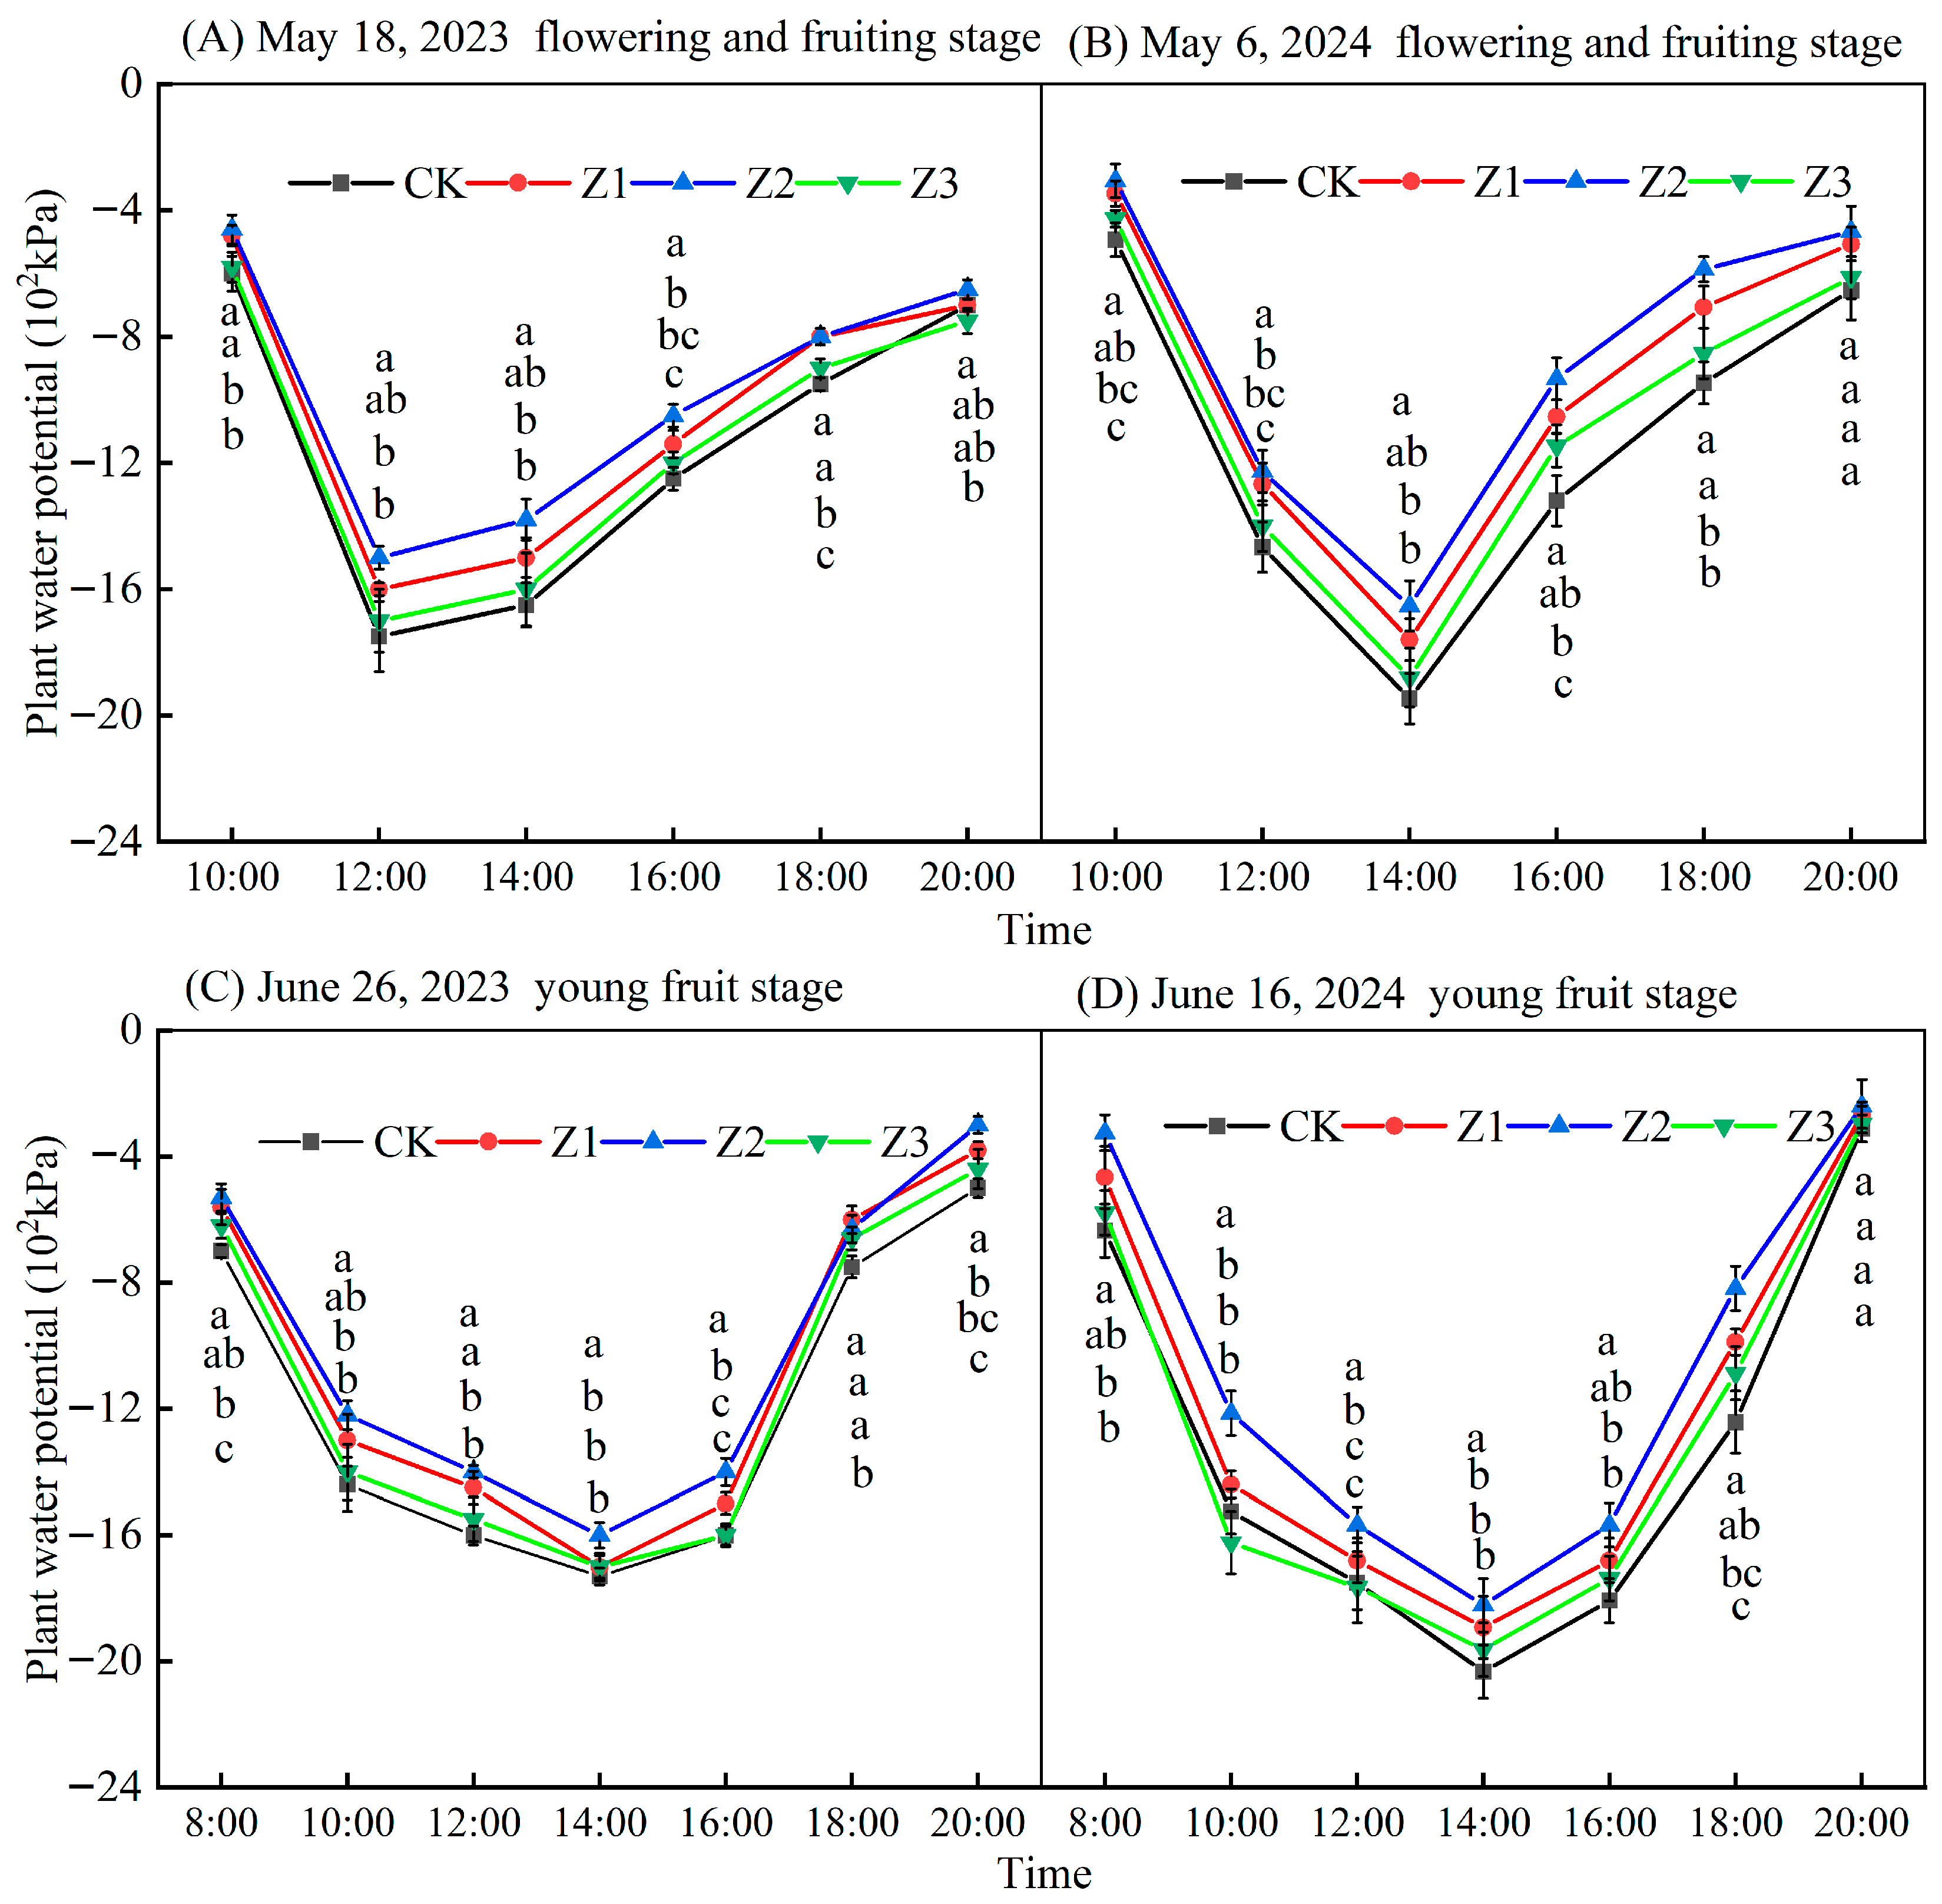
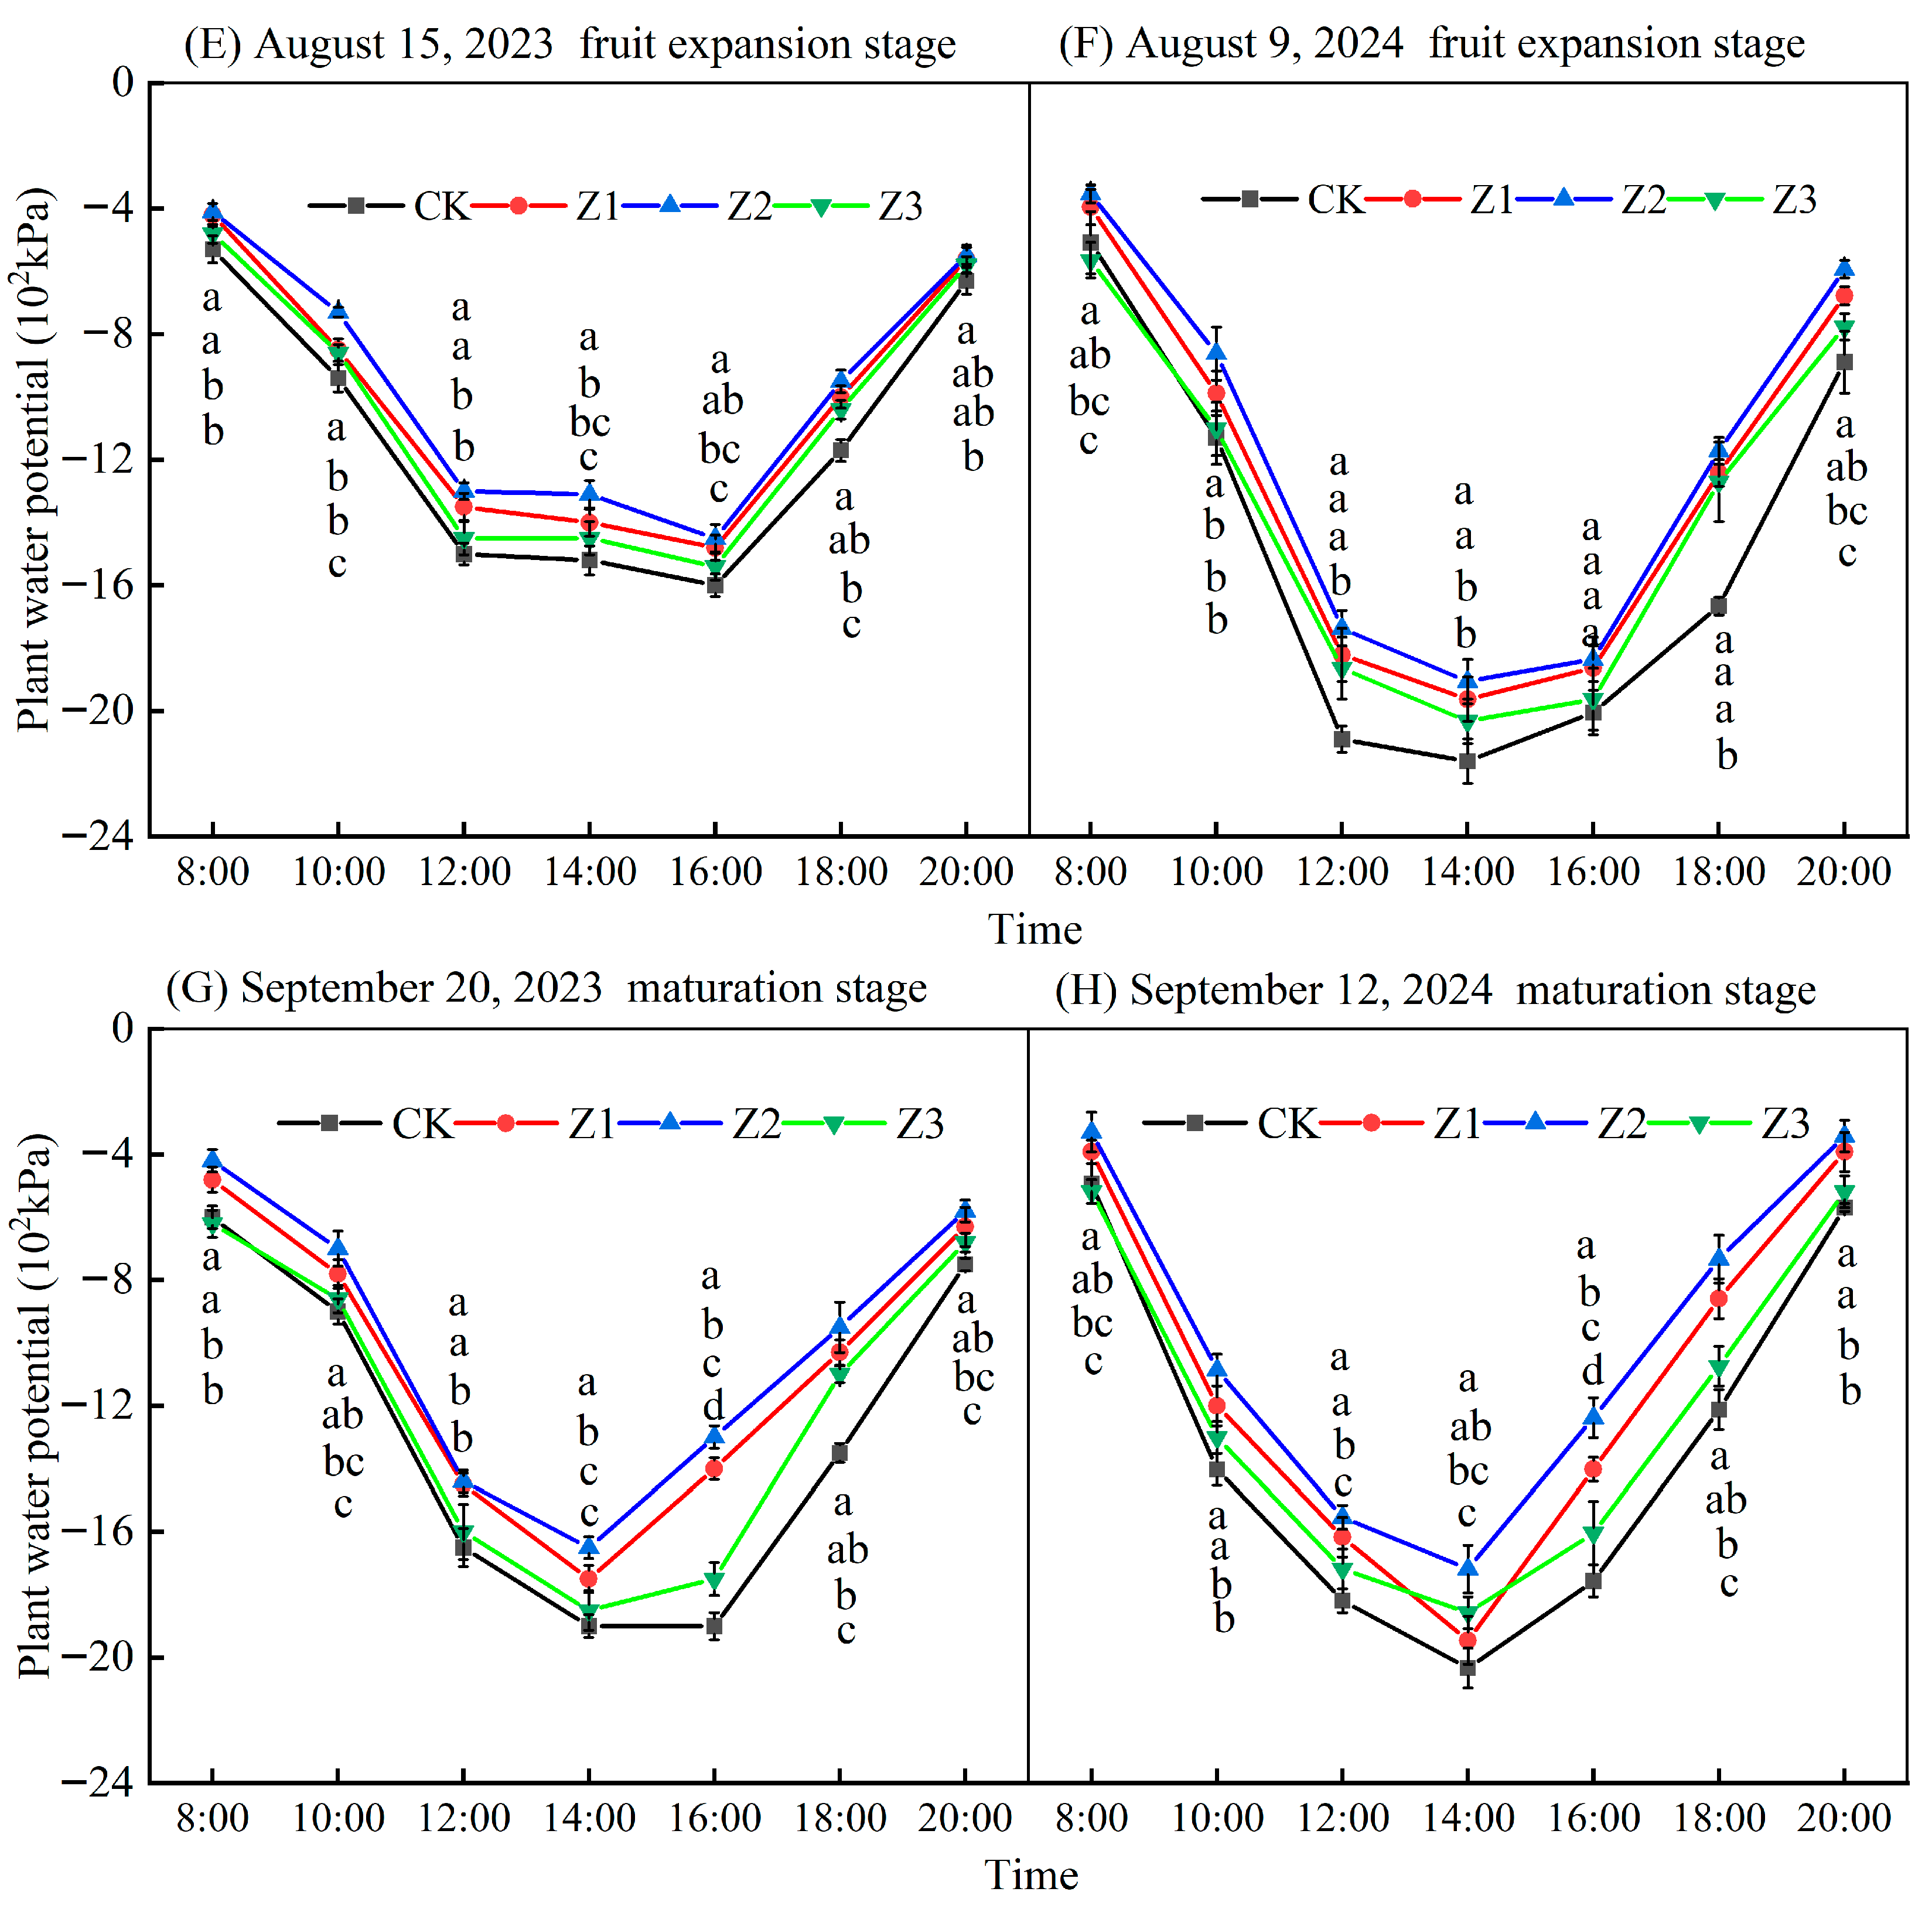
Figure 6 showed the daily variation in plant water potential at different dates in 2023 and 2024. Daily changes in plant water potential for both years initially trended down, then increased with time. The overall plant water potential in treatments was Z2 > Z1 > Z3 > CK. Compared with CK values (May, 2023 and 2024), plant water potential in Z1, Z2, and Z3 treatments increased by 11.88%, 17.40%, and 4.16%, respectively; in June (2023 and 2024) this was 8.95%, 15.21%, and 3.25%, respectively; in August (2023 and 2024) this was 11.32%, 15.58%, and 6.65%; for September (2023 and 2024) these values were 15.17%, 21.46% and 6.40%, respectively. Treatment Z2 had the highest average daily plant water potential and treatment CK the lowest.

3.5. Apple Leaf SPAD and Light Response Characteristics

3.5.1. Leaf SPAD Values During the Reproductive Period

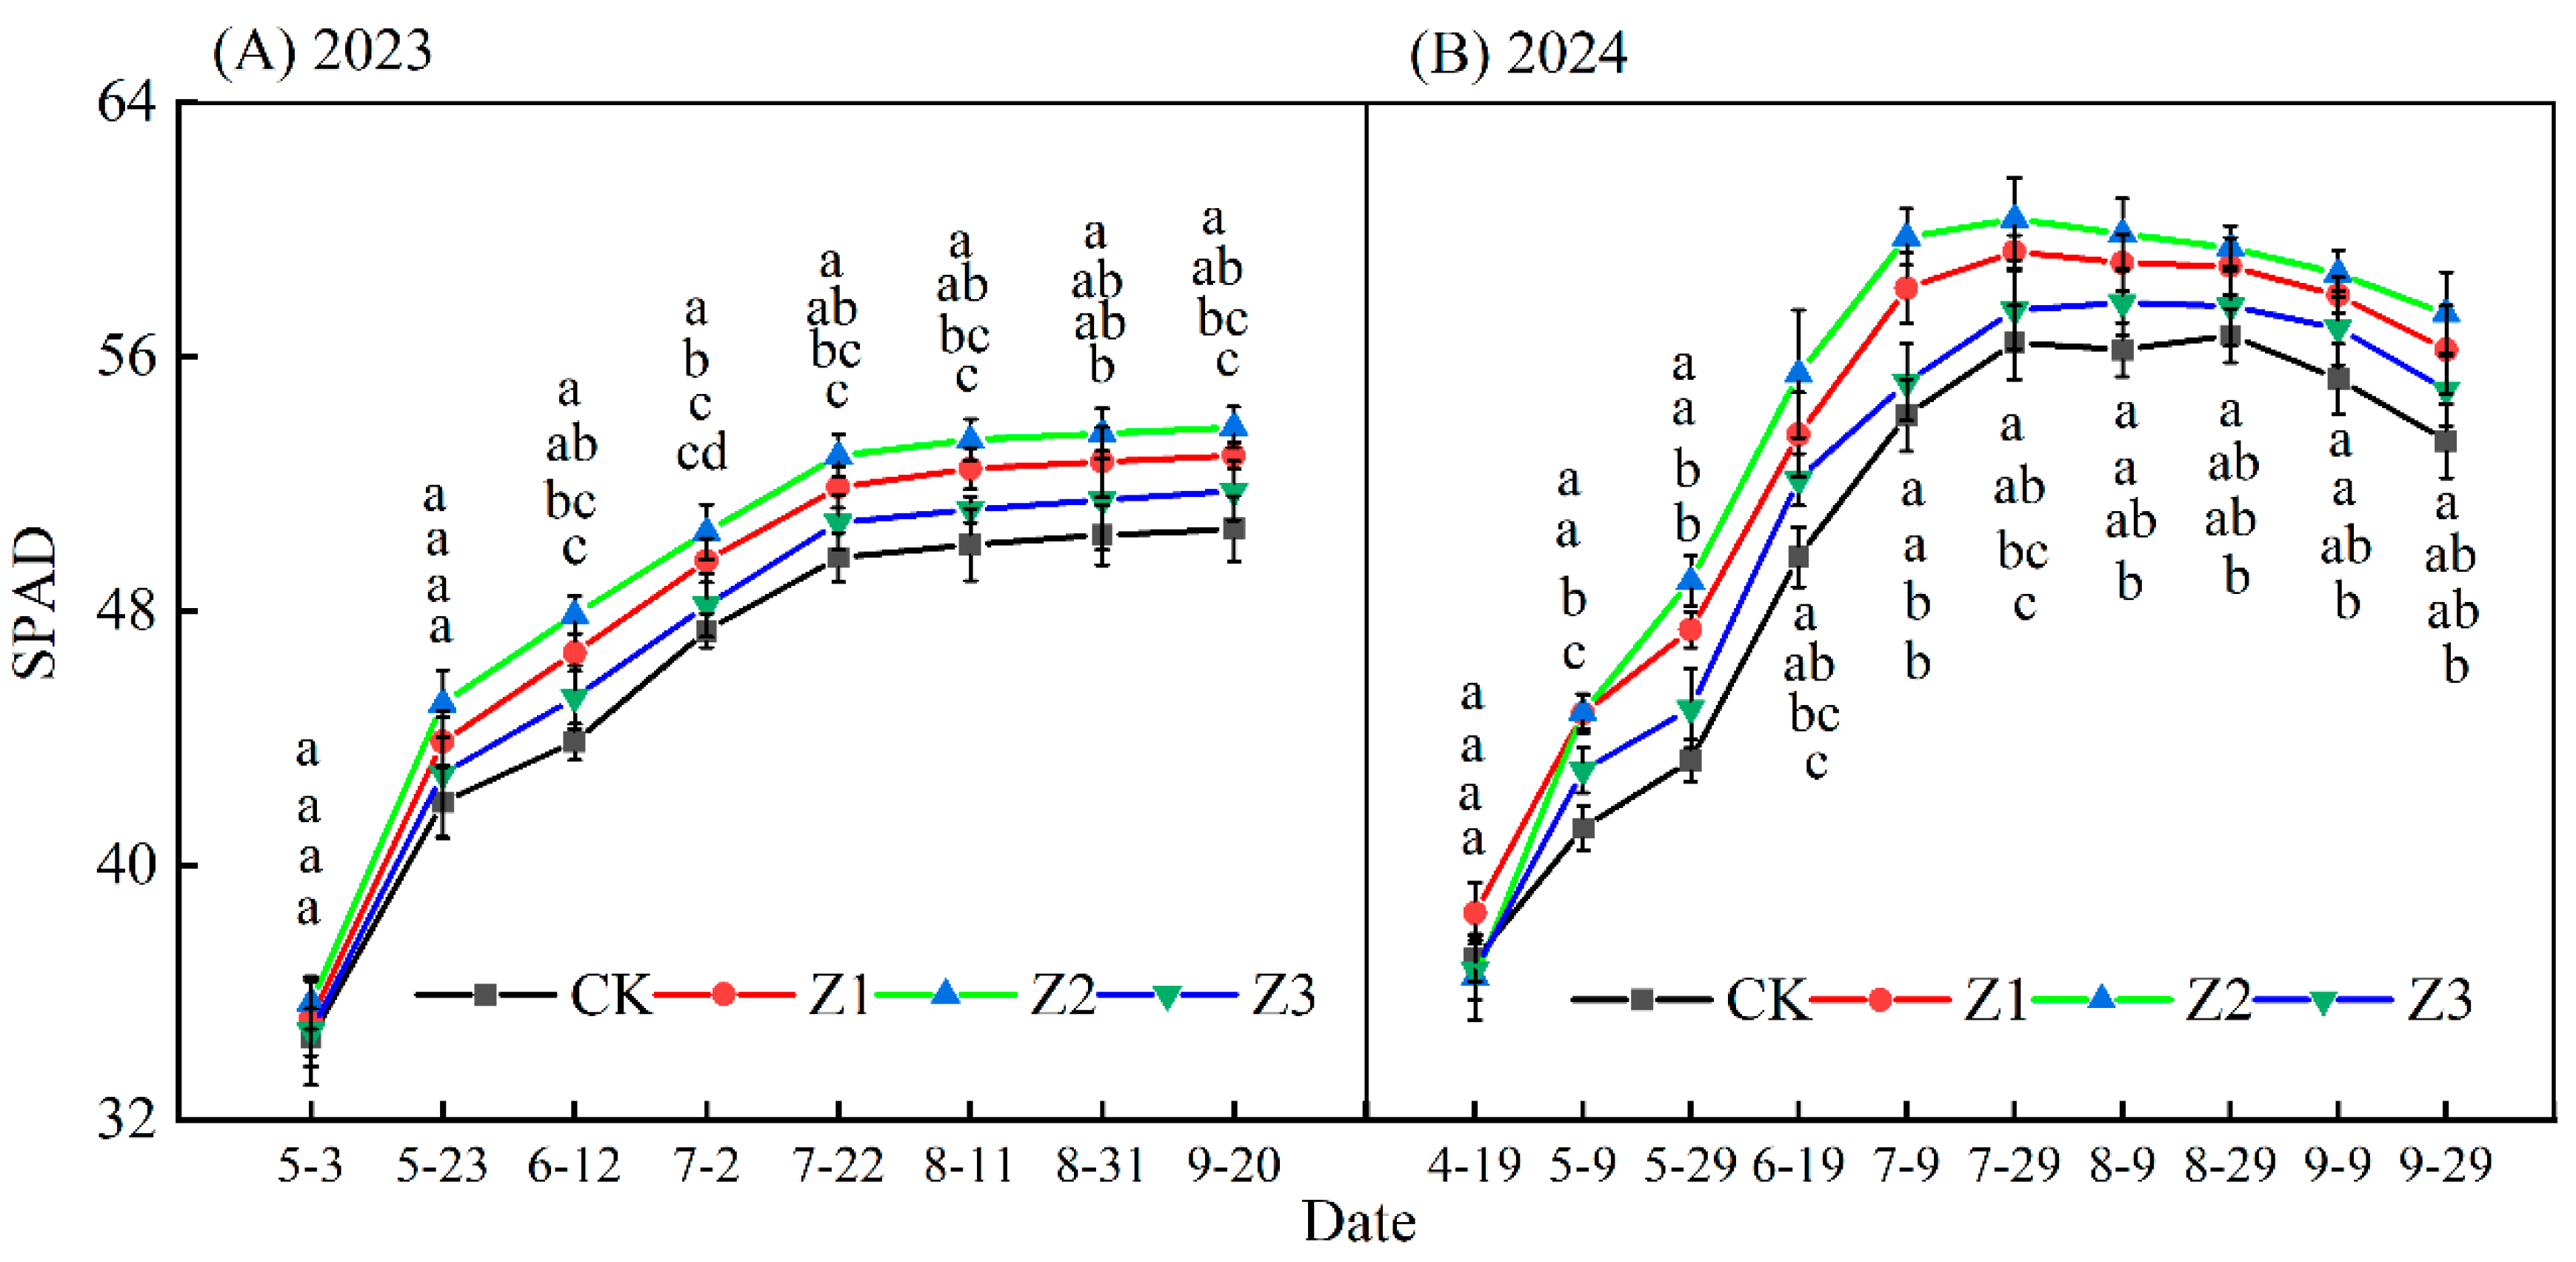
In 2023, as apple reproductive stages, leaf SPAD values in treatments initially trended upwards, then stabilized (Figure 7); for 2024 these values initially trended upwards, then downwards. Different drip irrigation depths significantly affected leaf SPAD values in both years (p < 0.05). For both years, 3 May and 19 April, there were no significant differences in leaf SPAD values between treatments (p > 0.05), with SPAD values ranked Z2 > Z1 > Z3 > CK. Compared with CK values, during the fruit expansion stage in both years (11 August (2023) and 9 (2024)), leaf SPAD values were increased by 4.47% (Z1), 6.06% (Z2), and 2.24% (Z3), respectively. Compared with CK values, during the maturation stage in both years (20 September (2023) and 29 (2024)), leaf SPAD was increased by 4.56% (Z1), 6.36% (Z2), and 2.47% (Z3).

3.5.2. Leaf Light Response During the Fruit-Expansion Stage

Light-response characteristics in treatments for both years showed the same pattern (Figure 8 and Table 1). α values for each treatment ranked Z2 > Z1 > Z3 > CK. Compared with the CK, β values reduced by 31.43% (Z1), 41.02% (Z2), and 21.43% (Z3) in both growing seasons. In both growing seasons, γ values in treatment Z2 were greatest, and in treatment CK lowest. Dark respiration rate (Rd) indexes followed the same pattern. Compared with the CK, the Pnmax value for Z1, Z2, and Z3 treatments increased by 11.12%, 18.91%, and 5.19%, respectively. In both years, the light-saturation point in Z2 treatment was greatest and that in CK treatment lowest; the light compensation and light saturation points in different treatments showed opposite patterns. We define the difference between light saturation and light compensation points as a range of plant photosynthesis in response to light intensity. For 2023, light flux utilization ranges in the CK and Z1, Z2, and Z3 treatments were 1455.83, 1518.27, 1547.98, and 1465.20 μmol m−2 s−1; for 2024 these values were 1566.69, 1709.22, 1756.93, and 1606.86 μmol m−2 s−1, respectively. In both years, treatment Z2 had the largest range of light flux utilization and the CK treatment the lowest.

3.6. Apple Yield, Quality, and Correlation Analysis

3.6.1. Apple Yield and Quality

Table 2 was an indicator of apple yield. Single fruit weight, fruit shape index, fruit hardness, L (The lightness and darkness of colors), a (Redness and greenness of colors), VC content, and yield of different treatments trended upwards, then decreased with increased drip irrigation burial depth. b showed a gradual decrease in trend in 2023, and showed a gradual increase in the change rule in 2024. It showed that L and b were not affected by the depth of drip irrigation. In both years, only single fruit weight of Z2 treatment showed a significant difference with all other treatments and was 16.68% higher than CK treatment. Fruit shape index was not significantly different for all treatments. In both vegetation seasons, only the Z2 treatment showed significant differences with CK for L. The c comparisons of the Z2 treatment with the CK treatment showed significant differences only in 2024. In both growing seasons, soluble solids, titratable acid, sugar to acid ratio, and VC of Z2 treatment showed significant difference from CK treatment. In both vegetation season, the yield was shown to increase with the increase in the buried depth of the drip irrigation pipe and then decrease the change rule, and the yield of Z2 treatment was the highest among all treatments, and the yield of the two years compared with that of CK was increased by 8.72% on average.

3.6.2. Correlation Analysis of Apple Yield and Quality

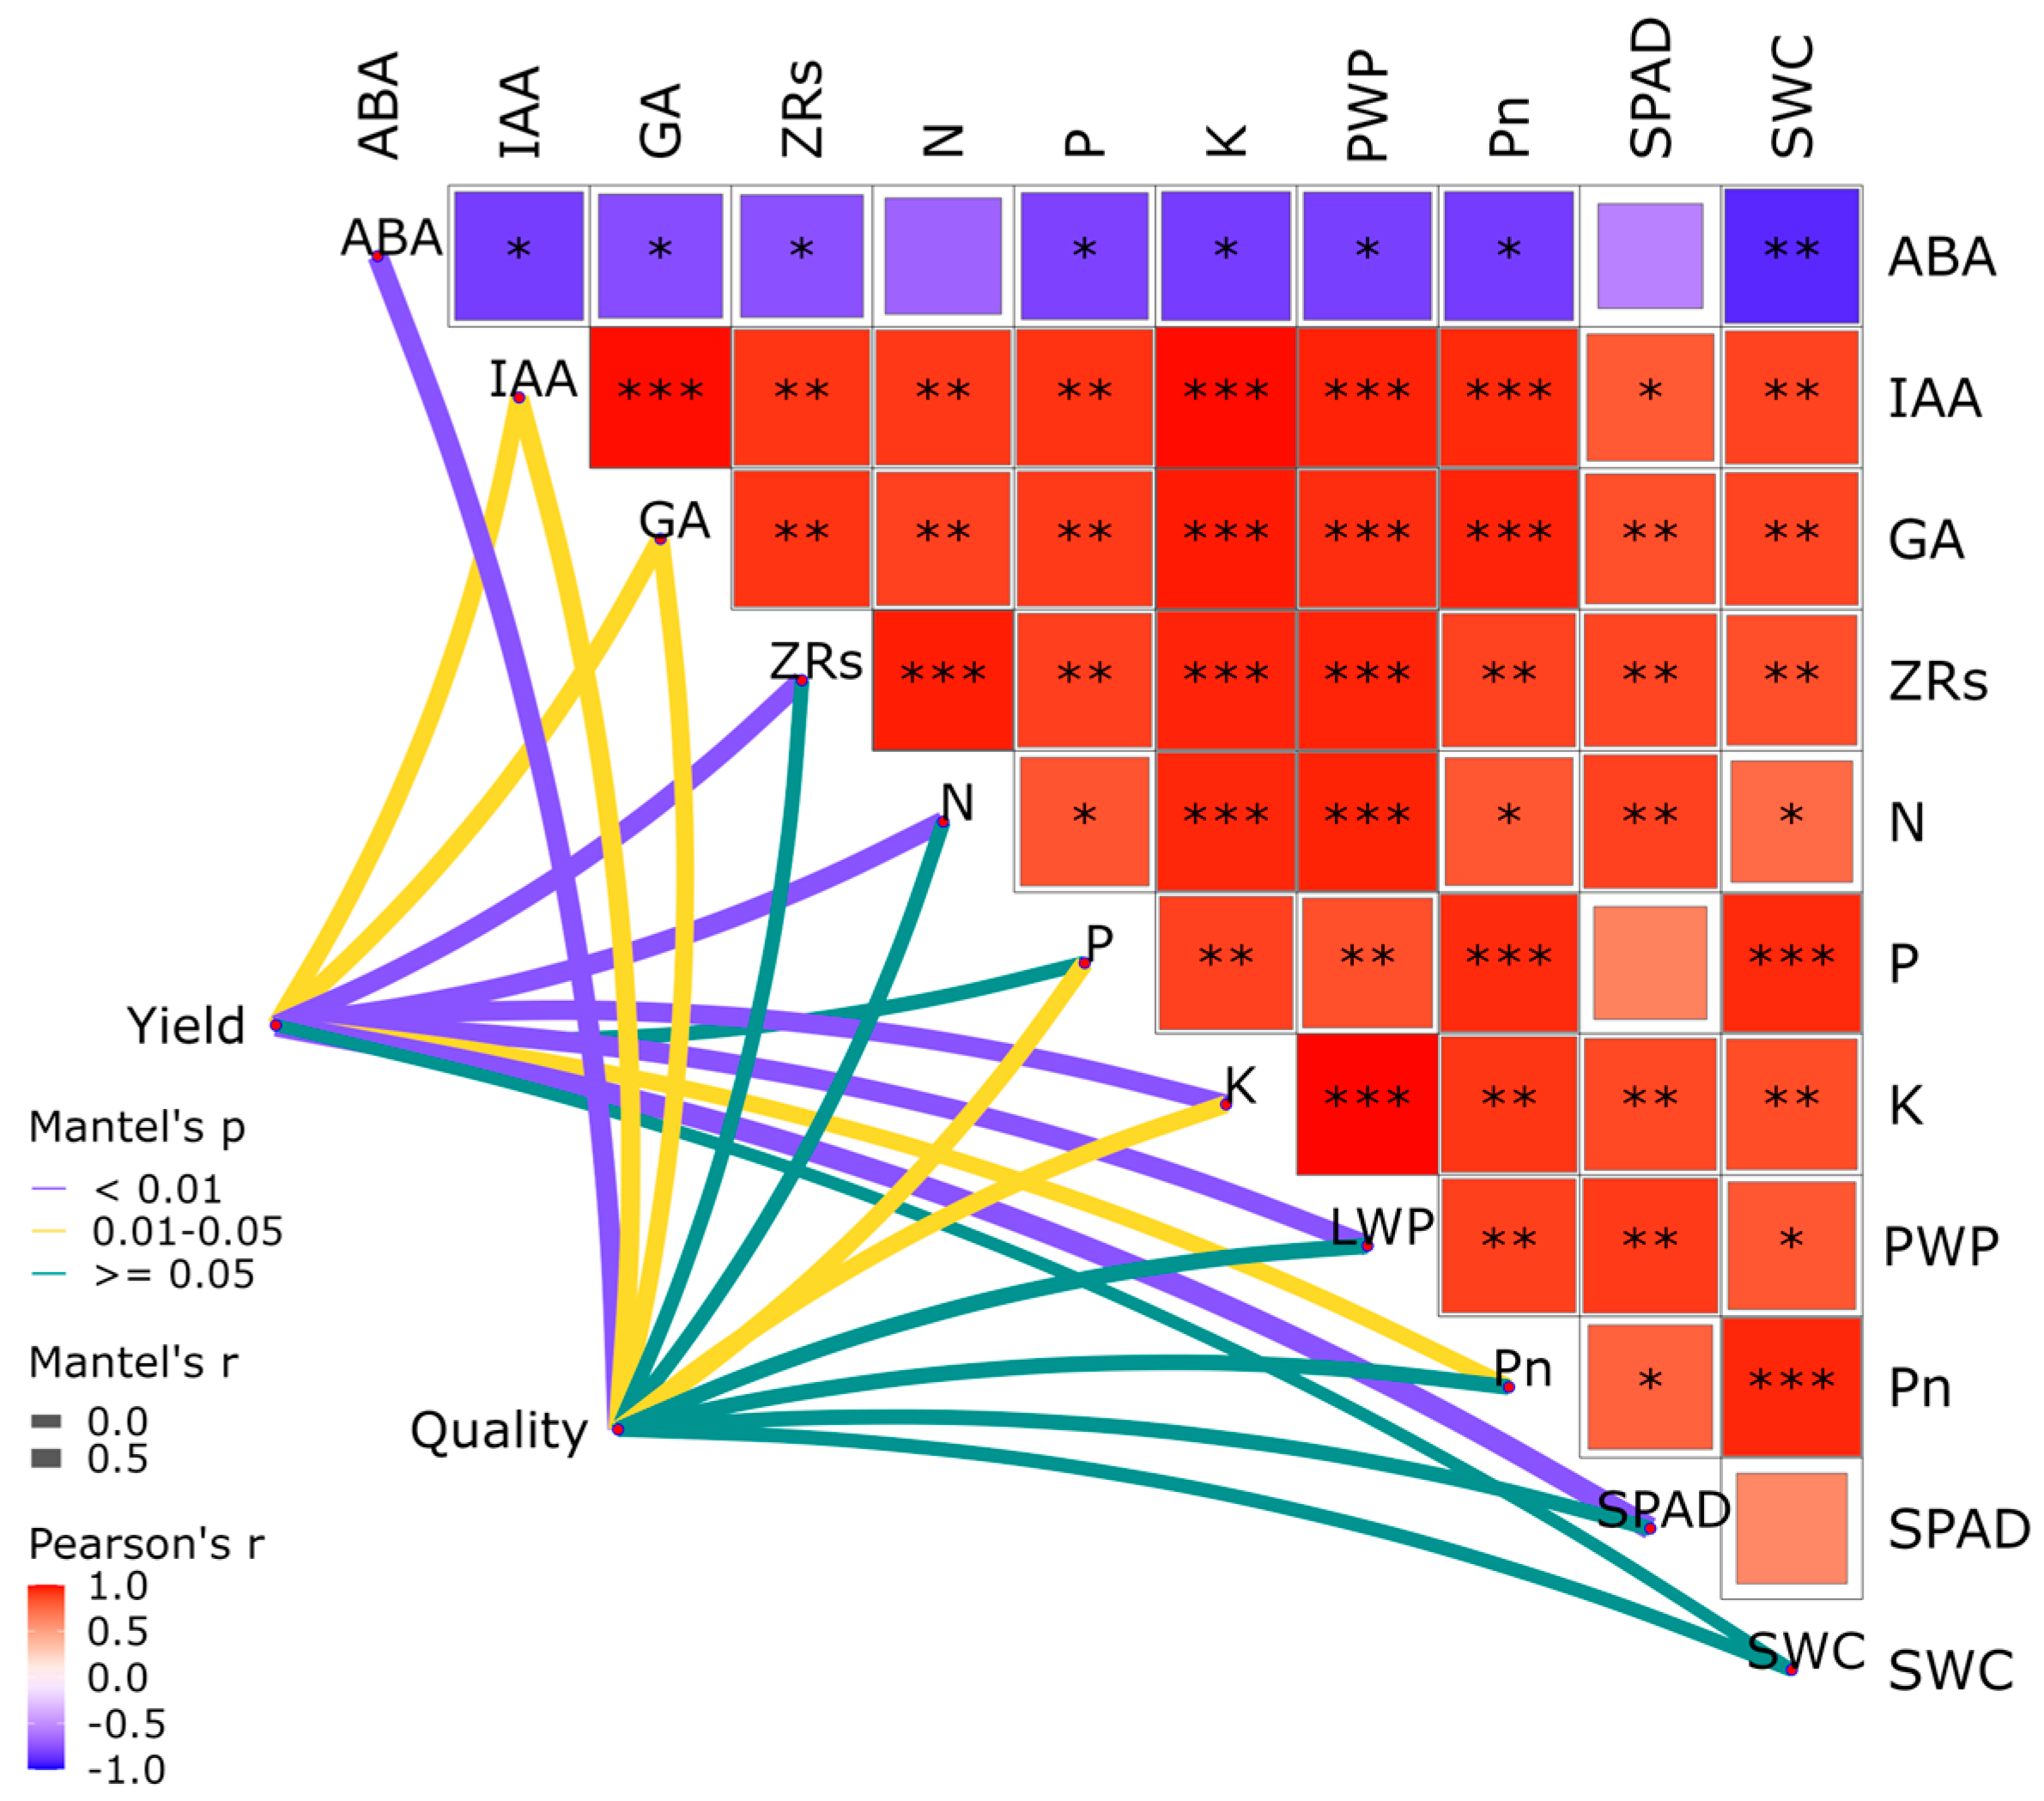
Partial mantel analysis was performed between yield and overall quality (L, a, b, SS, TA, SA, VC, WF, and FSI) of apples in 2023 and 2024 with physiological indicators (Pn, SPAD, PWP, ZRs, ABA, GA, IAA, N, P, and K) and soil moisture content, as well as Pearson analysis between physiological indicators and soil moisture content (Figure 9). The highly significant correlations (p < 0.01) with yield were ZRs, leaf N content, leaf K content, PWP and SPAD, and the significant correlations (p < 0.05) with yield were IAA, GA, and Pn. All the correlations were significant with Pn, and all the correlations were significant with SPAD except for ABA and leaf P content. The highly significant correlation with the overall quality of apple was ABA, and the significant correlation with the overall quality of apple was IAA, GA, leaf P content and K content. Therefore, the quality of apples can be improved by regulating leaf N content, K content, and endogenous hormone content.

3.7. Principal Component Analysis of Yield and Quality Indicators

3.7.1. Correlation Between Yield and Quality Indicators

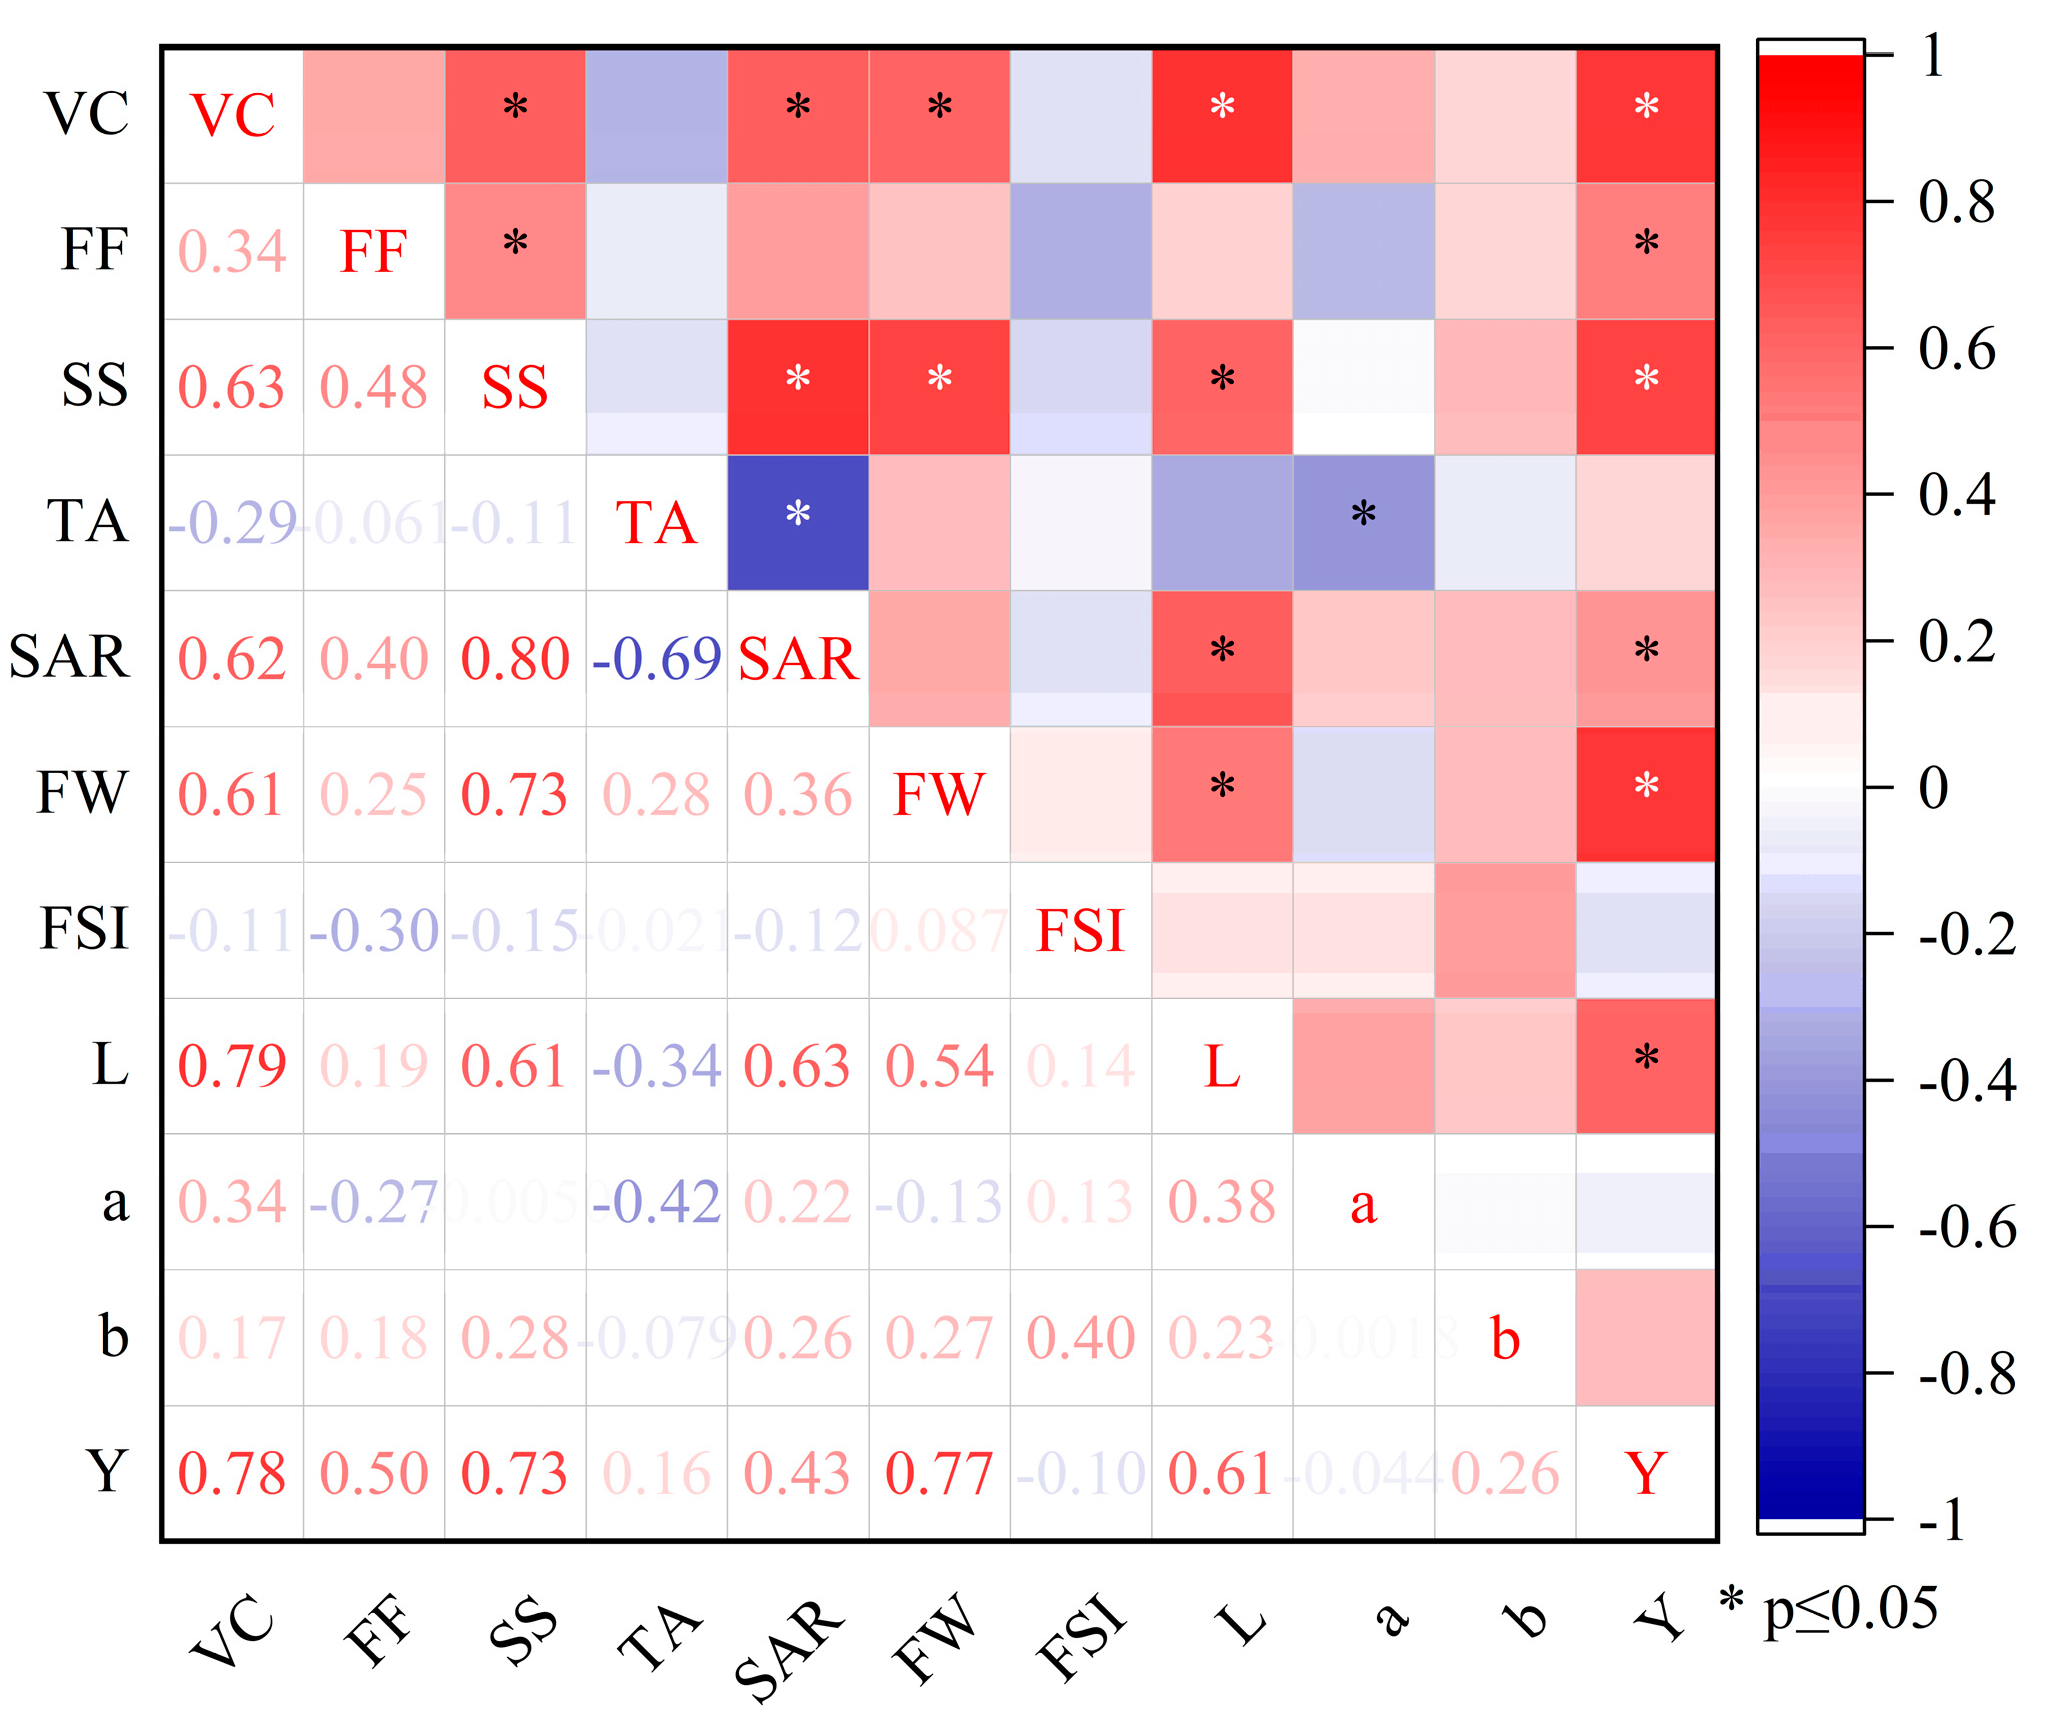
Figure 10 showed the correlation analysis of yield and quality indicators for 2023 and 2024. VC was significantly and positively correlated with SS, SAR, FW, and color difference (L) with yield. Yield showed correlation with color difference (L), FW, SAR, SS, FF and VC. FSI and color difference b had no correlation with other indicators, and a had correlation with TA. Therefore, FSI and b were excluded when performing principal component analysis.

3.7.2. Evaluating the Effects of Subsurface Oxygenated Drip Irrigation on Yield and Quality Indicators

Because of correlations between yield and quality indexes, we evaluated fruit yield and quality indexes by downgrading indexes and simplifying index factors using factor analysis in 2023 and 2024 (Figure 11). The first principal component (PC1) of contained 58.4% of all original information, and its size was mainly affected by VC, SS, SAR, FW, L and Y. PC2 contained 25.9% of original information, and its size was mainly affected by TA, SAR, FW and Y. PC3 contained 7.9% of original information, and was mainly affected by VC, SS, SAR and L. Based on these results, expressions of three principal components and one composite score were obtained:
F 1 = 0.43 V C + 0.45 S S 0.12 T A + 0.39 S A R + 0.39 F W + 0.41 L + 0.36 Y
F 2 = 0.07 V C + 0.05 S S + 0.71 T A 0.39 S A R + 0.37 F W 0.13 L + 0.42 Y
F 3 = 0.49 V C 0.54 S S + 0.01 T A 0.42 S A R 0.05 F W + 0.53 L 0.04 Y
C S = 0.63 F 1 + 0.28 F 2 + 0.09 F 3
Through these formulas, for 2023 and 2024, treatment Z2 had both the best apple yield and quality, and treatment Z2 had the highest composite score.

4. Discussion

(1)
Effect of subsurface oxygenated drip irrigation on soil water and oxygen distribution
Subsurface drip irrigation maintains relatively dry soil surface and good moisture conditions in the root zone, reduces surface water loss, promotes root growth, and improves water and nutrient uptake and utilization [19]. The O2 content in the soil was significantly higher than that of ordinary subsurface drip irrigation after oxygenated irrigation, which delayed the crowding out of soil oxygen by drip irrigation [20]. Combined with the two, the microbubbles in the two-phase flow of water and gas in oxygenated irrigation were easily attached to the soil pore space, which could supply oxygen to the water in a continuous manner and maintain a good oxygen environment in the soil [21]. In actual soil, the non-moist soil may also be anoxic [22]; however, aerobic irrigation not only has the effect of increasing oxygen in moist soil, but also has a certain effect on the oxygen content of non-moist soil, and the aerobic water will drive the microbubbles to continuously diffuse around the soil, which will increase the oxygen content in non-moist soil [23].
Currently, there is a controversy about the effect of buried depth of subsurface drip irrigation pipes on crop yield increase, some studies have shown that increasing depth of drip irrigation pipe burial stabilized after increasing crop yield [20], the reason is that the increased depth of drip irrigation increases the diffusion paths of gas movement, the distribution of soil moisture is more uniform, and the range of wetted soil is larger [24], it also promotes the growth and distribution of crop roots [25], and facilitates water uptake by crop roots. Studies by some other experts have shown that an increase in drip depth reduces crop yields [26] because with a gradual increase in drip depth, the resistance to shallow water increases, which gradually reduces the water content of the surface soil [27], which is detrimental to the uptake of water and nutrients by the surface root system of the crop. The main point of contention is in the different effects of burial depth of drip irrigation pipes on the distribution of soil moisture content. In our study, the surface soil moisture content gradually decreased, and the deep soil moisture content gradually increased with increasing depth of drip irrigation pipe burial. The rootstock of our apple trees was Malus robusta Rehder, and the root system of this rootstock adapts to the moisture depth of the irrigation system, exhibiting a vertical distribution mainly concentrated between 0 and 60 cm [28], and among all the treatments, only the drip irrigation pipe of the Z2 treatment was in the middle of the main root layer of apples, thus facilitating the uptake of water and fertilizers by the root system of apples.
(2)
The effect of subsurface oxygenated drip irrigation on hormone and nutrient uptake in apples
Plant endogenous hormones are a class of trace organic substances produced by the plant’s own metabolism, which have obvious physiological effects at very low concentrations, and can play a role in regulating the physiological effects of plant growth and differentiation, flowering and fruiting, ripening and senescence, and dormancy and abscission [29,30]. Among them, IAA, GA3, and ZRs are usually considered as growth-promoting hormones, which have the effect of promoting plant growth and fruit growth [31]. ABA is a growth inhibitor, which has the ability to coordinate the metabolism in the body of the crop, but its high level can lead to accelerated organ senescence [32] and is unfavorable to crop yield [33]. Hormones have the same regulatory effects on fruit trees, and they mainly affect the growth process of fruit trees, in which the tree size and branch growth of fruit trees are mainly directly related to IAA and GA, and GA can play a role in elongating the length of fruit stalks and improving the fruit shape index [34]. In our study, the contents of IAA, GA, and ZRs in new shoot tips were increased and the contents of ABA were decreased by subsurface oxygenated drip irrigation compared with surface oxygenated drip irrigation, indicating that subsurface oxygenated drip irrigation is beneficial to promote the growth and yield of apples. Correlation analysis showed that IAA, GA, ZRs, and ABA were not significantly correlated with apple yield, but they were significantly correlated with Pn, indicating that these hormones play an indirect role in apple yield (Figure 9). In our study, the levels of IAA, GA and ZRs showed a pattern of increase and then decrease with the buried depth of drip irrigation pipe, and ABA showed the opposite change rule (Figure 4), and the effect of oxygen-enhanced drip irrigation with the buried depth of drip irrigation pipe of 30 cm was the most obvious effect on the promotional hormones, which was mainly related to the buried depth of drip irrigation pipe in the position of the apple rhizosphere, and the root system was more sensitive to the soil water, nutrients and oxygen, and the roots quickly sensed the stress to synthesize chemical signals to produce the hormones. The root system is sensitive to soil water and oxygen, and when stress occurs, the root system rapidly senses it, transmits it to the aboveground in the form of synthesized chemical signals, and regulates the aboveground physiological functions of the crop through the synthesis of related hormones [35], especially when the root system is hypoxic, it produces abscisic acid and limits the transport of water and minerals between the roots and stems [36].
The level of nutrient supply affects physiological processes such as the synthesis and metabolism of endogenous hormones in plants [37], where a decrease in phosphorus leads to a decrease in cytokinin [38], and sufficient nitrogen and potassium promote the growth of root meristematic tissues and aboveground, the synthesis of cytokinin, and the accelerated catabolism of ABA content [39]. Some studies have shown that endogenous hormones also increase plant nutrient accumulation [40], so endogenous hormone content and plant nutrient accumulation are mutually reinforcing. Subsurface oxygenated drip irrigation promotes plant nutrient uptake and accumulation by increasing soil enzyme activity and microbial activity and decomposing organic matter, thereby promoting the release and decomposition of mineral elements in the soil [41]. In our study, there was no significant difference in leaf N, P, and K contents between subsurface oxygenated drip irrigation and the control treatment at the flowering and fruiting stage because the flowering and fruiting stage was a relatively short period of time before the experiment was carried out, and thus the treatments did not show significant differences among each other. The leaf N, P, and K contents of the other three fertility stages were differently enhanced by subsurface oxygenated drip irrigation compared with the control treatment (Figure 5).
(3)
Effects of subsurface oxygenated drip irrigation on SPAD, leaf photosynthetic characteristics and plant water potential in apple
Oxygen deficiency in the crop root system causes crop stomata to close and plant water potential to decrease, which affects the normal physiological function of the crop [42] and hinders high crop yield. Chlorophyll, as the main pigment in leaf chloroplasts, can reflect the strength of leaf photosynthetic capacity and plant growth, and its content can be expressed by leaf SPAD value [43]. Leaf photosynthetic capacity is the basis of crop growth and development and crop yield [44]. The main factors affecting plant photosynthesis are biochemical limitation, stomatal limitation and chloroplastic limitation [45]. In terms of biochemical limitation, it is mainly related to photosynthetic enzyme activities, especially Rubisco enzyme activities [46]. In terms of stomatal limitation, when the microenvironment of the crop root system changes, the root system rapidly senses it and regulates the aboveground physiological functions of the crop through endogenous hormones, e.g., reduction in leaf stomatal conductance and photosynthesis rate, and slowing down of the growth of the crop leaves [47,48]. In terms of chloroplastic limitation, it is mainly related to the chlorophyll content of leaves [49]. In our study, the enhancement effect of subsurface oxygenated drip irrigation on leaf photosynthesis was mainly in three aspects, first, subsurface oxygenated drip irrigation increased the aerobic respiration efficiency and activity of the root system [50,51], which facilitated the uptake of nitrogen by the root system and its translocation to the aboveground part [52], contributing to the leaf nitrogen content (Figure 5), and enhanced Rubisco enzyme activity. Second, subsurface oxygenated drip irrigation increased leaf chlorophyll content (Figure 7), enhanced the range of light energy absorption (Table 1), and promoted the stomatal conductance and transpiration rate of the crop [53], which in turn improved the photosynthetic performance and plant water potential of the aboveground plant leaves (Figure 6 and Figure 8). Third, subsurface oxygenated drip irrigation reduced the ABA content in the stem tips of the new shoots (Figure 4), increased leaf stomatal conductance, and promoted leaf photosynthesis and plant water potential.
(4)
Pathway analysis of subsurface oxygenated drip irrigation on apple yield increase and quality improvement
Soil fertility is the most important factor affecting the yield and quality of fruit trees in the absence of growth stress [54]. In our study, we used the partial mantel method to analyze the correlation between yield and quality of apple and physiological indicators and soil moisture content. This method can directly analyze the direct correlation between yield and quality and other indicators, eliminating the influence of indirect factors. The results of this study showed that apple yield showed highly significant correlation with SPAD, leaf N and K content, and only significant correlation with Pn and SWC, mainly because it is the products of crop photosynthesis is not only used to enhance the crop yield, but also used for the crop’s own nutrient growth, so it showed significant correlation (Figure 9). The significant correlation between SWC and yield indicated that there was a certain amount of water stress in our four experimental treatments. Apple quality had highly significant correlations with ABA, significant correlations with LWP, ZRs, IAA, SWC, and leaf N and K contents, but no significant correlations with Pn. The main reason may be that we pooled all the quality indexes (L, a, b, SS, TA, SA, VC, WF, and FSI) into one comprehensive quality index, thus reducing the correlation with Pn correlation (Figure 9). Considering the significant correlations with apple yield and quality indicators, as well as the correlations between physiological indicators, subsurface oxygen drip irrigation mainly affects apple photosynthesis by regulating endogenous hormone content and enhancing leaf mineral content, which ultimately increases apple yield and improves the quality of apples.

5. Conclusions

Subsurface aerobic drip irrigation reduced surface soil water content, increased soil water content in the apple rhizosphere, improves plant water potential, increased new tip gibberellin, indoleacetic acid and zeatin riboside content, and reduced new tip abscisic acid content. Leaf nitrogen, phosphorus, and potassium contents were elevated during young fruit, fruit expansion, and maturation stages, and leaf SPAD was increased, increasing the range of light energy utilization of the leaves and promoting the potential maximum net photosynthetic rate. Significant correlations between IAA, GA, ZRs, leaf N content, leaf K content, LWP, Pn, SPAD, and apple yield were determined by partial mantel analysis. A significant correlation was found between ABA, IAA, GA, leaf P, and K content and apple quality. Therefore, the quality of apples can be improved by regulating leaf N content, K con-tent and endogenous hormone content. Fruit quality indexes and yield indexes of different treatments had different performances, treatment Z2 had both the best apple yield and quality, and through constructing the principal component analysis of yield and quality indexes for 2 years, we obtained the highest comprehensive score of underground 30 cm oxygenated drip irrigation treatment.

Author Contributions

M.Z.: Conceptualization, data curation, formal analysis, investigation, methodology, project administration, software, supervision, validation, visualization, writing—original draft. Y.S.: Funding acquisition, Writing—review and editing. W.M.: funding acquisition, resources, writing—review and editing. Y.B.: funding acquisition, writing—review and editing. Q.W.: writing—review and editing. Z.L.: writing—review and editing. W.Z.: writing—review and editing. All authors have read and agreed to the published version of the manuscript.

Funding

This research was supported by Xinjiang Uygur Autonomous Region Major Science and Technology Projects (2022A02003-2), Xinjiang Uygur Autonomous Region “Tianshan Talents” Program for Leading Talents in Science and Technology Innovation (2024TSYCLJ0024).

Data Availability Statement

The original contributions presented in this study are included in the article. Further inquiries can be directed to the corresponding authors.

Conflicts of Interest

The authors declare that this research was conducted in the absence of any commercial or financial relationships that could be construed as a potential conflict of interest.

References

  1. Lei, H.J.; Xiao, Z.Y.; Zhang, Z.H.; Yang, H.G.; Liu, X.; Pan, H.W. Integrating Drip Fertigation with Soil Aeration to Improve Water and Nitrogen Use Efficiency of Greenhouse Tomato. J. Irrig. Drain. 2020, 39, 8–16. [Google Scholar]
  2. Ma, M.J.; Yang, J.G.; Li, D.M.; Yang, W.X.; Yang, S.C.; Wang, K.X.; Zhao, J.H.; Li, C.; Yuan, R.X. The Effects of Irrigation Methods on Yield and Quality of Alfalfa. J. Irrig. Drain. 2023, 42, 24–30. [Google Scholar] [CrossRef]
  3. Liu, R.L. Effects of Different Irrigation Methods on the Growth and Quality of Cherry Tomato. Heilongjiang Sci. 2024, 15, 25–27. [Google Scholar]
  4. Li, R.C.; Wan, S.Q.; Li, X.B.; Kang, Y.H. Effects of Matric Potential Threhold Used for Control of Shallow Drip Irrigaion on Growth and Yield of Alfalfa. J. Irrig. Drain. 2023, 42, 25–31. [Google Scholar] [CrossRef]
  5. He, X.L.; Wang, J.X.; Gong, P.; Zhao, L.; Heng, T.; Wang, C.X.; Zhang, J.R. Irrigation modes screening for water saving, high yield and quality of dwarfed and densely planted fragrant pears in South Xinjiang of China. Trans. Chin. Soc. Agric. Eng. (Trans. CSAE) 2024, 40, 249–262. [Google Scholar]
  6. Zhen, Y.Y.; Xu, L.R.; Gao, H.W. Effect of water-nitrogen coupling on water and nitrogen use efficiency of rotated winter wheat and summer maize under subsurface drip irrigation. J. Irrig. Drain. 2024, 43, 41–49. [Google Scholar] [CrossRef]
  7. Pisciotta, A.; Di Lorenzo, R.; Santalucia, G.; Barbagallo, M.G. Response of grapevine (Cabernet Sauvignon cv) to above ground and subsurface drip irrigation under arid conditions. Agric. Water Manag. 2018, 197, 122–131. [Google Scholar] [CrossRef]
  8. Thompson, T.L.; Doerge, T.A.; Godin, R.E. Subsurface drip irrigation and fertigation of broccoli: II. Agronomic, economic, and environmental outcomes. Soil Sci. Soc. Am. J. 2002, 66, 178–185. [Google Scholar] [CrossRef]
  9. Niu, W.; Guo, Q.; Zhou, X.; Helmers, M.J. Effect of aeration and soil water redistribution on the air permeability under subsurface drip irrigation. Soil Sci. Soc. Am. J. 2012, 76, 815–820. [Google Scholar] [CrossRef]
  10. Ityel, E.; Ben-Gal, A.; Silberbush, M.; Lazarovitch, N. Increased root zone oxygen by a capillary barrier is beneficial to bell pepper irrigated with brackish water in an arid region. Agric. Water Manag. 2014, 131, 108–114. [Google Scholar] [CrossRef]
  11. Qiao, J.L.; Zhang, C.; Xu, J.; Wang, C.H.; Zhao, Z.Y.; Xiao, Y.K. Effects of aeration irrigation on photosynthetic physiology of blueberry. J. Chin. Agric. Mech. 2017, 38, 89–93. [Google Scholar] [CrossRef]
  12. Lei, H.J.; Wang, L.Y.; Pan, H.W.; Hu, S.G. The Efficacy of Oxygenation in Improving Growth and Nutrients Use Efficiency of Greenhouse Purple Eggplant. J. Irrig. Drain. 2019, 38, 8–14. [Google Scholar] [CrossRef]
  13. Yu, Z.Z.; Wang, C.; Li, J.X.; Liu, S.D.; Wang, H.X. Optimization Design of Aerobic Irrigation System. J. Agric. Mech. Res. 2019, 41, 106–110. [Google Scholar] [CrossRef]
  14. Lei, H.J.; Hu, S.G.; Pan, H.W.; Zang, M.; Liu, X.; Li, K. Advancement in Research on Soil Aeration and Oxygation. Acta Pedol. Sin. 2017, 54, 297–308. [Google Scholar] [CrossRef]
  15. Lei, H.J.; Yang, H.G.; Feng, K.; Zang, M.; Pan, H.W. Impact of Continuous Aerating Irrigation on Growth, Water Use Efficiency and Nutrient Uptake of Pak Choi Growing in Different Soils. J. Irrig. Drain. 2017, 36, 13–18. [Google Scholar] [CrossRef]
  16. Liu, L.; Zeng, D.; Xie, Y.P.; Huang, X.J.; Zhou, D.R.; Wang, W.W.; Zhang, J.H.; Huang, J.S. Selection of Hydroponically Grown Lettuce Cultivar and Effect of Different Airing Treatments on the Yield and Quality of Lettuce. Chin. J. Trop. CROPS 2012, 33, 613–616. [Google Scholar]
  17. Barickman, T.C.; Ku, K.; Sams, C.E. Differing precision irrigation thresholds for kale (Brassica oleracea L. var. acephala) induces changes in physiological performance, metabolites, and yield. Environ. Exp. Bot. 2020, 180, 104253. [Google Scholar] [CrossRef]
  18. Abuarab, M.; Mostafa, E.; Ibrahim, M. Effect of air injection under subsurface drip irrigation on yield and water use efficiency of corn in a sandy clay loam soil. J. Adv. Res. 2013, 4, 493–499. [Google Scholar] [CrossRef]
  19. Hamad, A.; Xu, J.; Wei, Q.; Hamoud, Y.A.; Xu, L. Effect of different irrigation and nitogen management options on growth, yield and water use efficiency of Chinese cabbage in greenhouse cultivation. Pak. J. Agric. Sci. 2021, 58, 341–356. [Google Scholar]
  20. Bhattarai, S.P.; Huber, S.; Midmore, D.J. Aerated subsurface irrigation water gives growth and yield benefits to Zucchini, vegetable soybean and cotton in heavy clay soils. Ann. Appl. Biol. 2004, 144, 285–298. [Google Scholar] [CrossRef]
  21. Lei, H.J.; Zang, M.; Zhang, Z.H.; Liu, H.; Liu, Z.Y.; Xu, J.X. Impact of working pressure and surfactant concentration on air-water transmission in drip irrigation tape under cycle aeration. Trans. Chin. Soc. Agric. Eng. (Trans. CSAE) 2014, 30, 63–69. [Google Scholar]
  22. Ben-Noah, I.; Nitsan, I.; Cohen, B.; Kaplan, G.; Friedman, S.P. Soil aeration using air injection in a citrus orchard with shallow groundwater. Agric. Water Manag. 2021, 245, 106664. [Google Scholar] [CrossRef]
  23. Kisi, O.; Khosravinia, P.; Heddam, S.; Karimi, B.; Karimi, N. Modeling wetting front redistribution of drip irrigation systems using a new machine learning method: Adaptive neuro-fuzzy system improved by hybrid particle swarm optimization–Gravity search algorithm. Agric. Water Manag. 2021, 256, 107067. [Google Scholar] [CrossRef]
  24. Yang, M.D.; Zhang, S.Y.; Yang, S.J.; Guan, X.P.; Chen, J.P.; Li, S.J.; Wang, T.C.; Zou, G.Y. Simulation of Soil Moisture and Wet Front Transport and Optimization of Drip Tapes Design Parameters under Subsurface Drip Irrigation in Sandy Loam for Summer Maize. J. Henan Agric. Sci. 2022, 51, 148–161. [Google Scholar] [CrossRef]
  25. Bhattarai, S.P.; Midmore, D.J.; Pendergast, L. Yield, water-use efficiencies and root distribution of soybean, chickpea and pumpkin under different subsurface drip irrigation depths and oxygation treatments in vertisols. Irrig. Sci. 2008, 26, 439–450. [Google Scholar] [CrossRef]
  26. Marouelli, W.A.; Silva, W.L. Drip line placement depth for processing tomatoes crop. Hortic. Bras. 2002, 20, 206–210. [Google Scholar] [CrossRef]
  27. Patel, N.; Rajput, T.B.S. Effect of drip tape placement depth and irrigation level on yield of potato. Agric. Water Manag. 2007, 88, 209–223. [Google Scholar] [CrossRef]
  28. Dai, Y.X.; Jia, H.Z.; Zhang, P.Y.; Shi, J.R.; Yu, J.B.; Wang, L. Characteristics of root distribution and water-transportation tissues of apple rootstocks Malus micromalu and M9T337. J. Shanxi Agric. Univ. (Nat. Sci. Ed.) 2019, 39, 56–60. [Google Scholar] [CrossRef]
  29. Meng, H.Z.; Jiang, X.; Chen, X.D.; Li, Z.Y.; Xu, J.Z. Effects of SH40 Interstocks and Scion-roots on Apple Root Growth and Content of Endogenous Hormones. Acta Hortic. Sin. 2018, 45, 1193–1203. [Google Scholar] [CrossRef]
  30. Shen, Z.; Yin, B.Y.; Fu, X.Y.; Zhu, Y.N.; Liang, B.W.; Li, Z.Y.; Xu, J.Z. Effect of dwarfing interstock length on growth of Red Fuji apple seedlings and young trees and preliminary study on physiological mechanism. J. HEBEI Agric. Univ. 2021, 44, 42–47. [Google Scholar] [CrossRef]
  31. Basunia, M.A.; Nonhebel, H.M. Hormonal regulation of cereal endosperm development with a focus on rice (Oryza sativa). Funct. Plant Biol. 2019, 46, 493–506. [Google Scholar] [CrossRef]
  32. Zhang, X.F.; Tong, J.H.; Bai, A.N.; Liu, C.M.; Xiao, L.T.; Xue, H.W. Phytohormone dynamics in developing endosperm influence rice grain shape and quality. J. Integr. Plant Biol. 2020, 62, 1625–1637. [Google Scholar] [CrossRef]
  33. Liang, X.L.; Qiu, K.H.; He, R.; Jin, X.J.; Li, J.Y.; Fang, S.M. Regulation of plant seed formation and cytokinin. Plant Physiol. J. 2020, 56, 635–642. [Google Scholar] [CrossRef]
  34. Yan, G.H.; Gan, L.J.; Sun, R.H.; Zhang, L.H.; Zhou, X.A. Study on the Mechanisms of Exo-Gibberllins and Cytokinins in the Growth Regulation of Young Apple Fruit. Acta Hortic. Sin. 2000, 27, 11–16. [Google Scholar]
  35. Ha, S.; Vankova, R.; Yamaguchi-Shinozaki, K.; Tran, L.S.P. Cytokinins: Metabolism and function in plant adaptation to environmental stresses. Trends Plant Sci. 2012, 17, 172–179. [Google Scholar] [CrossRef]
  36. Horchani, F.; Gallusci, P.; Baldet, P.; Cabasson, C.; Maucourt, M.; Rolin, D.; Aschi-Smiti, S.; Raymond, P. Prolonged root hypoxia induces ammonium accumulation and decreases the nutritional quality of tomato fruits—ScienceDirect. J. Plant Physiol. 2008, 165, 1352–1359. [Google Scholar] [CrossRef]
  37. Ku, W.Z.; Peng, K.Q.; Zhang, X.Q.; Tong, J.H.; Zhou, H.; Xiao, L.T. Effects of low potassium stress on mineral nutrient ab-sorption andphytohormone contents of rice seedling. J. Plant Nutr. Fertil. 2009, 15, 69–75. [Google Scholar]
  38. Brenner, W.G.; Romanov, G.A.; Köllmer, I.; Bürkle, L.; Schmülling, T. Immediate-early and delayed cytokinin response genes of Arabidopsis thaliana identified by genome-wide expression profiling reveal novel cytokinin-sensitive processes and suggest cytokinin action through transcriptional cascades. Plant J. 2005, 44, 314–333. [Google Scholar] [CrossRef]
  39. Zhao, P.; Lin, K.H.; Zheng, Y. Effect of N and K nutrition on chlorophyll content and endogenous hormones in the process of tobacco senescence. Plant Nutr. Fertil. Sci. 2005, 27, 379–384. [Google Scholar]
  40. Zhong, C.; Wang, X.J.; Qi, X.X.; Jiang, H.Y. Dynamics of endogenous hormone and nutrient contents during flowering in male and female ginkgo plants. Jiangsu Agric. Sci. 2011, 39, 251–254. [Google Scholar] [CrossRef]
  41. Zeng, J. Study on the Water and Fertilizer Use Efficiency under Cycle Aerated Subsurface Drip Irrigation on Greenhouse Tomato. Master’s Thesis, Shandong Agricultural University, Taian, China, 2021. [Google Scholar] [CrossRef]
  42. Muñoz-Rojas, M.; Lewandrowski, W.; Erickson, T.E.; Dixon, K.W.; Merritt, D.J. Soil respiration dynamics in fire affected semi-arid ecosystems: Effects of vegetation type and environmental factors. Sci. Total Environ. 2016, 572, 1385–1394. [Google Scholar] [CrossRef]
  43. Lahijani, A.D.; Mosavi, A.; Moballeghi, M. The influence of micronutrients foliar application on rice (Oryza sativa L.) yield and yield components. J. Plant Nutr. Fertil. 2021, 27, 909–918. [Google Scholar]
  44. Wei, Y.X.; Cao, X.Q.; Ji, J.Q.; Zhang, X.W.; Liu, H.; Wu, Y. Effects of Different Irrigation Methods on Photosynthetic Characteristics and Dry Matter Accumulation Dynamics of Dry Direct Seeding Rice. Trans. Chin. Soc. Agric. Mach. 2021, 52, 358–368. [Google Scholar] [CrossRef]
  45. Xing, H.X.; Wu, J.M.; Chen, J.; Shi, Z.M. Research progress on limiting factors of plant photosynthesis and vegetation productivity. ACTA Ecol. Sin. 2023, 43, 5186–5199. [Google Scholar] [CrossRef]
  46. Zhang, Y.M.; Zhou, G.S. Advances in leaf maximum carboxylation rate and its response to environmental factors. ACTA Ecol. Sin. 2012, 32, 5907–5917. [Google Scholar] [CrossRef]
  47. Wang, C.; Yang, A.; Yin, H.; Zhang, J. Influence of water stress on endogenous hormone contents and cell damage of maize seedlings. J. Integr. Plant Biol. 2008, 50, 427–434. [Google Scholar] [CrossRef]
  48. Ploschuk, R.A.; Miralles, D.J.; Colmer, T.D.; Ploschuk, E.L.; Striker, G.G. Waterlogging of winter crops at early and late stages: Impacts on leaf physiology, growth and yield. Front. Plant Sci. 2018, 9, 1863. [Google Scholar] [CrossRef]
  49. Han, J.M.; Zhang, W.F.; Xiong, D.L.; Jaume, F.; Zhang, Y.L. Mesophyll conductance and its limiting factors in plant leaves. Chin. J. Plant Ecol. 2017, 41, 914–924. [Google Scholar] [CrossRef]
  50. Yu, Z.; Wang, C.; Zou, H.; Wang, H.; Li, H.; Sun, H.; Yu, D. The effects of aerated irrigation on soil respiration and the yield of the maize root zone. Sustainability 2022, 14, 4378. [Google Scholar] [CrossRef]
  51. Xiao, W.H.; Liao, Q.; Fu, J.J.; Liu, Y.N.; Zhang, C.P.; Zhang, W.P. Effects of micro-nano bubble aerated irrigation and levels of nitrogen fertilizer on nitrogen accumulation and metabolism in super rice. Irrig. Drain. 2023, 72, 138–147. [Google Scholar] [CrossRef]
  52. Zhang, Q.; Du, Y.; Cui, B.; Sun, J.; Wang, J.; Wu, M.; Niu, W. Aerated irrigation offsets the negative effects of nitrogen reduction on crop growth and water-nitrogen utilization. J. Clean. Prod. 2021, 313, 127917. [Google Scholar] [CrossRef]
  53. Zhu, L.; Yu, S.; Jin, Q. Effects of aerated irrigation on leaf senescence at late growth stage and grain yield of rice. Rice Sci. 2012, 19, 44–48. [Google Scholar] [CrossRef]
  54. Sun, S.M.; Wei, Q.P. Grey Relation Anlysis of Factors Influencing Yield and Quality of Fruit Trees. J. Shandong Agric. Univ. 1992, 23, 435–438. [Google Scholar]
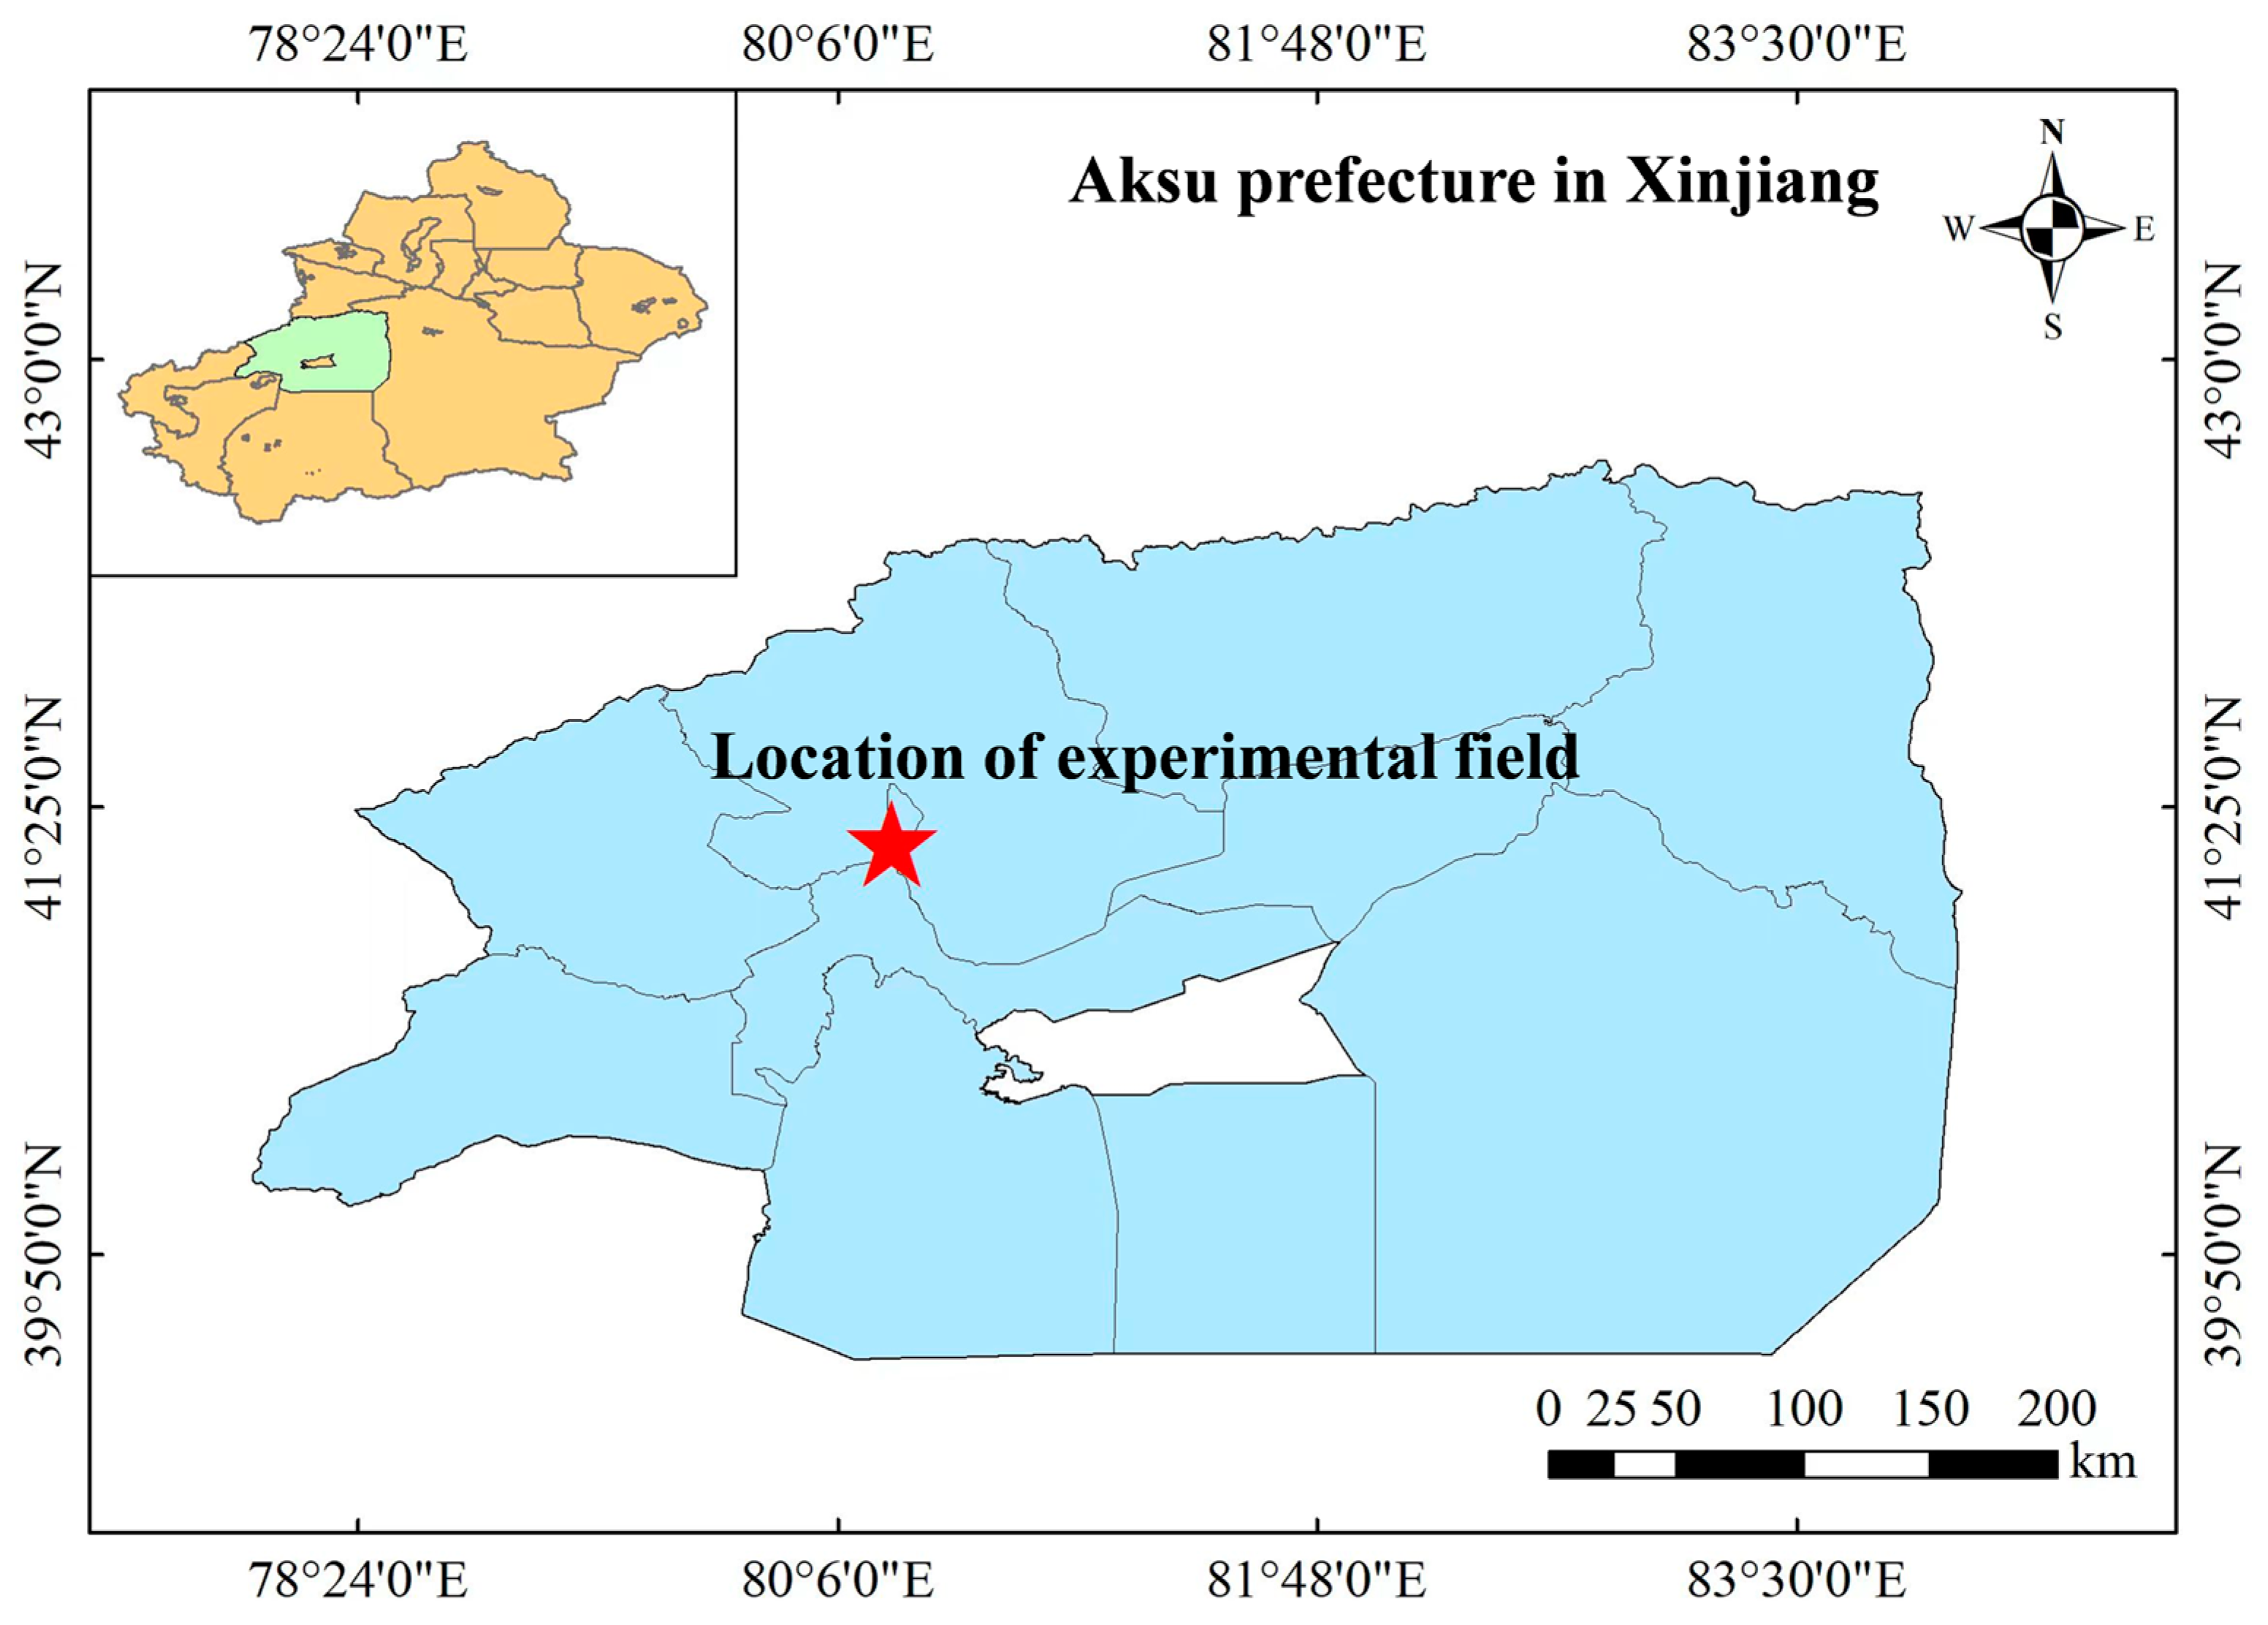
Figure 1. Location of experimental field.
Plants 14 02702 g001
Figure 2. Planting pattern of the experimental field.
Plants 14 02702 g002
Figure 3. Soil water content during fruit expansion in 2023 (A) and 2024 (B). Note: CK is surface aerated drip irrigation; Z represents subsurface aerated drip irrigation depths: Z1 (10 cm), Z2 (30 cm), and Z3 (50 cm).
Plants 14 02702 g003
Figure 4. Endogenous hormone content in new tips during 2023 and 2024 growing seasons. Note: Data are means ± standard deviations; different letters above whiskers indicate significant differences (p < 0.05). ABA is new shoot tip abscisic acid; IAA is new shoot tip indoleacetic acid; GA is new shoot tip total gibberellin; ZRs is new shoot tip zeatin riboside. CK is surface drip irrigation; Z1 is the drip irrigation pipe buried at 10 cm depth; Z2 is the drip irrigation pipe buried at 30 cm depth; Z3 is the drip irrigation pipe buried at 50 cm depth. 2023 and 2024 refer to the 2023 and 2024 growing seasons in figures, respectively.
Plants 14 02702 g004aPlants 14 02702 g004b
Figure 5. N, P, and K contents of apple leaves at different reproductive stages in 2023 and 2024. (Stage: F, flowering and fruiting; Y, young fruit; E, fruit expansion; M, maturation). Note: Data are means ± standard deviation; different letters above bars indicate significant differences (p < 0.05). CK is surface drip irrigation; Z1 is the drip irrigation pipe buried at 10 cm depth; Z2 is the drip irrigation pipe buried at 30 cm depth; Z3 is the drip irrigation pipe buried at 50 cm depth. 2023 and 2024 refer to the 2023 and 2024 growing seasons in figures, respectively.
Plants 14 02702 g005
Figure 6. Daily changes in plant water potential by different reproductive stages, 2023 and 2024. Note: Data represent means ± standard deviation; different letters above symbols indicate significant differences (p < 0.05). CK is surface drip irrigation; Z1 is the drip irrigation pipe buried at 10 cm depth; Z2 is the drip irrigation pipe buried at 30 cm depth; Z3 is the drip irrigation pipe buried at 50 cm depth.
Plants 14 02702 g006aPlants 14 02702 g006b
Figure 7. Leaf SPAD values by different reproductive stages, 2023 and 2024. Note: Data are means ± standard deviation; different letters above symbols indicate significant differences (p < 0.05). CK is surface drip irrigation; Z1 is the drip irrigation pipe buried at 10 cm depth; Z2 is the drip irrigation pipe buried at 30 cm depth; Z3 is the drip irrigation pipe buried at 50 cm depth.
Plants 14 02702 g007
Figure 8. Fitted light response of apple leaves in 2023 and 2024. Note: Pn is the net photosynthetic rate of the leaf. I is photosynthetically active radiation. CK is surface drip irrigation; Z1 is the drip irrigation pipe buried at 10 cm depth; Z2 is the drip irrigation pipe buried at 30 cm depth; Z3 is the drip irrigation pipe buried at 50 cm depth.
Plants 14 02702 g008
Figure 9. Analysis of key factors affecting yield and quality in apples in 2023 and 2024. Note: ABA is the abscisic acid content in the tip of a new shoot; IAA is the indole acetic acid content in the tip of a new shoot; GA is the total amount of gibberellins in the tip of a new shoot; ZRs is the zeatin riboside content in the tip of a new shoot; N is the nitrogen content of leaves during fruit expansion; P is the phosphorus content of leaves during fruit expansion; K is Leaf potassium content of leaves during fruit expansion; LWP is the average daily plant water potential during fruit expansion; Pn is the potential maximum net photosynthetic rate during fruit expansion; SPAD is the relative chlorophyll content of leaves during fruit expansion, and SWC is soil moisture during fruit expansion. * Denotes 0.01 < p ≤ 0.05; ** Denotes 0.001 < p ≤ 0.01; *** Denotes p ≤ 0.001.
Plants 14 02702 g009
Figure 10. Correlation analysis of yield and quality indicators in 2023 and 2024. Note: VC is vitamin C; FF is fruit firmness; SS is soluble solids; TA is titratable acid; SAR is sugar to acid ratio; FW is the fruit individual fresh weight; FSI is fruit shape index; L is lightness and darkness of colors; a is redness and greenness of colors; b is yellowness and blueness; Y is apple yield.
Plants 14 02702 g010
Figure 11. Principal component analysis of apple yield and quality indexes by treatment for 2023 and 2024. Note: VC is vitamin C; FF is fruit firmness; SS is soluble solids; TA is titratable acid; SAR is sugar to acid ratio; FW is the fruit individual fresh weight; FSI is fruit shape index; L is lightness and darkness of colors; a is redness and greenness of colors; Y is apple yield. CK is surface drip irrigation; Z1 is the drip irrigation pipe buried at 10 cm depth; Z2 is the drip irrigation pipe buried at 30 cm depth; Z3 is the drip irrigation pipe buried at 50 cm depth.
Plants 14 02702 g011
Table 1. Eigenvalues of nonrectangular hyperbolic modified model fit by treatment and year.
Growing SeasonTreatmentαβγRdPnmaxIsatIc
2023CK0.02270.000320.000022.35 ± 0.1415.41 ± 0.781563.20 ± 112.36107.37 ± 4.59
Z10.03750.000210.000623.30 ± 0.2116.89 ± 0.521613.12 ± 129.2494.85 ± 2.78
Z20.04440.000180.000893.45 ± 0.1817.52 ± 0.611632.86 ± 79.6784.88 ± 3.49
Z30.03470.000230.00053.26 ± 0.2216.29 ± 0.731566.17 ± 147.55100.97 ± 3.66
2024CK0.04420.000170.001033.97 ± 0.1115.79 ± 0.371667.58 ± 124.56100.89 ± 6.42
Z10.05410.0001260.00134.21 ± 0.1817.78 ± 0.761797.30 ± 99.2488.08 ± 3.79
Z20.06530.0001090.001614.57 ± 0.2419.58 ± 0.451836.62 ± 86.5879.69 ± 4.25
Z30.04530.0001550.001034.04 ± 0.2316.53 ± 0.711706.67 ± 134.7999.81 ± 3.97
Note: Data are means ± standard deviations. α, β, γ, Rd, Pnmax, Isat, and Ic represent initial slope, photoinhibition coefficient, light saturation coefficient, dark respiration rate, maximum net photosynthetic rate, light saturation intensity, and light compensation point, respectively. The larger the initial slope, the higher the efficiency of light-energy utilization at lower light intensities. A larger photoinhibition coefficient indicates that a plant is more susceptible to photoinhibition and reduced photosynthetic capacity. The light-saturation coefficient is related to the light-saturation point (the light intensity at which the photosynthetic rate of a plant peaks, indicating a plant’s ability to adapt to light). The dark respiration rate is the amount of oxygen consumed and carbon dioxide produced from organic matter by respiration per unit of time and per unit of leaf area when light intensity is zero. The lower the light compensation point, the more shade tolerant a plant is. Below the light compensation point, plant respiration exceeds photosynthesis, and rather than accumulating organic matter, it is consumed.
Table 2. Apple yield and quality by treatment and year.
Growing SeasonTreatmentFW (g)FSIFF (kg cm−2)LabSS (Brix)TA (%)SARVC (mg 100 g−1)Yield (kg ha−1)
2023CK220.33 ± 7.51 b0.80 ± 0.05 a6.29 ± 0.25 a47.55 ± 0.93 d24.63 ± 2.71 b12.57 ± 1.73 b12.13 ± 0.60 b0.78 ± 0.02 a15.65 ± 0.50c1.06 ± 0.12 c45,029.86 ± 755.28 b
Z1231.80 ± 8.66 ab0.89 ± 0.07 a6.89 ± 0.71 a53.60 ± 1.59 b26.51 ± 2.44 ab11.67 ± 1.62 ab13.50 ± 0.12 a0.66 ± 0.04 b20.43 ± 1.25a1.48 ± 0.10 ab47,044.69 ± 866.44 ab
Z2253.03 ± 17.00 a0.91 ± 0.03 a6.99 ± 0.54 a57.57 ± 1.07 a29.62 ± 2.34 a10.73 ± 1.18 a12.93 ± 0.10 a0.71 ± 0.02 ab18.17 ± 0.66b1.55 ± 0.07 a49,100.29 ± 1299.62 a
Z3231.03 ± 8.92 b0.82 ± 0.08 a6.55 ± 0.36 a50.90 ± 1.43 c26.53 ± 1.50 ab9.36 ± 0.71 ab12.87 ± 0.25 a0.74 ± 0.04 a17.48 ± 0.75b1.33 ± 0.05 b45,688.78 ± 1211.51 b
2024CK248.06 ± 10.60 b0.80 ± 0.06 a6.89 ± 0.28 a50.43 ± 1.64 b22.97 ± 1.93 a9.01 ± 0.84 b12.67 ± 0.32 c0.80 ± 0.02 a15.83 ± 0.15c1.38 ± 0.05 b51,873.62 ± 952.51 c
Z1286.18 ± 13.52 a0.84 ± 0.03 a7.22 ± 0.30 a55.58 ± 1.32 a24.40 ± 3.50 a11.51 ± 1.28 ab15.40 ± 0.44 ab0.74 ± 0.02 b20.83 ± 1.08ab1.55 ± 0.03 ab54,654.25 ± 1321.74 ab
Z2291.60 ± 19.91 a0.87 ± 0.01 a7.25 ± 0.17 a57.36 ± 3.44 a26.70 ± 1.76 a13.49 ± 1.34 a14.57 ± 0.59 a0.76 ± 0.02 b19.19 ± 1.25 a1.70 ± 0.17 a56,257.36 ± 1214.07 a
Z3254.25 ± 12.71 b0.84 ± 0.09 a7.16 ± 0.36 a53.99 ± 2.31 ab23.90 ± 3.11 a10.39 ± 3.00 ab13.70 ± 0.62 b0.77 ± 0.01 ab17.87 ± 0.79 b1.41 ± 0.05 b52,569.26 ± 853.95 bc
Note: Data in the table represent means ± standard deviations; different letters within a column indicate significant differences (p < 0.05). FW is the fruit individual fresh weight; FSI is fruit shape index; FF is fruit firmness; L is lightness and darkness of colors; a is redness and greenness of colors; b is yellowness and blueness; SS is soluble solids; TA is titratable acid; SAR is sugar to acid ratio; VC is vitamin C. CK is surface drip irrigation; Z1 is the drip irrigation pipe buried at 10 cm depth; Z2 is the drip irrigation pipe buried at 30 cm depth; Z3 is the drip irrigation pipe buried at 50 cm depth.
Disclaimer/Publisher’s Note: The statements, opinions and data contained in all publications are solely those of the individual author(s) and contributor(s) and not of MDPI and/or the editor(s). MDPI and/or the editor(s) disclaim responsibility for any injury to people or property resulting from any ideas, methods, instructions or products referred to in the content.