Article

Elucidating Genotypic Variation in Quinoa via Multidimensional Agronomic, Physiological, and Biochemical Assessments

by
Samreen Nazeer
1 and
Muhammad Zubair Akram
2,*
1
Department of Food and Drug, University of Parma, Viale Parco Area delle Scienze 27/A, 43124 Parma, Italy
2
Department of Agricultural, Food and Environmental Sciences (DSA3), University of Perugia, Borgo XX Giugno, 74, 06121 Perugia, Italy
*
Author to whom correspondence should be addressed.
Plants 2025, 14(15), 2332; https://doi.org/10.3390/plants14152332
Submission received: 11 July 2025 / Revised: 17 July 2025 / Accepted: 21 July 2025 / Published: 28 July 2025

Abstract

Quinoa (Chenopodium quinoa Willd.) has emerged as a climate-resilient, nutrient-dense crop with increasing global popularity because of its adaptability under current environmental variations. To address the limited understanding of quinoa’s genotypic performance under local agro-environmental conditions, this study hypothesized that elite genotypes would exhibit significant variation in agronomic, physiological, and biochemical traits. This study aimed to elucidate genotypic variability among 23 elite quinoa lines under field conditions in Faisalabad, Pakistan, using a multidimensional framework that integrated phenological, physiological, biochemical, root developmental, and yield-related attributes. The results revealed that significant variation was observed across all measured parameters, highlighting the diverse adaptive strategies and functional capacities among the tested genotypes. More specifically, genotypes Q4, Q11, Q15, and Q126 demonstrated superior agronomic potential and canopy-level physiological efficiencies, including high biomass accumulation, low infrared canopy temperatures and sustained NDVI values. Moreover, Q9 and Q52 showed enhanced accumulation of antioxidant compounds such as phenolics and anthocyanins, suggesting potential for functional food applications and breeding program for improving these traits in high-yielding varieties. Furthermore, root trait analysis revealed Q15, Q24, and Q82 with well-developed root systems, suggesting efficient resource acquisition and sufficient support for above-ground plant parts. Moreover, principal component analysis further clarified genotype clustering based on trait synergistic effects. These findings support the use of multidimensional phenotyping to identify ideotypes with high yield potential, physiological efficiency and nutritional value. The study provides a foundational basis for quinoa improvement programs targeting climate adaptability and quality enhancement.

1. Introduction

The escalating demand for sustainable and nutritionally rich crops has drawn global attention from both researchers and stakeholders toward quinoa (Chenopodium quinoa Willd.) due to its nutritional, functional, and climate-resilience properties, positioning it at the forefront of crop diversification strategies [1,2]. Because of these characteristics, the United Nations (UN) declared 2013 the “International Year of Quinoa” recognizing its potential to combat poverty and enhance global food security [1]. Since then, quinoa has evolved from a traditional Andean crop into a globally recognized functional food, celebrated for its exceptional ability to withstand environmental stress conditions [2,3] especially heat [4,5], salinity [6,7], and drought [8,9,10,11]. Given the increasing unpredictability of climate systems, there is a pressing need to identify the crops capable of maintaining growth and productivity under deteriorating climatic conditions. In that context, quinoa stands out as a strategic model for future food security systems because of its physiological plasticity, broad genetic diversity, and remarkable ability to thrive in marginal environments [12].
Recently, efforts have intensified to expand quinoa cultivation beyond the Andean region emphasizing the importance of genotype-environment interaction in determining crop performance. These interactions often manifest as complex physiological and metabolic adjustments that underpin stress responses, resource-use efficiency and yield stability [13]. In this context, genotypic variability plays a crucial role in enhancing both agronomic efficiency and resilience traits under contrasting environmental and agro-ecological regimes [14]. However, despite the growing interest in quinoa improvement, there remains a gap in integrated phenotypic evaluations that effectively link above-ground performance to underlying functional traits across multiple dimensions. Between 1984 and 2014, quinoa cultivation widely diffuses from 8 to 75 countries worldwide, including Canada, UK, Denmark, China, Italy, India, Netherlands, Brazile, Cuba, and Pakistan [15]. Originating from the Andean highlands, quinoa has been cultivated for approximately 7000 years as a key staple food for that region. Bolivia and Peru, situated within its center of origin, continue to represent the primary hubs of global quinoa production and genetic diversity [16]. It is an annual herbaceous dicotyledonous species characterized by a hollow erect stem, goosefoot-shaped leaves, and contains two types of inflorescence: amaranthiform and glomerulate [17]. It has a balanced nutritional profile better than other cereals with superior protein quality, i.e., rich in all essential amino acids, vitamins, minerals, and fiber. Additionally, a handsome concentration of bioactive compounds, particularly ferulic and sinapinic acids, flavanols, kaempferol, and quercetin, are present in the quinoa [18]. Another important feature that helps its global attention is the absence of gluten and a low glycemic index (GI) [19].
State-of-the-art techniques in plant phenotyping emphasize the importance of adopting multidimensional frameworks to evaluate crop performance more systemically. These approaches incorporate morpho-physiological, structural, and biochemical descriptors to analyze the complexity of plant adaptation and resource acquisition strategies [20,21]. For quinoa, such multidimensional assessments are especially valuable given the crop’s capacity to adjust growth, photosynthetic activity, and secondary metabolism in response to fluctuating environmental cues. The variations captured with these approaches aids in identification of stable and high-performing genotypes that maintains its productivity with highly vulnerable climatic aspects without compromising its nutritional profile [22].
Studies conducted under diverse field conditions have demonstrated a significant genotypic difference in quinoa in terms of its yield potential, phenological stability, and stress tolerance indices. However, many of these studies have predominantly focused on single-trait categories or relied on conventional selection indices that fail to include physio-chemical robustness [15,23,24,25]. The integration of high-resolution physiological measurements including Infrared Canopy Temperature (ICT), Normalized Difference Vegetation Index (NDVI), and targeted biochemical analyses has proven to be a potential tool in identifying genotypes with superior performance, as it allows for the early detection of functional traits associated with tolerance mechanisms, metabolic regulation, and source–sink dynamics [26]. Both attributes, including ICT and NDVI, from which ICT provide insights into plant transpiration and temperature regulation [27], while NDVI indicated about vegetation density and photosynthetic activity [28], are vital in helping to distinguish high-yielding and vigorous genotypes.
Moreover, recent advances in multidimensional trait analysis, including multivariate statistical methods and trait-based modeling, have enriched our ability to characterize notable genotype clustering, trait interdependencies, and predictive indicators of performance. These approaches are now considered fundamental in boosting the ideotypes selection under current climate-adaptive agriculture [29]. These methods in quinoa can facilitate the identification of elite genotypes from huge germplasm diversity within quinoa genotypes, with desirable combinations of agronomic features, physiological efficiency and biochemical integrity, an outcome that is not achievable through univariate assessments alone.
Quinoa has been successfully introduced and cultivated in Pakistan since 2009, demonstrating considerable adaptability to the country’s agro-ecological conditions. Following extensive agronomic evaluations and multi-location yield trials, the first locally adapted variety, UAFQ7, which originates from New Mexico, USA, was officially released in 2019 [17]. Despite this progress, quinoa remains a relatively novel crop in the region and there is a continued need to explore the genetic diversity within available germplasm to identify genotypes with superior performance potential. To address this, the present study was designed to broaden the genotypic base by evaluating elite quinoa lines with the objective of identifying promising candidates for future varietal development. The study adopts a comprehensive, multidimensional assessment framework integrating productivity measures, adaptive functional traits, and key biochemical attributes to elucidate genotypic variations under the agro-environmental conditions of Faisalabad. We hypothesize that distinct quinoa genotypes will exhibit significant variability across agronomic, physiological, and biochemical aspects, enabling the identification of superior lines with enhanced adaptability and productivity in local conditions.

2. Results

2.1. Phenological Development

During the experiment, phenological stages were recorded when more than 50% of the plants had reached the respective stage. Among the quinoa genotypes tested, Q82 and Q24 exhibited the shortest crop cycles, completing their life cycle in 124 days after sowing (DAS). In contrast, genotype Q50 required the longest duration to reach the physiological maturity taking 170 DAS. Notably, Q82 was the earliest to reach the flowering stage among all genotypes. Among 23 quinoa genotypes evaluated, 19 reached the flowering stage, while 15 attained maturities earlier than the standard check variety, i.e., UAFQ7. Detailed results are presented in Table 1.

2.2. Biochemical Parameters at Flowering

At flowering (on average = 80 DAS), the leaf samples were collected for the analysis of photosynthetic pigments, including chlorophyll a (Chl a), b (Chl b), total (Tol Chl), carotenoids, total phenolic and anthocyanin contents. The results revealed significant differences (p < 0.001) among the tested genotypes for all measured parameters. Genotypes Q4 and Q30 recorded the highest concentrations of Chl a, while Q126 exhibited the highest levels of Chl b and Total Chl. Genotypes Q52 showed the highest carotenoid concentration in its leaves. Additionally, Q9 recorded the greatest values for both phenolics and anthocyanin concentrations. Interestingly, compared to standard check variety UAFQ7, 22 genotypes produced higher values for Chl a, 19 showed higher for Chl b, 20 had increased tot Chl, 6 surpassed in carotenoids, 13 revealed higher values for phenolics and 4 genotypes exhibited higher anthocyanin values. The detailed results are shown in Table 2.

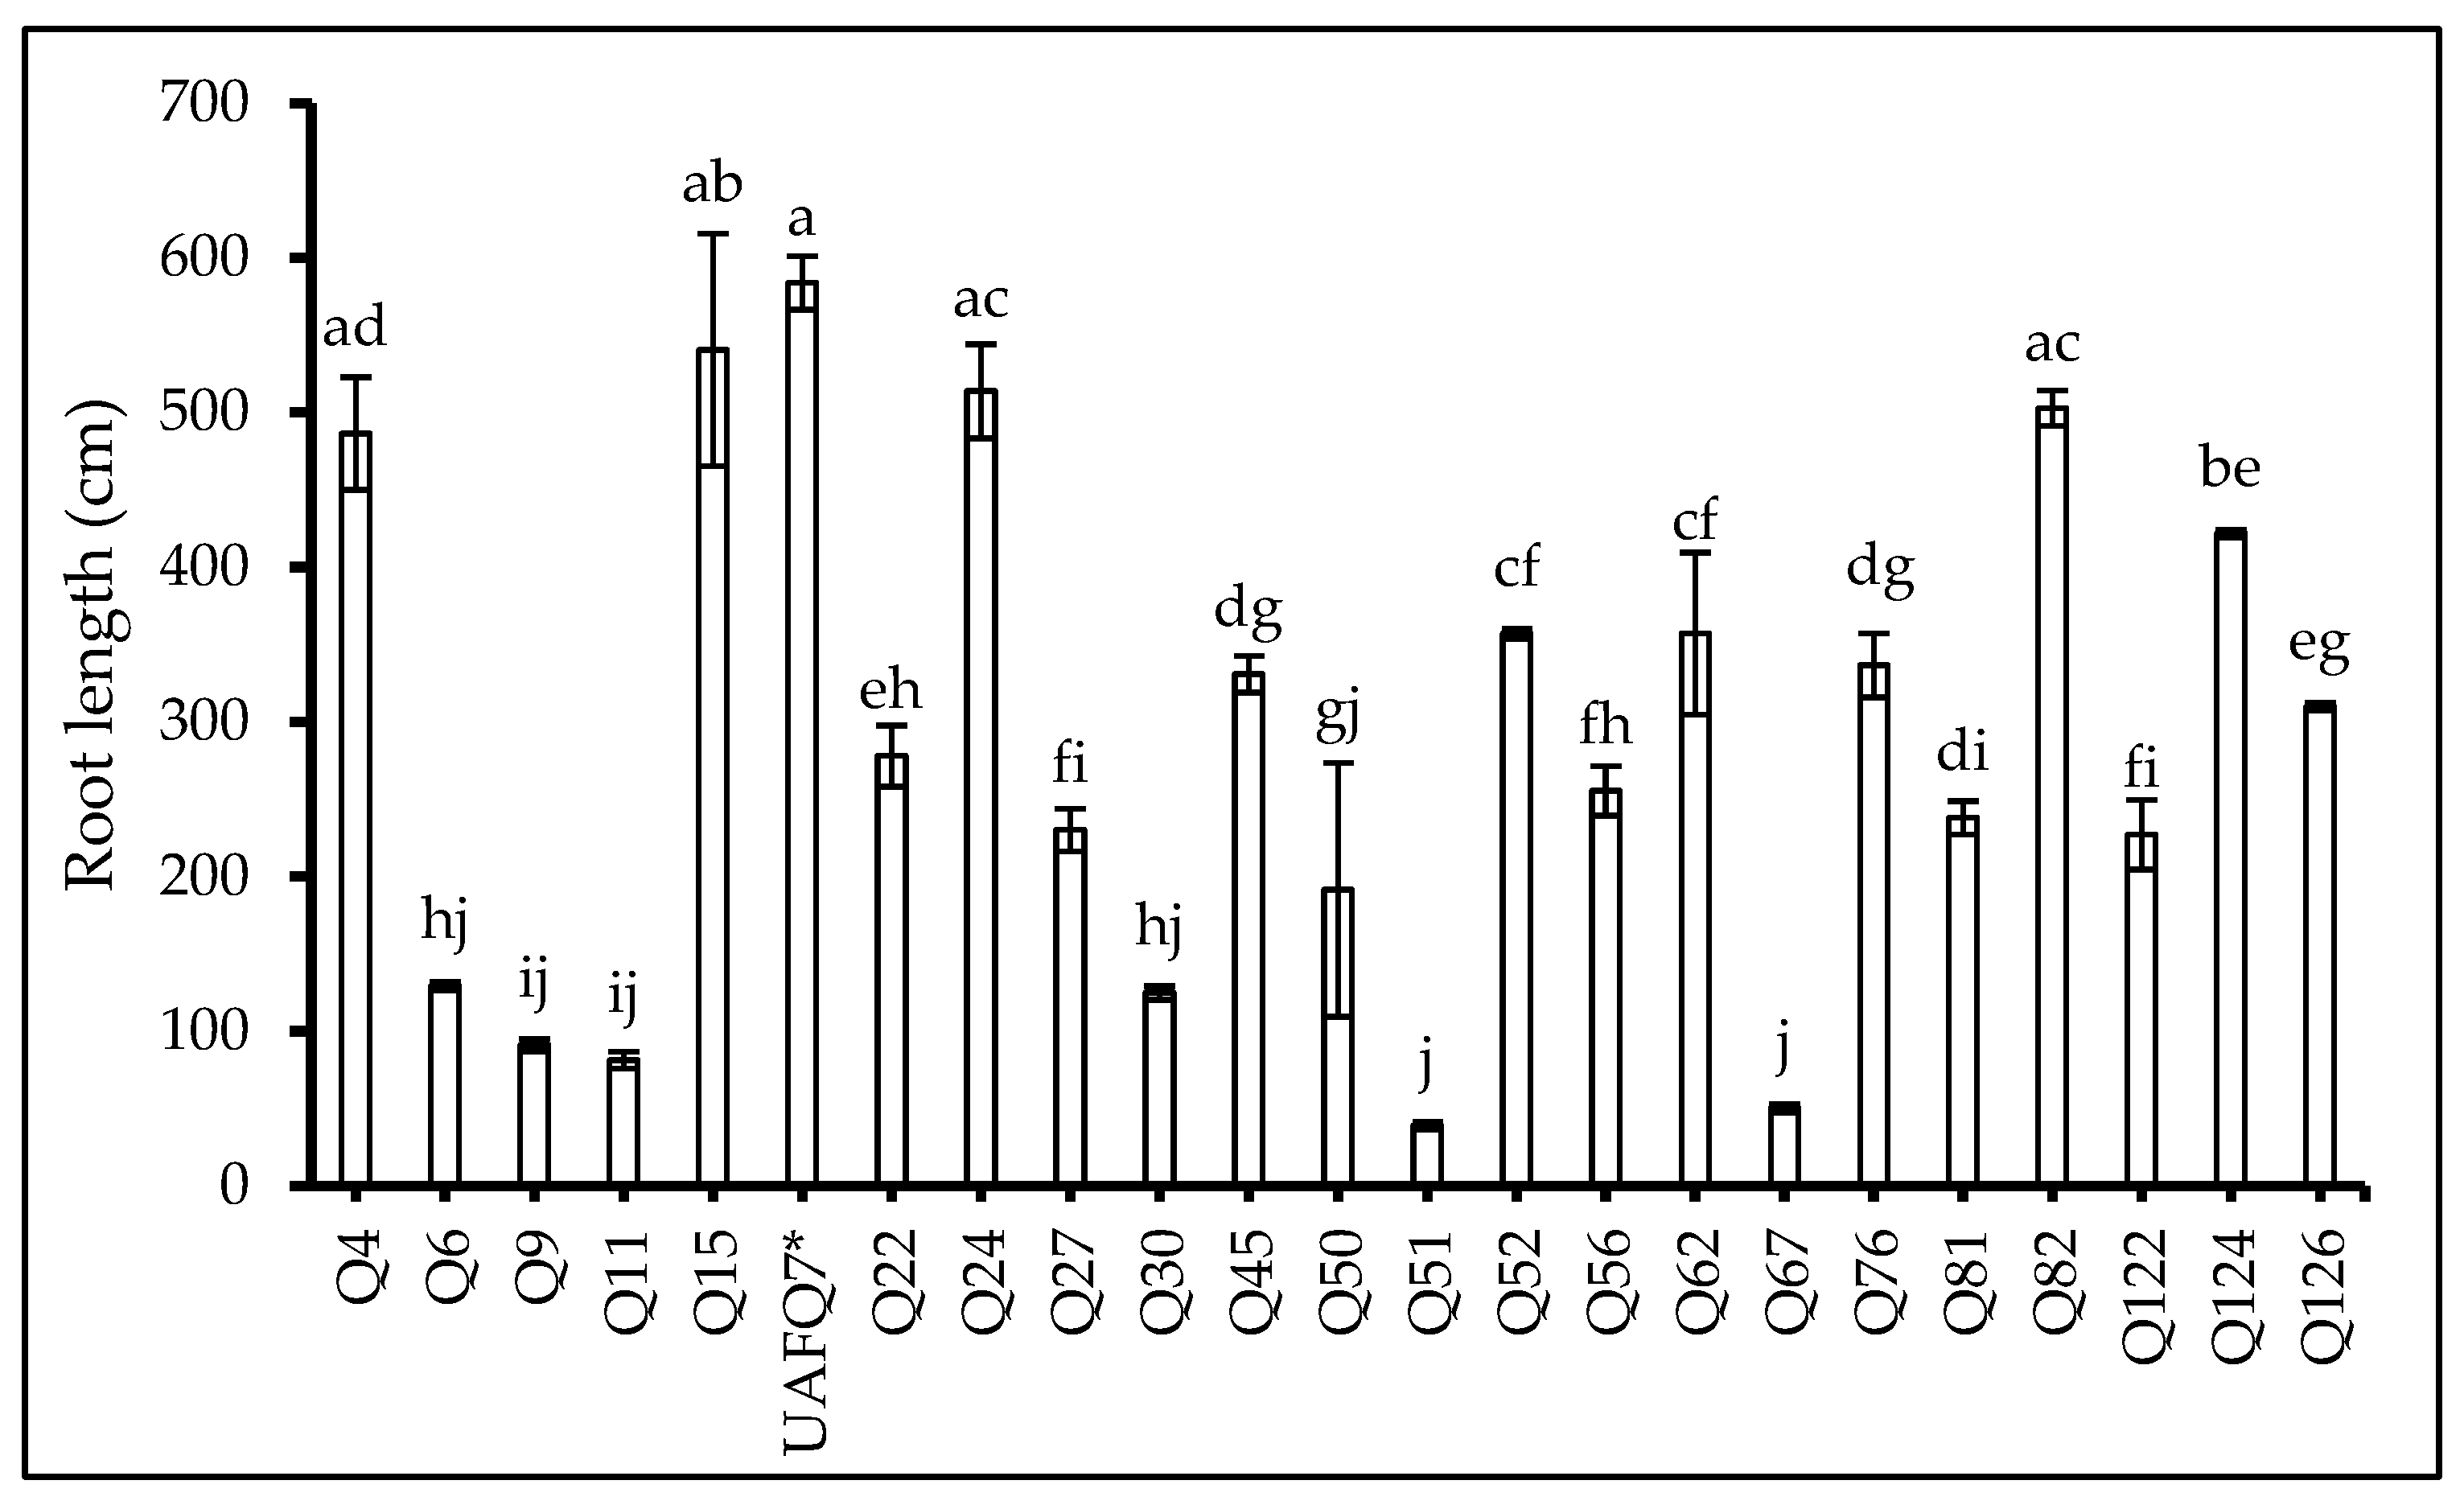
2.3. Root Scanning Attributes at Flowering

The results revealed significant variations (p < 0.001) among the genotypes tested for the root developmental traits except root volume which was not statistically significant (Table 3). The longest root length (RL) and projected area (PA) were recorded in the standard check variety UAFQ7, although genotype Q15 exhibited comparable values (not-significantly different from UAFQ7) for both parameters. The greatest surface area (SA) was observed in Q15, while Q56 recorded the highest average diameter (Avg. D). Importantly, none of the genotypes outperformed UAFQ7 in terms of RL (Figure 1) and PA (Table 3).
However, four genotypes exceed UAFQ7 in SA, while six genotypes showed higher Avg. D than UAFQ7. In particular, Q4, Q15, Q24, and Q82 demonstrated superior root traits overall, with the exception of RL and PA. The detailed results are presented in Table 3.

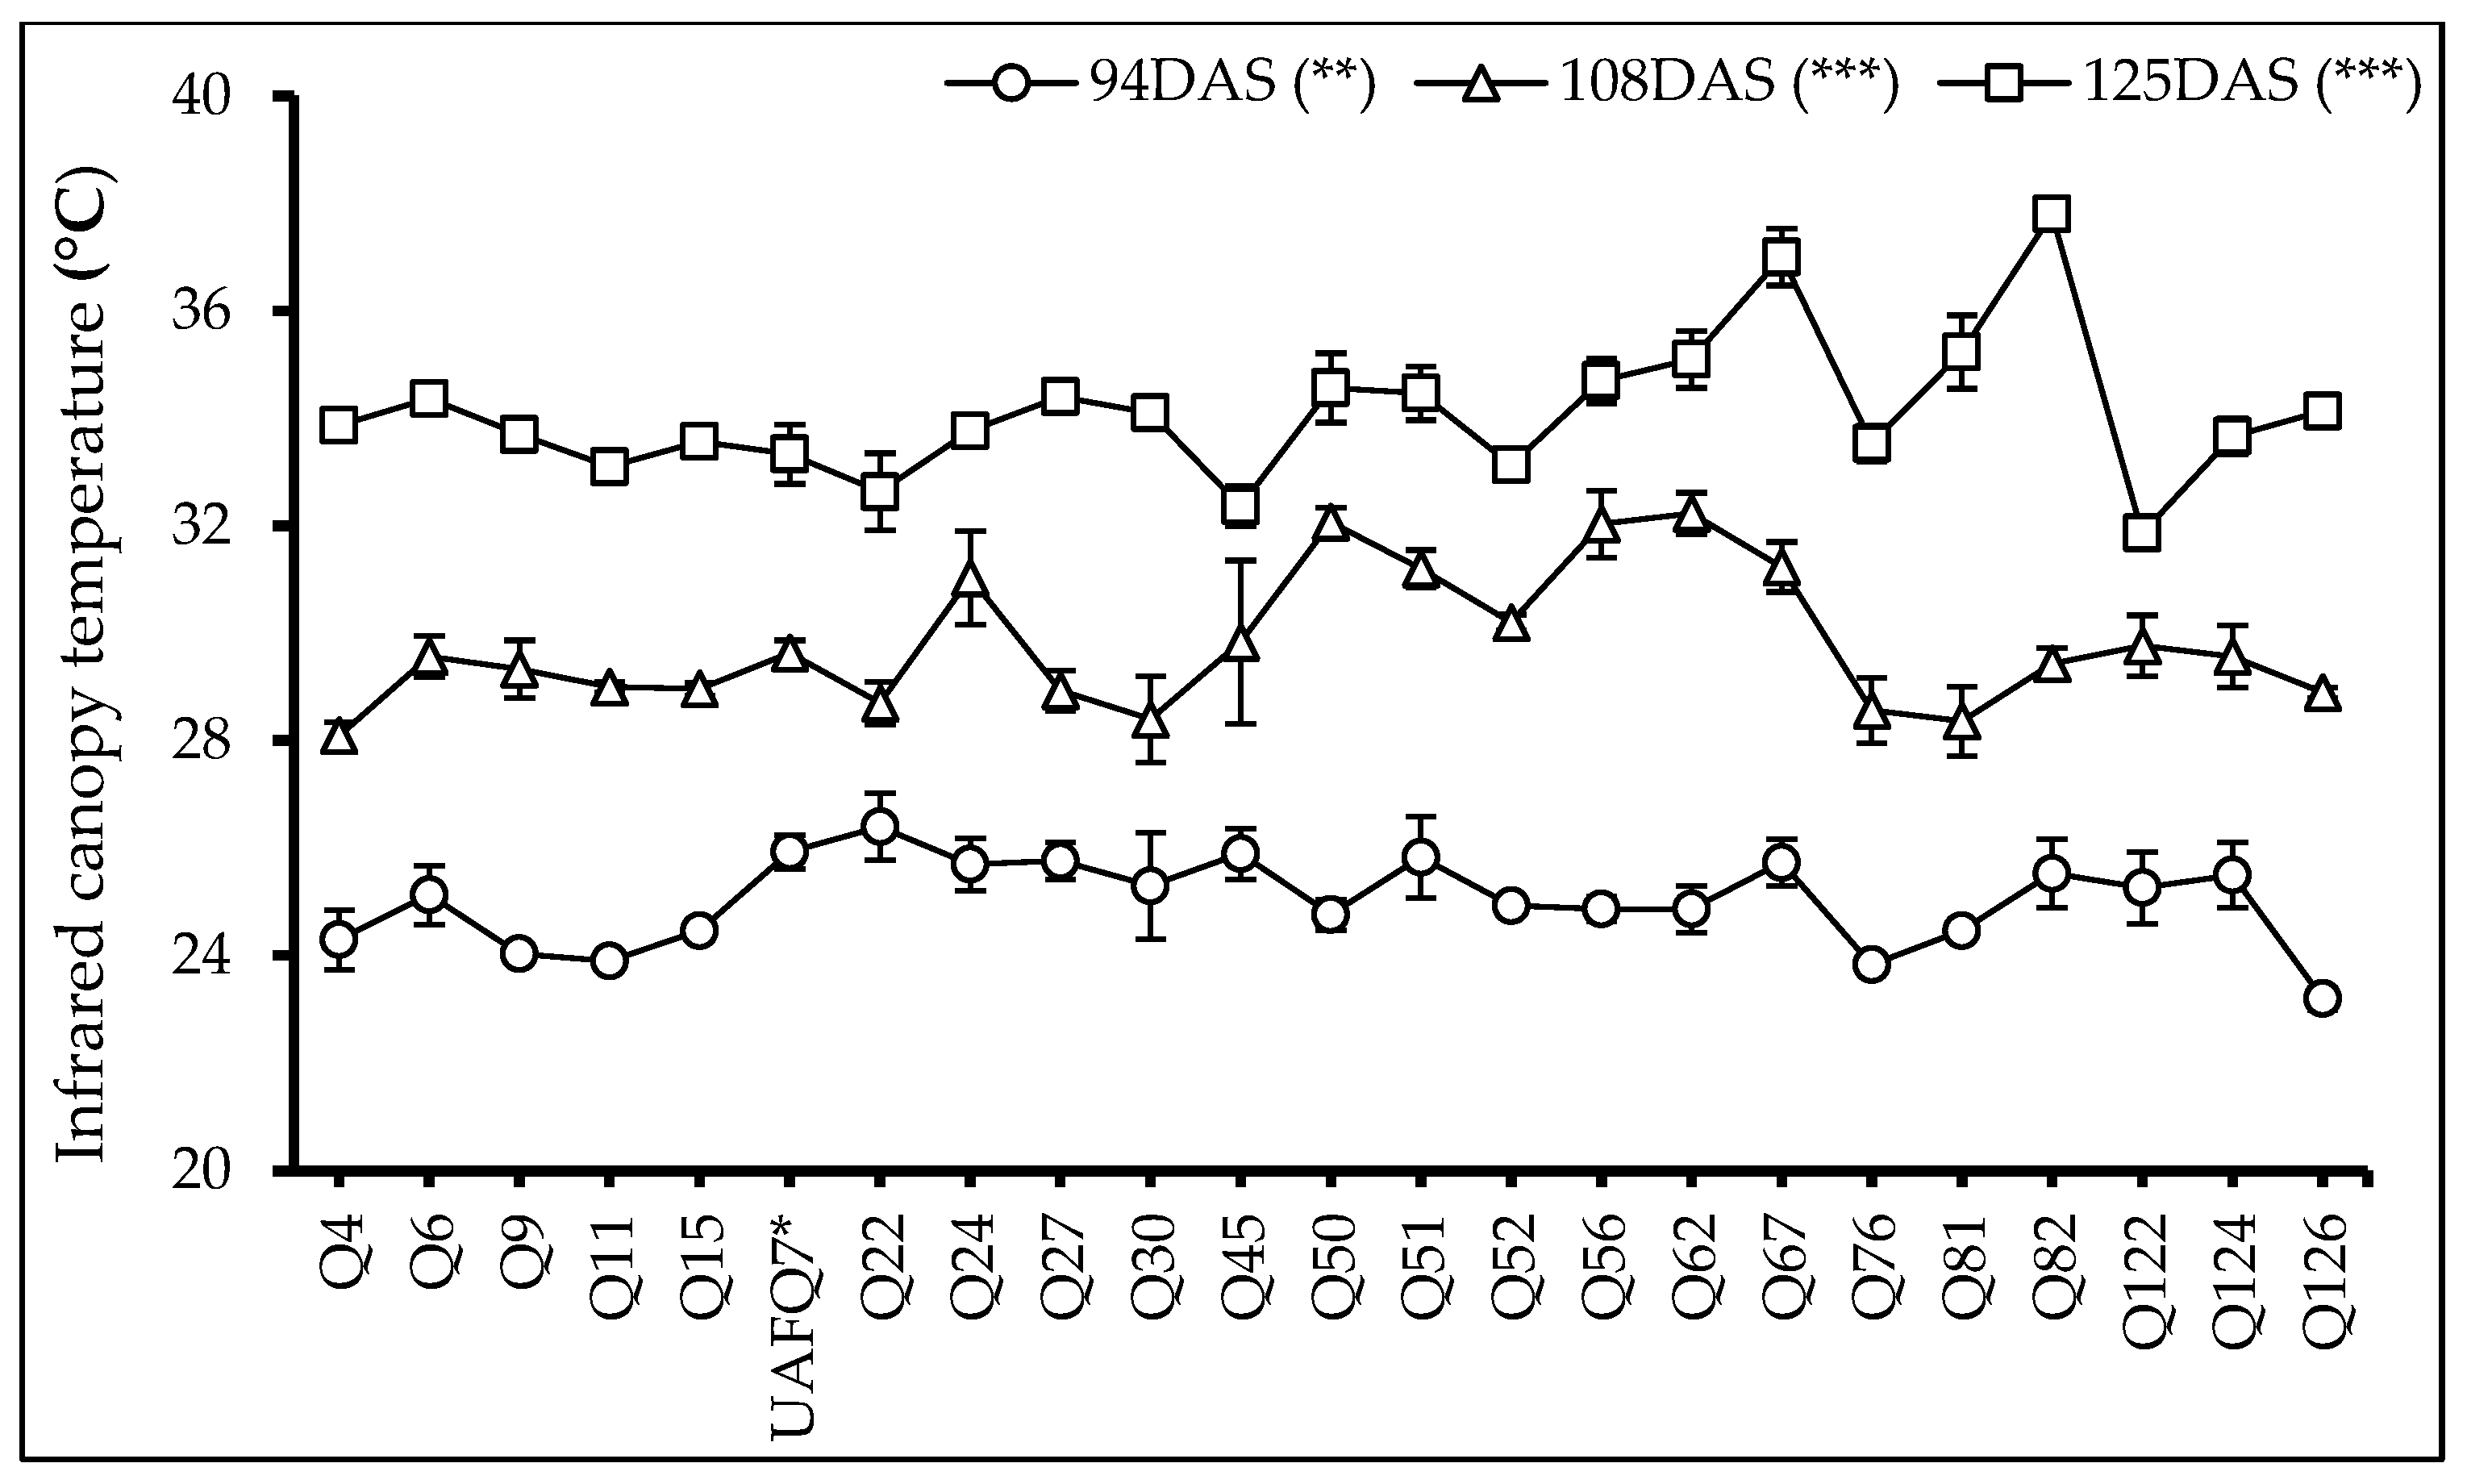
2.4. Infrared Canopy Temperature (ICT)

Following flowering, data on canopy temperature were collected at three time points (t1: 94 DAS, t2: 108 DAS, and t3: 125 DAS) during the experiment. At each time point, significant differences (p < 0.001) were observed among the genotypes (Figure 2). Interestingly, the following different genotypes exhibited the highest canopy temperature at each time point: Q22, Q62, and Q82, indicating genotyping variations among genotypes tested and exhibited higher values t1, t2, and t3, respectively. Moreover, 17 genotypes displayed lower infrared canopy temperature values at t1 and t2, suggesting superior adaptability to the prevailing agro-ecological conditions may be due to better transpiration cooling, enhanced efficiency of water use, well-regulated stomatal functioning, and better photosynthetic activities. On the contrary, genotypes Q51 and Q67 consistently exhibited higher canopy temperatures than UAFQ7 across all time points, highlighting less adaptability to current environmental conditions.

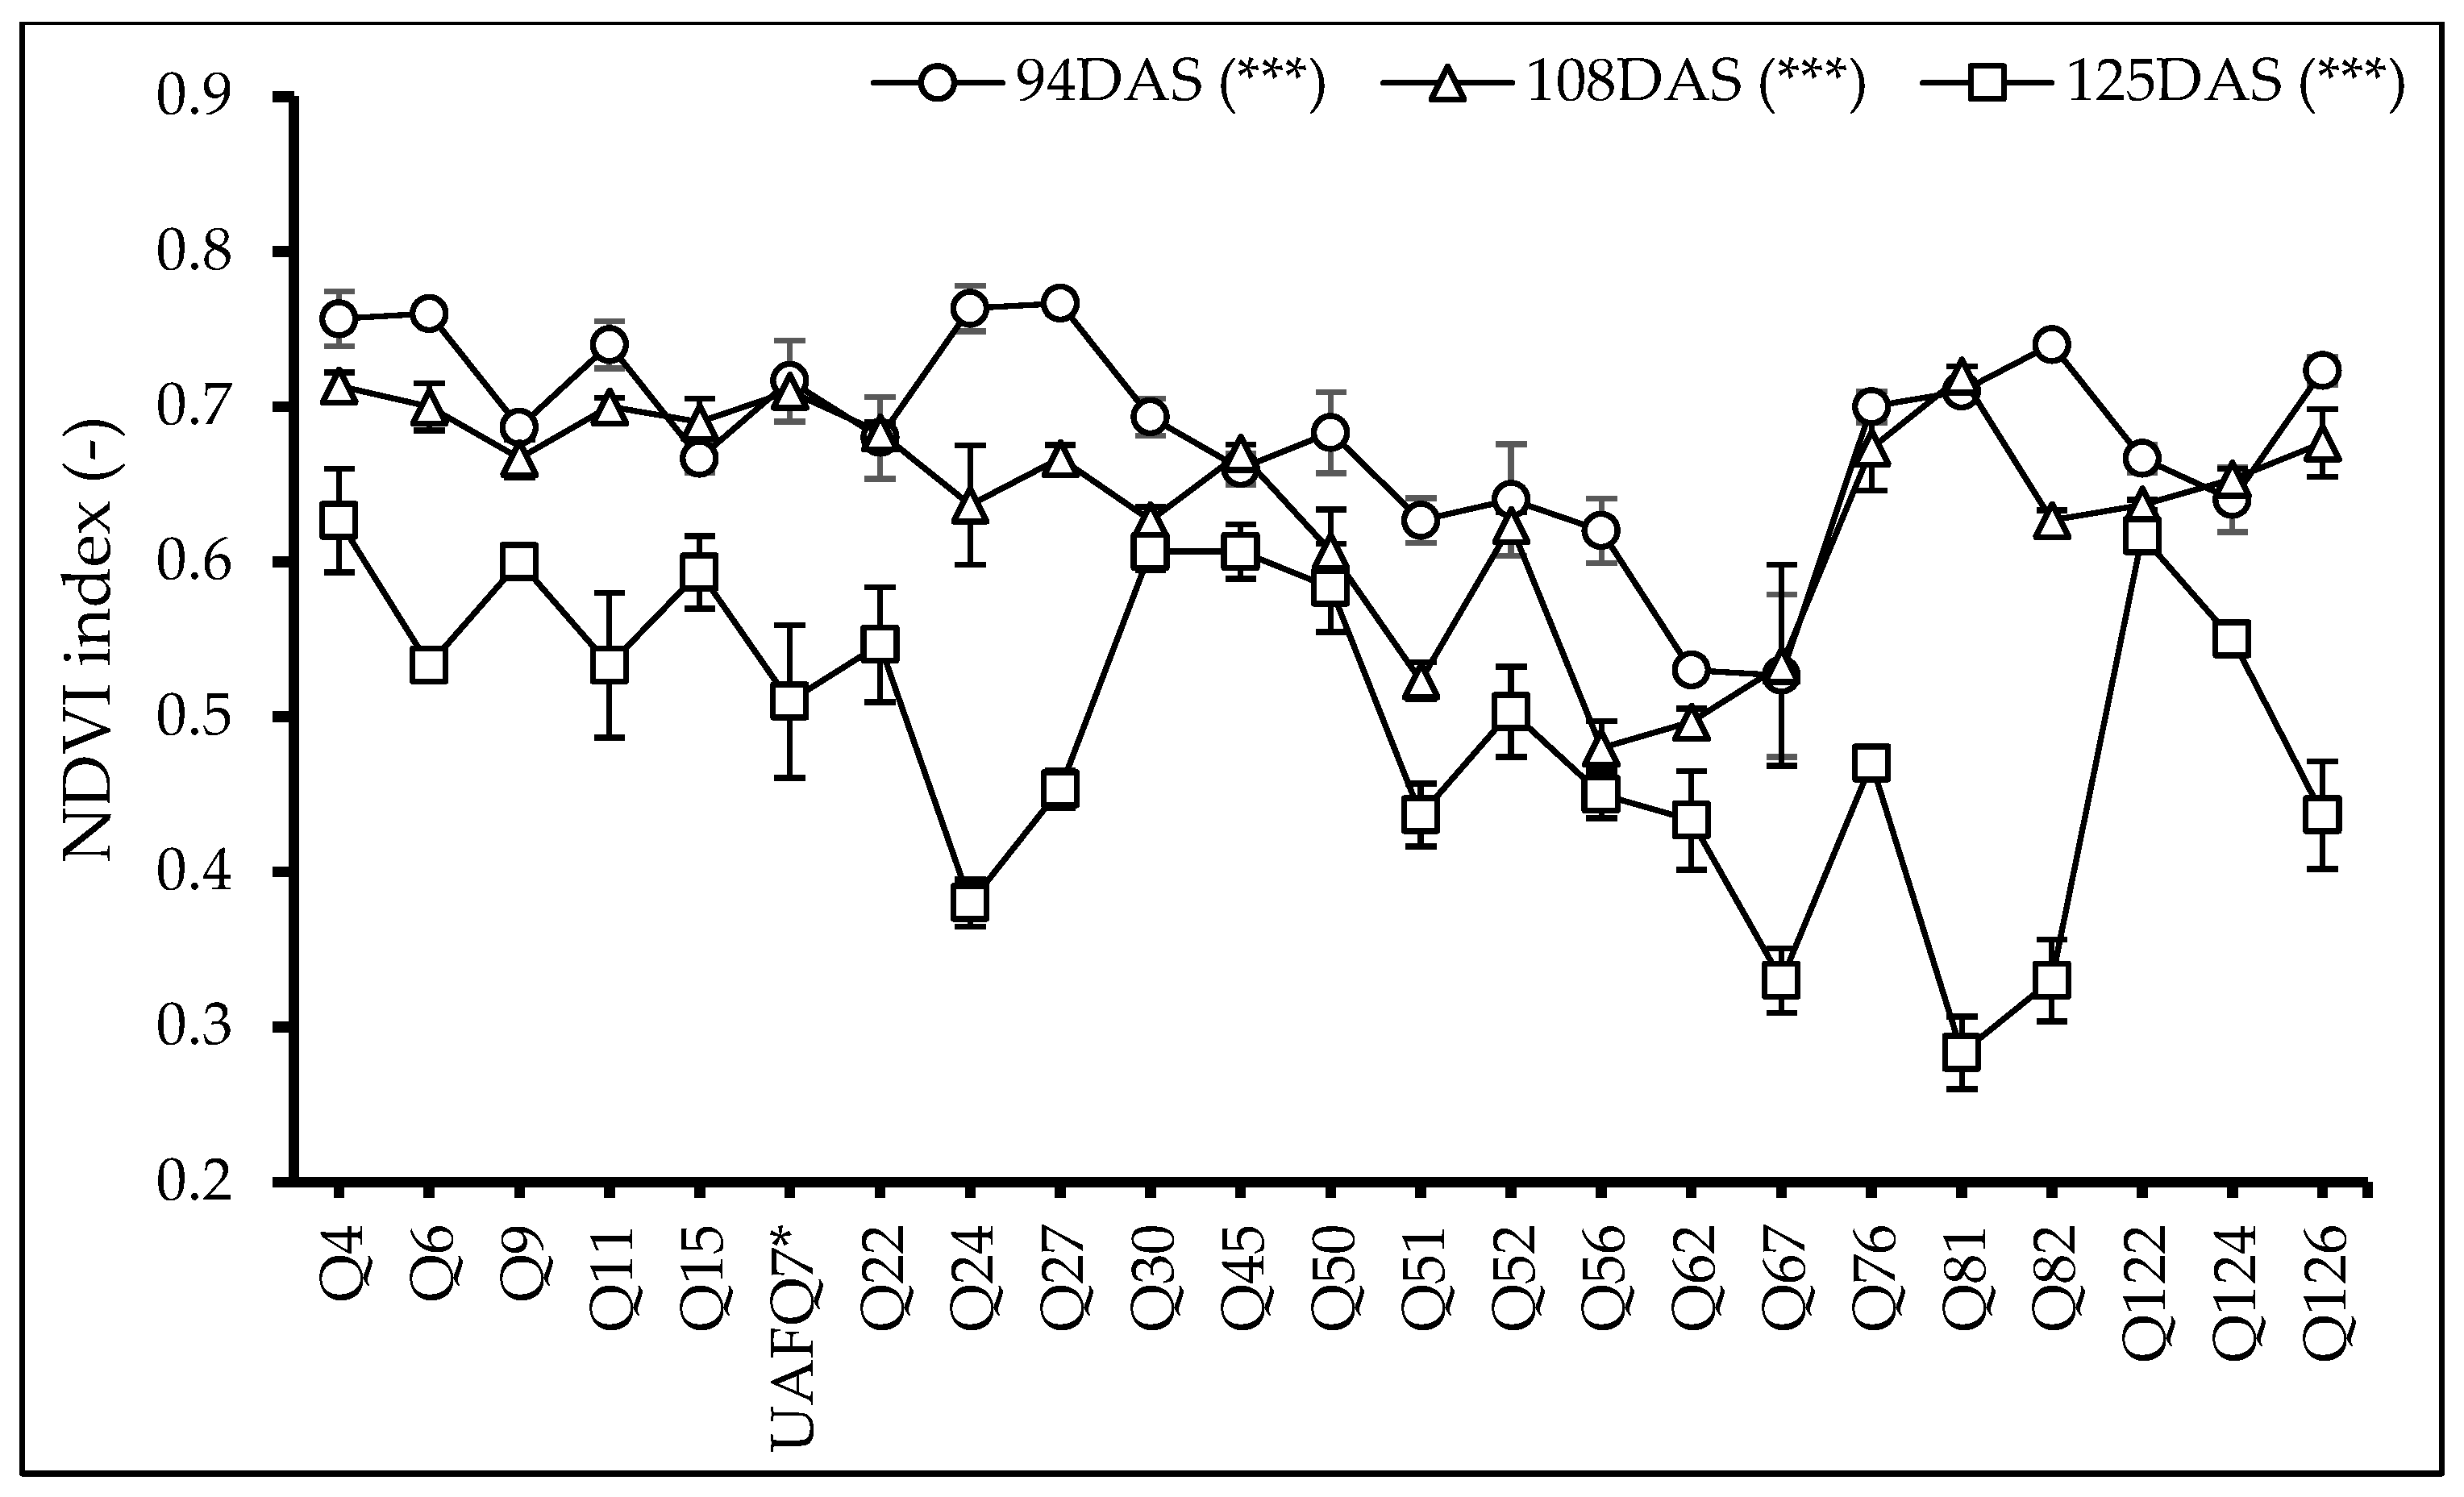
2.5. Normalized Difference Vegetation Index (NDVI)

Similarly to the ICT, the Normalized Difference Vegetation Index (NDVI) was recorded at the same time points: t1: 94 DAS, t2: 108 DAS, and t3: 125 DAS. At all time points, the results revealed significant variation among the tested genotypes (p < 0.001; Figure 3). Genotypes Q4, Q27, and Q81 exhibited the highest NDVI values at t1, t2, and t3, respectively. Interestingly, 7, 1, and 14 genotypes displayed higher NDVI values compared to standard check variety UAFQ7 at t1, t2, and t3, respectively. Among them, Q4 consistently outperformed UAFQ7 across all time points, indicating higher chlorophyll, greater biomass accumulation and overall better crop performance. Conversely, Q24, Q81, and Q82 revealed a marked decline in NDVI values over time, suggesting the onset of some stressful conditions. In contrast, genotypes such as Q9, Q15, Q22, Q30, Q45, Q50, Q52, Q122, and Q124 maintained relatively stable NDVI values throughout the observation period, reflecting consistent growth and vigor. Although UAFQ7 showed relatively higher NDVI values at t1, a reduction was observed at t2, followed by a pronounced decline at t3, suggesting early growth advantages but reduced performance at later developmental stages.

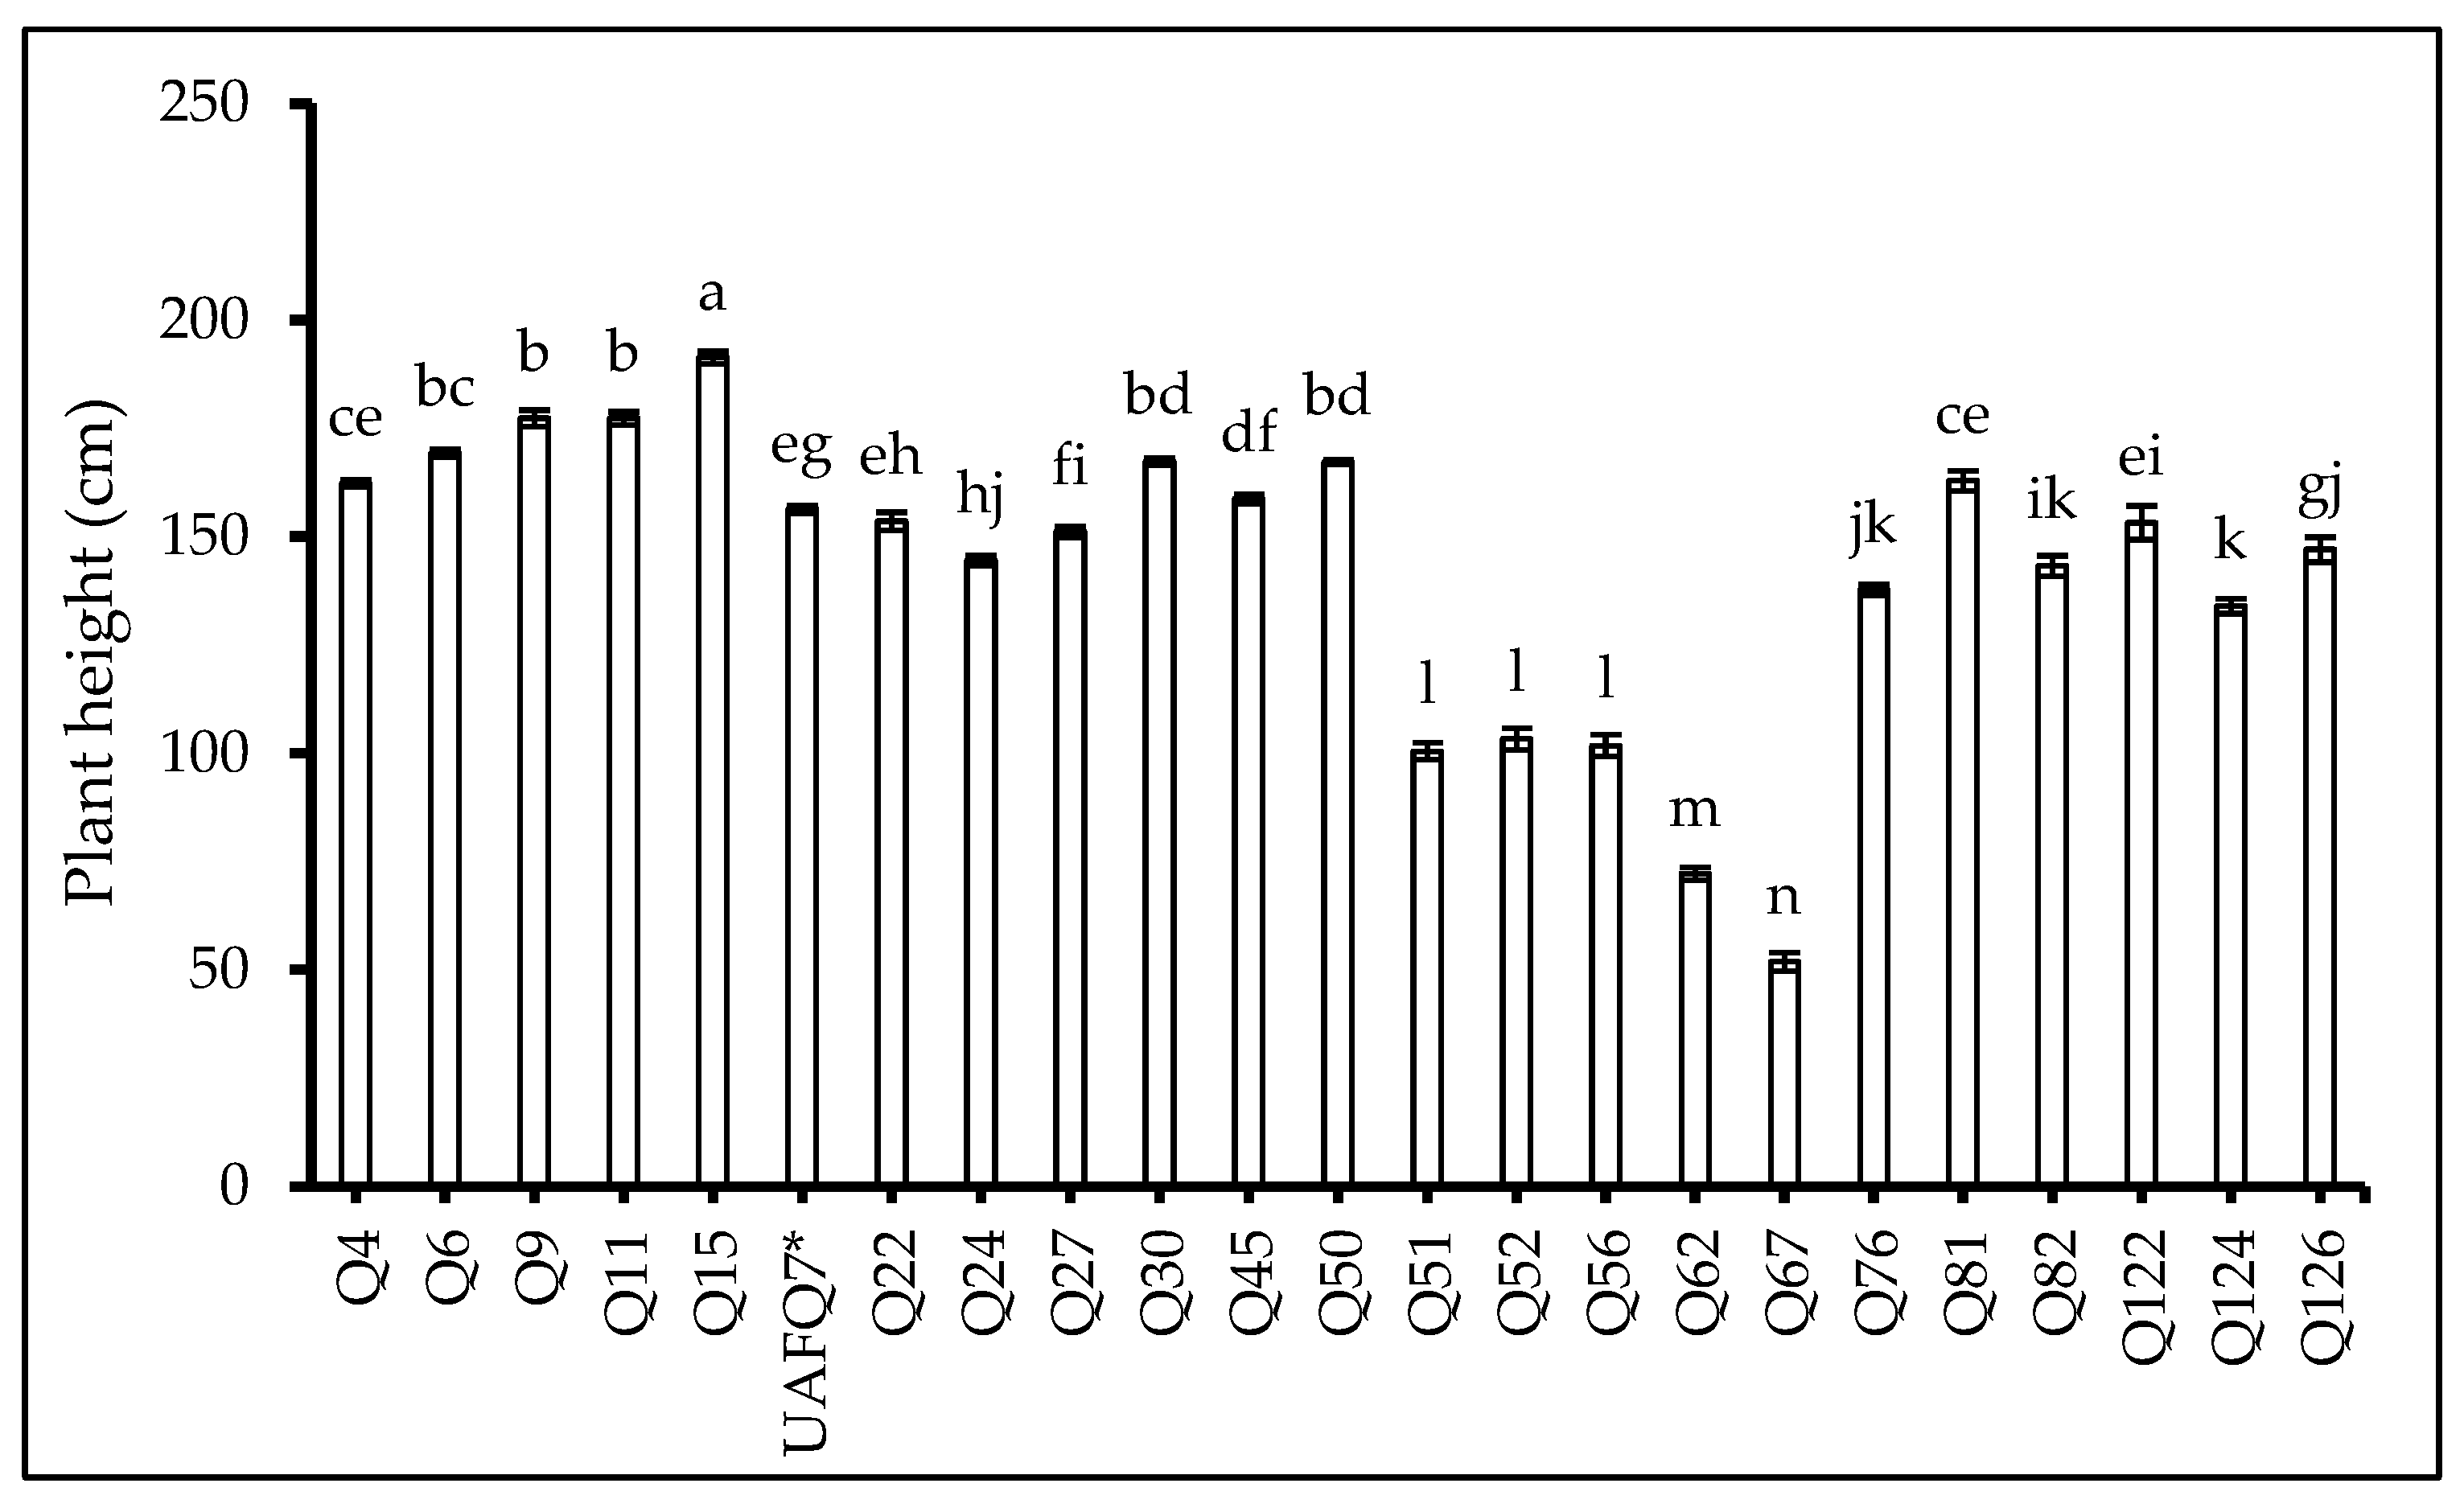
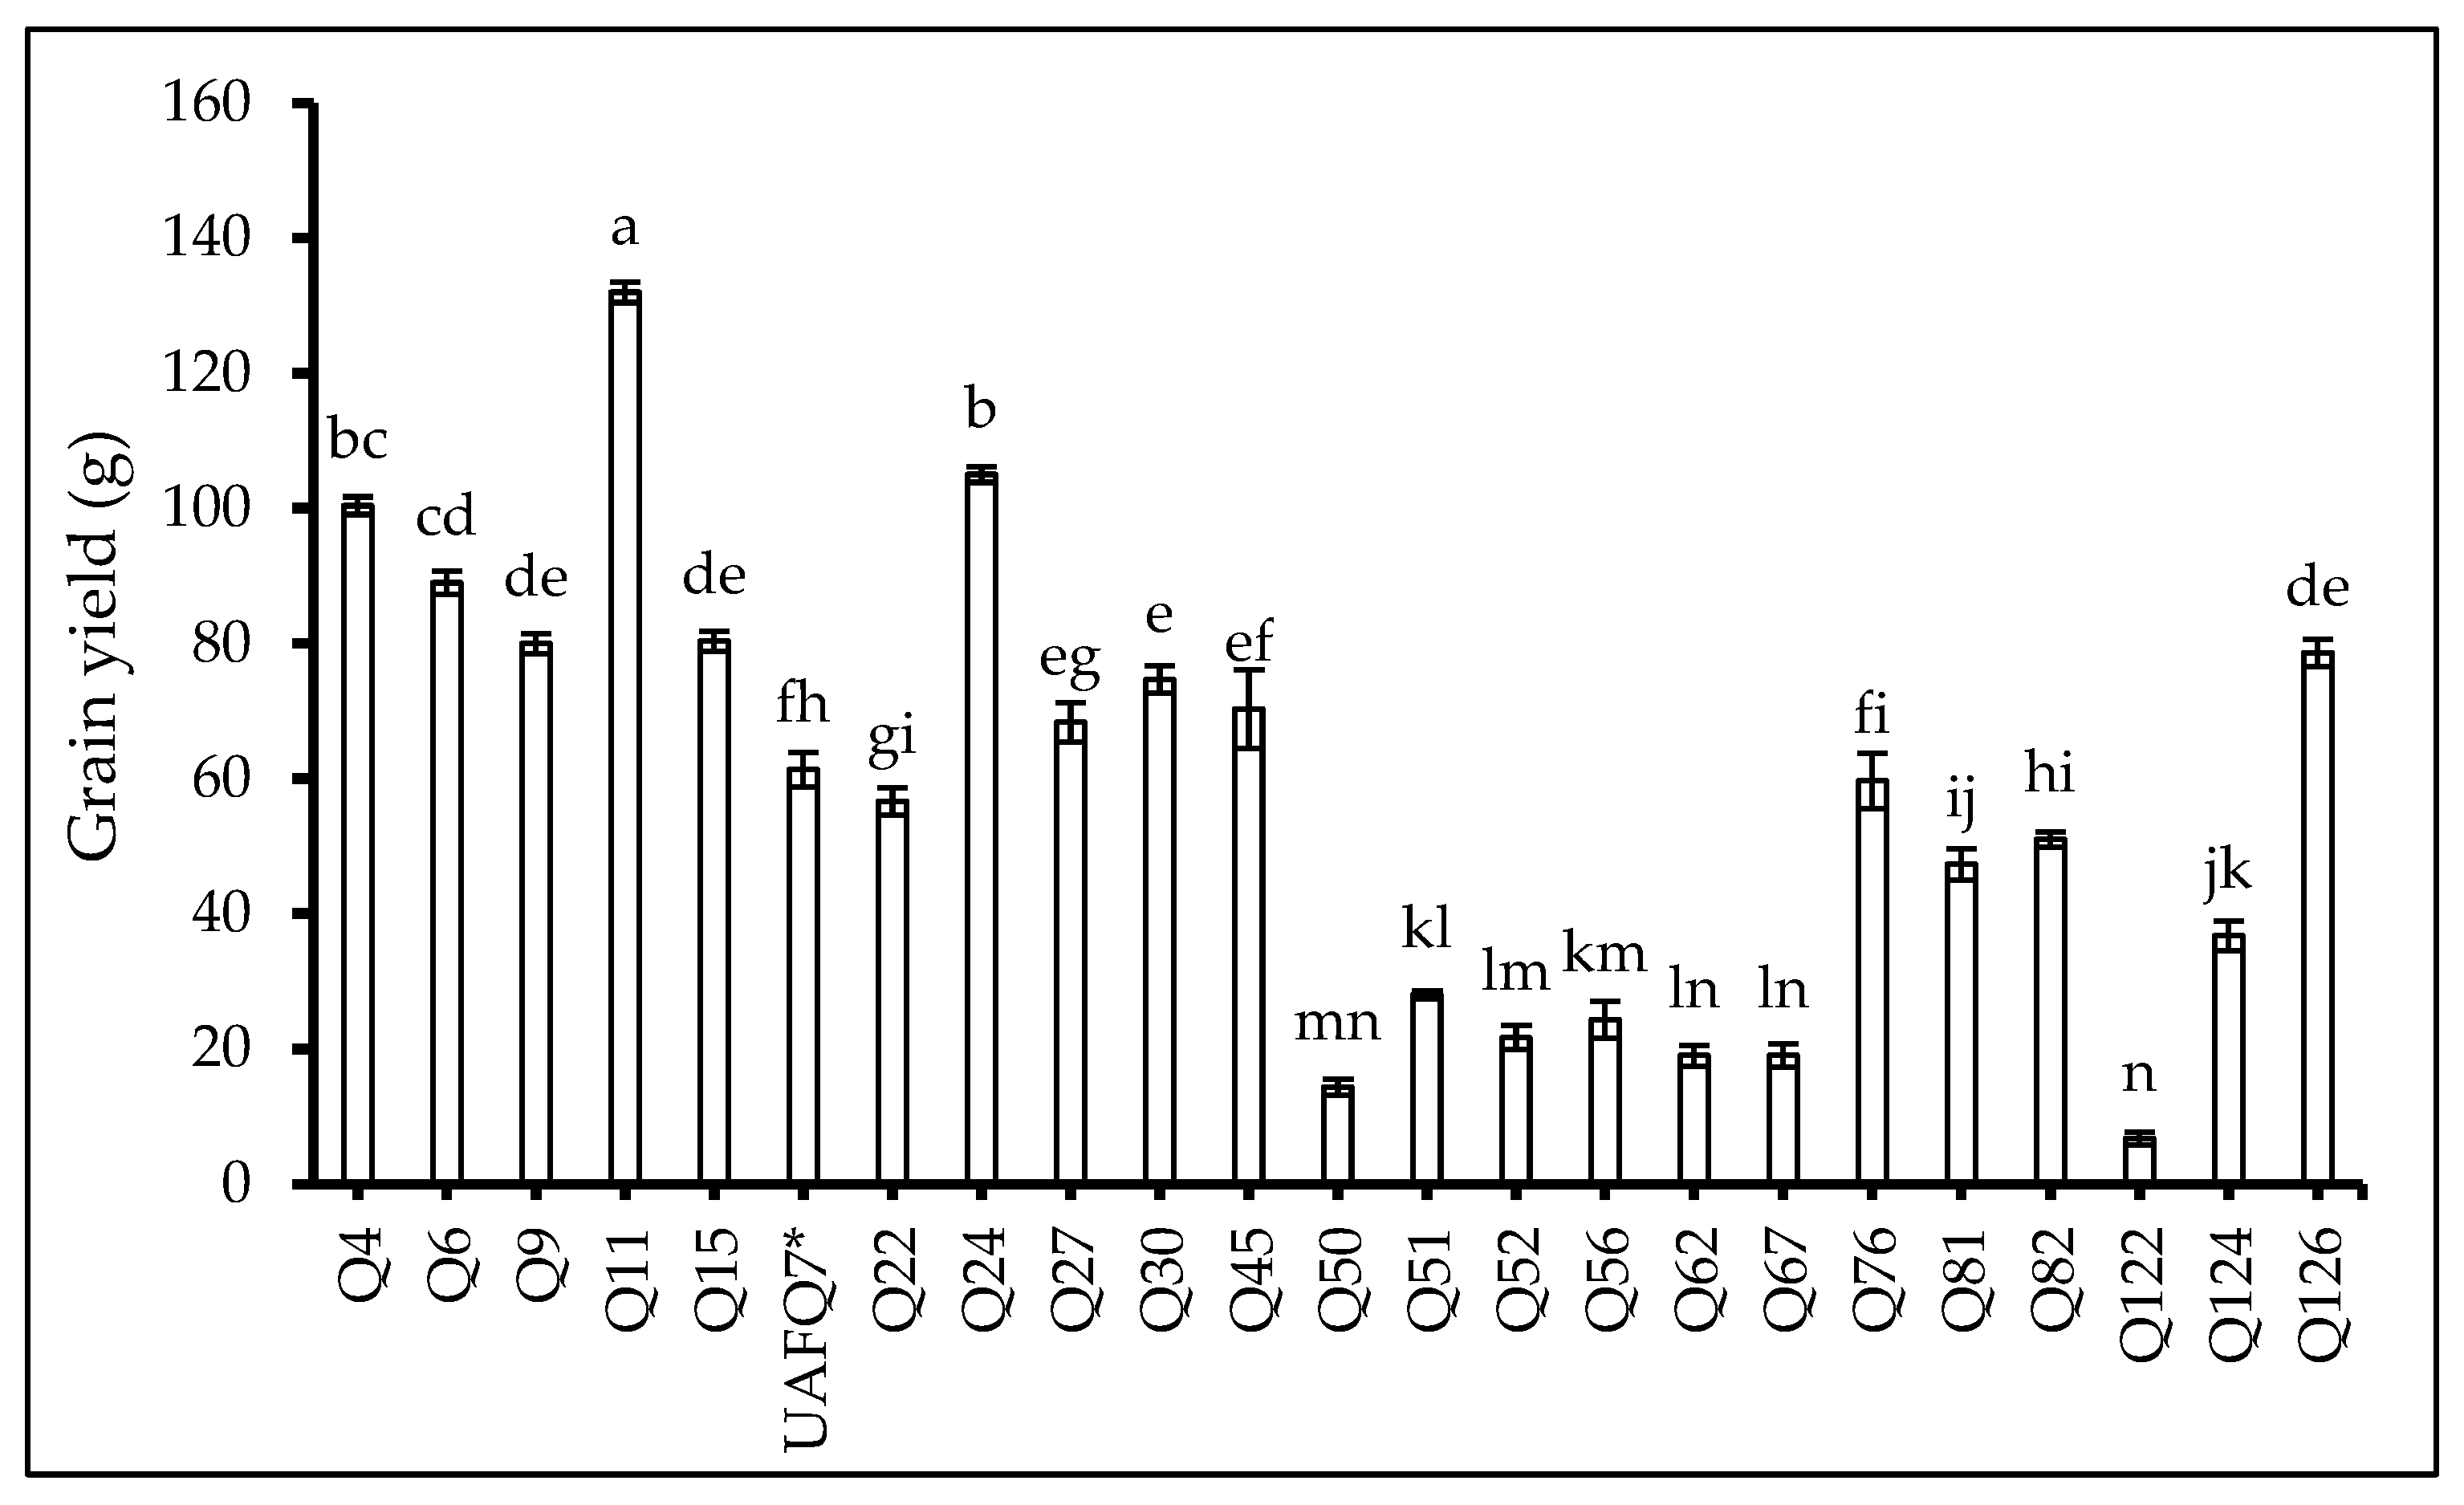
2.6. Yield-Related Traits at the End of the Experiment

At the end of the experiment, yield-related traits were assessed, including plant height (PH), plant biomass (PB), main panicle length (MPL), main panicle grain yield (MPGY), grain yield (GY), 1000 grain weight (1000 GW), harvest index (HI), and germination percentage (GP). All parameters showed significant variation among the evaluated genotypes (p < 0.001; Table 4). More specifically, Q15 exhibited the tallest PH (Figure 4) and recorded the highest GP (Table 4).
Genotype Q11 outperformed other tested genotypes in terms of PB (Table 4), MPGY (Table 4), and GY (Figure 5). Furthermore, Q51 and Q124 displayed the longest main panicle and highest 1000 GW, respectively.
Notably, Q24 showed the shortest crop cycle and achieved the highest harvest index (Table 4), indicating efficient resource allocation to grain production. Among 23 quinoa genotypes tested, 9, 7, 8, 6, 11, 7, 17, and 19 among 23 genotypes surpassed the standard check variety, i.e., UAFQ7 in PH, PB, MPL, TPGY, GY, 1000 GW, HI, and GP, respectively.

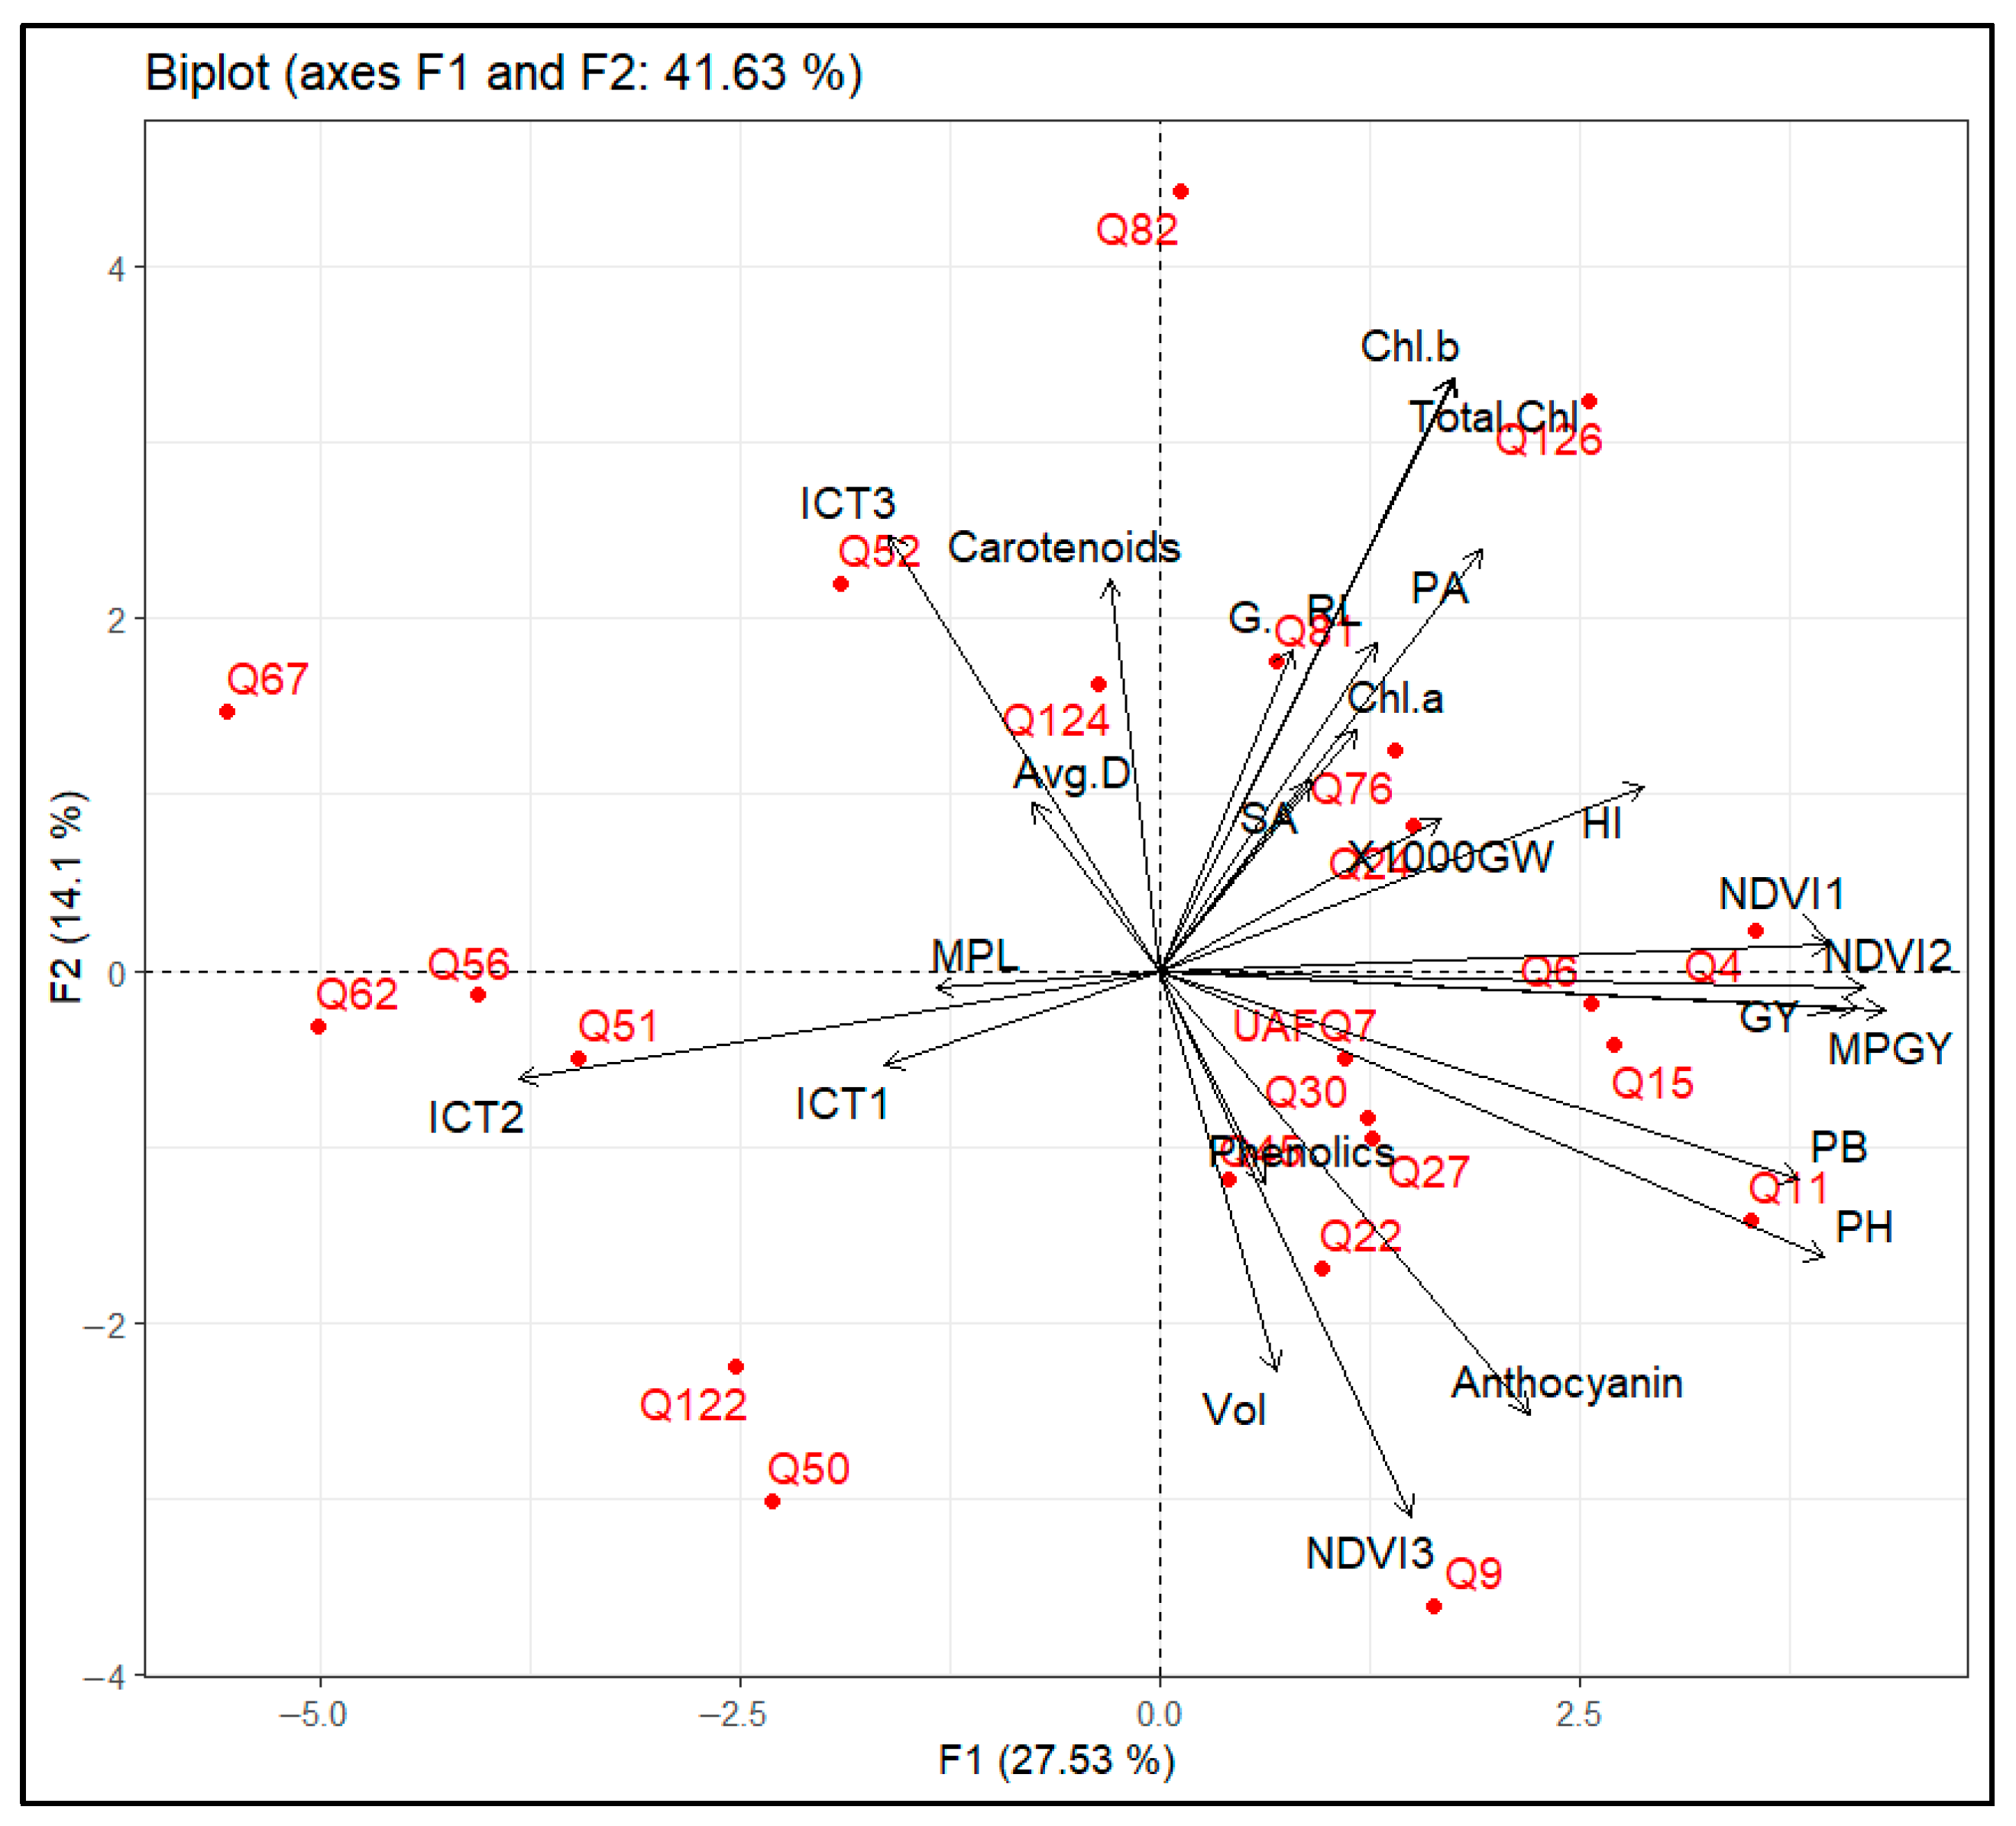
2.7. Principle Component Analysis (PCA)

A principal component analysis (PCA) was performed to explore the multivariate structure of the physiological, biochemical, and agronomic traits recorded across 23 quinoa genotypes (Figure 6). The first two principal components, F1 and F2, accounted for a cumulative 41.63% of the total variation, with F1 explaining 27.53% and F2 explaining 14.1%. The resulting biplot provides insight into the relationships among variables and the distribution of genotypes based on trait performance. Traits associated with productivity, such as grain yield (GY), main panicle grain yield (MPGY), plant height (PH), plant biomass (PB), and NDVI1 and NDVI2—contributed strongly to PC1. Genotypes Q4, Q6, Q11, Q15, and Q126 were closely aligned with these traits on the positive axis of F1, indicating superior agronomic performance and yield potential under the tested conditions.
On the other hand, F2 was predominantly influenced by physiological variables including chlorophyll a (Chl a), chlorophyll b (Chl b), total chlorophyll (Tot. Chl), root length (RL), surface area (SA), and pigment accumulation. Genotypes such as Q82 and Q126 showed strong associations with these variables, suggesting enhanced photosynthetic efficiency and vegetative growth. Biochemical quality parameters such as phenolics, anthocyanins, and NDVI3 were negatively associated with F1 and/or F2, forming a distinct cluster away from the yield-related traits. Genotypes Q9, Q22, and Q50 were in this direction, indicating their potential for use in breeding programs focused on nutritional quality and stress-related secondary metabolites. In contrast, genotypes Q67, Q62, and Q56 were distributed on the negative axis of F1 and distanced from most major agronomic traits, indicating comparatively lower performance under the investigated conditions.
Based on multivariate distribution, genotypes Q4, Q6, and Q126 emerged as promising candidate genotypes for high-yield selection, combining favorable productivity traits. Genotype Q82 also demonstrated desirable vegetative and pigment traits, while Q9 and Q22 may serve as valuable sources of bioactive compounds for breeding programs targeting antioxidant-rich quinoa varieties.

3. Discussion

Using a comprehensive, multidimensional phenotyping framework, this study presents strong evidence of considerable genotypic variation among quinoa genotypes cultivated under field conditions. The results underscore that the performance of quinoa genotypes depends not only on isolated traits, but on the coordinated expression of phenological, physiological, biochemical, and agronomic attributes [30]. The present study demonstrated significant genotypic variability among 23 elite quinoa genotypes in response to local agro-environmental conditions. Specifically, genotypes Q4, Q11, Q15, and Q126 exhibited superior agronomic performance and favorable canopy-level physiological responses, while Q9 and Q52 were characterized by elevated levels of antioxidant compounds, including phenolics and anthocyanins. These results underscore the potential of selected genotypes for use in breeding programs aimed at improving yield, stress adaptability and nutritional quality. This integrated approach proved it was necessary to distinguish high performance genotypes with a balanced trait profile, enabling the selection of leading candidate genotypes for targeted reproductive purposes in alignment with the study’s objectives and underlying hypothesis.
A huge diversification was evident in the genotypes used in the experiment specifically in terms of phenological growth stages. The observed diversity in phonological development, ranging from early- to late-maturing genotypes, reflects a broad adaptive window among the tested genotypes in the present study. However, this diversification alone was not predictive of yield performance, highlighting the importance of interpreting simultaneously the physiological and morphological efficiencies [31]. For example, as demonstrated by Q24, which appeared to be the shortest in the crop cycle, exhibited the highest harvest index. In contrast, genotype Q11, a late-maturing genotype, produced the highest grain yield and above-ground biomass accumulation. The results align with the findings from previous studies, indicating that quinoa productivity is not exclusively dependent on crop cycle duration, but rather is a combination of integrated physiological performance and sour–sink dynamics [12,15,32,33].
Furthermore, genotypes Q4, Q11, Q15, and Q126 demonstrated exceptional agronomic performance, accompanied by the favorable physiological and canopy traits, including lower infrared canopy temperatures and sustained Normalized Difference Vegetation Index (NDVI) values throughout the reproductive growing cycle. These indicators demonstrate efficient energy dissipation, well-regulated transpiration, and stable chlorophyll content, all of which work together to promote greater vegetative vigor and increased assimilate accumulation [34]. These physiological efficiencies align with the performance-enhancing mechanisms reported in the previous open-field phenotyping studies [26,27,28]. Consistent with physiological performance, biochemical evaluations revealed that genotypes exhibited enhanced chlorophyll pigmentation, carotenoids, and phenolic compounds, which corresponded to improved vegetative and, in some cases, reproductive consequences. For example, paired genotypes Q30 and Q126 increased pigment concentrations with vigorous canopy development. On the other hand, genotypes Q9 and Q52 were not the top yielding genotypes, but accumulated significant antioxidant metabolites levels, highlighting their potential for functional food applications [35,36]. Similar results have been revealed in previous studies that identified genotype-specific metabolic signatures contributing to the quinoa nutritional enhancement [15].
Root trait analysis further expanded the differentiation pool among genotypes, particularly highlighting Q15, Q24, and Q82, which exhibited well-developed root systems and elongation even better than standard check variety UAFQ7. Their enhanced root surface area and average diameter facilitate an improvement in resource acquisition and aids in better above-ground biomass development [9,17], also reported for other crops [37]. Although measured under non-limiting soil conditions, the expression of such traits may reflect intrinsic functional strategies that, if consistent across environments, could be exploited for enhanced nutrient-use efficiency and performance stability [13,38]. Multivariate analysis, i.e., Principal Component Analysis (PCA) confirmed the integration of these trait domains, revealing genotype clusters characterized by the simultaneous expression of yield attributes, physiological efficiency, and biochemical traits. Genotypes occupying favorable positions in PCA space, such as Q4 and Q126, highlight the potential to identify ideotypes that combine agronomic performance with physiological and nutritional robustness. Conversely, genotypes exhibiting strength in a single domain (e.g., antioxidant content, i.e., Q9) may be strategically utilized in breeding programs focused on specific value-added traits [8,39,40,41].
The results of this study underscore the need for quinoa breeding programs to adopt a comprehensive strategy for selection by integrating a wide range of morpho-physiological, yield-related, and biochemical traits in addition to traditional yield parameters. The identification of genotypes with consistently favorable performance across multiple trait dimensions underscores the value of integrative phenotyping in capturing complex genotype × trait interactions that drive field-level outcomes [42]. Future research directions should focus on multi-environment field trials to assess the stability of identified trait combinations and genotype rankings under diverse agro-climatic conditions. Evaluating these genotypes across different biotic and abiotic stress gradients, particularly under water-limited, salinity, heavy metal, and high-temperature environments, will provide critical insights into their adaptive plasticity and functional resilience. Furthermore, integrating high-throughput phenotyping platforms with genomic and transcriptomic tools could enable the dissection of genetic loci underlying key traits such as canopy thermal regulation, pigment biosynthesis, and root system architecture. Such genomic insights would facilitate the development of marker-assisted selection pipelines tailored to complex trait integration. Additionally, studies exploring trait heritability and genotype × environment interaction will be essential for developing stable, broadly adaptable quinoa cultivars suited to emerging climate challenges, and nutritional markets [43]. This experiment revealed that quinoa’s performance is driven by closely interconnected trait combinations. Genotypes like Q4, Q11, Q15, and Q126 emerged as strong candidates for varietal improvement aimed at achieving high productivity and enhanced physiological efficiency. Moreover, Q9 and Q52 offer valuable biochemical attributes for quality-focused breeding programs. These findings advocate for a shift toward multidimensional, trait-informed selection strategies in quinoa improvement, ultimately supporting its global expansion as a climate-adaptable and nutritionally rich crop.

4. Materials and Methods

4.1. Experimental Layout

A field experiment was conducted using 23 elite quinoa genotypes, which were previously selected based on their morphological traits and yield adaptability from an initial pool of 128 lines imported from the USDA [15], during fall–winter 2017–18 at directorate farms, University of Agriculture, Faisalabad, Pakistan (31°7′ N, 73°7′ E, 184.4 m a.s.l., Pakistan). The seeds of quinoa genotypes were collected from the Alternate Crops Lab, Department of Agronomy, University of Agriculture, Faisalabad, Pakistan. Among 23, one variety, i.e., UAFQ7, was already approved as the first quinoa variety in Pakistan, used as standard check variety. Details of genotypes used in the experiment can be found in Table 5.
The soil used in the experiment was sandy loam in texture. Detailed soil properties were mentioned in Table 6. However, the soil is classified as Lyallpur soil series in Haplic Yermosols according to FAO classification.
Ridges were prepared in the field to establish the seedbed, maintaining a row spacing of 75 cm between them. Seeds were manually sown on 23 November 2017 using hand-sowing, with a plant-to-plant spacing of 15 cm distance, following a randomized complete block design (RCBD). Nitrogen, phosphorus, and potassium were applied using urea, diammonium phosphate, and sulfate of potash at 75:50:50 kg/ha, respectively. However, a half nitrogen dose and full phosphate and potassium doses were applied at the time of sowing. The remaining half nitrogen dose was applied at the time of first irrigation. Two hoeing operations were carried out at 45 and 70 days after sowing to manage the weeds and maintain soil aeration. The weather data recorded during the experiment are presented in Table 7.

4.2. Plant Measurments

4.2.1. Plant Phenology

Phenological data were recorded by regularly visiting the experimental area when more than 50% of the plants in a plot reached a specific developmental stage, following the scale described by Sosa-Zuniga et al. [44]. The stages were categorized as from S1 to S11 as follows: S1: Emergence, S2: True Leaf, S3: Four leaf, S4: Multiple Leaf, S5: Bud Visible, S6: Bud distinct, S7: Pyramid formation, S8: Flowering, S9: Milking, S10: Seed Set, S11: Maturity.

4.2.2. Biochemical Attributes

Fully expanded mature leaves were collected at S8 and immediately preserved in liquid nitrogen, followed by storage in a biomedical freezer at −80 °C until analysis. These samples were used to quantify the chlorophyll a (Chl a: mg/g FW), chlorophyll b (Chl b: mg/g FW), total chlorophyll (Total Chl: mg/g FW), carotenoids (mg/g FW), total phenolics (µg/g FW), and anthocyanin concentrations in the leaves.
The protocol developed by Nagata and Yamashta [45] was followed for an estimation of Chl a and Chl b concentrations in the leaves. For that purpose, 0.5 g leaf sample was ground in 10 mL of 80% acetone using pestle and mortar. The ground material was then put in falcon tube and centrifuged for 15 min at 4000 rpm. The resulting supernatant was subjected to take absorbance at 663 for Chl a, 645 for Chl b, and 470 nm for carotenoids using spectrophotometer (Shimadzu UV 4000, Shimadzu Corporation, Kyoto, Japan).
The total phenolic contents was determined according to the method described by Waterhouse [46]. For that purpose, a 0.5 g leaf sample was ground in 10 mL of 80% acetone using a mortar and pestle. The homogenate was transferred to a Falcon tube and centrifuged at 4000 rpm for 15 min. A 20 µL aliquot of the resulting supernatant was transferred to a test tube, followed by the addition of 1.58 mL distilled water and 100 µL of FolinCiocalteu reagent. After vertexing for 30 s, 300 µL of 20% sodium carbonate (Na2CO3) was added. The test tubes containing the assay solution were incubated in a water bath at 40 °C for 30 min. Absorbance of both standards and samples was measured at 760 nm using a spectrophotometer (Shimadzu UV4000, Shimadzu Corporation, Kyoto, Japan). Absorbance values were plotted against the corresponding concentrations of gallic acid to derive the regression equation for phenolic determination.
Additionally, the anthocyanin content (mg CGE 100 g−1 DW) was measured by using the method developed by Lees and Francis [47]. The absorbance for anthocyanin was set at 532 nm in spectrophotometer (Shimadzu UV4000, Shimadzu Corporation, Kyoto, Japan) and expressed as mg CGE 100 g−1 DW (cyanidin-3-glucoside equivalents per 100 g dry weight).

4.2.3. Root Related Traits

Simultaneously with the biochemical analysis, root samples were collected to evaluate root-related traits. For root analysis, careful excavation was carried out to minimize root damage and samples were gently washed under a water stream to remove the adhering soil and debris. Cleaned roots were scanned using a root scanner operated with Epson scan 2 software. The resulting images were analyzed using WinRhizo companion software v7.6.5 to determine root morphological parameters, including root length (RL: cm), projected area PA: (cm2), surface area (SA: cm2), volume (Vol: cm3), and average diameter (Avg. D: mm).

4.2.4. Physiological Attributes

Infrared Canopy Temperature (ICT: °C) and Normalized Difference Vegetation Index (NDVI) were recorded at three different time points following flowering: t1: 94 DAS, t2: 108 DAS, and t3: 125 DAS. For that purpose, an infrared thermometer (RAY, STEP Systems GmbH, Nuremberg, Germany) was used to record the ICT, while NDVI was measured with a Handheld GreenSeeker Optical Sensor Unit (Model-505). All measurements were conducted between 9:00 AM and 11:00 AM to ensure consistency and minimize diurnal variation.

4.2.5. Plant Growth and Yield-Related Attributes

At the end of the experiment, six plants were randomly selected from each plot to assess growth and yield-related attributes. The parameters measured included plant height (PH: cm), plant biomass (PB: g), total grain yield (GY: g), main panicle length (MPL: cm), and main panicle grain yield (MPGY: g), thousand grain weight (1000 GW: g), harvest index (HI), and germination percentage (GP: %). The PH and MPL were measured by using a meter rod. The PB was determined by drying the harvested above-ground biomass in an oven at 70 °C until the constant weight was achieved and weighed at weight balance. The GY was observed by taking the weight of all the seeds obtained from the terminal panicle (main panicle) as well as from sub-panicles, however MPGY only included the weight of seeds from the terminal panicle (main panicle). For determining 1000 GW, seeds were counted using a seed counter (Model #14100011, Pfeuffer GmbH, Kitzingen, Germany) and then weighed. Finally, the HI was calculated as the ratio of economic (GY) to biological yield (PB).

4.3. Statistical Analysis

All experimental data were tested for normality and homogeneity of variances prior to statistical analysis. One-way analysis of variance (ANOVA) was conducted under a randomized complete block design (RCBD) to evaluate the effects of different tested genotypes used in the experiment. When significant differences among means were detected, Tukey’s Honest Significant Difference (HSD) test was applied for multiple comparisons at a significance level of p < 0.05%. Additionally, principal component analysis (PCA) was performed to explore the relationships among the measured traits and to visualize varietal responses and their variations. All statistical analyses including PCA were carried out using RStudio software v4.2.0 [48].

5. Conclusions

This present investigation highlighted significant genotypic variability among quinoa genotypes by employing an integrated phenotyping approach that combined agronomic, physiological, biochemical, and root traits under open-field conditions. Genotypes such as Q4, Q11, Q15, and Q126 demonstrated superior growth performance across multiple dimensions, indicating their potential for high-yield, climate-resilient cultivation. On the other hand, Q9 and Q52 stood out for their rich antioxidant profiles, suggesting value in nutritional breeding programs. The standard check variety UAFQ7 was outperformed by many elite quinoa genotypes in key traits, including yield, pigmentation, i.e., chlorophyll content, physiology, i.e., NDVI and root system development, highlighting the superior adaptability and functional efficiency of selected lines such as Q4, Q11, Q15, and Q126. This comparison underscores the potential of the evaluated germplasm to enrich or complement existing variety, i.e., UAFQ7 under similar agro-ecological conditions. The use of Infrared Canopy Temperature (ICT) and Normalized Difference Vegetation Index (NDVI) effectively differentiated genotypes with superior stress adaptability and photosynthetic efficiency. Moreover, root traits further highlighted below-ground strategies that support resource-use efficiency. These findings emphasize the need for breeding programs to adopt multidimensional selection frameworks rather than relying solely on yield metrics. Future studies should focus on multi-environment trials, explore trait heritability and integrate genomic tools to uncover the genetic basis of complex traits, enabling the development of robust quinoa ideotypes tailored for both productivity and nutritional quality in diverse agro-climatic regions.

Author Contributions

Conceptualization, S.N. and M.Z.A.; methodology, S.N. and M.Z.A.; software, S.N. and M.Z.A.; validation, M.Z.A.; formal analysis, S.N. and M.Z.A.; investigation, S.N. and M.Z.A.; resources, S.N. and M.Z.A.; data curation, S.N. and M.Z.A.; writing—original draft preparation, S.N.; writing—review and editing, S.N. and M.Z.A.; visualization, M.Z.A.; supervision, M.Z.A.; project administration, S.N. and M.Z.A.; funding acquisition, M.Z.A. All authors have read and agreed to the published version of the manuscript.

Funding

This research received no external funding.

Data Availability Statement

The data presented in this study are available upon request from the corresponding authors.

Acknowledgments

We would like to acknowledge Shahzad Maqsood Ahmed Basra, Head of the Alternate Crops Lab, Department of Agronomy, University of Agriculture, Faisalabad, Pakistan, for his valuable support and for providing research facilities during the experiment. We also gratefully acknowledge the University of Agriculture Faisalabad for offering the necessary infrastructure and institutional support throughout the study.

Conflicts of Interest

The authors declare no conflicts of interest.

References

  1. FAO. Home-International Year of Quinoa 2013. 2013. Available online: http://www.fao.org/quinoa-2013/en (accessed on 10 July 2025).
  2. Akram, M.Z.; Libutti, A.; Rivelli, A.R. Evaluation of vegetative development of quinoa under water stress by applying different organic amendments. Agronomy 2023, 13, 1412. [Google Scholar] [CrossRef]
  3. Bazile, D.; Jacobsen, S.-E.; Verniau, A. The global expansion of quinoa: Trends and limits. Front. Plant Sci. 2016, 7, 622. [Google Scholar] [CrossRef] [PubMed]
  4. Xu, J.; Farooq, H.U.; Hashim, M.; Rey, E.; Curti, R.; Morris, A.; Maughan, P.J.; Jellen, E.N.; Jarvis, D.E.; Bertero, D. Wild relatives to improve heat tolerance of cultivated quinoa (Chenopodium quinoa Willd.): Pollen viability and seed number. J. Exp. Bot. 2025, eraf235. [Google Scholar] [CrossRef] [PubMed]
  5. Dehghanian, Z.; Ahmadabadi, M.; Asgari Lajayer, B.; Gougerdchi, V.; Hamedpour-Darabi, M.; Bagheri, N.; Sharma, R.; Vetukuri, R.R.; Astatkie, T.; Dell, B. Quinoa: A promising crop for resolving the bottleneck of cultivation in soils affected by multiple environmental abiotic stresses. Plants 2024, 13, 2117. [Google Scholar] [CrossRef] [PubMed]
  6. Zafar, M.; Shahzad, M.; Akram, M.Z.; Quratulain, M.S.; Nazeer, S. Assessment of growth and physiological traits of Chenopodium quinoa lines under different salt levels. Sarhad J. Agric. 2024, 40, 315–324. [Google Scholar] [CrossRef]
  7. Iqbal, S.; Baloch, H.; Hafeez, M.B.; Zahra, N.; Fatima, E.M.; Raza, A.; Raza, S.; Saddiq, M.S. Salt tolerance in quinoa genotypes: Ion-specific adaptations and growth performance under hydroponic conditions. Agrociencia Urug. 2025, 29, e1538. [Google Scholar] [CrossRef]
  8. Akram, M.Z.; Libutti, A.; Andreasen, C.; Liu, F.; Rivelli, A.R. Woody biochar differently influences plant water status and growth of five Quinoa (Chenopodium Quinoa Willd.) varieties under water stress. J. Soil Sci. Plant Nut. 2025, 25, 5140–5156. [Google Scholar] [CrossRef]
  9. Akram, M.Z.; Rivelli, A.R.; Libutti, A.; Liu, F.; Andreasen, C. Mitigation of drought stress for Quinoa (Chenopodium quinoa Willd.) varieties using woodchip biochar-amended soil. Plants 2024, 13, 2279. [Google Scholar] [CrossRef] [PubMed]
  10. Rivelli, A.R.; Akram, M.Z.; Libutti, A. Woody biochar rate and water shortage impact on early growth stages of Chenopodium quinoa Willd. Agronomy 2023, 14, 53. [Google Scholar] [CrossRef]
  11. Akram, M.Z.; Libutti, A.; Rivelli, A.R. Enhancing vegetative growth of quinoa and soil properties under water shortage through targeted organic amendments. Biol. Life Sci. For. 2023, 30, 4. [Google Scholar] [CrossRef]
  12. Matías, J.; Rodríguez, M.J.; Carrillo-Vico, A.; Casals, J.; Fondevilla, S.; Haros, C.M.; Pedroche, J.; Aparicio, N.; Fernández-García, N.; Aguiló-Aguayo, I. From ‘farm to fork’: Exploring the potential of nutrient-rich and stress-resilient emergent crops for sustainable and healthy food in the Mediterranean region in the face of climate change challenges. Plants 2024, 13, 1914. [Google Scholar] [CrossRef] [PubMed]
  13. Singh, H.; Kumar, N.; Kumar, A. Enhancing resource use efficiency in crops through plant functional traits. In Plant Functional Traits for Improving Productivity; Kumar, N., Singh, H., Eds.; Springer: Singapore, 2024; pp. 97–117. [Google Scholar] [CrossRef]
  14. Santamarina, C.; Mathieu, L.; Bitocchi, E.; Pieri, A.; Bellucci, E.; Di Vittori, V.; Susek, K.; Scossa, F.; Nanni, L.; Papa, R. Agroecological genomics and participatory science: Optimizing crop mixtures for agricultural diversification. Trends Plant Sci. 2025. [Google Scholar] [CrossRef] [PubMed]
  15. Hafeez, M.B.; Iqbal, S.; Li, Y.; Saddiq, M.S.; Basra, S.M.; Zhang, H.; Zahra, N.; Akram, M.Z.; Bertero, D.; Curti, R.N. Assessment of phenotypic diversity in the USDA collection of quinoa links genotypic adaptation to germplasm origin. Plants 2022, 11, 738. [Google Scholar] [CrossRef] [PubMed]
  16. Singh, D. Quinoa (Chenopodium quinoa Willd): A Potential Crop for Future Food, Healthy Security, Livelihood Generation and Poverty Eradication; Scientific Publishers: Jodhpur, India, 2019. [Google Scholar]
  17. Akram, M.Z.; Basra, S.M.A.; Hafeez, M.B.; Khan, S.; Nazeer, S.; Iqbal, S.; Saddiq, M.S.; Zahra, N. Adaptability and yield potential of new quinoa lines under agro-ecological conditions of Faisalabad-Pakistan. Asian J. Agric. Biol. 2021, 2, 202005301. [Google Scholar] [CrossRef]
  18. Coţovanu, I.; Mironeasa, C.; Mironeasa, S. Nutritionally improved wheat bread supplemented with quinoa flour of large, medium and small particle sizes at typical doses. Plants 2023, 12, 698. [Google Scholar] [CrossRef] [PubMed]
  19. Bastidas, E.; Roura, R.; Rizzolo, D.; Massanés, T.; Gomis, R. Quinoa (Chenopodium quinoa Willd), from nutritional value to potential health benefits: An integrative review. J. Nutr. Food Sci. 2016, 6, 3. [Google Scholar] [CrossRef]
  20. Li, L.; Zhang, Q.; Huang, D. A review of imaging techniques for plant phenotyping. Sensors 2014, 14, 20078–20111. [Google Scholar] [CrossRef] [PubMed]
  21. Araus, J.L.; Cairns, J.E. Field high-throughput phenotyping: The new crop breeding frontier. Trends Plant Sci. 2014, 19, 52–61. [Google Scholar] [CrossRef] [PubMed]
  22. Abdelaziz, H.; Redouane, C.A. Phenotyping the Combined Effect of Heat and Water Stress on Quinoa. In Emerging Research in Alternative Crops; Hirich, A., Choukr-Allah, R., Ragab, R., Eds.; Environment & Policy; Springer: Singapore, 2020; Volume 58, pp. 163–183. [Google Scholar] [CrossRef]
  23. García-Parra, M.; Zurita-Silva, A.; Stechauner-Rohringer, R.; Roa-Acosta, D.; Jacobsen, S.-E. Quinoa (Chenopodium quinoa Willd.) and its relationship with agroclimatic characteristics: A Colombian perspective. Chil. J. Agric. Res. 2020, 80, 290–302. [Google Scholar] [CrossRef]
  24. Ren, A.; Jiang, Z.; Dai, J.; Sun, M.; Anwar, S.; Tang, P.; Wang, R.; Ding, P.; Li, L.; Wu, X. Phenotypic characterization and yield screening of quinoa germplasms in diverse low-altitude regions: A preliminary study. Agronomy 2024, 14, 1354. [Google Scholar] [CrossRef]
  25. Vasconcelos, E.S.d.; Echer, M.d.M.; Kliemann, M.A.; Lang, M.J. Selection and recommend of quinoa (Chenopodim quinoa) genotypes based on the yield genotypic adaptability and stability. Rev. Ceres 2019, 66, 117–123. [Google Scholar] [CrossRef]
  26. Pineda, M.; Barón, M.; Pérez-Bueno, M.-L. Thermal imaging for plant stress detection and phenotyping. Remote Sens. 2020, 13, 68. [Google Scholar] [CrossRef]
  27. Jones, H.G.; Serraj, R.; Loveys, B.R.; Xiong, L.; Wheaton, A.; Price, A.H. Thermal infrared imaging of crop canopies for the remote diagnosis and quantification of plant responses to water stress in the field. Funct. Plant Biol. 2009, 36, 978–989. [Google Scholar] [CrossRef] [PubMed]
  28. Liu, J.; Fan, J.; Yang, C.; Xu, F.; Zhang, X. Novel vegetation indices for estimating photosynthetic and non-photosynthetic fractional vegetation cover from Sentinel data. Int. J. Appl. Earth Obs. Geoinf. 2022, 109, 102793. [Google Scholar] [CrossRef]
  29. Mbebi, A.J.; Mercado, F.; Hobby, D.; Tong, H.; Nikoloski, Z. Advances in multi-trait genomic prediction approaches: Classification, comparative analysis, and perspectives. Brief. Bioinform. 2025, 26, bbaf211. [Google Scholar] [CrossRef] [PubMed]
  30. Hosseini, S.M.S.; Shiri, M.; Mostafavi, K.; Mohammadi, A.; Miri, S.M. Genetic analysis and association detection of agronomic traits in maize genotypes. Sci. Rep. 2025, 15, 399. [Google Scholar] [CrossRef] [PubMed]
  31. Sembada, A.A.; Faizal, A.; Sulistyawati, E. Photosynthesis efficiency as key factor in decision-making for forest design and redesign: A systematic literature review. Ecol. Front. 2024, 44, 1128–1139. [Google Scholar] [CrossRef]
  32. Jacobsen, S.E. The scope for adaptation of quinoa in northern latitudes of Europe. J. Agron. Crop Sci. 2017, 203, 603–613. [Google Scholar] [CrossRef]
  33. Cui, H.; Yao, Q.; Xing, B.; Zhou, B.; Shah, S.S.; Qin, P. The performance of agronomic and quality traits of Quinoa under different altitudes in northwest of China. Agronomy 2024, 14, 1194. [Google Scholar] [CrossRef]
  34. Hou, M.; Tian, F.; Zhang, T.; Huang, M. Evaluation of canopy temperature depression, transpiration, and canopy greenness in relation to yield of soybean at reproductive stage based on remote sensing imagery. Agric. Water Manag. 2019, 222, 182–192. [Google Scholar] [CrossRef]
  35. Contreras, R.A.; Pizarro, M.; Batista-Gonzalez, A. Exploring plant metabolites for functional food applications: A review of bioactive compounds and their potential use in the food industry. Preprints 2025, 2025040688. [Google Scholar] [CrossRef]
  36. Kasote, D.M.; Katyare, S.S.; Hegde, M.V.; Bae, H. Significance of antioxidant potential of plants and its relevance to therapeutic applications. Int. J. Biol. Sci. 2015, 11, 982. [Google Scholar] [CrossRef] [PubMed]
  37. Fan, J.-W.; Chen, M.; Tian, F.; Yao, R.; Qin, N.-N.; Wu, W.-H.; Turner, N.C.; Li, F.-M.; Du, Y.-L. Root morphology, exudate patterns, and mycorrhizal symbiosis are determinants to improve phosphorus acquisition in alfalfa. J. Exp. Bot. 2025, eraf107. [Google Scholar] [CrossRef] [PubMed]
  38. De Corato, U.; Viola, E.; Keswani, C.; Minkina, T. Impact of the sustainable agricultural practices for governing soil health from the perspective of a rising agri-based circular bioeconomy. Appl. Soil Ecol. 2024, 194, 105199. [Google Scholar] [CrossRef]
  39. Mahmood, U.; Li, X.; Fan, Y.; Chang, W.; Niu, Y.; Li, J.; Qu, C.; Lu, K. Multi-omics revolution to promote plant breeding efficiency. Front. Plant Sci. 2022, 13, 1062952. [Google Scholar] [CrossRef] [PubMed]
  40. Gharib, M.; Qabil, N.; Salem, A.; Ali, M.; Awaad, H.; Mansour, E. Characterization of wheat landraces and commercial cultivars based on morpho-phenological and agronomic traits. Cereal Res. Commun. 2021, 49, 149–159. [Google Scholar] [CrossRef]
  41. Vitale, P.; Laidò, G.; Dono, G.; Pecorella, I.; Ramasubramanian, V.; Lorenz, A.; De Vita, P.; Pecchioni, N. Univariate and multivariate genomic prediction for agronomic traits in durum wheat under two field conditions. PLoS ONE 2024, 19, e0310886. [Google Scholar] [CrossRef] [PubMed]
  42. Mansoor, S.; Karunathilake, E.M.; Tuan, T.T.; Chung, Y.S. Genomics, phenomics, and machine learning in transforming plant research: Advancements and challenges. Hortic. Plant J. 2025, 11, 486–503. [Google Scholar] [CrossRef]
  43. Thiam, E.; Allaoui, A.; Benlhabib, O. Quinoa productivity and stability evaluation through varietal and environmental interaction. Plants 2021, 10, 714. [Google Scholar] [CrossRef] [PubMed]
  44. Sosa-Zuniga, V.; Brito, V.; Fuentes, F.; Steinfort, U. Phenological growth stages of quinoa (Chenopodium quinoa) based on the BBCH scale. Ann. Appl. Biol. 2017, 171, 117–124. [Google Scholar] [CrossRef]
  45. Nagata, M.; Yamashita, I. Simple method for simultaneous determination of chlorophyll and carotenoids in tomato fruit. Nippon Shokuhin Kogyo Gakkaishi 1992, 39, 925–928. [Google Scholar] [CrossRef]
  46. Waterhouse, A.L. Determination of total phenolics. In Current Protocols in Food Analytical Chemistry; Wrolstad, R.E., Ed.; John Wiley & Sons: New York, NY, USA, 2001; Volume 6, pp. I1. 1.1–I1. 1.8. [Google Scholar]
  47. Lees, D.; Francis, F. Quantitative methods for anthocyanins: 6. Flavonols and anthocyanins in cranberries. J. Food Sci. 1971, 36, 1056–1060. [Google Scholar] [CrossRef]
  48. R Core Team. R: A Language and Environment for Statistical Computing; R Foundation for Statistical Computing: Vienna, Austria, 2013; Available online: https://cir.nii.ac.jp/crid/1370298755636824325 (accessed on 10 July 2025).
Figure 1. Root length (RL: cm) of 23 elite quinoa genotypes (Q4-Q126) recorded at flowering. Values are means (n = 3) ± S.E. In each graph, different letters above the bars indicate significant differences among treatments (p < 0.05, Tukey’s test). F test significant at p < 0.001. Standard check variety—UAFQ7*.
Plants 14 02332 g001
Figure 2. Infrared Canopy Temperature (ICT: °C) of 23 elite quinoa genotypes (Q4-Q126) recorded at three time points, i.e., t1: 94 DAS, t2: 108 DAS, and t3: 125 DAS. Values are means (n = 3) ± S.E. Stars after each data label indicate significant differences among treatments (p < 0.05, Tukey’s test). F test significant at **—p < 0.01, ***—p < 0.001. Standard check variety—UAFQ7*.
Plants 14 02332 g002
Figure 3. Normalized Difference Vegetation Index (NDVI) of 23 elite quinoa genotypes (Q4-Q126) recorded at three time points i.e., t1: 94 DAS, t2: 108 DAS, and t3: 125 DAS. Values are means (n = 3) ± S.E. Stars after each data label indicate significant differences among treatments (p < 0.05, Tukey’s test). F test significant at ***—p < 0.001. Standard check variety—UAFQ7*.
Plants 14 02332 g003
Figure 4. Plant height (PH: cm) of 23 elite quinoa genotypes (Q4–Q126) recorded at flowering. Values are means (n = 3) ± S.E. In each graph, different letters above the bars indicate significant differences among treatments (p < 0.05, Tukey’s test). F test significant at p < 0.001. Standard check variety—UAFQ7*.
Plants 14 02332 g004
Figure 5. Grain yield (GY: cm) of 23 elite quinoa genotypes (Q4-Q126) recorded at flowering. Values are means (n = 3) ± S.E. In each graph, different letters above the bars indicate significant differences among treatments (p < 0.05, Tukey’s test). F test significant at p < 0.001. Standard check variety—UAFQ7*.
Plants 14 02332 g005
Figure 6. Correlation biplot derived from Principal Component Analysis (PCA) of 23 quinoa genotypes based on agronomic, physiological, and biochemical traits. Chlorophyll a—Chl a; chlorophyll b—Chl b; total chlorophyll—Total Chl; Root length—RL; root surface area—SA, root projected area—PA, root volume—Vol; root average diameter—Avg. D; Infrared Canopy Temperature—ICT, at 94 (ICT1), 108 (ICT2), and 125 (ICT3) DAS; Normalized Difference Vegetation Index—NDVI, at 94 (NDVI1), 108 (NDVI2) and 125 (NDVI3) DAS; plant height— PH; plant biomass—PB, main panicle length—MPL; main panicle grain yield—MPGY, thousand grain weight—1000 GW, harvest index—HI. Red dots: quinoa genotypes Q4–Q126. Standard check variety—UAFQ7*.
Plants 14 02332 g006
Table 1. Phenological distribution of 23 quinoa genotypes.
GenotypesS1S2S3S4S5S6S7S8S9S10S11
Q456142444577081110125138
Q668132146536478106124146
Q967142446556680115132143
Q1176132447556880105124147
Q1556142344536579113128145
UAFQ7*56142351586878110126145
Q2257152348597082108122145
Q2456142448587082102115128
Q2767142145566879104126146
Q3067152546596879115129144
Q4556142457657687110125145
Q5066132455616878107142170
Q5177152446586879111128145
Q5267132344586982106125143
Q5664142445576777108122142
Q6267142244577079112130145
Q6764142445556881108128146
Q7667142455687989115130147
Q8166142557667787105127144
Q8267142448647385106129128
Q12276152551627586104135149
Q12467152254576981117132145
Q12667152255657784115135146
S1—Emergence, S2—True Leaf, S3—Four leaf, S4—Multiple Leaf, S5—Bud Visible, S6—Bud distinct, S7—Pyramid, S8—Flowering, S9—Milking, S10—Seed Set, S11—Days to Maturity. Standard check variety—UAFQ7*.
Table 2. Chlorophyll a (Chl a: mg/g FW), b (Chl b: mg/g FW), total chlorophyll (Total Chl: mg/g FW), carotenoids (mg/g FW), phenolics (mg/g FW), and anthocyanin (mg CGE 100 g−1 DW) contents of 23 quinoa genotypes recorded at flowering.
GenotypesChl a
(mg/g FW)
Chl b
(mg/g FW)
Total Chl
(mg/g FW)
Carotenoids
(mg/g FW)
Phenolics
(µg/g FW)
Anthocyanin
(mg CGE 100 g−1 DW)
Q40.045 ab0.243 ac0.288 ac3.354 ab0.701 ac0.584 gi
Q60.034 cg0.447 ac0.482 ac 2.884 ab0.586 bc1.144 ac
Q90.031 dh0.150 bc0.181 bc2.727 b0.825 a1.287 a
Q110.030 eh0.266 ac0.296 ac3.336 ab0.655 ac1.130 ad
Q150.036 af0.218 ac0.255 ac3.701 ab0.673 ac1.215 a
UAFQ7*0.026 gh0.165 bc0.191 bc3.688 ab0.684 ac1.149 ac
Q220.036 af0.221 ac0.257 ac3.092 ab0.659 ac1.212 a
Q240.027 gh0.202 ac0.228 ac3.526 ab0.646 ac1.180 ab
Q270.032 dg0.219 ac0.251 ac3.153 ab0.809 ab1.085 ae
Q300.045 a0.321 ac0.366 ac3.330 ab0.683 ac1.063 af
Q450.039 ae0.276 ac0.315 ac2.541 b0.753 ac0.799 di
Q500.034 cg0.159 bc0.193 bc2.991 ab0.799 ac1.204 a
Q510.034 cg0.354 ac0.388 ac2.831 b0.712 ac0.788 ei
Q520.043 ac0.379 ac0.422 ac4.915 a0.748 ac0.517 hi
Q560.034 cg0.051 c0.085 c3.388 ab0.564 c0.671 gi
Q620.022 h0.056 c0.078 c3.267 ab0.711 ac0.807 di
Q670.034 cg0.219 ac0.253 ac3.955 ab0.599 ac0.699 gi
Q760.037 af0.564 ab0.600 ab2.771 b0.694 ac0.745 fi
Q810.038 ae0.388 ac0.425 ac3.937 ab0.717 ac0.841 ch
Q820.039 ad0.576 ab0.615 ab2.648 b0.713 ac0.500 i
Q1220.028 fh0.081 c0.109 c3.183 ab0.644 ac0.741 fi
Q1240.036 bf0.525 ac0.561 ac3.873 ab0.657 ac0.854 bh
Q1260.033 dg0.669 a0.702 a4.508 ab0.687 ac1.124 ae
Level of significance
****************
The different letters followed by values in the same column indicate differences among treatments according to Tukey’s HSD. Values are mean (n = 3), F-test significant at **: (p < 0.01), ***: (p < 0.001). Standard check variety—UAFQ7*.
Table 3. Surface area (SA: cm2), projected area (PA: cm2), volume (Vol: cm3) and average diameter (Avg. D: mm) of 23 quinoa genotypes recorded at flowering.
GenotypesSA
(cm2)
PA
(cm2)
Vol
(cm3)
Avg. D
(mm)
Q494.2 a32.1 ab1.4530.550 d
Q636.3 gh25.1 ag1.7170.823 cd
Q953.5 ef14.1 eg1.6910.934 bd
Q1134.2 gh19.1 bg1.6701.782 a
Q1595.5 a33.3 a1.9401.837 a
UAFQ7*84.5 ac33.9 a1.5471.837 a
Q2259.8 df23.9 ag1.7901.620 ab
Q2493.8 a32.7 a1.5301.647 a
Q2761.3 de23.5 ag1.6100.857 cd
Q3044.7 fg17.0 cg1.8131.670 a
Q4527.0 h26.5 af1.6401.773 a
Q5054.4 ef12.7 g1.8331.723 a
Q5133.2 gh12.1 g1.5330.071 a
Q5260.0 df31.3 ab1.4431.573 ab
Q5668.6 ce21.8 ag1.7971.947 a
Q6275.7 bd24.7 ag1.5601.807 a
Q6724.7 h16.3 dg1.3601.817 a
Q7666.6 de29.6 ad2.1631.517 ac
Q8144.2 fg27.5 ae1.7731.757 a
Q8295.2 a30.1 ac1.0671.753 a
Q12233.8 gh13.1 fg1.5271.747 a
Q12485.8 ab27.9 ad1.7731.893 a
Q12628.6 gh20.8 ag1.1871.717 a
Level of significance
******ns***
The different letters followed by values in the same column indicate differences among treatments according to Tukey’s HSD. Values are mean (n = 3), F-test significant at ***: (p < 0.001), ns: not significant. Standard check variety—UAFQ7*.
Table 4. Plant biomass (PB: g), main panicle length (MPL: cm), and yield (MPGY: g), thousand grain weight (1000 GW: g), harvest index (HI), and germination percentage (GP: %) of 23 quinoa genotypes recorded at the end of the experiment.
GenotypesPB
(g)
MPL
(cm)
MPGY
(g)
1000 GW
(g)
HI
(-)
GP
(%)
Q4174.7 bd31.7 bd71.8 ab0.567 ab0.576 ac72.0 j
Q6172.9 be34.0 bd67.9 b0.467 ab0.515 ad98.0 ab
Q9195.9 ab26.0 d54.5 c0.400 b0.408 cf84.0 hi
Q11216.3 a34.0 bd80.8 a0.533 ab0.610 ab94.0 cd
Q15193.8 ac29.0 cd52.9 cd0.467 ab0.415 cf100.0 a
UAFQ7*158.3 df35.3 bd49.6 ce0.467 ab0.388 dg86.0 gh
Q22177.4 bd31.3 bd46.5 cg0.467 ab0.319 eg90.0 ef
Q24156.4 dg26.3 d39.9 ei0.500 ab0.672 a100.0 a
Q27135.7 ei27.0 d43.7 dh0.500 ab0.504 ad88.0 fg
Q30168.4 df34.7 bd39.2 fi0.500 ab0.444 be96.0 bc
Q45153.7 dh35.3 bd31.9 ik0.367 b0.458 be96.0 bc
Q50141.1 dh39.7 ab7.2 m0.433 ab0.102 h84.0 hi
Q5198.9 ij46.3 a23.8 kl0.400 b0.283 eg98.0 ab
Q5298.9 ij38.3 ac13.8 lm0.467 ab0.220 gh92.0 de
Q56100.4 ij35.3 bd11.3 m0.533 ab0.242 fh94.0 cd
Q6273.4 jk32.0 bd5.4 m0.500 ab0.260 fh88.0 fg
Q6736.7 kl28.0 d7.7 m0.333 b0.523 ad82.0 i
Q76104.7 jk35.7 bd39.9 ei0.400 b0.571 ac92.0 de
Q81130.6 fi28.0 d34.8 hj0.367 b0.363 dg98.0 ab
Q82140.1 dh31.7 bd37.4 gi0.433 ab0.364 dg100.0 a
Q12219.4 l28.3 bd4.6 m0.467 ab0.383 dg82.0 i
Q124116.1 hi38.3 ac26.2 jk0.467 ab0.316 eg94.0 cd
Q126120.1 gi29.0 cd47.9 cf 0.733 a0.655 a 96.0 bc
Level of significance
****************
The different letters followed by values in the same column indicate differences among treatments according to Tukey’s HSD. Values are mean (n = 3), F-test significant at *: (p < 0.05), ***: (p < 0.001). Standard check variety—UAFQ7*.
Table 5. Details of elite quinoa genotypes used in the experiment previously imported from USDA.
Genotypes Local CodingOrigin
Q4United States, New Mexico
Q6United States, New Mexico
Q9United States, New Mexico
Q11United States, New Mexico
Q15United States, New Mexico
UAFQ7*United States, New Mexico
(Approved quinoa variety in Pakistan)
Q22United States, New Mexico
Q24United States, New Mexico
Q27Bolivia
Q30United States, New Mexico
Q45Chile
Q50Bolivia, La Paz
Q51Bolivia, La Paz
Q52Bolivia, La Paz
Q56Peru
Q62Peru
Q67Peru
Q76Chile, Los Lagos
Q81Chile, Los Lagos
Q82Bolivia, Oruro
Q122Bolivia, La Paz
Q124Bolivia, La Paz
Q126United States, Colorado
* Standard check variety.
Table 6. Soil properties used in the experiment.
Soil PropertiesValue
pH6.8 to 7.3
Electric conductivity3.62–3.72 dS/m
Organic matter0.88–0.91%
Total Nitrogen0.07–0.08%
Exchangeable Potassium175–177 ppm
Available Phosphorous4.44–4.60 ppm
Table 7. Weather data during the course of the experiment.
MonthsTemperatureRelative
Humidity
Total
Rainfall
Sunshine
Radiation
Wind
Speed
Max.Min.Mean
°C°C°C%mmhkm/h
November 24.111.81884.61.53.71.9
December226.714.469.34.262.4
January21.55.513.575.906.43.5
February249.516.773.39.56.53.8
March32.216.423.861.412.58.65.2
April36.820.828.847.37.99.13.1
May40.323.73229.821.68.63.4
Data were collected from Agriculture Metrological Cell, Department of Agronomy, University of Agriculture, Faisalabad, Pakistan.
Disclaimer/Publisher’s Note: The statements, opinions and data contained in all publications are solely those of the individual author(s) and contributor(s) and not of MDPI and/or the editor(s). MDPI and/or the editor(s) disclaim responsibility for any injury to people or property resulting from any ideas, methods, instructions or products referred to in the content.

