Article

Identification of the Glyceraldehyde-3-Phosphate Dehydrogenase (GeGAPDH) Gene Family in Gastrodia elata Revealing Its Response Characteristics to Low-Temperature and Pathogen Stress

1
Hebei Key Laboratory of Crop Stress Biology, College of Agronomy and Biotechnology, Hebei Normal University of Science and Technology, Qinhuangdao 066000, China
2
Analysis and Testing Center, Hebei Normal University of Science and Technology, Qinhuangdao 066000, China
3
Shandong Engineering Research Center for Innovation and Application of General Technology for Separation of Natural Products, Shandong Analysis and Test Center, Qilu University of Technology, Jinan 250014, China
4
Key Laboratory for Natural Active Pharmaceutical Constituents Research in Universities of Shandong Province, School of Pharmaceutical Sciences, Qilu University of Technology, Jinan 250014, China
*
Authors to whom correspondence should be addressed.
Plants 2025, 14(12), 1866; https://doi.org/10.3390/plants14121866
Submission received: 10 February 2025 / Revised: 5 June 2025 / Accepted: 16 June 2025 / Published: 18 June 2025
(This article belongs to the Special Issue Bioinformatics and Functional Genomics in Modern Plant Science)

Abstract

:
The glyceraldehyde-3-phosphate dehydrogenase (GAPDH) gene plays a pivotal role in the glycolysis/gluconeogenesis process, contributing significantly to glycosyl donor synthesis, plant growth and development, and stress responses. Gastrodia elata Bl., a heterotrophic plant in the Orchidaceae family, has its dried tubers used as the traditional Chinese medicine. This study identified three GeGAPDH genes in G. elata, all encoding basic, stable, hydrophilic proteins. Phylogenetic analysis and subcellular localization predictions categorized GeGAPDH1 as a plastid subtype, while GeGAPDH2 and GeGAPDH3 were classified as cytoplasmic subtypes. Prokaryotic expression experiments demonstrated successful expression of the GeGAPDH1 protein in Escherichia coli, which exhibited significant GAPDH enzymatic activity. Subcellular localization experiments showed that GeGAPDH1 was localized in the plastid. Expression analysis indicated that the three GeGAPDH genes were predominantly expressed in tubers. Under low-temperature stress, although the total GAPDH enzyme activity in tubers did not change significantly, the expression of GeGAPDH1 was significantly up-regulated, while GeGAPDH2 and GeGAPDH3 were significantly down-regulated. This suggests that different subtypes of GeGAPDH may regulate cold resistance through different pathways. Upon pathogen infection, the GeGAPDH gene family exhibited pathogen-specific regulatory patterns. During infection by Fusarium oxysporum, both the expression levels of all three GeGAPDH genes and the total GAPDH enzyme activity in tubers increased significantly; however, F. solani infection induced a significant increase in total GAPDH enzyme activity without significant changes in gene expression. These results suggest that the GeGAPDH gene family may respond to different pathogen infections through transcriptional or translational regulation mechanisms. This study systematically identified and characterized the GeGAPDH gene family in G. elata, providing a theoretical foundation for understanding the functional differentiation of GAPDH in heterotrophic plants.

1. Introduction

Gastrodia elata Bl. is a heterotrophic perennial herb that forms a symbiotic relationship with fungi belonging to the genus Gastrodia in the Orchidaceae family. Its dried tubers are a traditional Chinese medicinal resource with significant pharmacological and economic importance. Modern pharmacological studies have demonstrated that G. elata exhibits various therapeutic effects, including anticonvulsant, antiseizure, sleep-improving, memory-enhancing, antidepressant, and anti-aging properties [1,2,3,4]. These findings indicate its broad application potential in pharmaceuticals, health supplements, and cosmetics. The primary active components of G. elata include gastrodin, parishins, and polysaccharides, which play crucial roles in antioxidation, anti-aging, neuroprotection, and immune regulation [5,6,7,8]. However, during cultivation, G. elata is often subjected to various biotic and abiotic stresses, which adversely affect both its yield and quality. For instance, prolonged low-temperature stress can lead to the development of black spots and, in severe cases, lead to rot and necrosis [9]. Additionally, soil-pose fungal diseases are significant threats to G. elata cultivation, including brown rot, black rot, rust rot, and white silk disease, all caused by pathogenic fungi [10,11,12]. Nevertheless, the molecular mechanisms underlying G. elata’s responses to various biotic and abiotic stresses remain poorly understood.
Glyceraldehyde-3-phosphate dehydrogenase (GAPDH) [EC: 1.2.1.12] is one of the key enzymes involved in glycolysis/gluconeogenesis and carbon fixation in the Calvin-Benson cycle. In animals, GAPDH is highly conserved, with only one subtype identified [13]. In contrast, plants exhibit multiple GAPDH subtypes with distinct cellular compartmentalization. For example, Arabidopsis thaliana contains two cytosolic subtypes, GAPC1/GAPC2 [14], three chloroplast subtypes, GAPA1/GAPA2/GAPB [15], two plastid subtypes, GAPCp1/GAPCp2 [16], and the non-phosphorylating, NADP-dependent GAPN [17]. GAPC and GAPN are involved in glycolysis [18], GAPA/B is involved in carbon fixation by the Calvin-Benson cycle [19], and GAPCp operates in the plastid glycolytic pathway [16]. GAPDH typically exists as a tetramer, with its subunits being highly conserved, containing two critical domains, Gp_dh_N and Gp_dh_C [20]. Moreover, many conserved amino acids may undergo post-translational modifications such as acetylation, phosphorylation, succinylation, or ubiquitination [21]. Although the GAPDH gene family has been extensively studied in green plants, its subcellular classification and functional differentiation may vary across species. In heterotrophic plants lacking chloroplasts, the loss of GAPA/B subtypes involved in the gluconeogenesis pathway may be compensated by other GAPDH subtypes. G. elata depends on Armillaria mellea for carbon supply, suggesting that its gluconeogenesis pathway may be different from that of photosynthetic plants.
To date, several plant GAPDH genes have been successfully cloned and characterized, including those from A. thaliana [22], pepper [23], tomato [24], maize [25], Codonopsis pilosula [26], and Panax notoginseng [27]. GAPDH is regarded not only as a model gene for studying enzyme structure and activity but also as an important reference gene for analyzing relative expression levels [28]. Additionally, research has shown that GAPDH genes play crucial roles in plant growth and development, as well as in responses to abiotic stresses. For example, overexpression of the watermelon gene ClGAPC2 and the soybean gene GmGAPDH14 significantly enhances salt tolerance [29,30]. The wheat gene TaGAPCp1 is involved in drought stress regulation [31], and the plastid GAPDH in A. thaliana participates in abscisic acid signaling, thereby influencing seed germination and plant growth [32]. Furthermore, GAPDH genes also play important roles in plant responses to biotic stresses. When exposed to the pathogen Pseudomonas syringae, A. thaliana AtGAPA, AtGAPC, and AtGAPCp regulate the accumulation of reactive oxygen species and cell death, negatively modulating disease resistance [13]; Cassava MeGAPC is considered a negative regulator of plant disease resistance, inhibiting autophagic activity through interactions with autophagy-related proteins [33]. Additionally, the Brassica napus genes BnaGAPDH17, BnaGAPDH20, BnaGAPDH21, and BnaGAPDH22 exhibit sensitivity to infections by Sclerotinia sclerotiorum [34]. However, the expression patterns of the GAPDH genes in G. elata under various growth processes and stress conditions remain unclear.
As a heterotrophic plant, G. elata lacks photosynthetic carbon fixation capacity. Instead, it fully compensates for this deficiency by acquiring carbon from symbiotic fungi to support germination and growth [35]. This difference in carbon acquisition likely leads to evolutionary adaptations in glucose metabolism, especially gluconeogenesis, which may be different from that of photosynthetic plants. Although the role of GAPDH in plant glucose metabolism and stress response has been extensively studied, the functional differentiation of GAPDH in heterotrophic plants remains unclear. In this study, we systematically identified the GeGAPDH gene family in G. elata and comprehensively analyzed the structural characteristics, classification, subcellular localization and enzyme activity of GeGAPDH genes. In addition, we investigated the response patterns of GeGAPDH genes to both biotic and abiotic stresses through analyses of cis-acting elements, gene expression patterns, and enzyme activity assessments. This study reveals the functional differentiation and stress response patterns of GAPDH subtypes in the heterotrophic plant G. elata, providing new insights for understanding the function and stress adaptation of GAPDH genes in symbiotic plants.

2. Results

2.1. Identification and Physicochemical Characterization of the GeGAPDH Family

Through comparative analysis of homologous sequences of the GAPDH gene in A. thaliana and examination of conserved domains (Gp_dh_N and Gp_dh_C), we identified three GAPDH genes in the G. elata genome (Table S1). Based on their chromosomal distribution, these genes were designated as GeGAPDH1, GeGAPDH2, and GeGAPDH3, with GeGAPDH2 and GeGAPDH3 sharing identical amino acid sequences. Prediction of the physicochemical properties of the amino acid sequences encoded by these three genes revealed that their lengths range from 344 to 428 amino acids, molecular mass varies between 37,088.64 and 45,867.0 Da, and isoelectric points are between 7.68 and 8.51, indicating that they are basic proteins. The instability index ranged from 26.75 to 37.51, suggesting relatively high stability of these proteins within the cellular environment. The average hydrophilicity coefficient ranged from −0.01 to −0.106, with all values being negative, indicating that the GAPDH proteins from G. elata exhibit hydrophilic properties (Table 1). Subcellular localization predictions indicated that GeGAPDH1 is localized in plastids, while GeGAPDH2 and GeGAPDH3 are localized in the cytoplasm.

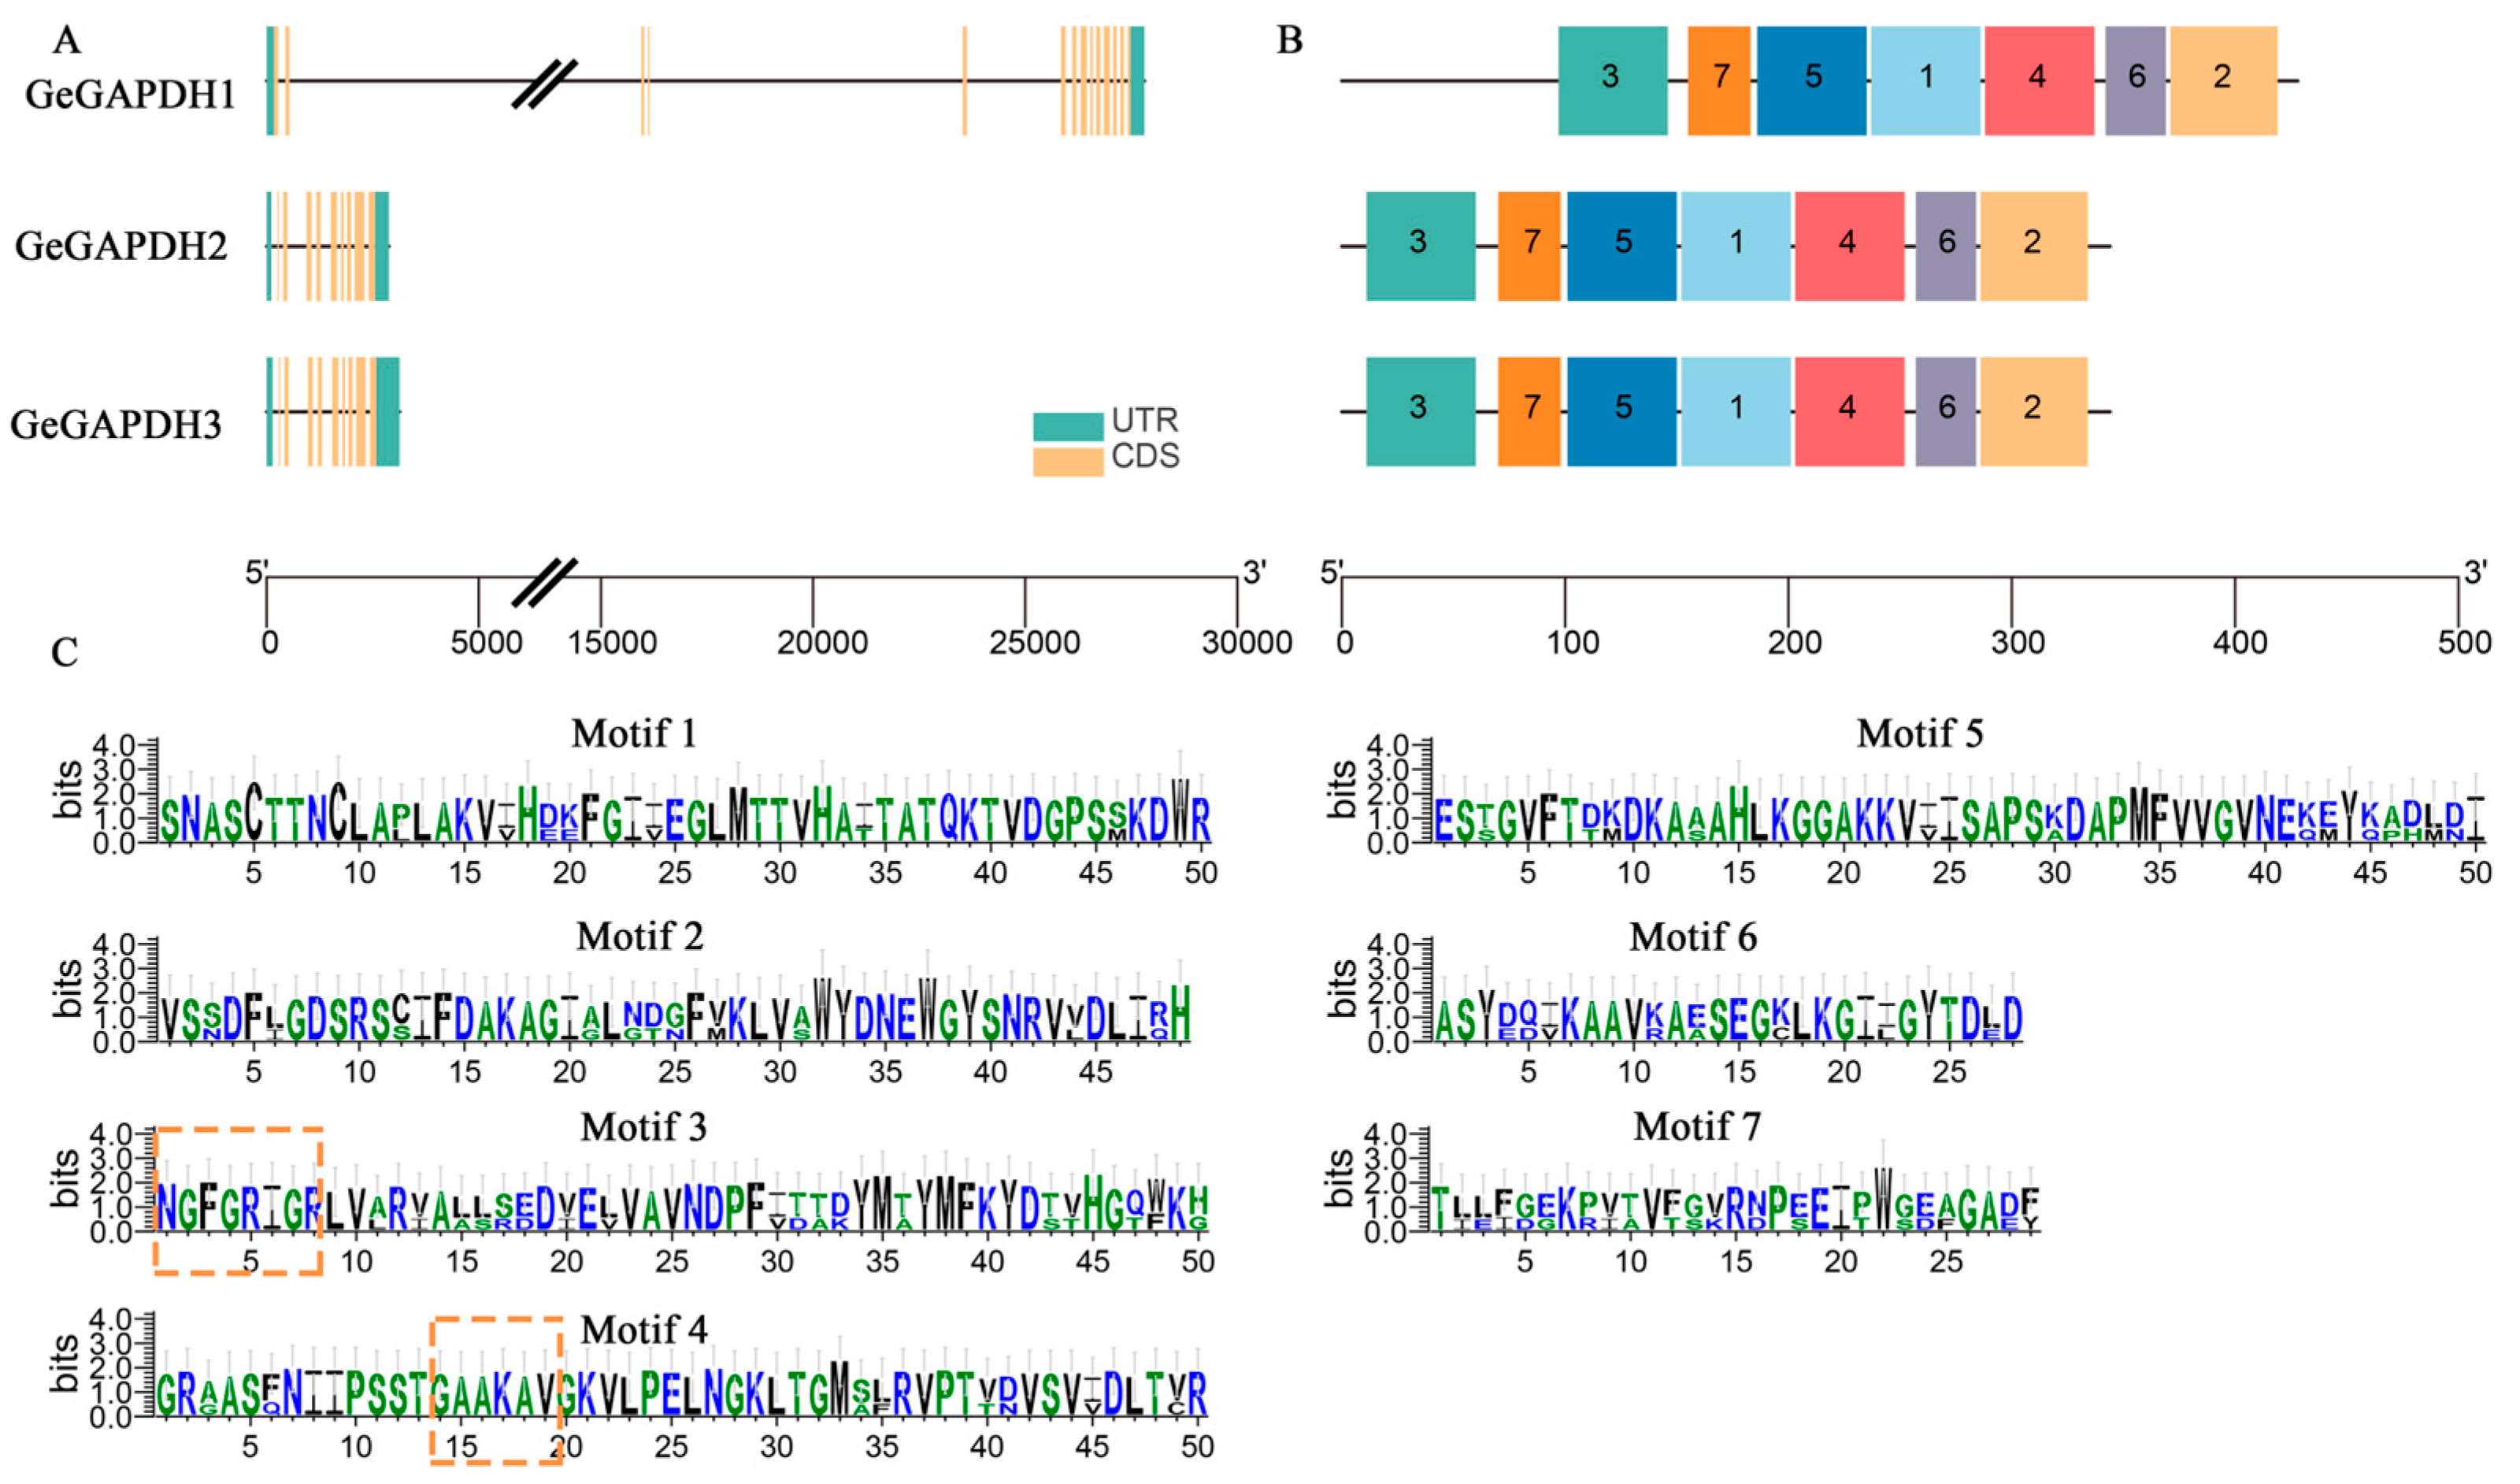
2.2. Gene Structure and Conserved Domain Analysis of the GeGAPDH Family

Gene structures analysis revealed that GeGAPDH1 consists of 13 introns and 14 exons, while GeGAPDH2 and GeGAPDH3 each contain 9 introns and 10 exons (Figure 1A). The analysis of conserved motifs in the amino acid sequences showed that all three GeGAPDH genes share seven conserved motifs (Figure 1B). Specifically, motifs 1, 2, 3, 4, and 5 consist of 50 amino acids each, while motifs 6 and 7 contain 28 and 29 amino acids, respectively. Motif 3 encompasses the Gp_dh_N domain (INGFGRIGR), and motif 4 contains the Gp_dh_C domain (GAAKAV) (Figure 1C). The high degree of similarity in gene structure and conserved domains between GeGAPDH2 and GeGAPDH3 suggests that the GAPDH genes in G. elata may have undergone gene duplication events.

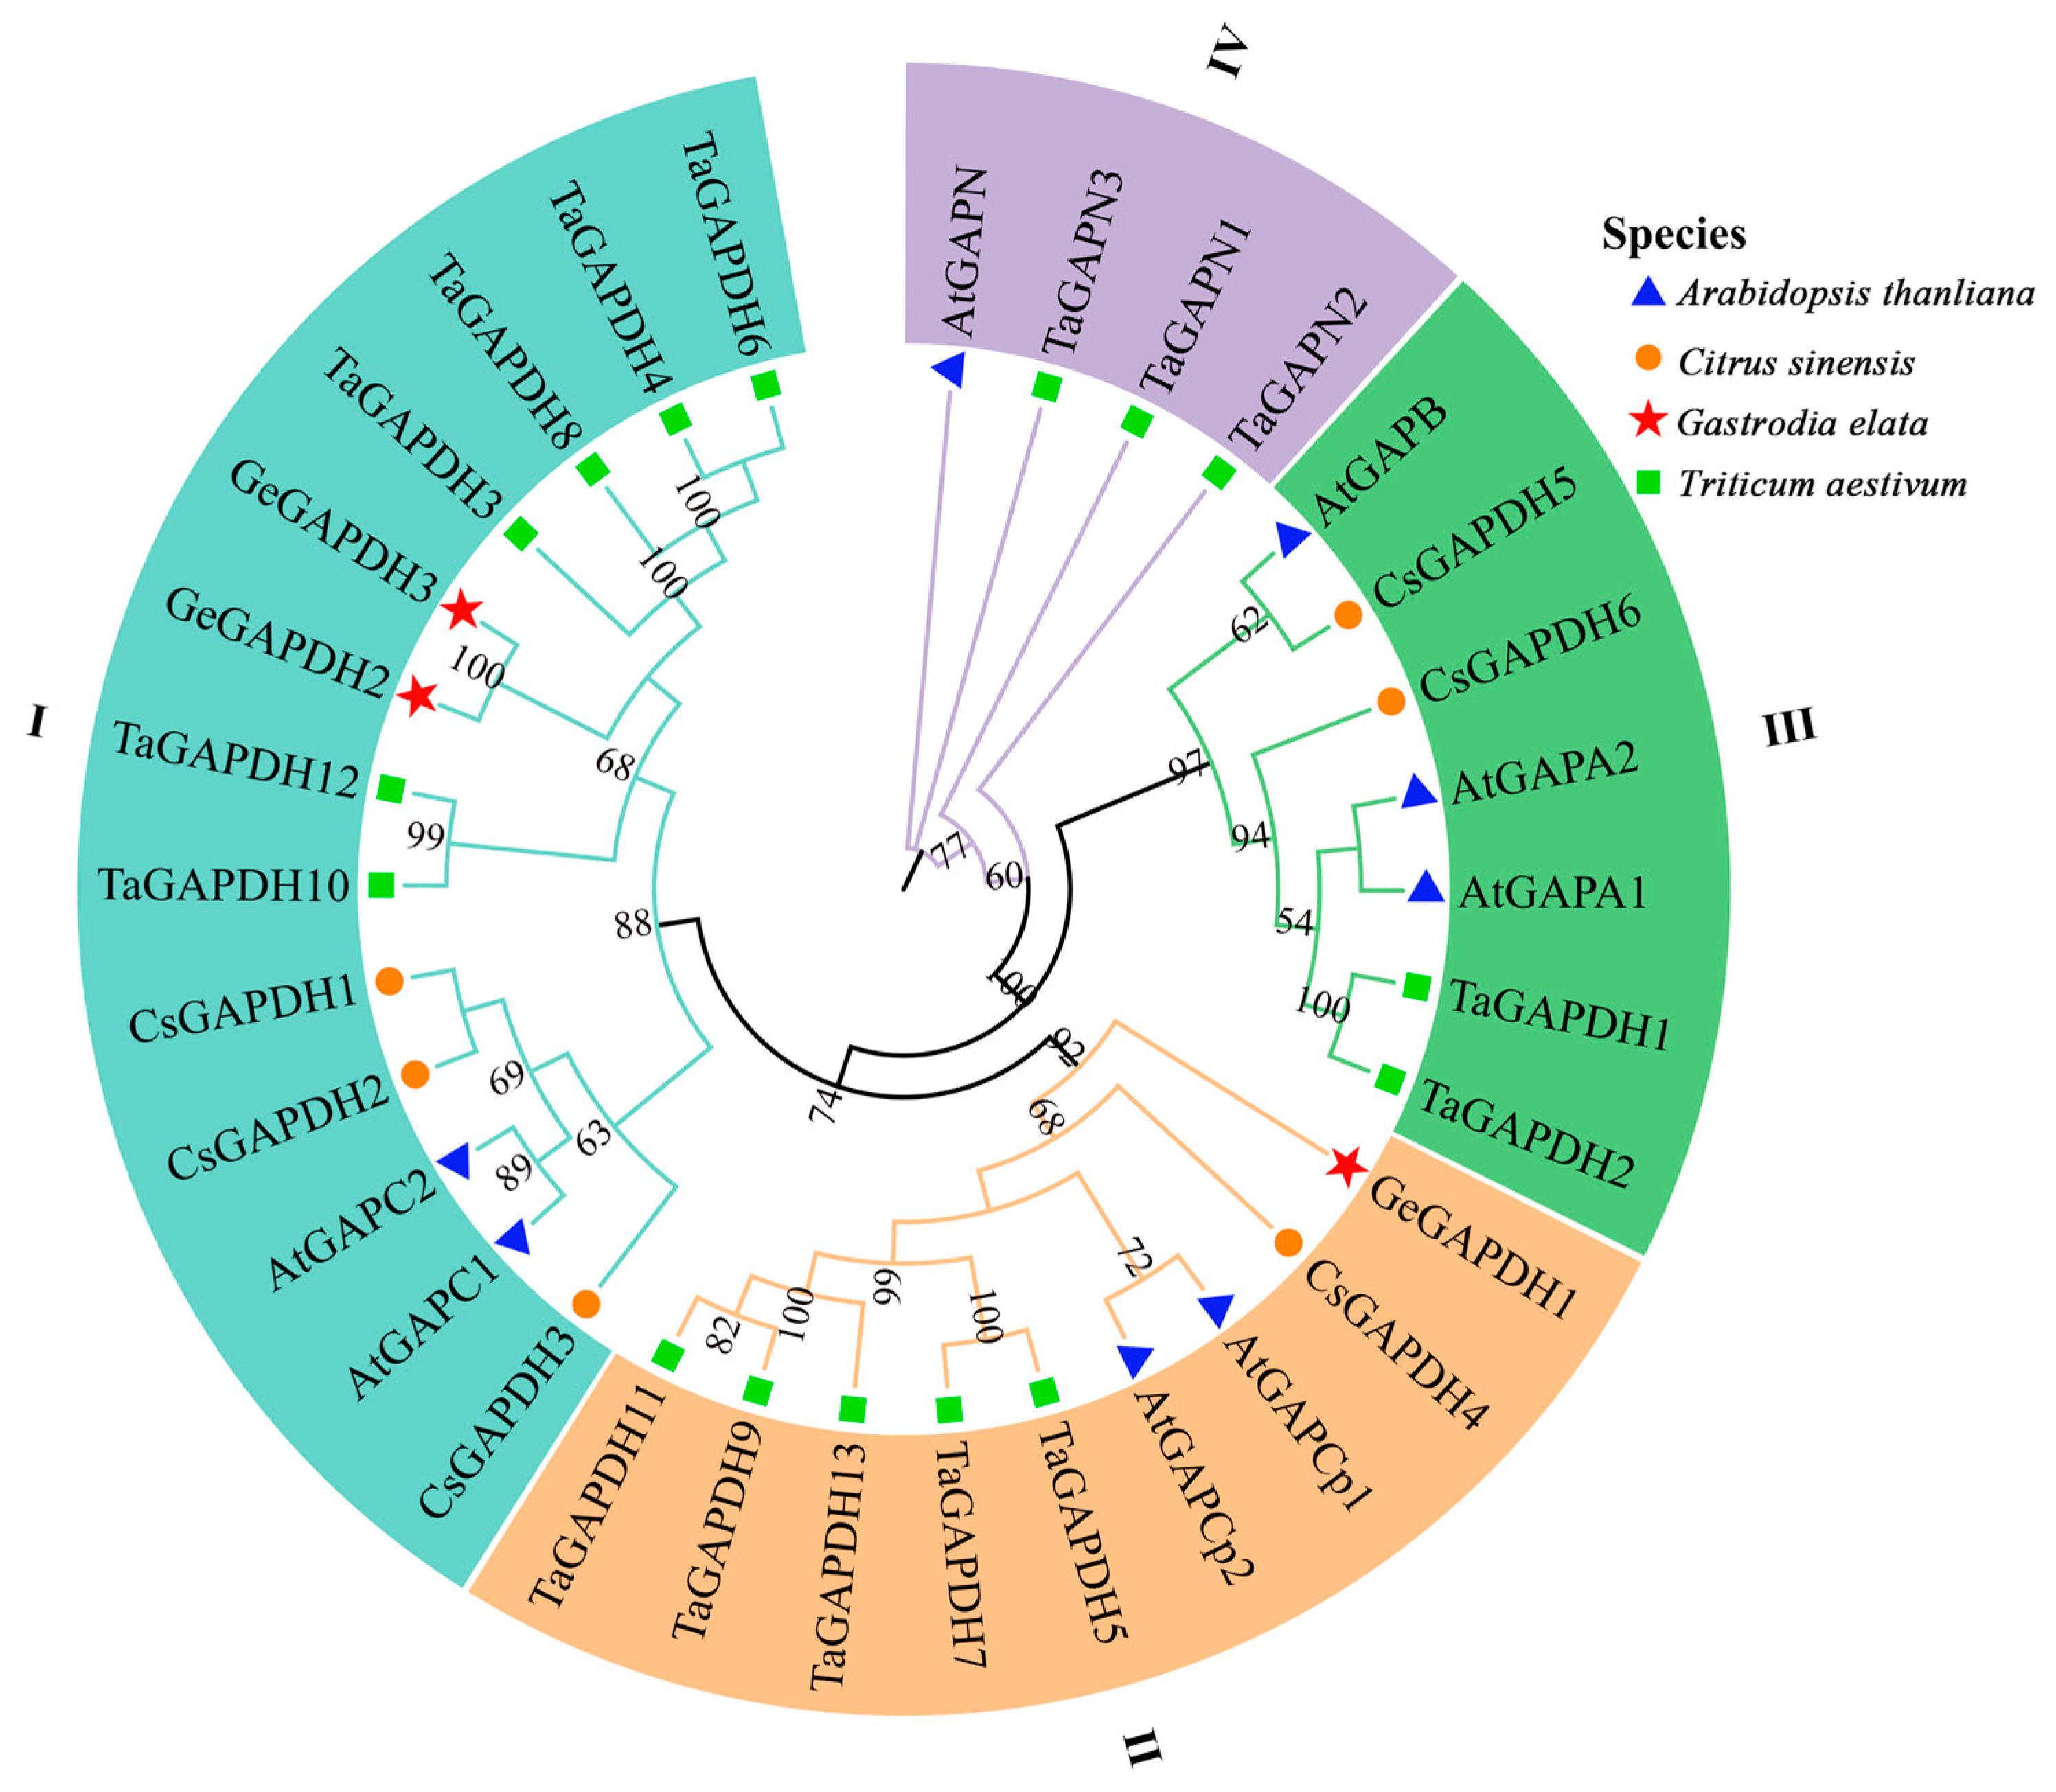
2.3. Phylogenetic Analysis of the GAPDH Family

To explore the phylogenetic relationships among GAPDH family proteins, a phylogenetic tree was constructed using three GeGAPDH proteins, six Citrus sinensis, and eight A. thaliana, and 16 Triticum aestivum GAPDH protein sequences [20,37]. The 33 GAPDH proteins were classified into four distinct subgroups, numbered in a counterclockwise manner. Notably, the clustering results are consistent with the previously reported phylogenetic analysis [20]. Furthermore, GAPDH proteins are typically divided into four functional subfamilies based on the established nomenclature and subcellular localization data of A. thaliana GAPDH. The classification of the four subgroups was determined (Figure 2): Subfamily I (GAPC), Subfamily II (GAPCp), Subfamily III (GAPA/B), and Subfamily IV (GAPN) [13,20]. Proteins in the same subgroup may perform similar functions. In G. elata, GeGAPDH1 was grouped into subfamily II, while GeGAPDH2 and GeGAPDH3 were clustered in subfamily I (Supplementary Materials Data S1, Figure 2). This classification is further supported by the conserved functional roles observed in homologous proteins across species. Based on phylogenetic relationships, it can be inferred that GeGAPDH1 is a member of the plastid subtype, whereas GeGAPDH2 and GeGAPDH3 belong to the cytosolic subtype.

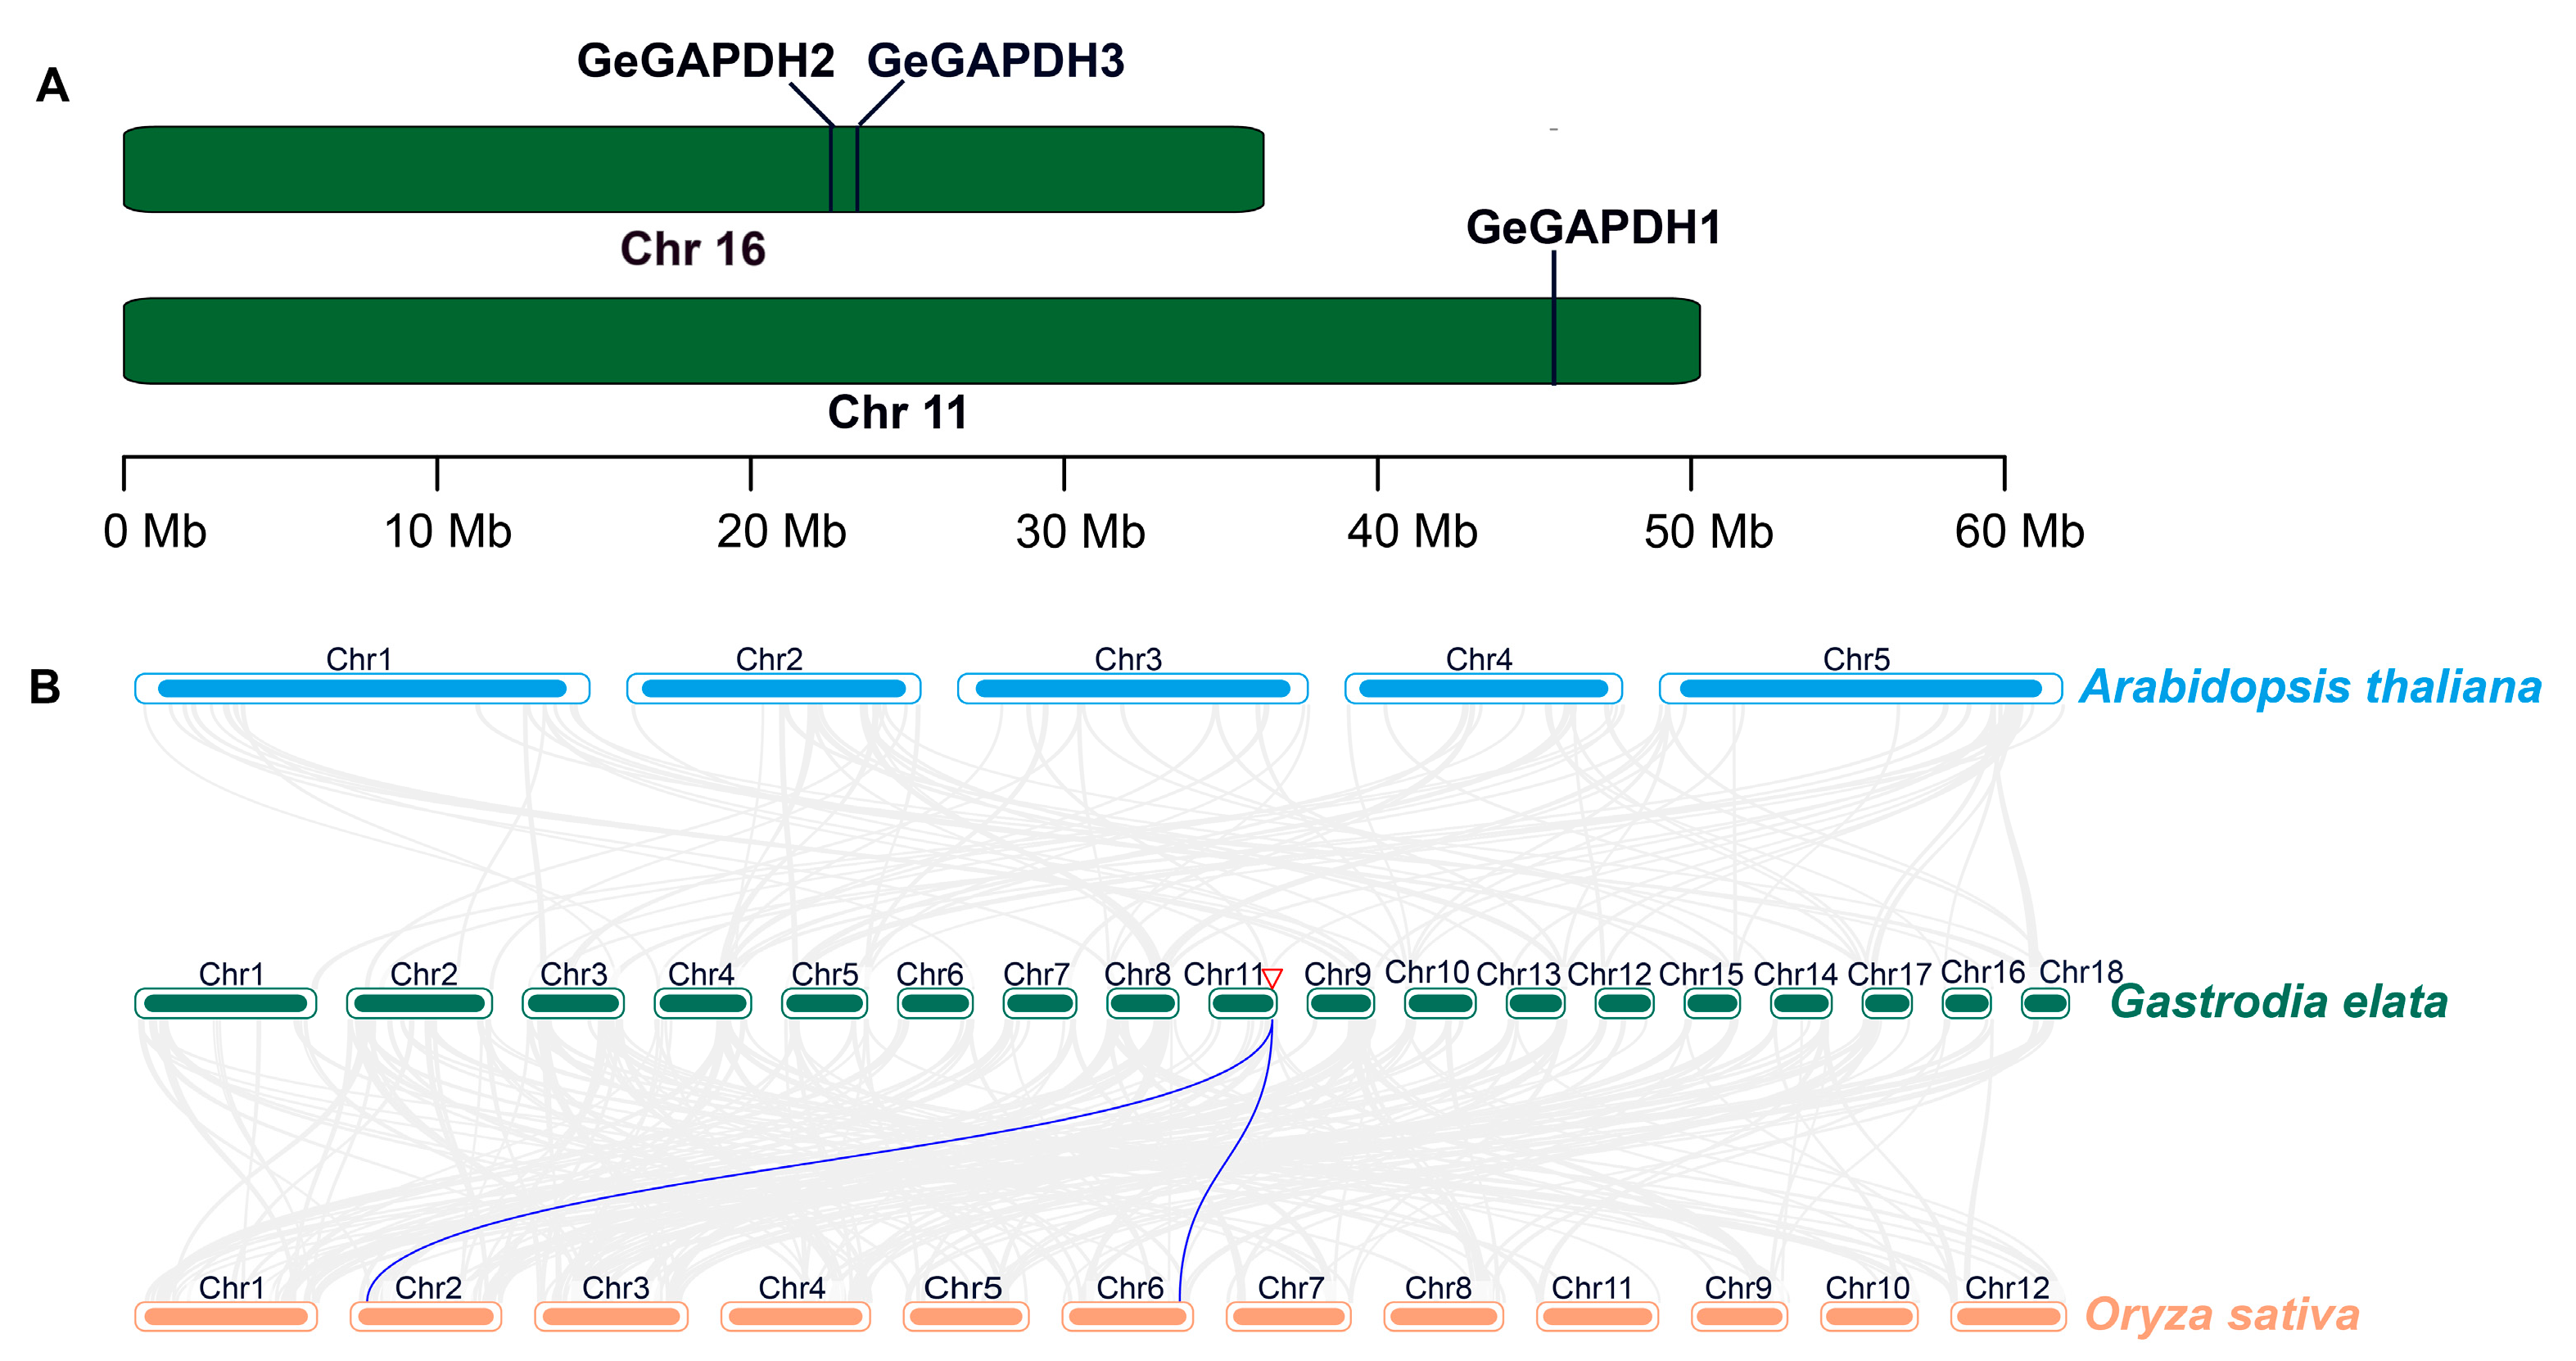
2.4. Chromosomal Localization and Collinearity Analysis of the GeGAPDH Family

Genomic annotation analysis enabled a chromosomal localization map for the GeGAPDH family genes (Figure 3A). The results indicated that the GeGAPDH genes are distributed across two chromosomes, with GeGAPDH1 located on chromosome 11 and GeGAPDH2 and GeGAPDH3 on chromosome 16. Additionally, collinearity analysis among the genomes of G. elata, A. thalian, and Oriza sativa revealed a high degree of collinearity between the GeGAPDH genes and the monocotyledonous plant O. sativa, while the collinearity with the dicotyledonous plant A. thalian was lower (Figure 3B). Notably, GeGAPDH1 exhibited duplication events with two O. sativa genes, suggesting a shared ancestral origin and potential functional similarities.

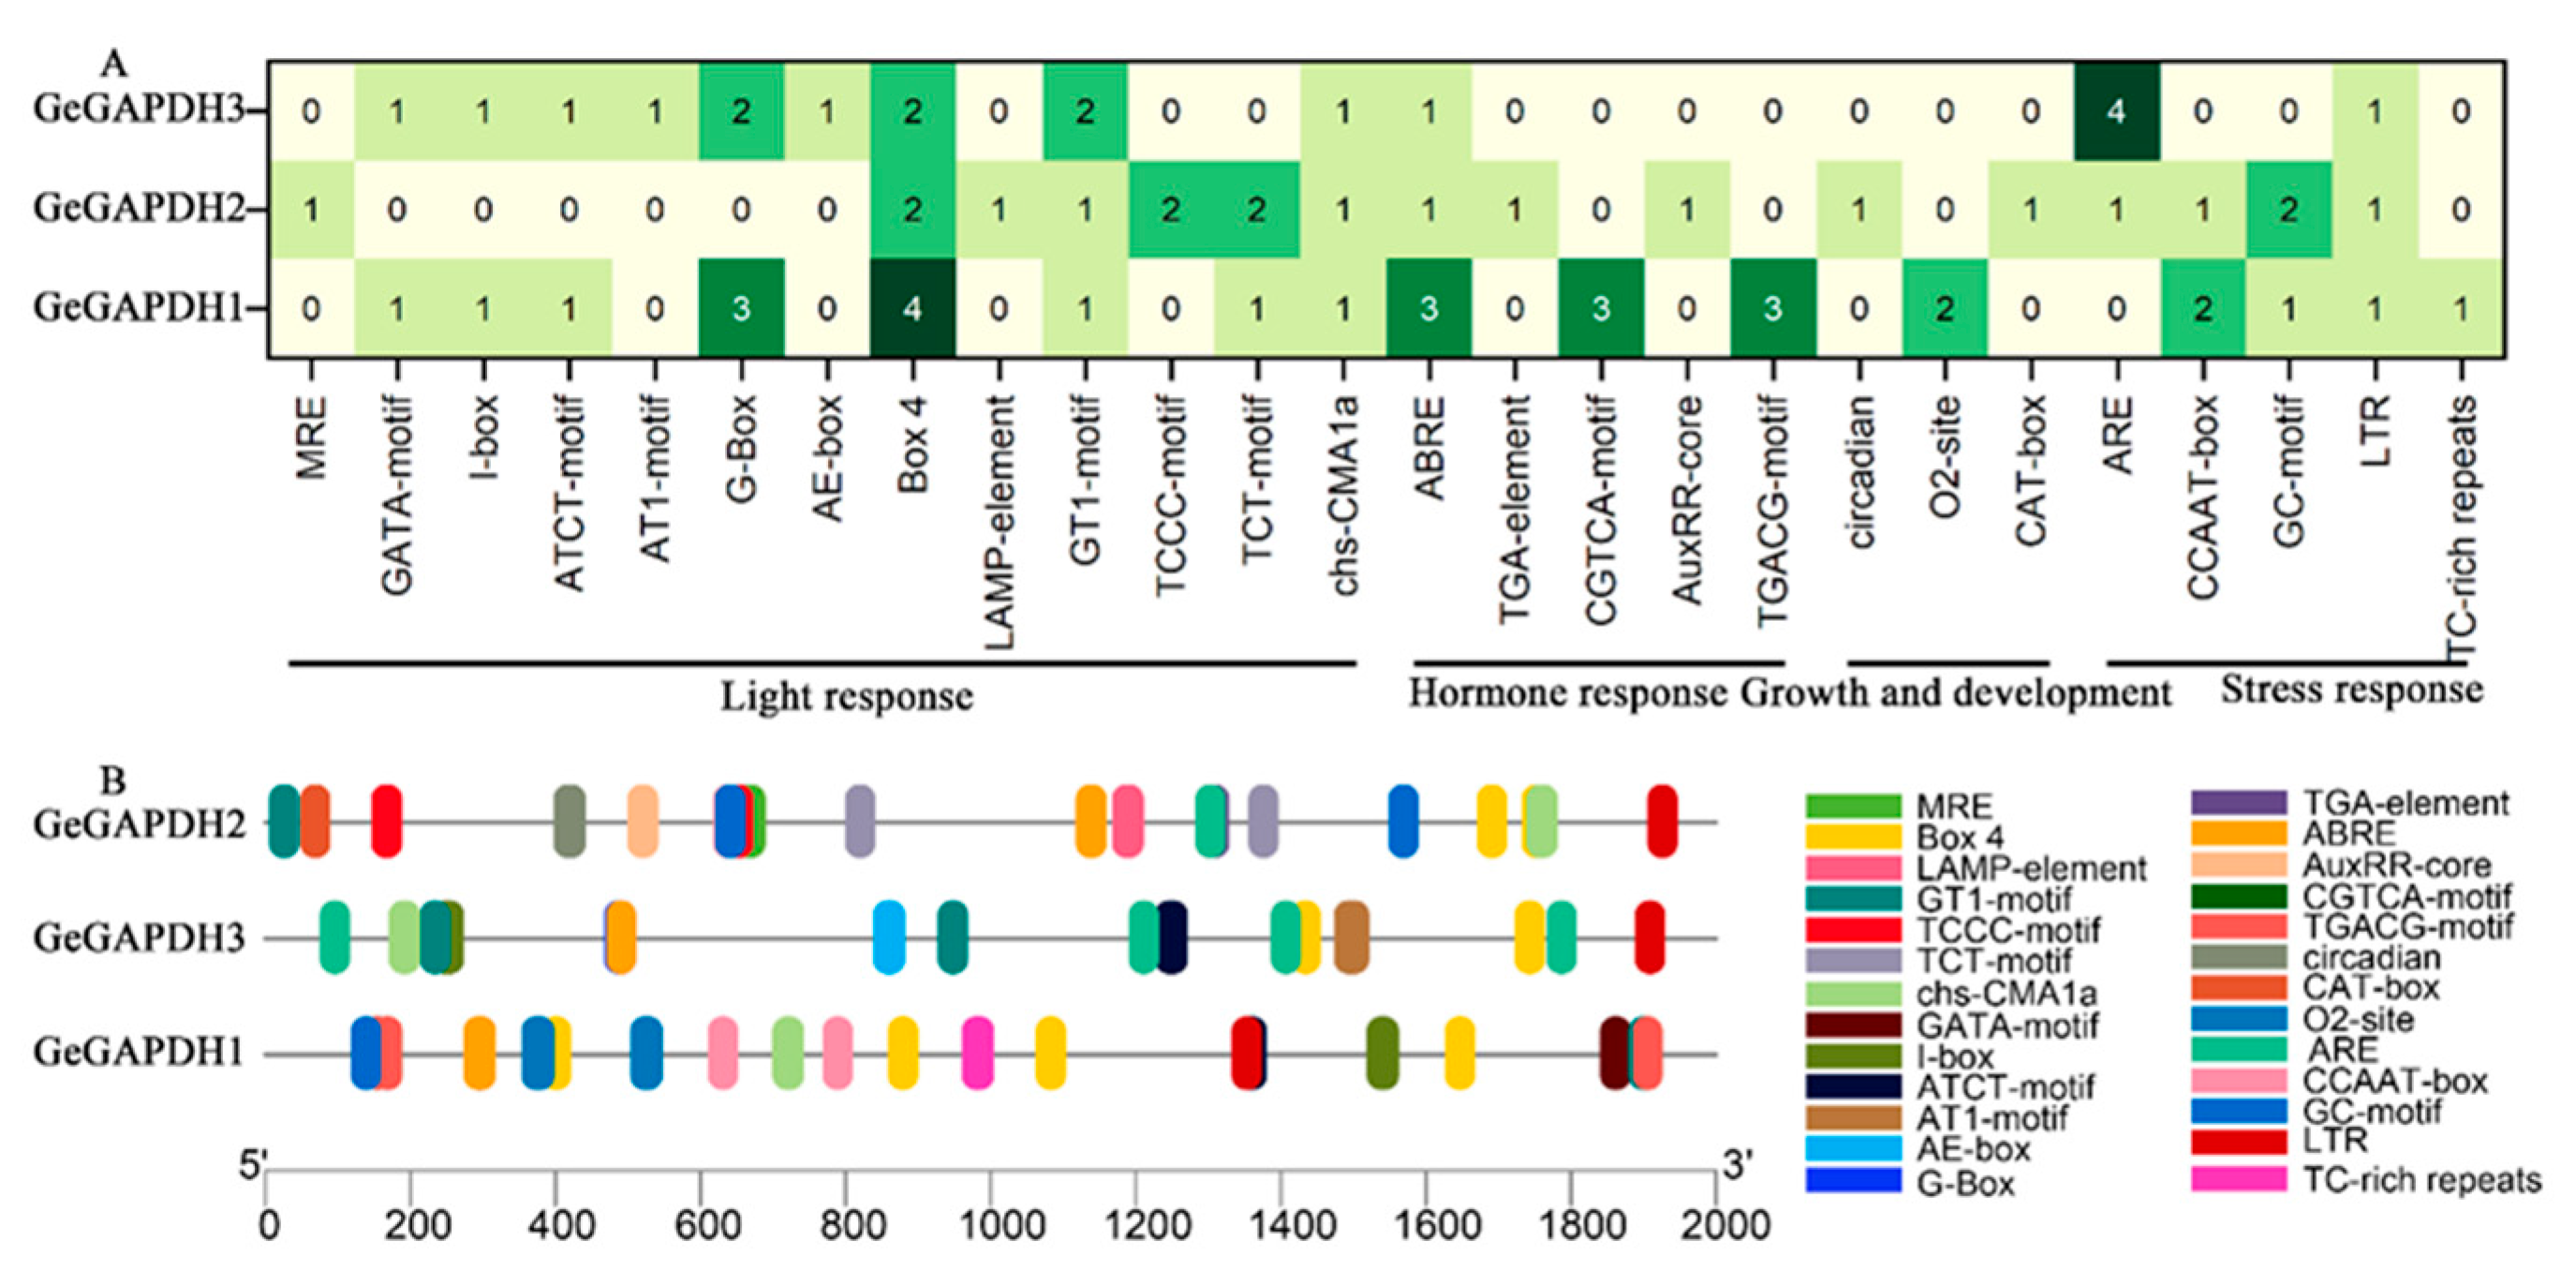
2.5. Cis-Acting Element Analysis of the GeGAPDH Family

Using PlantCARE (https://bioinformatics.psb.ugent.be/webtools/plantcare/html/, accessed on 23 November 2024), cis-acting elements in the upstream 2000 bp regions of all GeGAPDH genes were analyzed. The results revealed that the promoter regions of the three genes collectively contain 26 types of cis-acting elements. These elements were categorized based on their functions into four classes: light response, hormone response, plant growth and development, and stress response (Figure 4A). The promoter of GeGAPDH1 contains the highest number of cis-acting elements, totaling 29, with Box4 being the most abundant at four occurrences. The promoter of GeGAPDH2 and GeGAPDH3 contains 20 and 18 cis-acting elements, respectively, with ARE being the most prevalent at four occurrences. Despite GeGAPDH2 and GeGAPDH3 sharing identical amino acid sequences, differences in the types and distributions of cis-acting elements in their promoter regions suggest that their transcriptional regulation may be governed by distinct mechanisms (Figure 4B). Furthermore, six cis-acting elements were common to all three GeGAPDH genes, including the light-responsive element Box4, GT1-motif, and chs-CMA1a, as well as the phytohormone response element ABRE and the stress response element LTR. These results suggest that the GeGAPDH gene family may play regulatory roles in the growth and development of G. elata, as well as in responses to light, phytohormones, and stress.

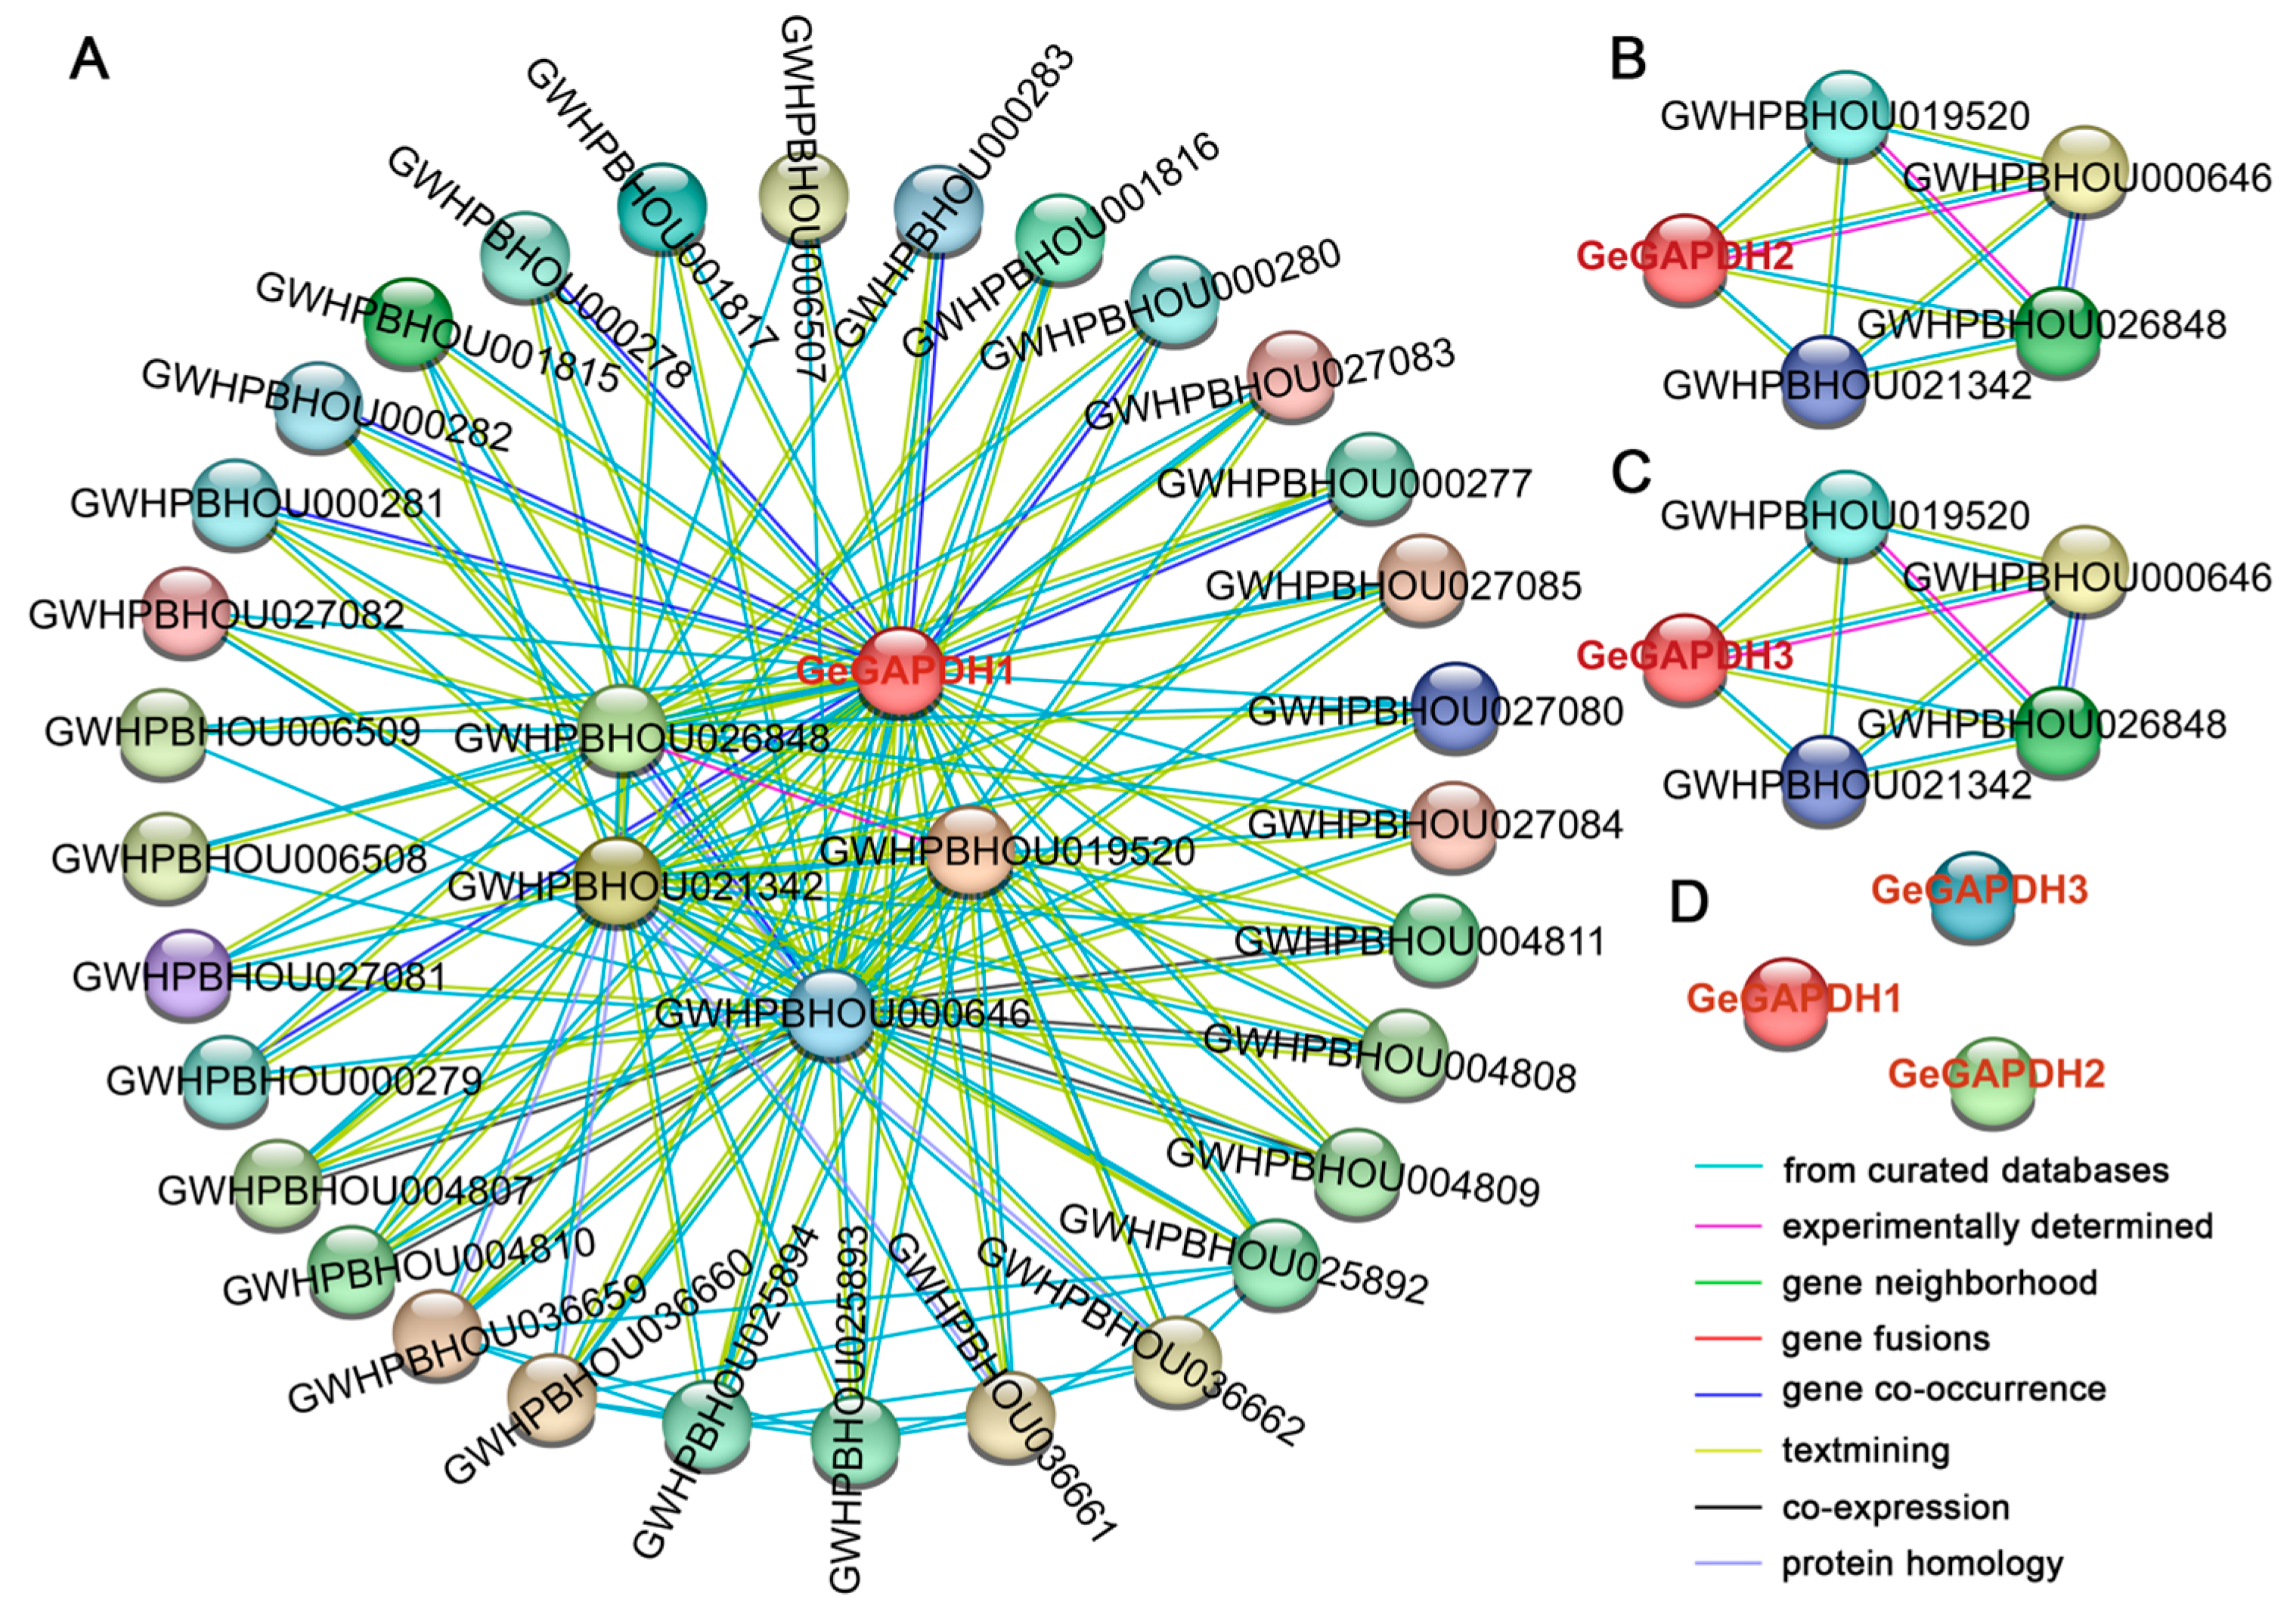
2.6. Interaction Analysis of GeGAPDH Proteins

Figure 5 presents the predicted protein-protein interaction (PPI) networks of three GeGAPDH proteins under the highest confidence parameters (interaction score ≥ 0.900). Among them, GeGAPDH1 exhibits an extensive interaction network with 35 target proteins, while GeGAPDH2 and GeGAPDH3 display a significantly narrower interaction network, each forming interactions with only 4 proteins. All four interacting proteins of GeGAPDH2 and GeGAPDH3 are encompassed within the broader interaction network of GeGAPDH1. Under these stringent confidence thresholds, no direct interactions were detected among the three GeGAPDH proteins, suggesting that they may function independently within distinct interaction networks or require specific conditions to form complexes.

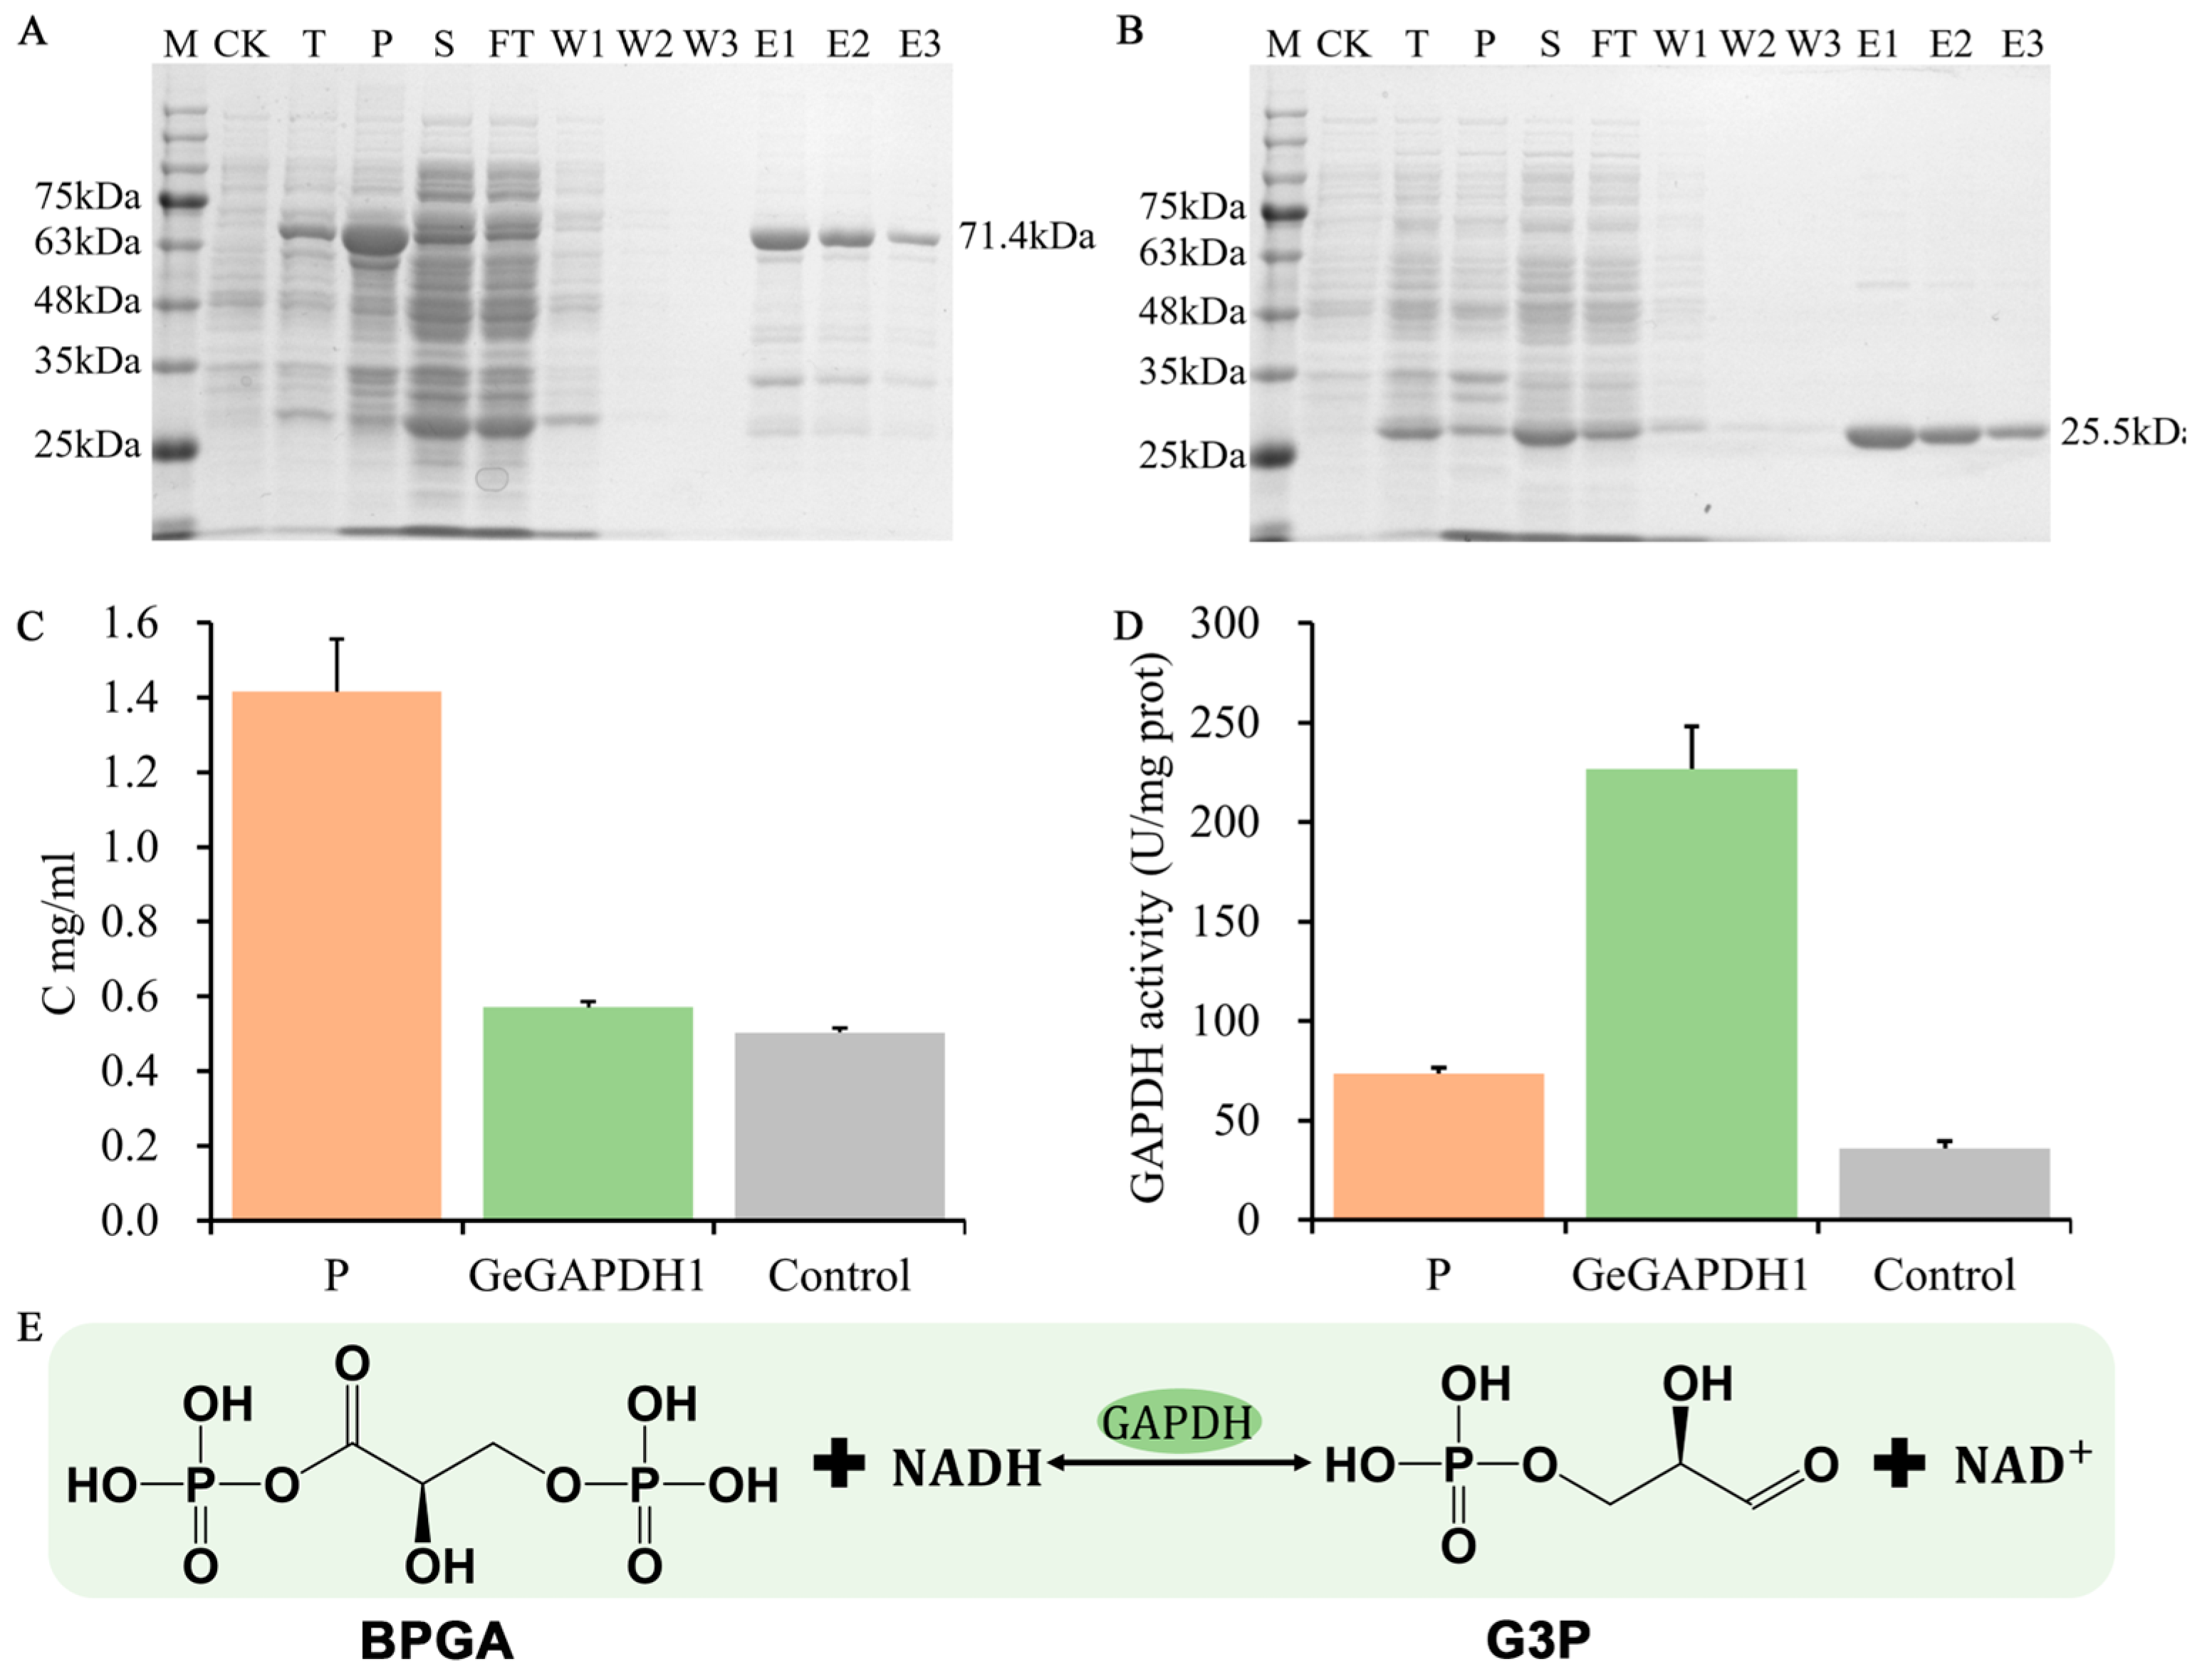
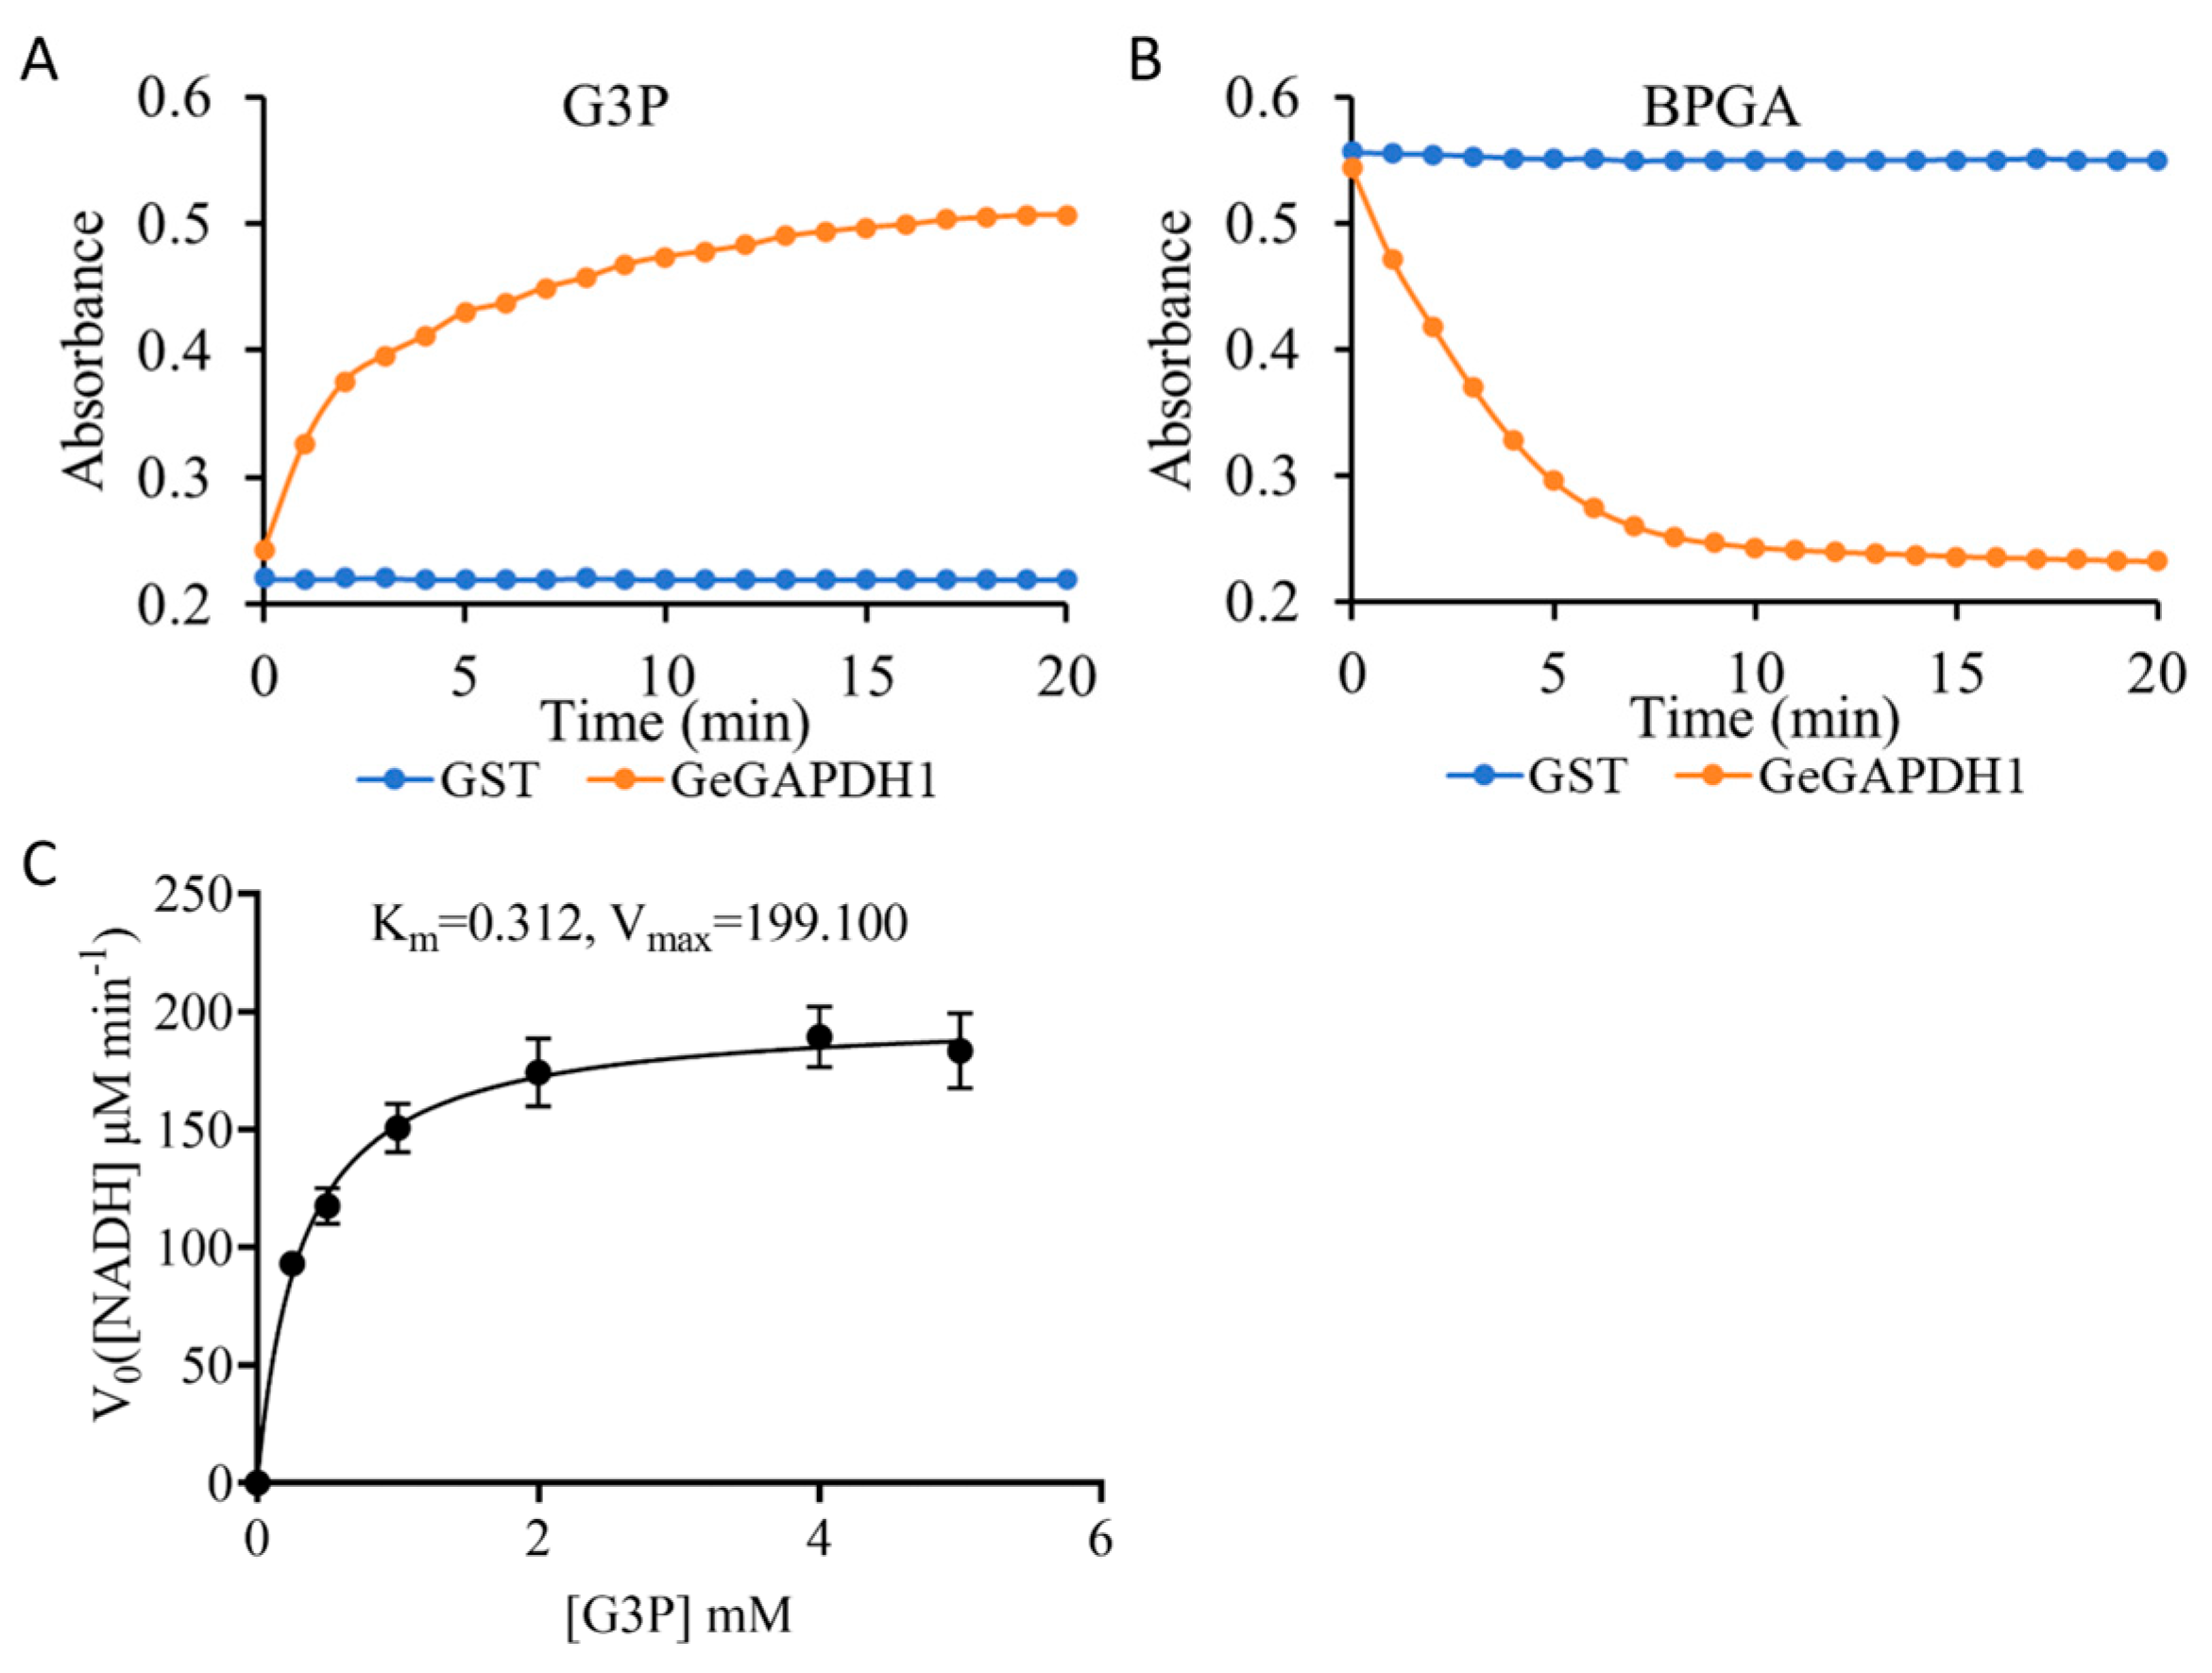
2.7. Enzyme Activity and Kinetics Detection of the GeGAPDH1

As a non-photosynthetic autotrophic plant, the gluconeogenesis process of G. elata may be different from that of photosynthetic plants. Thus, we selected the genes of plastid subtypes GeGAPDH1 for gene cloning and enzyme activity assay to analyze the potential function of GeGAPDH1 in gluconeogenesis. The GeGAPDH1 gene was successfully cloned. A comparison of the sequencing results with the reference genome showed that the GeGAPDH1 gene sequence contained synonymous mutations at the 101st (C-T) and 1535th (G-A) nucleotide positions, which did not alter the amino acid sequence (Figure 6 and Figure S1). Differences in sequences may be due to individual differences in species.
Subsequently, we constructed a recombinant plasmid by ligating the obtained GeGAPDH1 gene with the expression vector pGEX-4T-1 for protein expression in Escherichia coli. The predicted molecular mass of the recombinant GeGAPDH1 protein was 71.4 kDa, which corresponds to the sum of the predicted protein molecular mass (45.9 kDa) and the GST tag (25.5 kDa) (Figure 7A,B). SDS-PAGE analysis confirmed the successful expression and purification of the GeGAPDH1 protein, as indicated by the band corresponding to the predicted molecular mass of the protein.
In green plants, both GAPC and GAPCp subtypes involved in glycolysis are defined as phosphorylating because they all catalyze in vitro the phosphorylation of the substrate glyceraldehyde-3-phosphate (G3P) to 1,3-bisphosphoglyceric acid (BPGA). However, the physiological role of GAPA/B in the Calvin-Benson cycle is in the opposite direction, catalyzing the dephosphorylation of the substrate BPGA [38]. We measured the concentration of the total protein and purified proteins using the Bradford method (Figure 7C) and assessed GAPDH enzyme activity. The results indicated that the purified GeGAPDH1 protein exhibited significantly higher GAPDH enzyme activity compared to both the total protein and the control group (empty vector-expressed protein) (Figure 7D,E).
The bidirectional enzymatic assay showed that GeGAPDH1 possesses both NADH-producing and NADH-consuming capabilities, suggesting its bifunctional glyceraldehyde-3-phosphate dehydrogenase activity (Figure 8A,B). Kinetic analysis revealed that GeGAPDH1 exhibited a Km of 0.312 mM and Vmax of 199.100 μM NADH min−1 mg−1 (enzyme activity was defined as the production of 1 μM NADH per mg protein per minute) for its substrate G3P (Figure 8C). These kinetic parameters fall within the broad spectrum reported for GAPDH enzymes across different species [39].

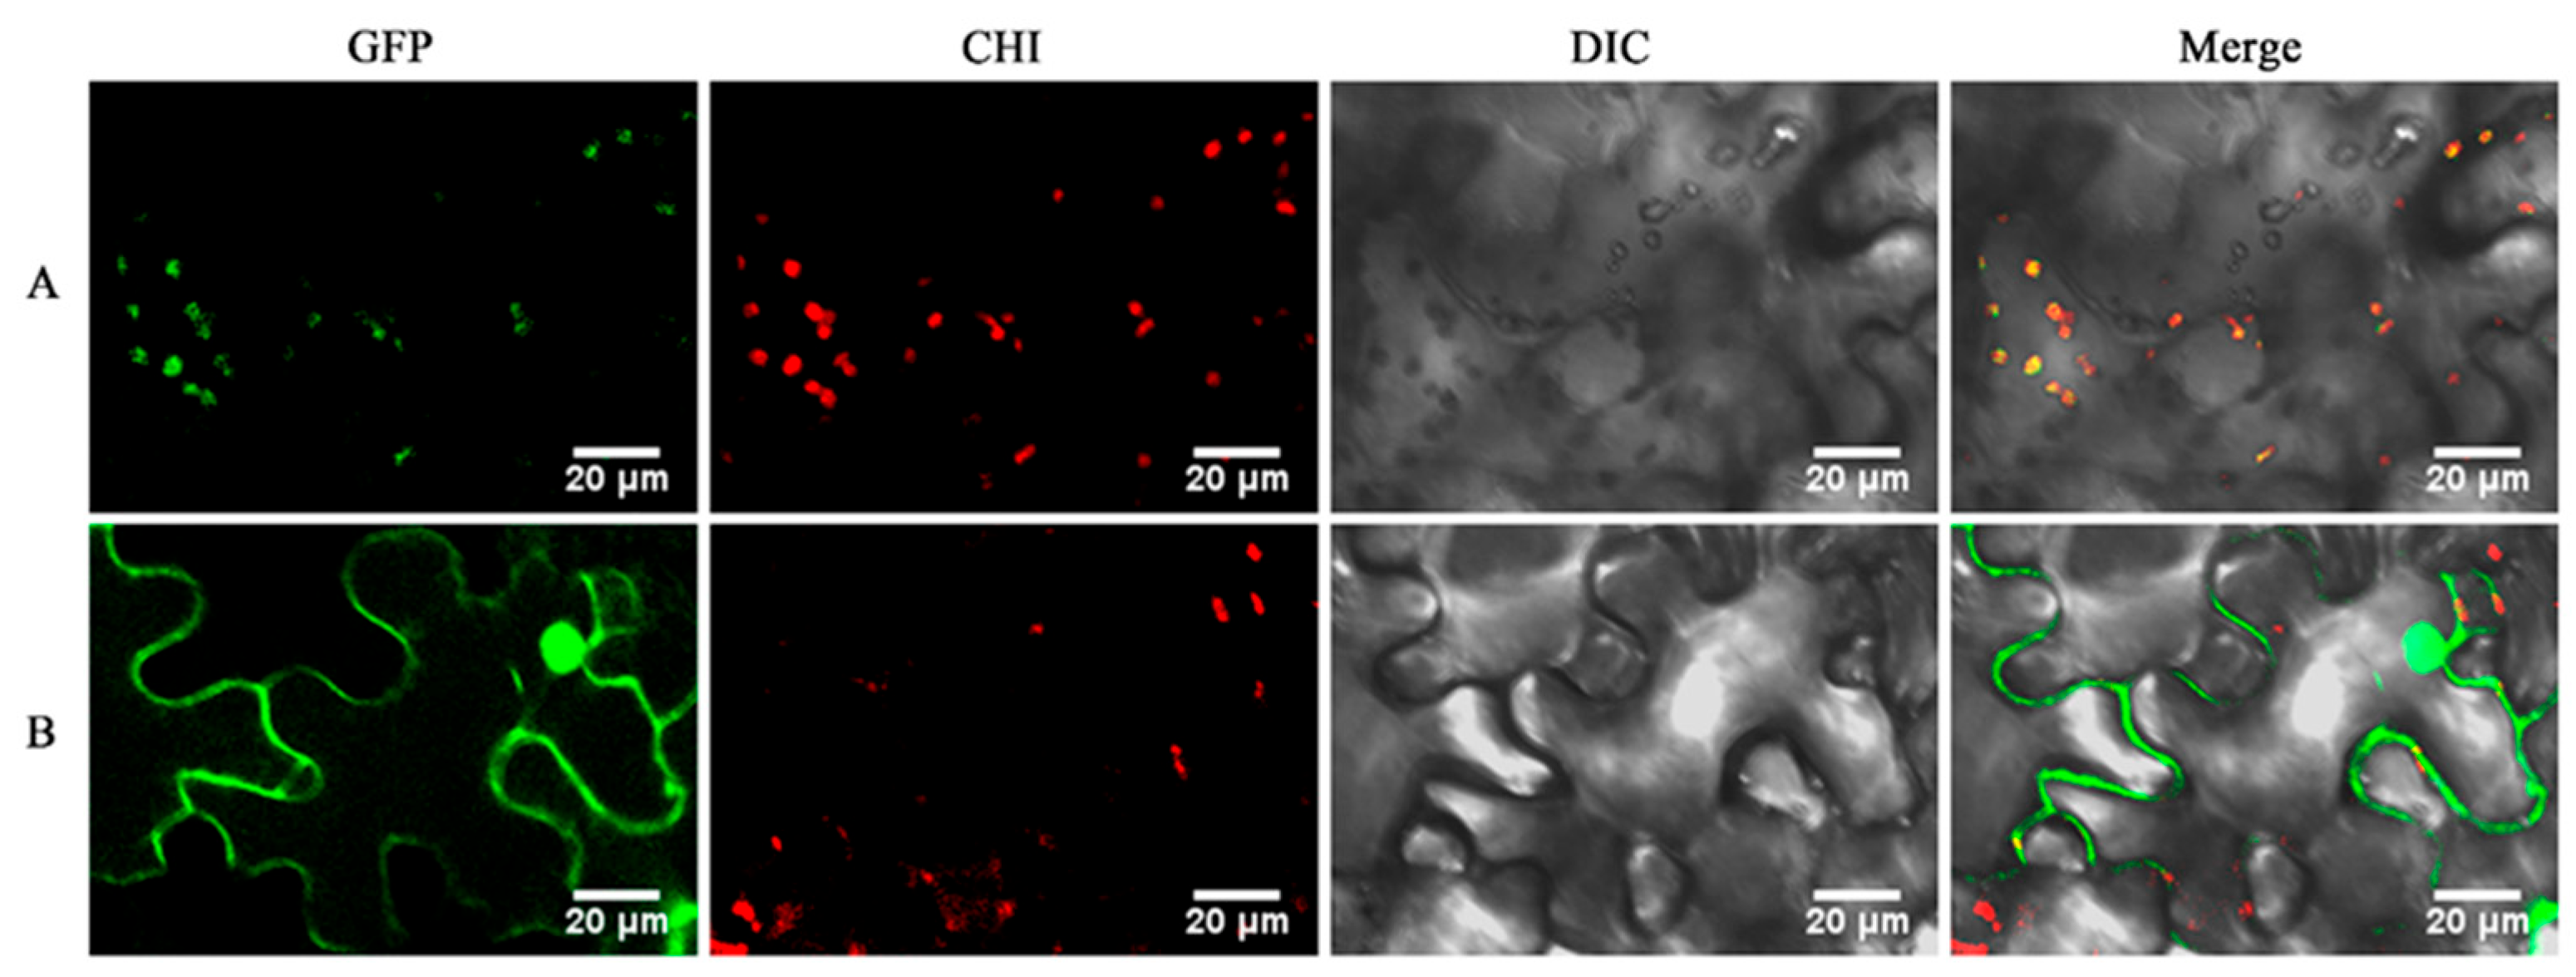
2.8. Subcellular Localization Analysis of GeGAPDH1

Subcellular localization analysis revealed that the fluorescence signal from the fusion vector pCAMBIA1300-35S-GeGAPDH1-EGFP was primarily localized in plastids, exhibiting strong colocalization with the chloroplast fluorescence signal in Nicotiana benthamiana leaves (Figure 9A). This observation confirms that the GeGAPDH1 protein is plastid-localized, which corroborates the predicted and phylogenetic results. In contrast, the signal from the empty vector pCAMBIA1300-35S-EGFP was observable throughout the cell, with green fluorescence predominantly in the nucleus and plasma membrane, along with weaker expression in the cytoplasm (Figure 9B).

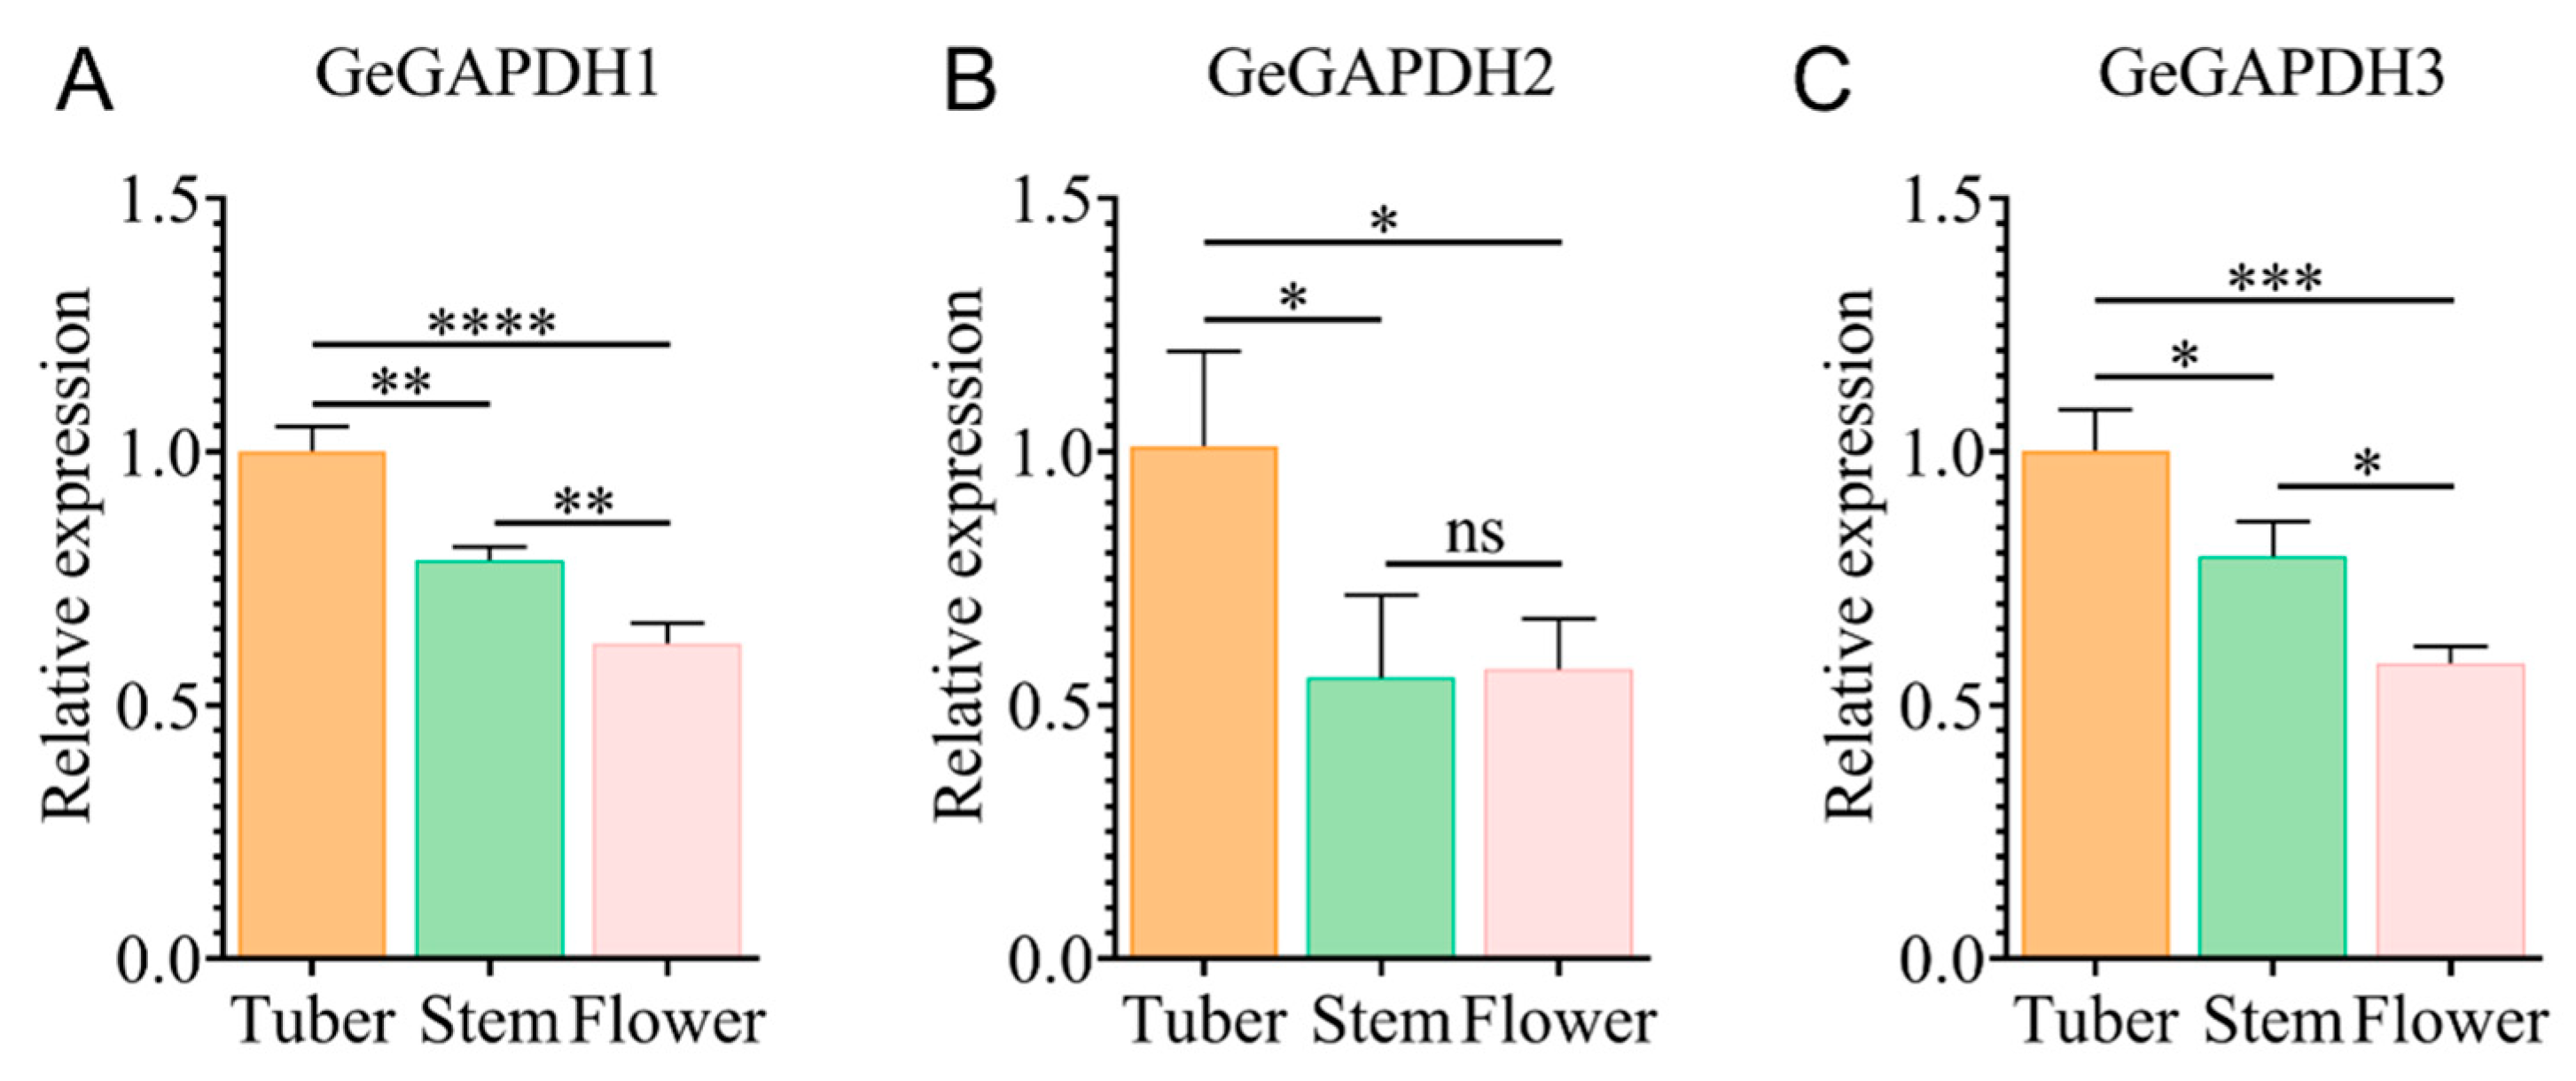
2.9. Expression Characteristics of the GeGAPDH Family Among Tissues

Using the GeActin gene as an internal reference, we employed qRT-PCR to analyze the expression of GeGAPDH genes in various tissues. Using the tuber expression level of GeGAPDH genes as the reference (set to 1), we compared the gene expression levels in tubers, stems, and flowers. The analysis revealed significant differences in the expression levels of GeGAPDH genes among the three tissues, with all three genes showing predominant expression in tubers. Specifically, the expression levels of GeGAPDH1, GeGAPDH2 and GeGAPDH3 in stems were 0.79-, 0.55-, and 0.79-fold, respectively, compared to tubers. In flowers, the expression levels were 0.62-, 0.57-, and 0.58-fold, respectively, compared to tubers (Figure 10).

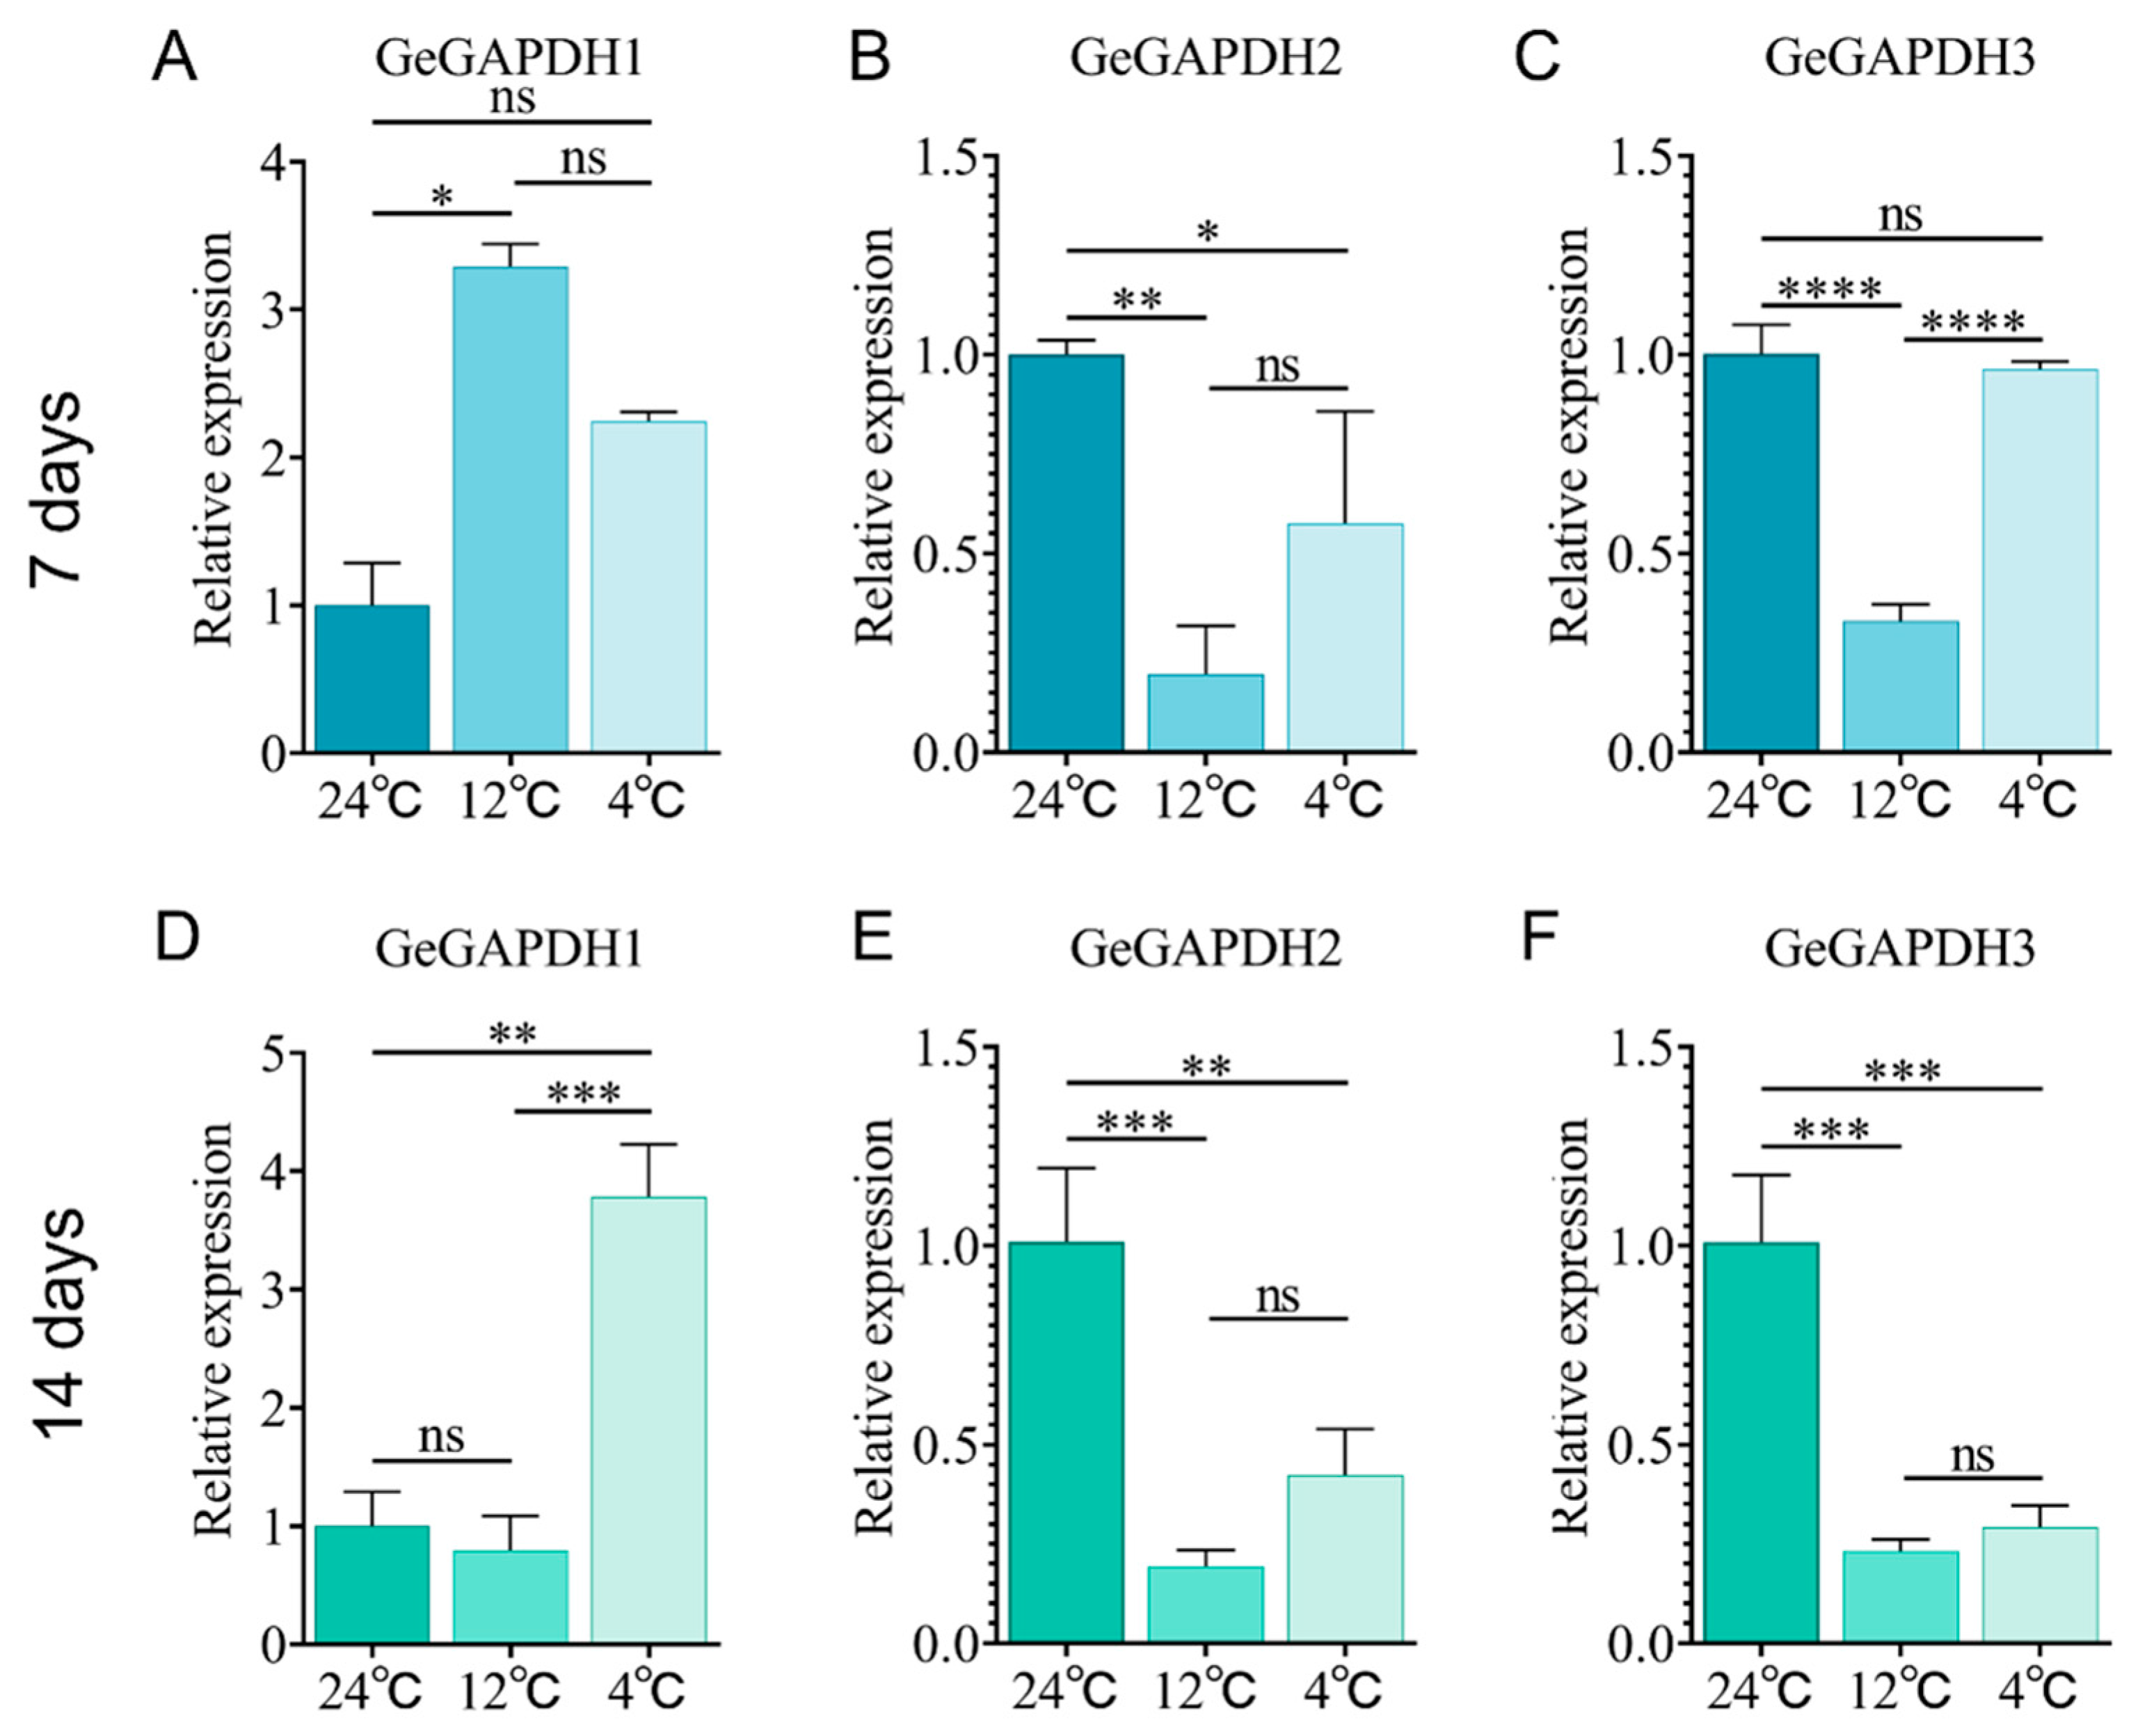
2.10. Expression Characteristics of the GeGAPDH Family Under Low-Temperature Stress

Temperature plays a crucial role in the quality and growth cycle of G. elata. To elucidate the potential role that GeGAPDH genes may play in responding to low-temperature stress, we exposed the tubers to different temperatures (24 °C, 12 °C, and 4 °C) and analyzed gene expression patterns of GeGAPDH genes. The results revealed distinct expression patterns of GeGAPDH genes under low-temperature stress. Compared to the optimal growth temperature of 24 °C, GeGAPDH1 expression was significantly up-regulated on day 7 at 12 °C (Figure 11A) but returned to baseline levels on day 14 (Figure 11D). Additionally, GeGAPDH1 expression remained stable on day 7 but showed a marked increase on day 14 at 4 °C (Figure 11A,D). In contrast, GeGAPDH2 and GeGAPDH3 showed distinct expression patterns under low-temperature stress conditions. At 12 °C, both genes were significantly downregulated at 7 and 14 days. Under 4 °C treatment, GeGAPDH2 expression was consistently suppressed at both time points, whereas GeGAPDH3 displayed a delayed response—maintaining stable expression at day 7 but showing significant downregulation at day 14 (Figure 11B,C,E,F).
In conclusion, GeGAPDH1 was up-regulated, whereas GeGAPDH2 and GeGAPDH3 were downregulated under low-temperature stress. These different expression profiles suggest that GeGAPDH subtypes may be regulated by different mechanisms and play different functional roles in response to low-temperature stress.

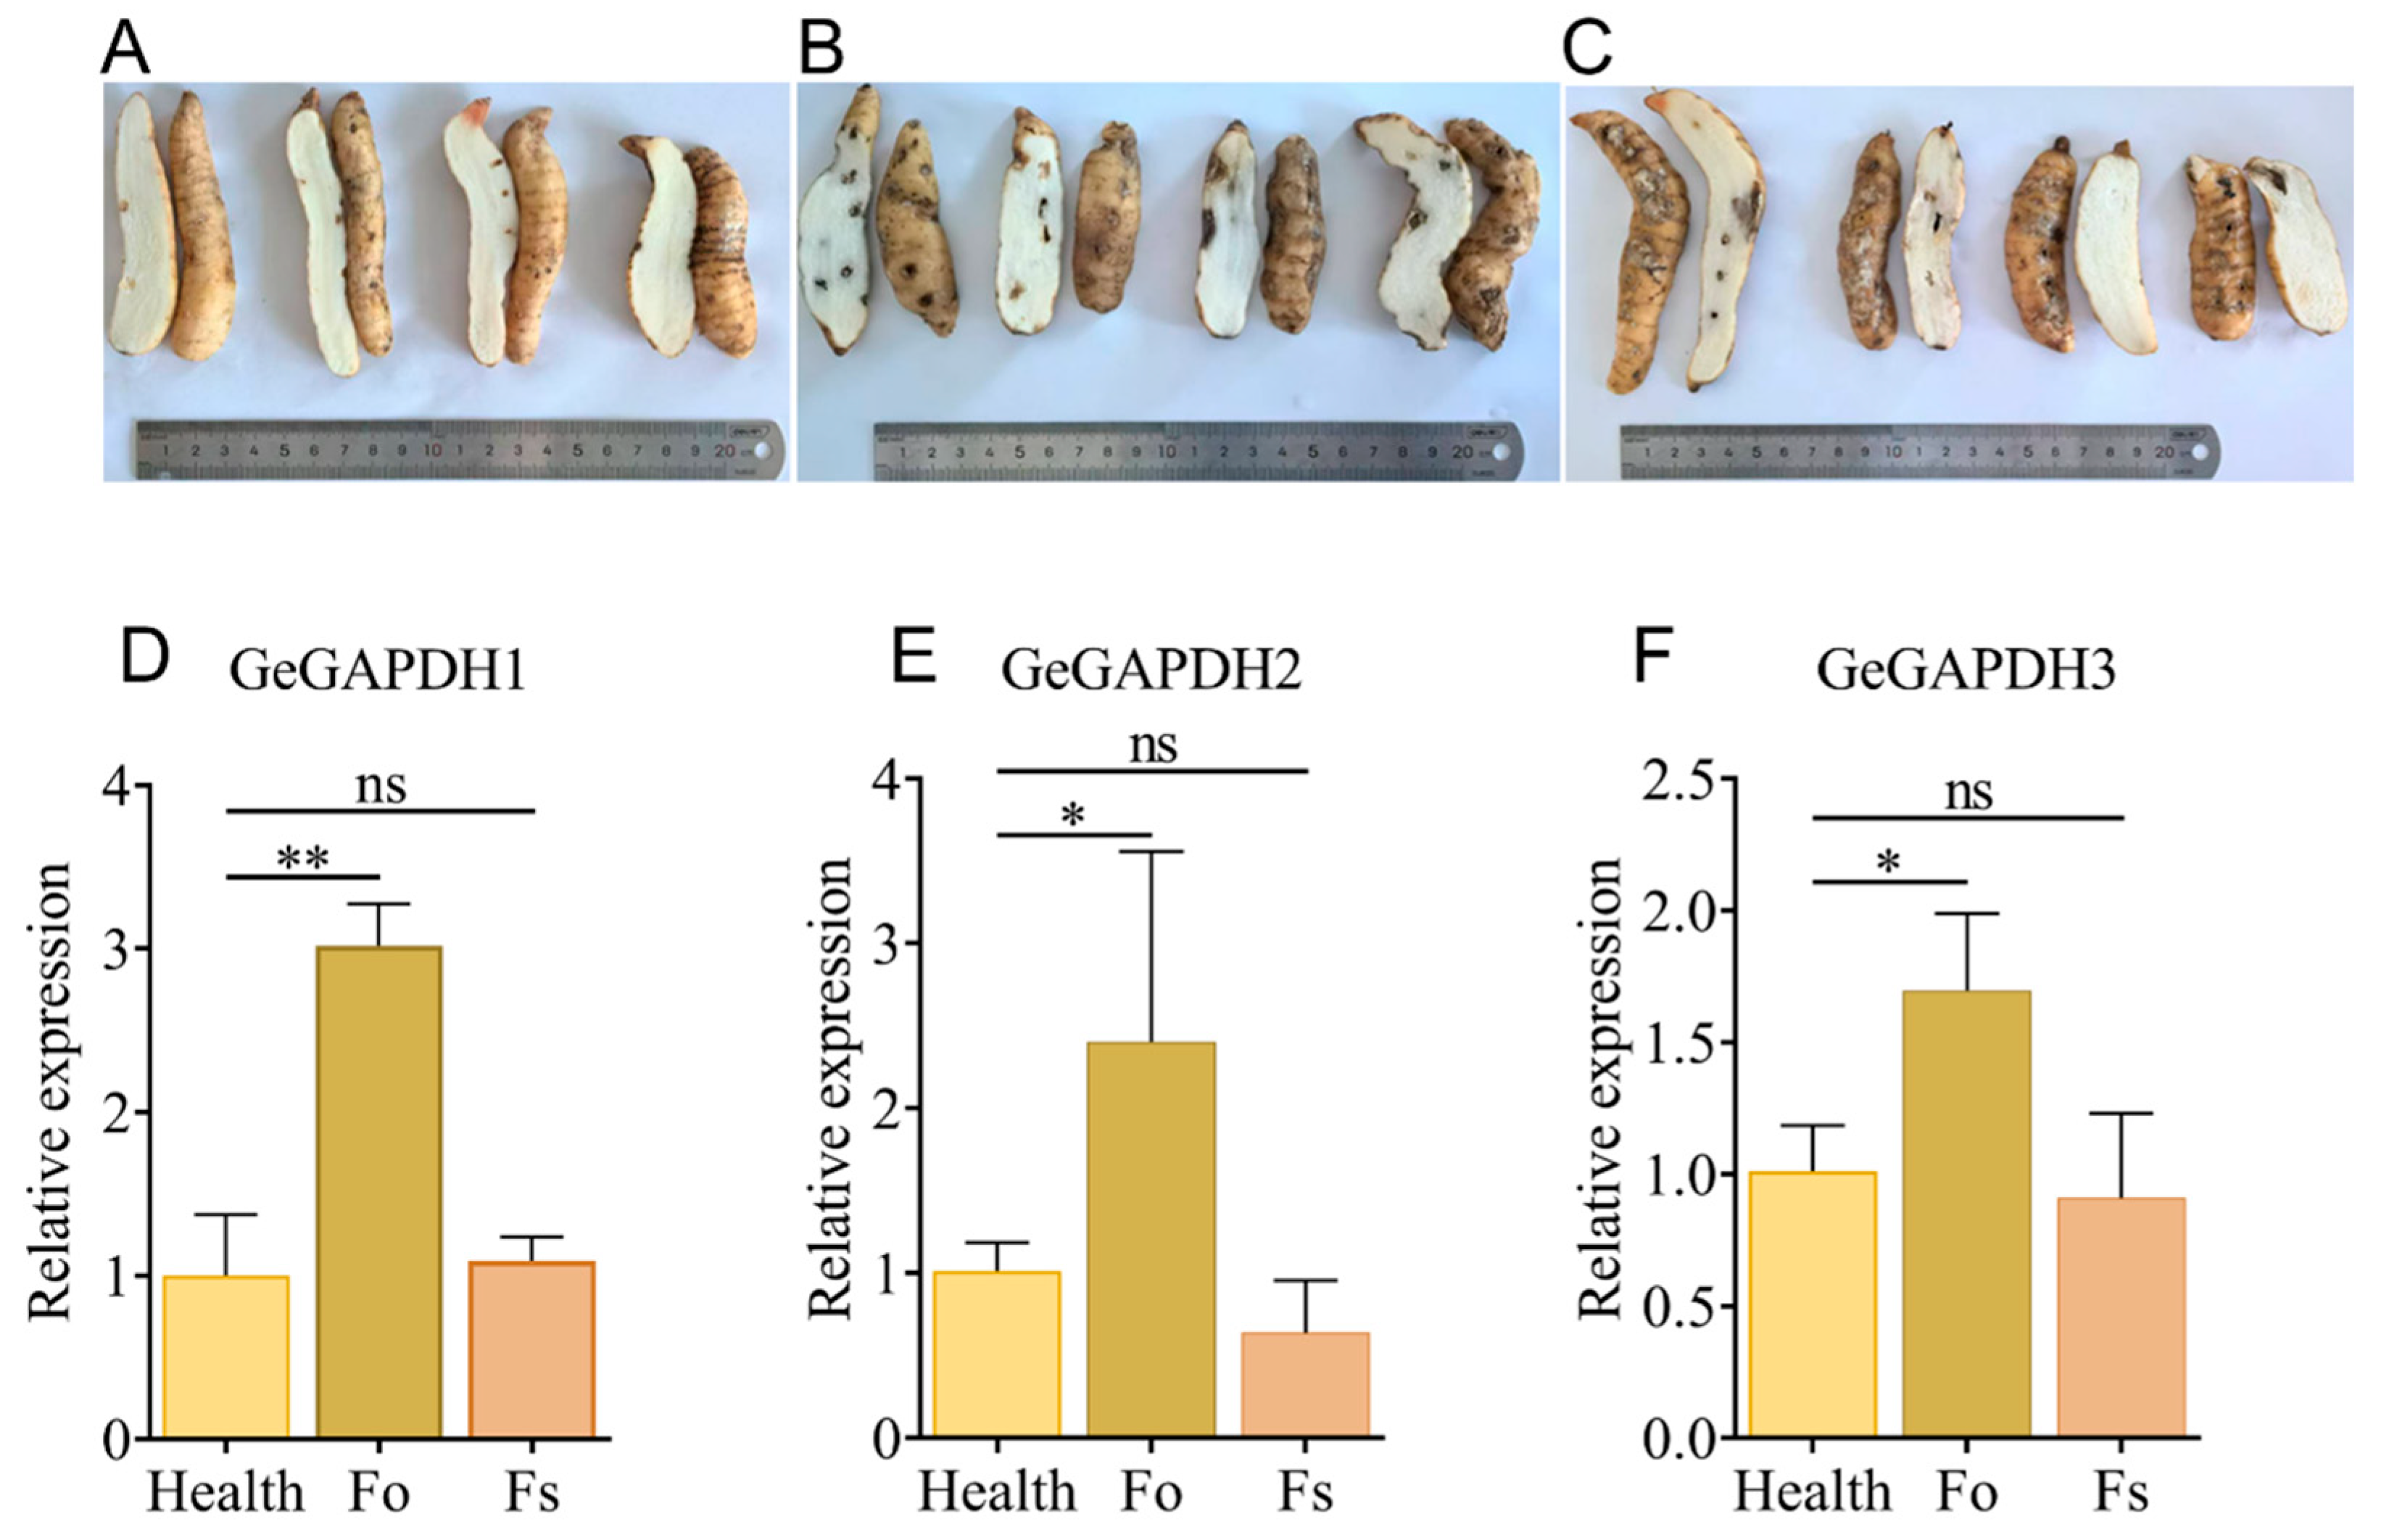
2.11. Expression Characteristics of the GeGAPDH Family Under Pathogen Stress

During the cultivation of G. elata, the tubers are frequently susceptible to infections by pathogenic microorganisms. One prevalent type of infection is brown rot, caused by Fusarium spp. This study investigates the impact of two brown rot fungal pathogens, F. oxysporum and F. solani, on the tubers of G. elata. After a 7-day treatment with F. oxysporum and F. solani, the tubers showed characteristic symptoms of brown rot, including the appearance of dark brown lesions on the surface, which were sunken and soft with an unpleasant odor. Additionally, surrounding tissues developed concentric gray-brown lesions (Figure 12A–C). Gene expression analysis revealed that infection with F. oxysporum significantly up-regulated the expression of GeGAPDH1, GeGAPDH2 and GeGAPDH3, with expression levels increasing to 3.02-, 2.56- and 1.69-fold, respectively, compared to healthy tubers. In contrast, infection with F. solani did not result in any detectable changes in the expression levels of GeGAPDH family members (Figure 12D–F). These results suggest that the GeGAPDH genes may play regulatory roles in pathogen stress responses, providing insights for further functional studies.

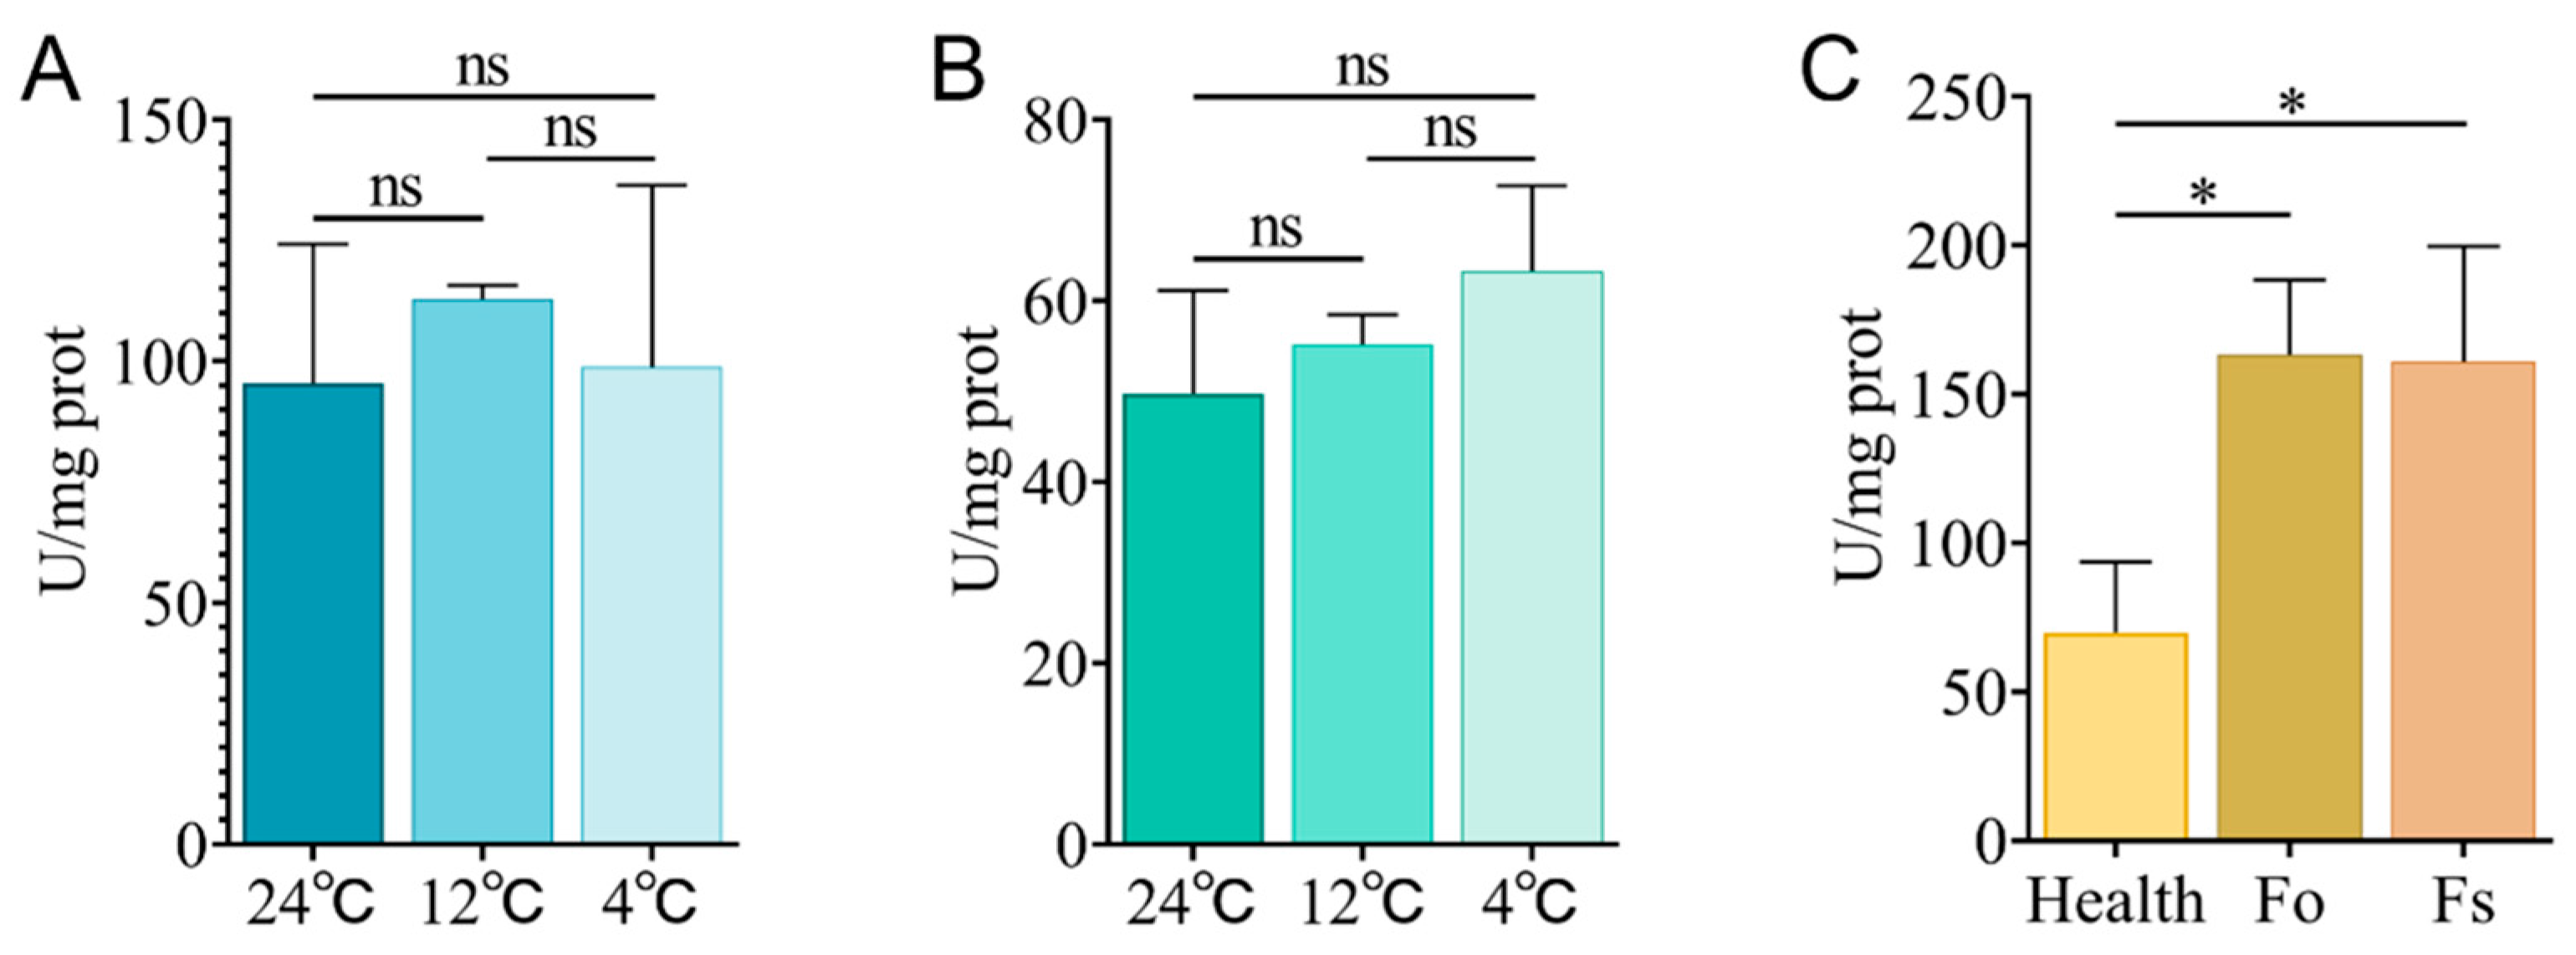
2.12. Detection of GAPDH Enzyme Activity Under Low Temperature and Fusarium Stress

To further characterize GeGAPDH responses to stress conditions, total GAPDH enzyme activity was measured in tubers subjected to different stress conditions. Under low-temperature stress, the total GAPDH enzyme activity in G. elata tubers showed no significant alteration (Figure 13A,B). However, in pathogen infection assays, both F. oxysporum and F. solani infections significantly increased GAPDH enzyme activity (Figure 13C).

3. Discussion

Glyceraldehyde-3-phosphate dehydrogenase (GAPDH) not only plays a crucial role in the glycolytic and gluconeogenic pathways within plants but also exhibits diverse biological functions. These include mediating plant responses to abiotic stresses such as drought [40], high temperature [41], low temperature [42], and salinity [29,30], as well as involvement in hormone signaling [32] and processes related to viral infection [43] and immune response [13]. In this study, three GAPDH genes were identified, and physicochemical property predictions suggest that the proteins encoded by these genes are all basic hydrophilic proteins. Conserved motif analysis of the amino acid sequences indicates that motif3 of GeGAPDH contains the Gp_dh_N domain (INGFGRIGR), while motif4 contains the Gp_dh_C domain (GAAKAV) (Figure 1). Phylogenetic analysis classified GAPDH proteins into four subgroups, corresponding to distinct subtypes, and suggested that GeGAPDH2 and GeGAPDH3 were classified as cytosolic subtypes, potentially participating in the glycolytic process [44], whereas GeGAPDH1 clustered with the plastid subtype (Figure 2). This classification was supported by N. benthamiana transient transformation experiments (Figure 9), where GeGAPDH1-EGFP showed strong colocalization with chloroplasts. This distribution pattern is consistent with the distribution observed for A. thaliana, plastid GAPCp1 and GAPCp2 in the leaves [45]. As a non-photosynthetic plant, G. elata contains only non-green plastids and lacks chloroplasts, suggesting that GeGAPDH1 may function as a non-green plastid protein, providing important clues for predicting its role in G elata. Studies have found that although the GAPCp subtype does not play a major role in photosynthetic cells, it plays an important role in non-photosynthetic cells. They not only provide essential metabolites for plant survival but also affect nitrogen and carbon metabolism and mineral nutrition. Additionally, GAPCps are important for primary root growth and may be closely related to energy production during glycolysis [16,44,45,46]. For example, in A. thaliana, double mutants of the plastid subtypes GAPCp1 and GAPCp2 exhibit severe phenotypes, including root development impairment, dwarfism, and infertility. Supplementing growth media with serine can restore root development and normalize carbohydrate and sugar biosynthesis activity, indicating the critical role of GAPCps in serine synthesis in roots [45].
The biosynthesis of the primary active constituents of G. elata, including gastrodin, parishins, and polysaccharides, is closely related to glycosylation. The synthetic pathway typically utilizes UDP-glucose, derived from glucose, as a sugar donor, leading to the formation of polysaccharides or glycosides through glycosylation modifications [47,48]. Monosaccharides serve as the starting materials for this synthetic route and are critical for the accumulation of active components, with their biosynthesis primarily occurring via gluconeogenesis and the Calvin-Benson cycle [47]. The GAPDH mediates the reversible conversion between BPGA/NADH and G3P/inorganic phosphate/NAD+. In this study, the vitro enzymatic assays demonstrated that purified GeGAPDH1 from G. elata catalyzed BPGA dephosphorylation and G3P phosphorylation (Figure 7 and Figure 8). This activity mirrors the activities of both GAPA/B and GAPCp subtypes found in green plants [38], suggesting it may encompass the biological functions of both plant GAPA/B and GAPCp subtypes.
Tissue-specific expression analyses reveal that GeGAPDH is predominantly expressed in the medicinal tubers, followed by the stem and flowers (Figure 10). Notably, the tuber-predominant expression of GeGAPDH genes aligns with its potential role in medicinal compound biosynthesis, given that tubers are the primary site for bioactive metabolite accumulation.
Analysis of the cis-acting elements in the promoter region elucidates the regulatory mechanisms of genes and their tissue-specific expression patterns. Extensive studies have confirmed that GAPDH genes play significant roles in plant growth and development as well as in response to abiotic stresses. For instance, loss of cytosolic GAPC activity in A. thaliana leads to carbon flux disturbances and mitochondrial dysfunction, ultimately inhibiting plant growth [49]. Overexpression of ClGAPC2 in watermelon and GmGAPDH14 in soybean significantly enhances salt tolerance [29,30]. Moreover, PlGAPC2 in Herbaceous Peony improves thermotolerance by inhibiting reactive oxygen species generation [50]. GAPDH genes in wheat and maize are implicated in drought response [20,25]. Notably, TaGAPCp1 protein localized in tobacco protoplasts showed significantly altered expression levels under osmotic stress and ABA induction [31]. GAPDH response to hormones and stress may be achieved through protein-protein interactions. TaGAPCp1 and its interacting protein cytochrome b6-f complex iron sulfite subunit (Cyt b6f) are involved in the response of wheat to abiotic stress, and this process may be completed by H2O2-mediated ABA signaling pathway [31]. Similarly, TaGAPC2 may interact with TaPLDδ to promote ABA-regulated stomatal closure, thereby enhancing drought tolerance in T. aestivum [40]. Additionally, A. thaliana GAPCps participates in abscisic acid signaling, influencing seed germination and plant growth [32]. Analysis of GeGAPDH gene promoters revealed various elements related to hormone responses, environmental stress, and light signaling (Figure 4). This suggests that the expression of the GeGAPDH genes may be regulated by multiple environmental and physiological conditions, thereby participating in plant growth and development as well as responses to abiotic stress. The findings of this study provide a theoretical basis for further exploring the potential functions of the GeGAPDH genes in regulating stress responses in G. elata.
The quality of G. elata is significantly related to the environmental temperature during its growth and storage [9]. Previous studies identified the glycolytic pathway as a primary pathway containing differentially expressed genes in response to low-temperature stress [9,51]. Metabolomics analyses reveal that G. elata grown at suitable temperatures contains significantly higher carbohydrate content compared to plants under low-temperature stress, where enzyme activity is inhibited, and carbohydrate metabolism is reduced, enhancing cold tolerance [9]. In this study, the expression of GeGAPDH1 was up-regulated (Figure 11A,D), while GeGAPDH2 and GeGAPDH3 were down-regulated (Figure 11B,C,E,F) under low-temperature stress. Although the expression of the two types of genes in G. elata tubers showed different responses to low-temperature stress, the total GAPDH enzyme activity showed no significant change under different temperature stresses (Figure 13A,B). We propose two explanations: (1) there may be a compensatory mechanism such as post-translational modification in GeGAPDH; (2) The enzyme activity homeostasis may be due to the dynamic equilibrium between the two subtypes of GeGAPDH in the enzyme activity assay reaction.
GAPDH genes also play a crucial role in plant responses to pathogenic infections. The sensitivity of A. thaliana AtGAPA, AtGAPC, and AtGAPCps [13], cassava MeGAPCs [33], and B. napus BnaGAPDH17, BnaGAPDH20, BnaGAPDH21, and BnaGAPDH22 [34] to pathogen infection have been demonstrated. G. elata is susceptible to pathogen infections during cultivation. This study analyzed GeGAPDH expression in healthy and brown rot pathogen-infected G. elata. The results revealed pathogen-specific variations in both GAPDH enzyme activity and gene expression patterns. After F. oxysporum-induced brown rot infection, all three GeGAPDH genes showed significant upregulation (Figure 12D–F), accompanied by markedly increased total GAPDH enzyme activity in G. elata tubers (Figure 13C). However, the GeGAPDH family members showed no significant transcriptional changes in F. solani-infected G. elata (Figure 12D–F) despite significant upregulation of total GAPDH enzyme activity (Figure 13C). The results of different expression levels showed that the GeGAPDH gene family may show pathogen-specific regulatory patterns. In response to F. oxysporum stress, the GeGAPDH gene family may directly participate in the regulation of disease resistance through the up-regulation of transcription levels. However, the increase in GAPDH enzyme activity during F. solani infection may depend on non-transcriptional regulatory mechanisms such as compensatory activation of other isoenzymes or post-translational modifications. These pathogen-specific regulatory strategies may reflect G. elata’s differential metabolic adaptation to distinct pathogen infection modes.

4. Materials and Methods

4.1. Identification of the GeGAPDH Family in G. elata

To identify the members of the GAPDH family in G. elata, the genome was downloaded from the National Genomics Science Data Center (accession number: GWHBHOU00000000) [52]. Initially, two hidden Markov models associated with conserved domains, Gp_dh_N (PF00044) and Gp_dh_C (PF02800), were obtained from the Pfam database [53]. Subsequently, using default parameters, hmmsearch (v.3.3.2) was employed to align the protein sequences of all genes in the G. elata genome with these two hidden Markov models. Genes that contained both conserved domains were preliminarily identified as candidate members of the GAPDH family. Next, the protein sequences of A. thaliana GAPDH genes were downloaded from the Phytozome v13 (https://phytozome-next.jgi.doe.gov/, accessed on 20 November 2024) [54]. BLASTP software (v.2.14.0) [55] was then utilized to compare the protein sequences of all genes in the G. elata genome against the A. thaliana GAPDH sequences, with an e-value ≤ 1 × 10⁻⁵. Ultimately, genes exhibiting both conserved domains and sequence homology were confirmed as members of the GAPDH family in G. elata.

4.2. Characterization of the GeGAPDH Family

All bioinformatics analyses were conducted using their respective default parameters as recommended by the tools. The physicochemical properties of the proteins were predicted using ProtParam (https://web.expasy.org/protparam/, accessed on 22 November 2024) [56]. The ProtScale tool (https://web.expasy.org/protscale/, accessed on 22 November 2024) [56] was employed to predict the hydrophilicity/hydrophobicity of the GeGAPDH proteins. The subcellular localization prediction was performed using WoLF PSORT (https://wolfpsort.hgc.jp/, accessed on 22 November 2024) [57]. Using TBtools (v2.096), the upstream 2000 bp sequences of the GeGAPDH genes were extracted based on the genomic annotation file. And PlantCARE (https://bioinformatics.psb.ugent.be/webtools/plantcare/html/, accessed on 23 November 2024) [58] was utilized to predict the cis-regulatory elements of GeGAPDH. Additionally, TBtools (v2.096) were used to analyze the structure and chromosomal localization of the GeGAPDH genes [59].

4.3. Collinearity, Phylogenetic and Protein–Protein Interaction Network Analysis of GAPDH Family

Protein sequences of GAPDH genes from A. thaliana and O. sativa were downloaded from the Phytozome database [54]. The One Step MCscanX module in TBtools (v2.096) was employed for pairwise comparison of the GAPDH protein sequences between A. thaliana and G. elata, as well as between G. elata and O. sativa. The Multiple Synteny Plot module was used to visualize the comparison results. A. thaliana GAPDH sequences were downloaded from the Phytozome v13 (https://phytozome-next.jgi.doe.gov/, accessed on 20 November 2024) [54], and C. sinensis and T. aestivum GAPDH sequences were obtained from the literature [20,37]. Next, Phylogenetic analysis was performed by TBtools (v2.096) “One Step Build a ML Tree” plugin with a bootstrap value set at 1000. Finally, the resulting phylogenetic tree was visualized and annotated using ChiPlo (https://www.chiplot.online/, accessed on 8 April 2025) [60]. Protein-protein interaction networks for GeGAPDH proteins were predicted using the STRING database v12.0 [61]. The analysis was performed by first specifying G. elata as the target organism through the “add organism” function. The amino acid sequences of GeGAPDH1, GeGAPDH2 and GeGAPDH3 were then input as query proteins. The interaction score threshold was set to “highest confidence” (0.900), with a maximum of 50 interactors to display (first shell). The PPI network was constructed using the default “full STRING network” mode.

4.4. Detection of GAPDH Activity in Total Protein Extracted from G. elata

Total protein from G. elata was extracted using a plant protein extraction kit (Solarbio, Beijing, China) according to the manufacturer’s protocols. The total protein concentration was determined using the Bradford protein concentration assay kit (Beyotime, Shanghai, China) [62]. The activity of glyceraldehyde-3-phosphate dehydrogenase (GAPDH) in the total protein extract was measured using a GAPDH activity detection kit (Solarbio, Beijing, China). One unit of enzyme activity was defined as the consumption of 1 nmol of NADH per minute.

4.5. Cloning, Expression, and Subcellular Localization of the GeGAPDH Genes

4.5.1. RNA Extraction and cDNA Synthesis

Samples of G. elata were collected from Zhaotong, Yunnan. The samples were cleaned and stored at −80 °C. Total RNA was extracted from the tubers, stems, and flowers of G. elata using the RNAprep Pure Plant Plus Kit (Tiangen Biotech, Beijing, China) according to the manufacturer’s instructions and subsequently reverse-transcribed into cDNA using the Hifair® II 1st Strand cDNA Synthesis SuperMix for qPCR (Yeasen Biotech, Shanghai, China).

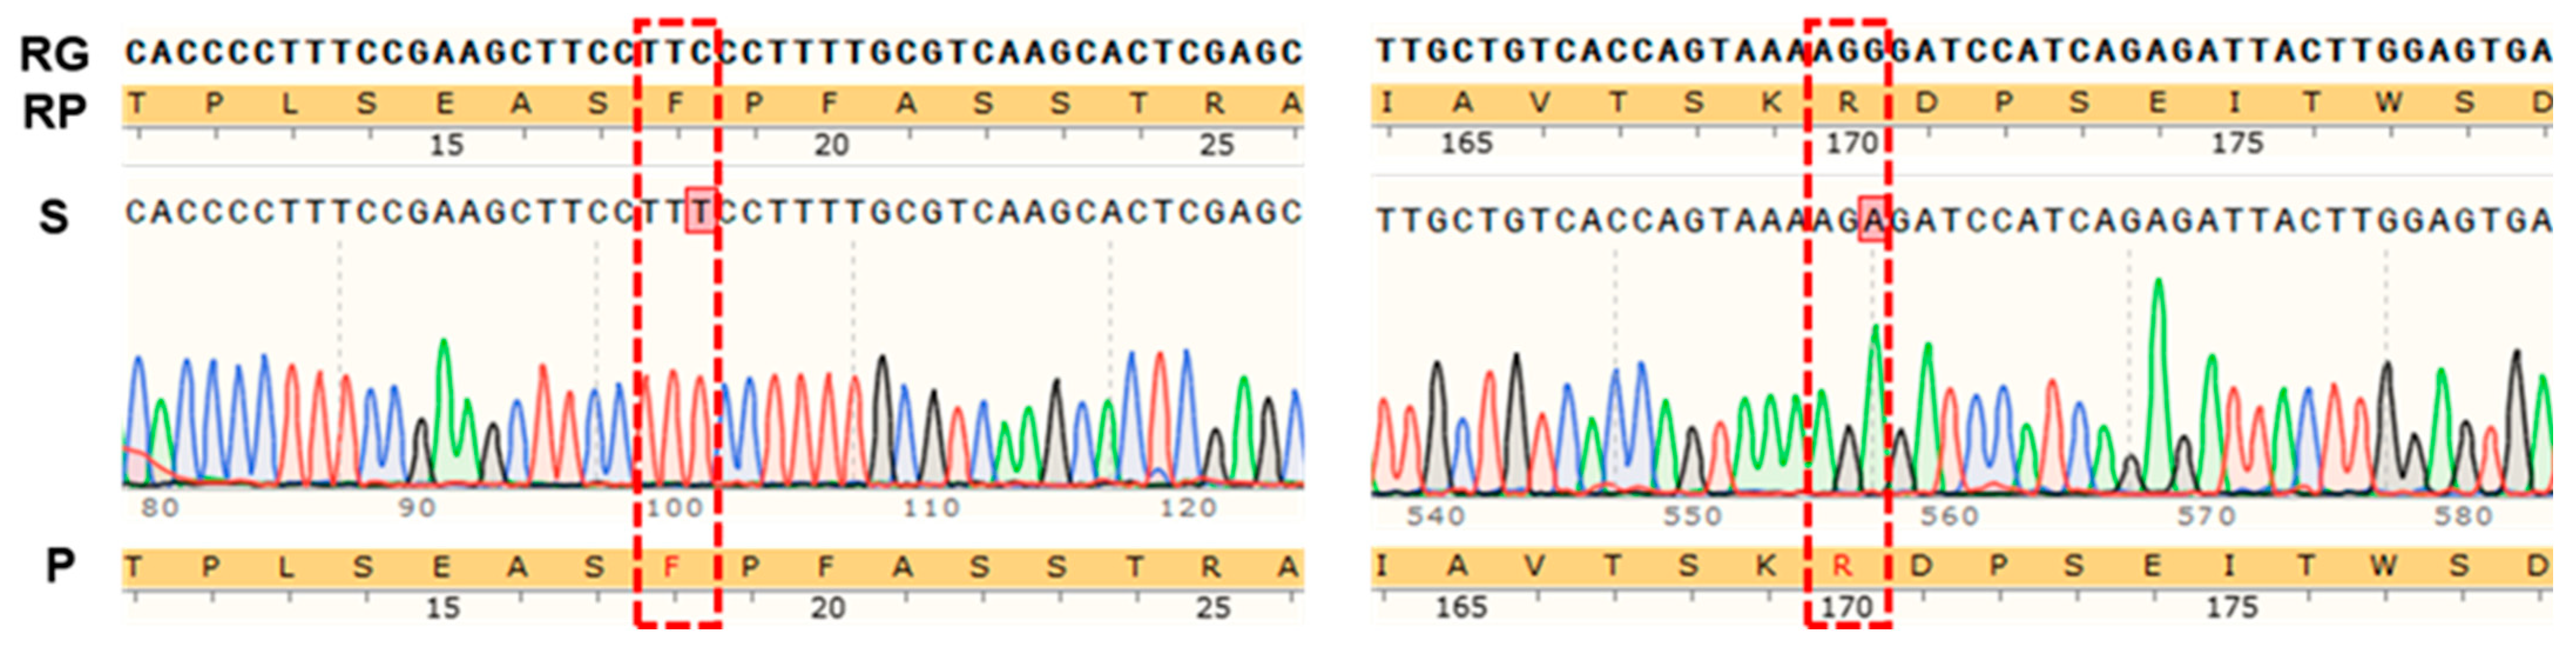
4.5.2. Cloning of the GeGAPDH Genes

Using the predicted full-length CDs as a reference sequence, specific primers for GeGAPDH were designed using the Biorun website (https://www.biorun.com) (Table S2). PCR amplification was performed using cDNA from the tubers as the template with Taq PCR Master Mix (Sangon Biotech, Shanghai, China). DNA fragments were purified using a magnetic bead-based DNA gel recovery kit (Beyotime, Shanghai, China). The purified DNA fragments were then ligated into the M5 HiPer pTOPO-Blunt cloning kit (Mei5bio, Beijing, China) and transformed into E. coli DH5α competent cells. Following PCR amplification and agarose gel electrophoresis, products consistent with the target gene fragment size were selected for Sanger sequencing, and plasmids were extracted using a plasmid extraction kit (Beyotime, Shanghai, China).

4.5.3. Expression, Purification, Enzyme Activity and Kinetics Detection of the GeGAPDH Genes

The expression vector pGEX-4T-1 was linearized using restriction enzymes Xho I and BamH I. Recombinant primers containing homologous sequences to the vector were designed using the CE Design primer design software available on the Vazyme website (http://www.vazyme.com) (Table S2). Next, PCR amplification was conducted using the plasmid containing the target gene as a template, employing TransStart® FastPfu DNA Polymerase (TransGen Biotech, Beijing, China) to obtain the target gene fragment. The linearized vector was then ligated with the target fragment using the ClonExpress® II One Step Cloning Kit (Vazyme, Nanjing, China). The ligation product was transformed into E. coli BL21 competent cells. Positive clones were confirmed through PCR and 1% agarose gel electrophoresis, followed by Sanger sequencing. Positive clones were inoculated into LB medium containing 100 μg/mL ampicillin and cultured at 37 °C, 220 rpm until the OD600 reached 0.5 to 0.7. IPTG was then added to a final concentration of 0.5 mmol/L, and induction was performed at 16 °C, 120 rpm for 16 h.
Proteins were purified using a GST-tagged protein purification kit (Beyotime, Shanghai, China). SDS-PAGE was applied to determine the size of the expressed protein bands, and the gel was stained and destained using a Coomassie Brilliant Blue staining kit (Beyotime, Shanghai, China). Images of the gel were captured using a multifunctional luminescent imaging system. The concentration of the purified protein was measured using the Bradford method. The GAPDH enzyme activity in the purified protein was assessed using a GAPDH activity detection kit (Solarbio, Beijing, China), with the purified protein from the empty vector pGEX-4T-1 serving as a control.
To investigate whether GeGAPDH1 catalyzes reversible reactions between G3P and BPGA with concomitant NADH oxidation/reduction, we performed bidirectional enzyme activity assays using purified GeGAPDH1, with GST protein serving as the negative control. All reactions were conducted in 200 μL volumes in 96-well plates at 25 °C, monitoring NADH absorbance at 340 nm every 10 s for 20 min using a Spark multimode microplate reader. For the dephosphorylation direction (BPGA → G3P), the reaction mixture contained 25 mM triethanolamine (Macklin, Shanghai, China), 0.2 mM ATP (Solarbio, Beijing, China), 1 U 3-Phosphoglyceric Phosphokinase (Shang-hai Yingxin, Shanghai, China), 0.1 mM NADH (Yeasen, Shanghai, China), and 2 mM BPGA (Aladdin, Shanghai, China), initiated by adding 10 μg of purified GeGAPDH1. The phosphorylation direction (G3P → BPGA) reaction system consisted 50 mM triethanolamine, 50 mM sodium bisphosphate (Sinopharm, Beijing, China), and 0.2 mM EDTA (Beyotime, Shanghai, China), 0.6 mM NAD+ (Yeasen, Shanghai, China), and 2 mM G3P (Shanghai yuanye, Shanghai, China), started with 2.5 μg GeGAPDH1.
Enzyme kinetic experiments were performed in the phosphorylation direction by varying G3P concentrations (0.25–5 mM) under otherwise identical conditions. Reaction velocities were determined by monitoring the absorbance increase at 340 nm during the initial 5 min. The Km and Vmax were determined by non-linear least square fitting of the curve using GraphPad Prism 10. Assays were performed in triplicate.

4.5.4. Subcellular Localization of the GeGAPDH1 Gene

Primers were designed based on the CDs of GeGAPDH1 (Table S2). The subcellular localization vector pCAMBIA1300-35S-EGFP was linearized using the restriction enzymes SalI-HF and BamHI-HF. Then, using the method described in 4.5.3, the target gene fragment was obtained by PCR, and the gene was cloned into the subcellular localization vector pCAMBIA1300-35S-EGFP to construct the fusion plasmid. The ligation product was transformed into Agrobacterium GV3101 competent cells. Positive clones were confirmed through PCR and 1% agarose gel electrophoresis, followed by Sanger sequencing. The confirmed positive bacterial solution was inoculated in LB liquid medium (containing 50 μg/mL Kanamycin and Rifampicin) and cultured overnight at 28 °C at 200 rpm. The bacterial solution was centrifuged at 8000 rpm for 5 min to collect bacterial precipitates. The bacterial pellet was resuspended in Agrobacterium infection solution (Coolaber, Beijing, China) and adjusted OD600 to about 0.6. The resuspended solution was injected into leaves of N. benthamiana, which were incubated at 25 °C for 36 h in the dark and then incubated at the same temperature for 8 h in the dark and 16 h in the light for an additional 7 days. N. benthamiana leaves injected with Agrobacterium carrying the empty vector served as negative controls. Subcellular localization was observed using a laser scanning confocal microscope (Leica TCS SP8 STED, Wetzlar, Germany) with the following parameters: GFP fluorescence was excited at 488 nm and detected at 500–550 nm; chloroplast autofluorescence was excited at 488 nm and collected at 650–750 nm.

4.6. Expression Profile Analysis of the GeGAPDH Family

GeActin was selected as the internal reference gene [63]. Given that the CDs regions of GeGAPDH2 and GeGAPDH3 differ by only a single nucleotide, we implemented the following primer design strategy to ensure specificity in qRT-PCR detection: First, gene-specific primers for GeGAPDH2 and GeGAPDH3 were designed by targeting both their CDs regions and non-homologous segments within the untranslated regions of their respective mRNAs. Second, primers for GeGAPDH1 were designed based solely on its CD sequence. This approach effectively prevents potential quantification bias that might arise from differential regulation due to distinct promoter elements between the paralogs. Real-time quantitative PCR amplification was performed using the Hieff qPCR SYBR Green Master Mix (Yeasen Biotech, Shanghai, China) by a two-step method. The relative expression level of GeGAPDH genes was analyzed using the 2−ΔΔCt method. Each sample contained three biological replicates versus three technical replicates, and the relative expression level was the mean of three technical replicates out of three biological replicates.

4.6.1. Effect of Low-Temperature Stress on GeGAPDH Expression in G. elata in Symbiotic with A. mellea

A. mellea and G. elata were cultured in tissue culture flasks. The potato dextrose agar (PDA) medium was prepared by dissolving 400 g/L potato infusion powder, 20 g/L glucose, and 15 g/L agar in distilled water, followed by pressure steam sterilization for 20 min at 121 °C. The A. millaria was inoculated into a PDA medium and cultured at 24 °C in the dark until the rhizomorphs covered the medium. Then, basal medium (wheat bran: PDA liquid medium = 1:0.6) was added for further culture. G. elata was cleaned, sterilized with 75% ethanol, and inoculated with the A. millaria. Samples were taken after dark incubation at 24 °C, 12 °C, and 4 °C for 7 and 14 days. RNA and first-strand cDNA were obtained from these samples, and the relative expression levels of GeGAPDH genes in tubers of G. elata at different temperatures were analyzed. The experimental design incorporated four biological replicates per treatment group, with each biological sample analyzed in three technical replicates. The relative expression level was the mean of three technical replicates out of four biological replicates.

4.6.2. Effect of F. oxysporum and F. solani Stress on GeGAPDH Expression in G. elata in Symbiotic with A. mellea

The F. oxysporum and F. solani strains used in this study were isolated in November 2022 from Salvia miltiorrhiza exhibiting characteristic leaf spot and root rot symptoms, collected from Miaoshan Town, Laiwu District, Shandong Province, China [64]. Following isolation, both strains were maintained in our laboratory through periodic subculturing on PDA medium at 28 °C. F. oxysporum or F. solani were individually cultured on PDA plates at 28 °C in the dark until the pathogen reached two-thirds of the diameter of the plate, and the pathogen was taken for further experiments. G. elata was cleaned and sterilized with 75% ethanol. Ten uniform punctures (1 mm in diameter) were made on each tuber using a sterile syringe. A 5 mm-diameter disc of F. oxysporum or F. solani was placed on the punctured sites. G. elata inoculated on PDA was used as a control. The treated samples were then inoculated with A. millaria as described above and incubated at 24 °C in the dark for 7 days before sampling. RNA and first-strand cDNA were obtained from these samples, and the relative expression levels of GeGAPDH genes in tubers of G. elata under pathogen stress were analyzed. The experimental design incorporated four biological replicates per treatment group, with each biological sample analyzed in three technical replicates. The relative expression level was the mean of three technical replicates out of four biological replicates.

4.6.3. Detection of GAPDH Enzyme Activity Under Low Temperature and Pathogen Stress Conditions

The activity of the GAPDH enzyme was measured in stress-treated G. elata samples (as described in Section 4.6.2 and Section 4.6.3) using a GAPDH activity detection kit (Solarbio, Beijing, China). The experimental design incorporated four biological replicates per treatment group, with each biological sample analyzed in three technical replicates. The reported enzyme activity values were the mean of three technical replicates out of four biological replicates.

4.6.4. Data Analysis

Statistical analyses were performed using Excel 2021 and GraphPad Prism 10. Group comparisons were made using one-way ANOVA, with statistical significance defined as p < 0.05.

5. Conclusions

This study systematically identified three GeGAPDH genes in G. elata, all encoding stable hydrophilic proteins. Phylogenetic analysis indicated that GeGAPDH1 is a plastid subtype, while GeGAPDH2 and GeGAPDH3 are cytosolic subtypes. Heterologous expression confirmed that GeGAPDH1 is localized in plastids and exhibits significant phosphorylating and dephosphorylating GAPDH enzyme activity. Expression analysis revealed predominant GeGAPDH expression in tubers. Furthermore, the expression levels of the different GeGAPDH subtypes in tubers are influenced by low-temperature and pathogen stresses, exhibiting differential expression patterns under various stress conditions. These findings elucidate the functional differentiation between GeGAPDH subtypes in heterotrophic plant G. elata and their distinct regulatory responses to environmental stress, laying the foundation for further research on GAPDH gene functions.

Supplementary Materials

The following supporting information can be downloaded at: https://www.mdpi.com/article/10.3390/plants14121866/s1, Figure S1: Sequencing results of GeGAPDH1 gene in cloningvector; Figure S2: Sequencing results of GeGAPDH1 gene in expression vector; Figure S3: Sequencing results of GeGAPDH1 gene in subcellular localization vector; Table S1: The results of homologous sequence alignment and HMM search; Table S2: The primer sequences used in this project; Data S1: The GAPDH protein sequences in phylogenetic tree.

Author Contributions

Y.Y.: conceptualization, formal analysis, visualization, writing—original draft; M.J.: conceptualization, data curation, formal analysis, writing—review and editing; P.H.: methodology; investigation; X.L.: supervision, project administration; X.W.: supervision, resources, funding acquisition. All authors have read and agreed to the published version of the manuscript.

Funding

This research was funded by the National Key Research and Development Project (2023YFC3503805), the National Natural Science Foundation of China [82073954], the China Agriculture Research System of MOF and MARA [CARS-21], and Taishan Scholars Program of Shandong Province (tstp20221138).

Data Availability Statement

All data supporting this study are available within the paper and within the Supplementary Materials published online.

Conflicts of Interest

The authors declare no conflicts of interest.

References

  1. Chen, P.J.; Sheen, L.Y. Gastrodiae Rhizoma (tiān má): A review of biological activity and antidepressant mechanisms. J. Tradit. Complement. Med. 2011, 1, 31–40. [Google Scholar] [CrossRef] [PubMed]
  2. Hsu, W.H.; Huang, N.K.; Shiao, Y.J.; Lu, C.K.; Chao, Y.M.; Huang, Y.J.; Yeh, C.H.; Lin, Y.L. Gastrodiae rhizoma attenuates brain aging via promoting neuritogenesis and neurodifferentiation. Phytomed. Int. J. Phytother. Phytopharm. 2021, 87, 153576. [Google Scholar] [CrossRef] [PubMed]
  3. Liu, Y.; Gao, J.; Peng, M.; Meng, H.; Ma, H.; Cai, P.; Xu, Y.; Zhao, Q.; Si, G. A review on central nervous system effects of Gastrodin. Front. Pharmacol. 2018, 9, 24. [Google Scholar] [CrossRef] [PubMed]
  4. Qiu, C.W.; Chen, B.; Zhu, H.F.; Liang, Y.L.; Mao, L.S. Gastrodin alleviates cisplatin nephrotoxicity by inhibiting ferroptosis via the SIRT1/FOXO3A/GPX4 signaling pathway. J. Ethnopharmacol. 2024, 319, 117282. [Google Scholar] [CrossRef]
  5. Zhao, X.; Zhou, S.; Liu, Y.; Gong, C.; Xiang, L.; Li, S.; Wang, P.; Wang, Y.; Sun, L.; Zhang, Q.; et al. Parishin alleviates vascular ageing in mice by upregulation of Klotho. J. Cell. Mol. Med. 2023, 27, 1398–1409. [Google Scholar] [CrossRef] [PubMed]
  6. Zhao, X.; Zhou, S.; Yan, R.; Gong, C.; Gui, Q.; Zhang, Q.; Xiang, L.; Chen, L.; Wang, P.; Li, S.; et al. Parishin From Gastrodia elata Ameliorates Aging Phenotype in Mice in a Gut Microbiota-Related Manner. Front. Microbiol. 2022, 13, 877099. [Google Scholar] [CrossRef]
  7. Liao, C.C.; Yu, H.P.; Chou, A.H.; Lee, H.C.; Hu, L.M.; Liu, F.C. Gastrodin Alleviates Acetaminophen—Induced Liver Injury in a Mouse Model Through Inhibiting MAPK and Enhancing Nrf2 Pathways. Inflammation 2022, 45, 1450–1462. [Google Scholar] [CrossRef]
  8. Wu, G.Z.; Jia, C.Q.; Wang, X.; Chen, L.; Liu, F.; Zhang, Y.Y.; Dong, H.J.; Li, J. Research progress on extraction, purification and pharmacological activities of Gastrodiae R hizoma polysaccharides. Chin. Arch. Tradit. Chin. Med. 2022, 40, 135–139. [Google Scholar] [CrossRef]
  9. Zhou, C.Y.; Di, Y.G.; Qiu, Q.L.; Cai, J.L.; Liu, Y.X.; Xu, H.N.; Li, K.Z. Effects of Low Temperature Stress on Growth and Development of G. elata were Analyzed by Transcriptome and Metabolome. Mol. Plant Breed. 2023, 21, 110–122. [Google Scholar] [CrossRef]
  10. Tang, X.; Zhang, J.Q.; Jiang, W.K.; Yuan, Q.S.; Wang, Y.H.; Guo, L.P.; Yang, Y.; Yang, Y.; Zhou, T. Isolation, identification, and pathogenicity research of brown rot pathogens from Gastrodia elata. China J. Chin. Mater. 2022, 47, 2288–2295. [Google Scholar] [CrossRef]
  11. Zhou, M.C.; Li, H.Q.; Liu, M.; Xu, Q.Z.; Cheng, Z.J.; Wang, C.Y. Research progress of Gastrodia elata disease and insect pests and their control. South Cent. Agric. Sci. Technol. 2024, 45, 230–235. [Google Scholar]
  12. Li, J.; He, K.; Zhang, Q.; Wu, X.; Li, Z.; Pan, X.; Wang, Y.; Li, C.; Zhang, M. Draft genome and biological characteristics of Fusarium solani and Fusarium oxysporum causing black rot in Gastrodia elata. Int. J. Mol. Sci. 2023, 24, 4545. [Google Scholar] [CrossRef] [PubMed]
  13. Henry, E.; Fung, N.; Liu, J.; Drakakaki, G.; Coaker, G. Beyond glycolysis: GAPDHs are multi-functional enzymes involved in regulation of ROS, autophagy, and plant immune responses. PLoS Genet. 2015, 11, e1005199. [Google Scholar] [CrossRef] [PubMed]
  14. Wegener, M.; Persicke, M.; Dietz, K.J. Reprogramming the translatome during daily light transitions as affected by cytosolic glyceraldehyde-3-phosphate dehydrogenases GAPC1/C2. J. Exp. Bot. 2024, 75, 2494–2509. [Google Scholar] [CrossRef]
  15. Marri, L.; Sparla, F.; Pupillo, P.; Trost, P. Co-ordinated gene expression of photosynthetic glyceraldehyde-3-phosphate dehydrogenase, phosphoribulokinase, and CP12 in Arabidopsis thaliana. J. Exp. Bot. 2005, 56, 73–80. [Google Scholar] [CrossRef] [PubMed]
  16. Anoman, A.D.; Muñoz-Bertomeu, J.; Rosa-Téllez, S.; Flores-Tornero, M.; Serrano, R.; Bueso, E.; Fernie, A.R.; Segura, J.; Ros, R. Plastidial Glycolytic Glyceraldehyde-3-Phosphate Dehydrogenase Is an Important Determinant in the Carbon and Nitrogen Metabolism of Heterotrophic Cells in Arabidopsis. Plant Physiol. 2015, 169, 1619–1637. [Google Scholar] [CrossRef]
  17. Piattoni, C.V.; Rius, S.P.; Gomez-Casati, D.F.; Guerrero, S.A.; Iglesias, A.A. Heterologous expression of non-phosphorylating glyceraldehyde-3-phosphate dehydrogenase from Triticum aestivum and Arabidopsis thaliana. Biochimie 2010, 92, 909–913. [Google Scholar] [CrossRef]
  18. Guo, L.; Ma, F.; Wei, F.; Fanella, B.; Allen, D.K.; Wang, X. Cytosolic phosphorylating glyceraldehyde-3-phosphate dehydrogenases affect Arabidopsis cellular metabolism and promote seed oil accumulation. Plant Cell 2014, 26, 3023–3035. [Google Scholar] [CrossRef]
  19. Trost, P.; Fermani, S.; Marri, L.; Zaffagnini, M.; Falini, G.; Scagliarini, S.; Pupillo, P.; Sparla, F. Thioredoxin-dependent regulation of photosynthetic glyceraldehyde-3-phosphate dehydrogenase: Autonomous vs. CP12-dependent mechanisms. Photosynth. Res. 2006, 89, 263–275. [Google Scholar] [CrossRef]
  20. Zeng, L.; Deng, R.; Guo, Z.; Yang, S.; Deng, X. Genome-wide identification and characterization of Glyceraldehyde-3-phosphate dehydrogenase genes family in wheat (Triticum aestivum). BMC Genom. 2016, 17, 240. [Google Scholar] [CrossRef]
  21. Meng, X.; Lv, Y.; Mujahid, H.; Edelmann, M.J.; Zhao, H.; Peng, X.; Peng, Z. Proteome-wide lysine acetylation identification in developing rice (Oryza sativa) seeds and protein co-modification by acetylation, succinylation, ubiquitination, and phosphorylation. Biochim. Biophys. Acta Proteins Proteom. 2018, 1866, 451–463. [Google Scholar] [CrossRef] [PubMed]
  22. Zhang, X.; Su, Y.M.; Deng, L.; Zhang, F.C. Expressoin pattern analysis of cyosol glyceraldehyde-3-phos-phatedehydrogenase genes in Arabidopsis. Biotechnology 2016, 26, 469–472. [Google Scholar] [CrossRef]
  23. Li, Y.M.; OuYang, M.Z.; Sun, S.R.; Zhu, L. Cloning and Expression Analysis of Glyceraldehyde-3-phosphate Dehydro genase (GAPDH) Gene CaGAPB in Pepper. Mol. Plant Breed. 2018, 16, 1382–1389. [Google Scholar] [CrossRef]
  24. Zhu, P.S.; Liu, H.Y.; Cao, Z.; Cong, Y.D. Identification of GAPDH Gene Family in Tomato and Its Response to GSNO Regulating NaCl Stress. Mol. Plant Breed. 2023, 21, 7682–7688. [Google Scholar] [CrossRef]
  25. Zhang, L.; Zhao, Z.H.; Mei, F.J.; Wang, T.C.; Li, Y.H. Cloning and Analysis of Expression Characteristics of Glyceraldehyde-3-Phosphate Dehydrogenase 2(ZmGAPDH2) Gene in Maize. J. Maize Sci. 2022, 30, 42–50. [Google Scholar] [CrossRef]
  26. Wang, X.L.; Ji, J.J.; Gao, J.P. Clone and expression of CpGAPDH gene in Codonopsis pilosula. China J. Chin. Mater. Medica 2018, 43, 712–720. [Google Scholar] [CrossRef]
  27. Zhu, H.; Li, K.; Zhao, R.Q.; Wu, Y.S. Cloning and sequencing of Panax notoginseng GAPDH. Acta Bot. Boreali Occident. Sin. 2006, 26, 1316–1319. [Google Scholar] [CrossRef]
  28. Zhu, L.F.; Yang, C.Q.; You, Y.H.; Liang, W.; Wang, N.N.; Ma, F.W.; Li, C.Y. Validation of reference genes for qRT-PCR analysis in peel and flesh of six apple cultivars (Malus domestica) at diverse stages of fruit development. Sci. Hortic. 2019, 244, 165–171. [Google Scholar] [CrossRef]
  29. Li, Y.M.; Sun, S.R.; Wang, Y.; Cai, X.X.; Yao, J.X.; Zhu, L. Identification of the GAPDH gene family in Citrullus lanatus and functional characteristics of ClGAPC2 in Arabidopsis thaliana. Plant Biol. 2023, 25, 334–342. [Google Scholar] [CrossRef]
  30. Zhao, X.; Wang, J.; Xia, N.; Qu, Y.; Zhan, Y.; Teng, W.; Li, H.; Li, W.; Li, Y.; Zhao, X.; et al. Genome—wide identification and analysis of glyceraldehyde-3-phosphate dehydrogenase family reveals the role of GmGAPDH14 to improve salt tolerance in soybean (Glycine max L.). Front. Plant Sci. 2023, 14, 1193044. [Google Scholar] [CrossRef]
  31. Li, X.; Wei, W.; Li, F.; Zhang, L.; Deng, X.; Liu, Y.; Yang, S. The Plastidial Glyceraldehyde-3-Phosphate Dehydrogenase Is Critical for Abiotic Stress Response in Wheat. Int. J. Mol. Sci. 2019, 20, 1104. [Google Scholar] [CrossRef] [PubMed]
  32. Muñoz-Bertomeu, J.; Bermúdez, M.A.; Segura, J.; Ros, R. Arabidopsis plants deficient in plastidial glyceraldehyde-3-phosphate dehydrogenase show alterations in abscisic acid (ABA) signal transduction: Interaction between ABA and primary metabolism. J. Exp. Bot. 2011, 62, 1229–1239. [Google Scholar] [CrossRef] [PubMed]
  33. Zeng, H.; Xie, Y.; Liu, G.; Lin, D.; He, C.; Shi, H. Molecular identification of GAPDHs in cassava highlights the antagonism of MeGAPCs and MeATG8s in plant disease resistance against cassava bacterial blight. Plant Mol. Biol. 2018, 97, 201–214. [Google Scholar] [CrossRef]
  34. Xu, J.; Wang, R.; Zhang, X.; Zhuang, W.; Zhang, Y.; Lin, J.; Zhan, P.; Chen, S.; Lu, H.; Wang, A.; et al. Identification and expression profiling of GAPDH family genes involved in response to Sclerotinia sclerotiorum infection and phytohormones in Brassica napus. Front. Plant Sci. 2024, 15, 1360024. [Google Scholar] [CrossRef]
  35. Liu, J.J.; Yang, X.Q.; Li, Z.Y.; Miao, J.Y.; Li, S.B.; Zhang, W.P.; Lin, Y.C.; Lin, L.B. The role of symbiotic fungi in the life cycle of Gastrodia elata Blume (Orchidaceae): A comprehensive review. Front. Plant Sci. 2023, 14, 1309038. [Google Scholar] [CrossRef]
  36. Kyte, J.; Doolittle, R.F. A simple method for displaying the hydropathic character of a protein. J. Mol. Biol. 1982, 157, 105–132. [Google Scholar] [CrossRef] [PubMed]
  37. Miao, L.; Chen, C.; Yao, L.; Tran, J.; Zhang, H. Genome-wide identification, characterization, interaction network and expression profile of GAPDH gene family in sweet orange (Citrus sinensis). PeerJ. 2019, 7, e7934. [Google Scholar] [CrossRef]
  38. Zaffagnini, M.; Fermani, S.; Costa, A.; Lemaire, S.D.; Trost, P. Plant cytoplasmic GAPDH: Redox post-translational modifications and moonlighting properties. Front. Plant Sci. 2013, 4, 450. [Google Scholar] [CrossRef]
  39. Schormann, N.; Campos, J.; Motamed, R.; Hayden, K.L.; Gould, J.R.; Green, T.J.; Senkovich, O.; Banerjee, S.; Ulett, G.C.; Chattopadhyay, D. Chlamydia trachomatis glyceraldehyde 3-phosphate dehydrogenase: Enzyme kinetics, high-resolution crystal structure, and plasminogen binding. Protein Sci. A Publ. Protein Soc. 2020, 29, 2446–2458. [Google Scholar] [CrossRef]
  40. Zhang, L.; Zhang, H.; Yang, S. Cytosolic TaGAPC2 Enhances Tolerance to Drought Stress in Transgenic Arabidopsis Plants. Int. J. Mol. Sci. 2020, 21, 7499. [Google Scholar] [CrossRef]
  41. Kim, S.C.; Guo, L.; Wang, X. Nuclear moonlighting of cytosolic glyceraldehyde-3-phosphate dehydrogenase regulates Arabidopsis response to heat stress. Nat. Commun. 2020, 11, 3439. [Google Scholar] [CrossRef] [PubMed]
  42. He, X.; Long, F.; Li, Y.; Xu, Y.; Hu, L.; Yao, T.; Huang, Y.; Hu, D.; Yang, Y.; Fei, Y. Comparative Transcriptome Analysis Revealing the Potential Mechanism of Low-Temperature Stress in Machilus microcarpa. Front. Plant Sci. 2022, 13, 900870. [Google Scholar] [CrossRef] [PubMed]
  43. Wang, Q.; Lu, L.; Zeng, M.; Wang, D.; Zhang, T.Z.; Xie, Y.; Gao, S.B.; Fu, S.; Zhou, X.P.; Wu, J.X. Rice black-streaked dwarf virus P10 promotes phosphorylation of GAPDH (glyceraldehyde-3-phosphate dehydrogenase) to induce autophagy in Laodelphax striatellus. Autophagy 2022, 18, 745–764. [Google Scholar] [CrossRef]
  44. Petersen, J.; Brinkmann, H.; Cerff, R. Origin, evolution, and metabolic role of a novel glycolytic GAPDH enzyme recruited by land plant plastids. J. Mol. Evol. 2003, 57, 16–26. [Google Scholar] [CrossRef] [PubMed]
  45. Muñoz-Bertomeu, J.; Cascales-Miñana, B.; Mulet, J.M.; Baroja-Fernández, E.; Pozueta-Romero, J.; Kuhn, J.M.; Segura, J.; Ros, R. Plastidial glyceraldehyde-3-phosphate dehydrogenase deficiency leads to altered root development and affects the sugar and amino acid balance in Arabidopsis. Plant Physiol. 2009, 151, 541–558. [Google Scholar] [CrossRef]
  46. Russell, D.A.; Sachs, M.M. The maize cytosolic glyceraldehyde-3-phosphate dehydrogenase gene family: Organ-specific expression and genetic analysis. Mol. Gen. Genet. MGG 1991, 229, 219–228. [Google Scholar] [CrossRef]
  47. Chen, G.H.; Li, C.; Feng, X.D. Research progress of UDP—Sugar biosynthesis. J. Biol. 2023, 40, 95–100. [Google Scholar] [CrossRef]
  48. Chen, C.C.; Mi, H.L. Analysis of genes related to biosynthesis of gastrodin. Plant Physiol. J. 2021, 57, 1819–1828. [Google Scholar] [CrossRef]
  49. Rius, S.P.; Casati, P.; Iglesias, A.A.; Gomez-Casati, D.F. Characterization of Arabidopsis lines deficient in GAPC-1, a cytosolic NAD-dependent glyceraldehyde-3-phosphate dehydrogenase. Plant Physiol. 2008, 148, 1655–1667. [Google Scholar] [CrossRef]
  50. Zhao, D.; Cheng, Z.; Qian, Y.; Hu, Z.; Tang, Y.; Huang, X.; Tao, J. PlWRKY47 Coordinates With Cytosolic Glyceraldehyde-3-Phosphate Dehydrogenase 2 Gene to Improve Thermotolerance Through Inhibiting Reactive Oxygen Species Generation in Herbaceous Peony. Plant Cell Environ. 2025, 48, 226–243. [Google Scholar] [CrossRef]
  51. Selvarajan, D.; Mohan, C.; Dhandapani, V.; Nerkar, G.; Jayanarayanan, A.N.; Vadakkancherry Mohanan, M.; Murugan, N.; Kaur, L.; Chennappa, M.; Kumar, R.; et al. Differential gene expression profiling through transcriptome approach of Saccharum spontaneum L. under low temperature stress reveals genes potentially involved in cold acclimation. 3 Biotech. 2018, 8, 195. [Google Scholar] [CrossRef] [PubMed]
  52. Yuan, Y.; Jin, X.; Liu, J.; Zhao, X.; Zhou, J.; Wang, X.; Wang, D.; Lai, C.; Xu, W.; Huang, J.; et al. The Gastrodia elata genome provides insights into plant adaptation to heterotrophy. Nat. Commun. 2018, 9, 1615. [Google Scholar] [CrossRef]
  53. Mistry, J.; Chuguransky, S.; Williams, L.; Qureshi, M.; Salazar, G.A.; Sonnhammer, E.L.L.; Tosatto, S.C.E.; Paladin, L.; Raj, S.; Richardson, L.J.; et al. Pfam: The protein families database in 2021. Nucleic Acids Res. 2021, 49, D412–D419. [Google Scholar] [CrossRef] [PubMed]
  54. Goodstein, D.M.; Shu, S.; Howson, R.; Neupane, R.; Hayes, R.D.; Fazo, J.; Mitros, T.; Dirks, W.; Hellsten, U.; Putnam, N.; et al. Phytozome: A comparative platform for green plant genomics. Nucleic Acids Res. 2012, 40, D1178–D1186. [Google Scholar] [CrossRef]
  55. Altschul, S.F.; Gish, W.; Miller, W.; Myers, E.W.; Lipman, D.J. Basic local alignment search tool. J. Mol. Biol. 1990, 215, 403–410. [Google Scholar] [CrossRef] [PubMed]
  56. Gasteiger, E.; Hoogland, C.; Gattiker, A.; Duvaud, S.; Wilkins, M.R.; Appel, R.D.; Bairoch, A. Protein Identification and Analysis Tools on the Expasy Server. In The Proteomics Protocols Handbook; John, M.W., Ed.; Humana Press: Totowa, NJ, USA, 2005; pp. 571–607. [Google Scholar]
  57. Horton, P.; Park, K.J.; Obayashi, T.; Fujita, N.; Harada, H.; Adams-Collier, C.J.; Nakai, K. WoLF PSORT: Protein localization predictor. Nucleic Acids Res. 2007, 35, W585–W587. [Google Scholar] [CrossRef]
  58. Lescot, M.; Déhais, P.; Thijs, G.; Marchal, K.; Moreau, Y.; Van de Peer, Y.; Rouzé, P.; Rombauts, S. PlantCARE, a database of plant cis–acting regulatory elements and a portal to tools for in silico analysis of promoter sequences. Nucleic Acids Res. 2002, 30, 325–327. [Google Scholar] [CrossRef] [PubMed]
  59. Chen, C.; Wu, Y.; Li, J.; Wang, X.; Zeng, Z.; Xu, J.; Liu, Y.; Feng, J.; Chen, H.; He, Y.; et al. TBtools-II: A “one for all, all for one” bioinformatics platform for biological big-data mining. Mol. Plant 2023, 16, 1733–1742. [Google Scholar] [CrossRef]
  60. Xie, J.; Chen, Y.; Cai, G.; Cai, R.; Hu, Z.; Wang, H. Tree Visualization By One Table (tvBOT): A web application for visualizing, modifying and annotating phylogenetic trees. Nucleic Acids Res. 2023, 51, W587–W592. [Google Scholar] [CrossRef]
  61. Szklarczyk, D.; Kirsch, R.; Koutrouli, M.; Nastou, K.; Mehryary, F.; Hachilif, R.; Gable, A.L.; Fang, T.; Doncheva, N.T.; Pyysalo, S.; et al. The STRING database in 2023: Protein-protein association networks and functional enrichment analyses for any sequenced genome of interest. Nucleic Acids Res. 2023, 51, D638–D646. [Google Scholar] [CrossRef]
  62. Kruger, N.J. The Bradford method for protein quantitation. Methods Mol. Biol. 1994, 32, 9–15. [Google Scholar] [CrossRef] [PubMed]
  63. Sun, H.Y.; Tian, Y.; Yu, D.Q.; Wang, R.; Pei, J.J.; Chen, C.; Li, X.S. Effects of different treatments on the expression of enzymes related to storage softening of fresh-cut Gastrodia elata. Jiangsu Agric. Sci. 2022, 50, 198–205. [Google Scholar] [CrossRef]
  64. Yuan, M. Characteristics of Specific Microbial Community in the Rhizosphere of Continuous Cropping Salvia miltiorrhiza Bge. Based on 13C Stable Isotope Nucleic Acid Probe Technology. Master’s Thesis, Shandong University of Traditional Chinese Medicine, Jinan, China, 2023. [Google Scholar]
Figure 1. Gene structure and conserved structural domains of the GeGAPDH family in G. elata. (A) Gene structure of the GeGAPDH family of G. elata. (B) Distribution of conserved structural domains of the GeGAPDH family. (C) Seven conserved structural domains in the GeGAPDH family. Conserved domains are shown in yellow boxes.
Plants 14 01866 g001
Figure 2. Phylogenetic tree of GAPDH family. Phylogenetic trees were constructed using 33 GAPDH protein sequences from different species. Phylogenetic analyses were performed using maximum likelihood and 1000 bootstrap replicates. The GAPDH family is divided into four subgroups (Group I–Group IV) and is distinguished by different colors. Different species are represented by different symbols.
Plants 14 01866 g002
Figure 3. Chromosomal localization and collinearity analysis of the GeGAPDH family in G. elata. (A) Chromosomal localization of the GeGAPDH family. (B) Collinearity analysis of the GAPDH families among A. thaliana, G. elata and O. sativa. The red triangle is the location of the GeGAPDH1 gene.
Plants 14 01866 g003
Figure 4. Cis-acting elements of the GeGAPDH family in G. elata. (A) Types of cis-acting elements of the GeGAPDH family. The intensity of the color represents the number of cis-acting elements. (B) Distribution of cis-acting elements of the GeGAPDH family.
Plants 14 01866 g004
Figure 5. The protein–protein interactions (PPI) of GAPDH proteins in G. elata. (AC) Predicted protein interaction network of three GeGAPDH proteins. (D) No interactions were predicted among the three GeGAPDH proteins using identical parameters. Edges represent functional associations between proteins, indicating their potential involvement in shared biological processes. Edge colors indicate different prediction types.
Plants 14 01866 g005
Figure 6. The Gene cloning results of GeGAPDH1. RG is the reference gene sequence, and RP is the corresponding protein sequence of the reference gene. S is the result of sequencing, and the red dashed line box is the location of the base mutation. P is the protein sequence corresponding to the sequencing result.
Plants 14 01866 g006
Figure 7. SDS-PAGE, concentration and GAPDH activity detection. (A) The protein expression of GeGAPDH1. (B) The protein expression of empty vector. M: protein marker (11~180 kDa); CK: non-induced bacterial solution; T: total protein; S: supernatant after crushing; P: precipitation after crushing; FT: flow-through after incubation binding; W1–W3, washing solution 1–3; E1–E3, protein elution solution 1–3 The predicted molecular mass of the target protein is labeled on the right side of the gel graph. (C) The concentration of protein P was the total protein, GeGAPDH1 was the purified protein of GeGAPDH1, and the control was the purified protein of the empty vector. n = 3 technical replicates. (D) The results of GAPDH1 activity assay. n = 3 technical replicates. (E) Reactions occurring in enzyme activity assays. In this reaction, GAPDH catalyzes BPGA and NADH to G3P and NAD+. The decrease of NADH measured at 340 nm can reflect the level of GAPDH activity. Consumption of 1 nmol of NADH per minute per mg of protein was defined as one unit of enzyme activity.
Plants 14 01866 g007
Figure 8. Bidirectional enzyme activity and kinetic characterization of GeGAPDH1. (A) The phosphorylation reaction uses G3P as a substrate to generate NADH. (B) The dephosphorylation reaction using BPGA as a substrate consumes NADH. (C) Michaelis-Menten kinetic analysis of GeGAPDH1 with varying G3P concentrations.
Plants 14 01866 g008
Figure 9. Subcellular localization of GeGAPDH1. (A) The fusion vector pCAMBIA1300-35S-GeGAPDH1-EGFP is transiently expressed in N. benthamiana. (B) The empty vector pCAMBIA1300-35S-EGFP is transiently expressed in N. benthamiana. GFP represents the green fluorescence field, CHI represents the chloroplast spontaneous fluorescence field, DIC represents the bright field, and Merge represents the superposition field. GFP field: excitation 488 nm, emission 500–550 nm; CHI field: excitation 488 nm, emission 650–750 nm. Scale bar = 20 µm.
Plants 14 01866 g009
Figure 10. Relative expression of GeGAPDH genes in different tissues. The X-axis represents different tissues, and the Y-axis represents the relative expression levels normalized to the expression values of the tuber. Error bars represent the standard error. Significant differences are indicated as follows: ns, non-significant; * p < 0.05; ** p < 0.01; *** p < 0.001; **** p < 0.0001. Values represent means ± SD (n = 3).
Plants 14 01866 g010
Figure 11. Relative expression of GeGAPDH family in G. elata under low-temperature stress. (AC) Relative expression levels of GeGAPDH genes were treated at different temperatures on day 7. (DF) Relative expression levels of GeGAPDH genes were treated at different temperatures on day 14. The X-axis represents different temperatures, and the Y-axis represents the relative expression levels normalized to the expression values of 24 °C. Error bars represent the standard error. Significant differences are indicated as follows: ns, non-significant; * p < 0.05; ** p < 0.01; *** p < 0.001; **** p < 0.0001. Values represent means ± SD (n = 4).
Plants 14 01866 g011
Figure 12. Relative expression of GeGAPDH family in G. elata under Fusarium stress. (A) Healthy control: G. elata treated with PDA medium for 7 days; (B,C) G. elata were infected by F. oxysporum (B) and F. solani (C) for 7 days, respectively, showing typical symptoms of brown rot. (DF) Relative expression levels of GeGAPDH genes under pathogen stress for 7 days. Health represents the healthy control group, Fo represents the results of F. oxysporum infection, and Fs represents the results of F. solani infection. The X-axis represents different fungal pathogen treatments; the Y-axis represents relative expression levels normalized to the expression values of healthy G. elata. Error bars represent the standard error. Significant differences are indicated as follows: ns, non-significant; * p < 0.05; ** p < 0.01. Values represent means ± SD (n = 4).
Plants 14 01866 g012
Figure 13. GAPDH enzyme activity under low temperature and Fusarium stress. (A) The results of GAPDH enzyme activity assay under low-temperature stress for 7 days. (B) The results of GAPDH enzyme activity assay under low-temperature stress for 14 days. (C) The results of GAPDH enzyme activity assay exposed to Fusarium stress for 7 days. Health represents the healthy control group, Fo represents the results of F. oxysporum infection, and Fs represents the results of F. solani infection. Error bars represent the standard error. Significant differences are indicated as follows: ns, non-significant; * p < 0.05. Values represent means ± SD (n = 4).
Plants 14 01866 g013
Table 1. Physicochemical characterization and subcellular localization of the GeGAPDH family in G. elata.
Gene NameGene IDNumber of Amino
Acids
Molecular MassTheoretical pIInstability Index 1Grand Average of Hydropathicity 2Subcellular Prediction
GeGAPDH1GWHGBHOU00348842845,867.018.5137.51−0.106plastid
GeGAPDH2GWHGBHOU00756434437,088.647.6826.75−0.01cytoplasm
GeGAPDH3GWHGBHOU00757234437,088.647.6826.75−0.01cytoplasm
1 The instability index provides an estimate of the protein stability. A protein whose instability index is smaller than 40 is predicted as stable; a value above 40 predicts that the protein may be unstable; 2 The grand average of hydropathy value for a peptide or protein is calculated as the sum of hydropathy values [36] of all the amino acids, divided by the number of residues in the sequence.
Disclaimer/Publisher’s Note: The statements, opinions and data contained in all publications are solely those of the individual author(s) and contributor(s) and not of MDPI and/or the editor(s). MDPI and/or the editor(s) disclaim responsibility for any injury to people or property resulting from any ideas, methods, instructions or products referred to in the content.

