
Selenium Alleviates Cadmium Toxicity by Regulating Carbon Metabolism, AsA-GSH Cycle, and Cadmium Transport in Glycyrrhiza uralensis Fisch. Seedlings


Abstract
1. Introduction
2. Materials and Methods
2.1. Plant Materials and Experimental Design
2.2. Measurement of Plant Growth Parameters
2.3. Determination of K+, Ca2+, Fe2+, Mg2+, S2−, Se2+, and Cd2+ Concentrations
2.4. Assessment of MDA Levels
2.5. Assessment of GSH Levels
2.6. Total RNA Isolation and Illumina Sequencing
2.7. Differentially Expressed Gene Analysis
2.8. Statistical Analysis
3. Results
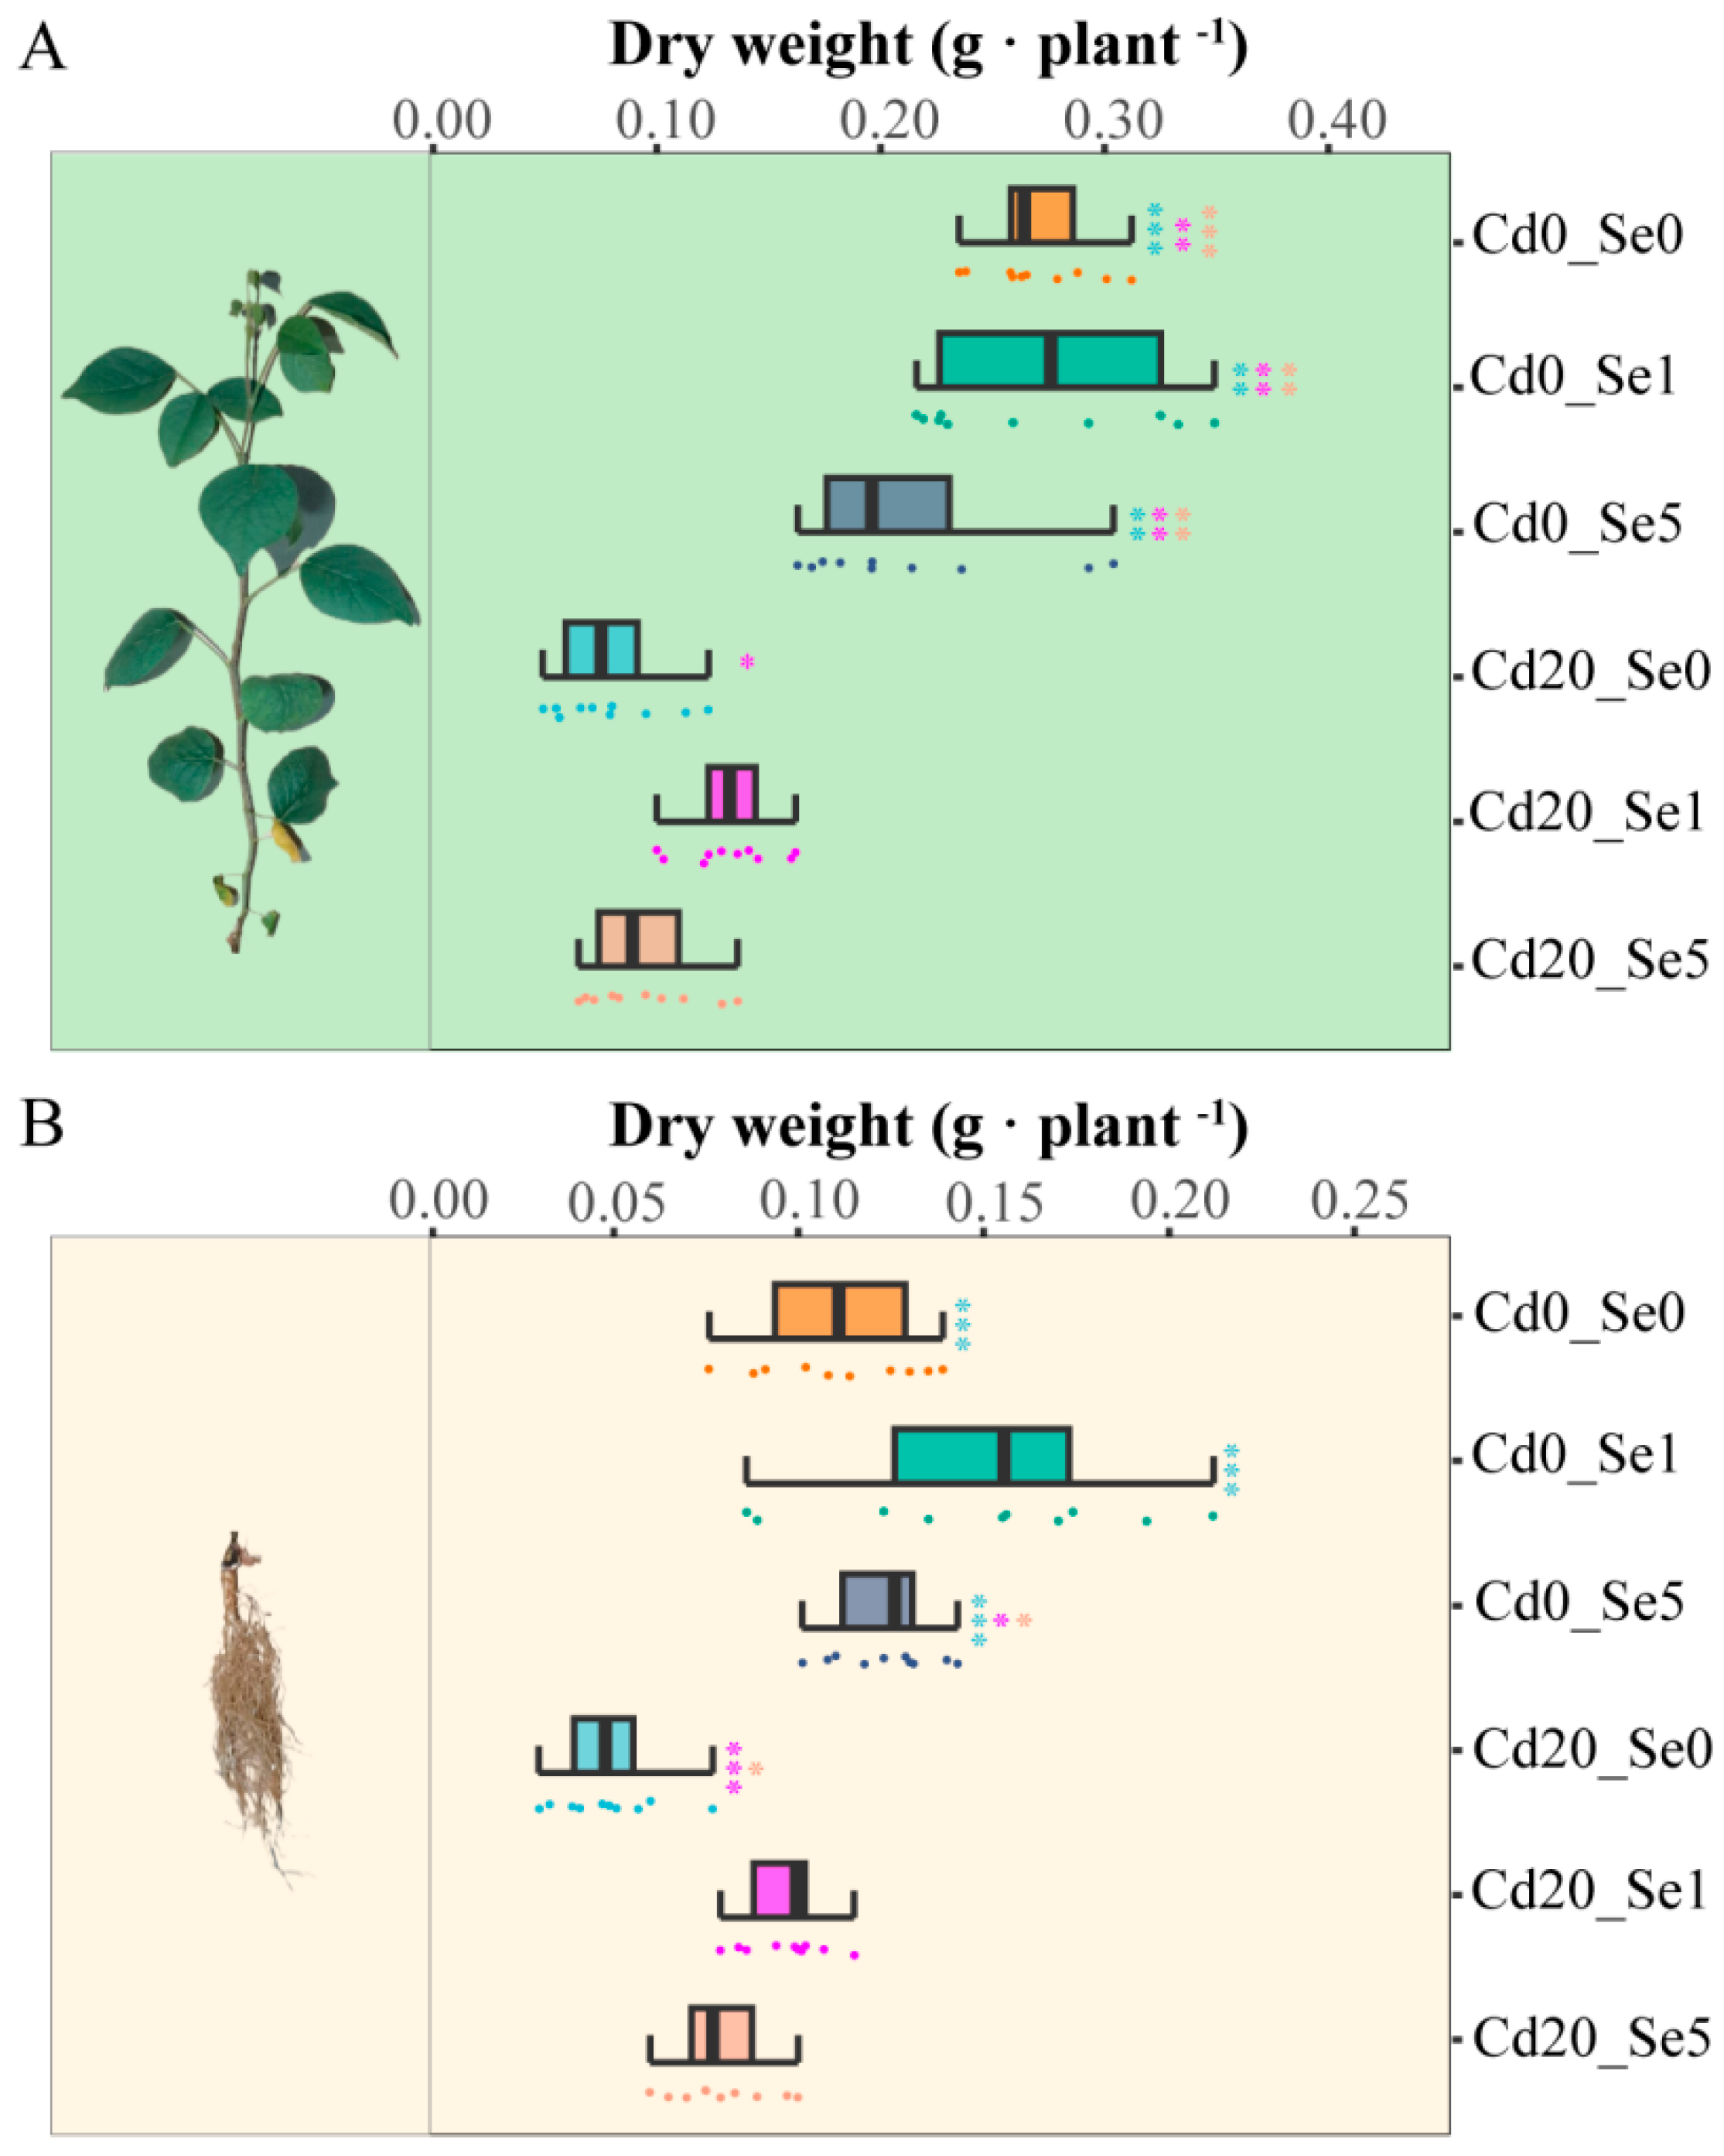
3.1. Effects of Se Application on the Growth of G. uralensis Seedlings Under Cd Stress
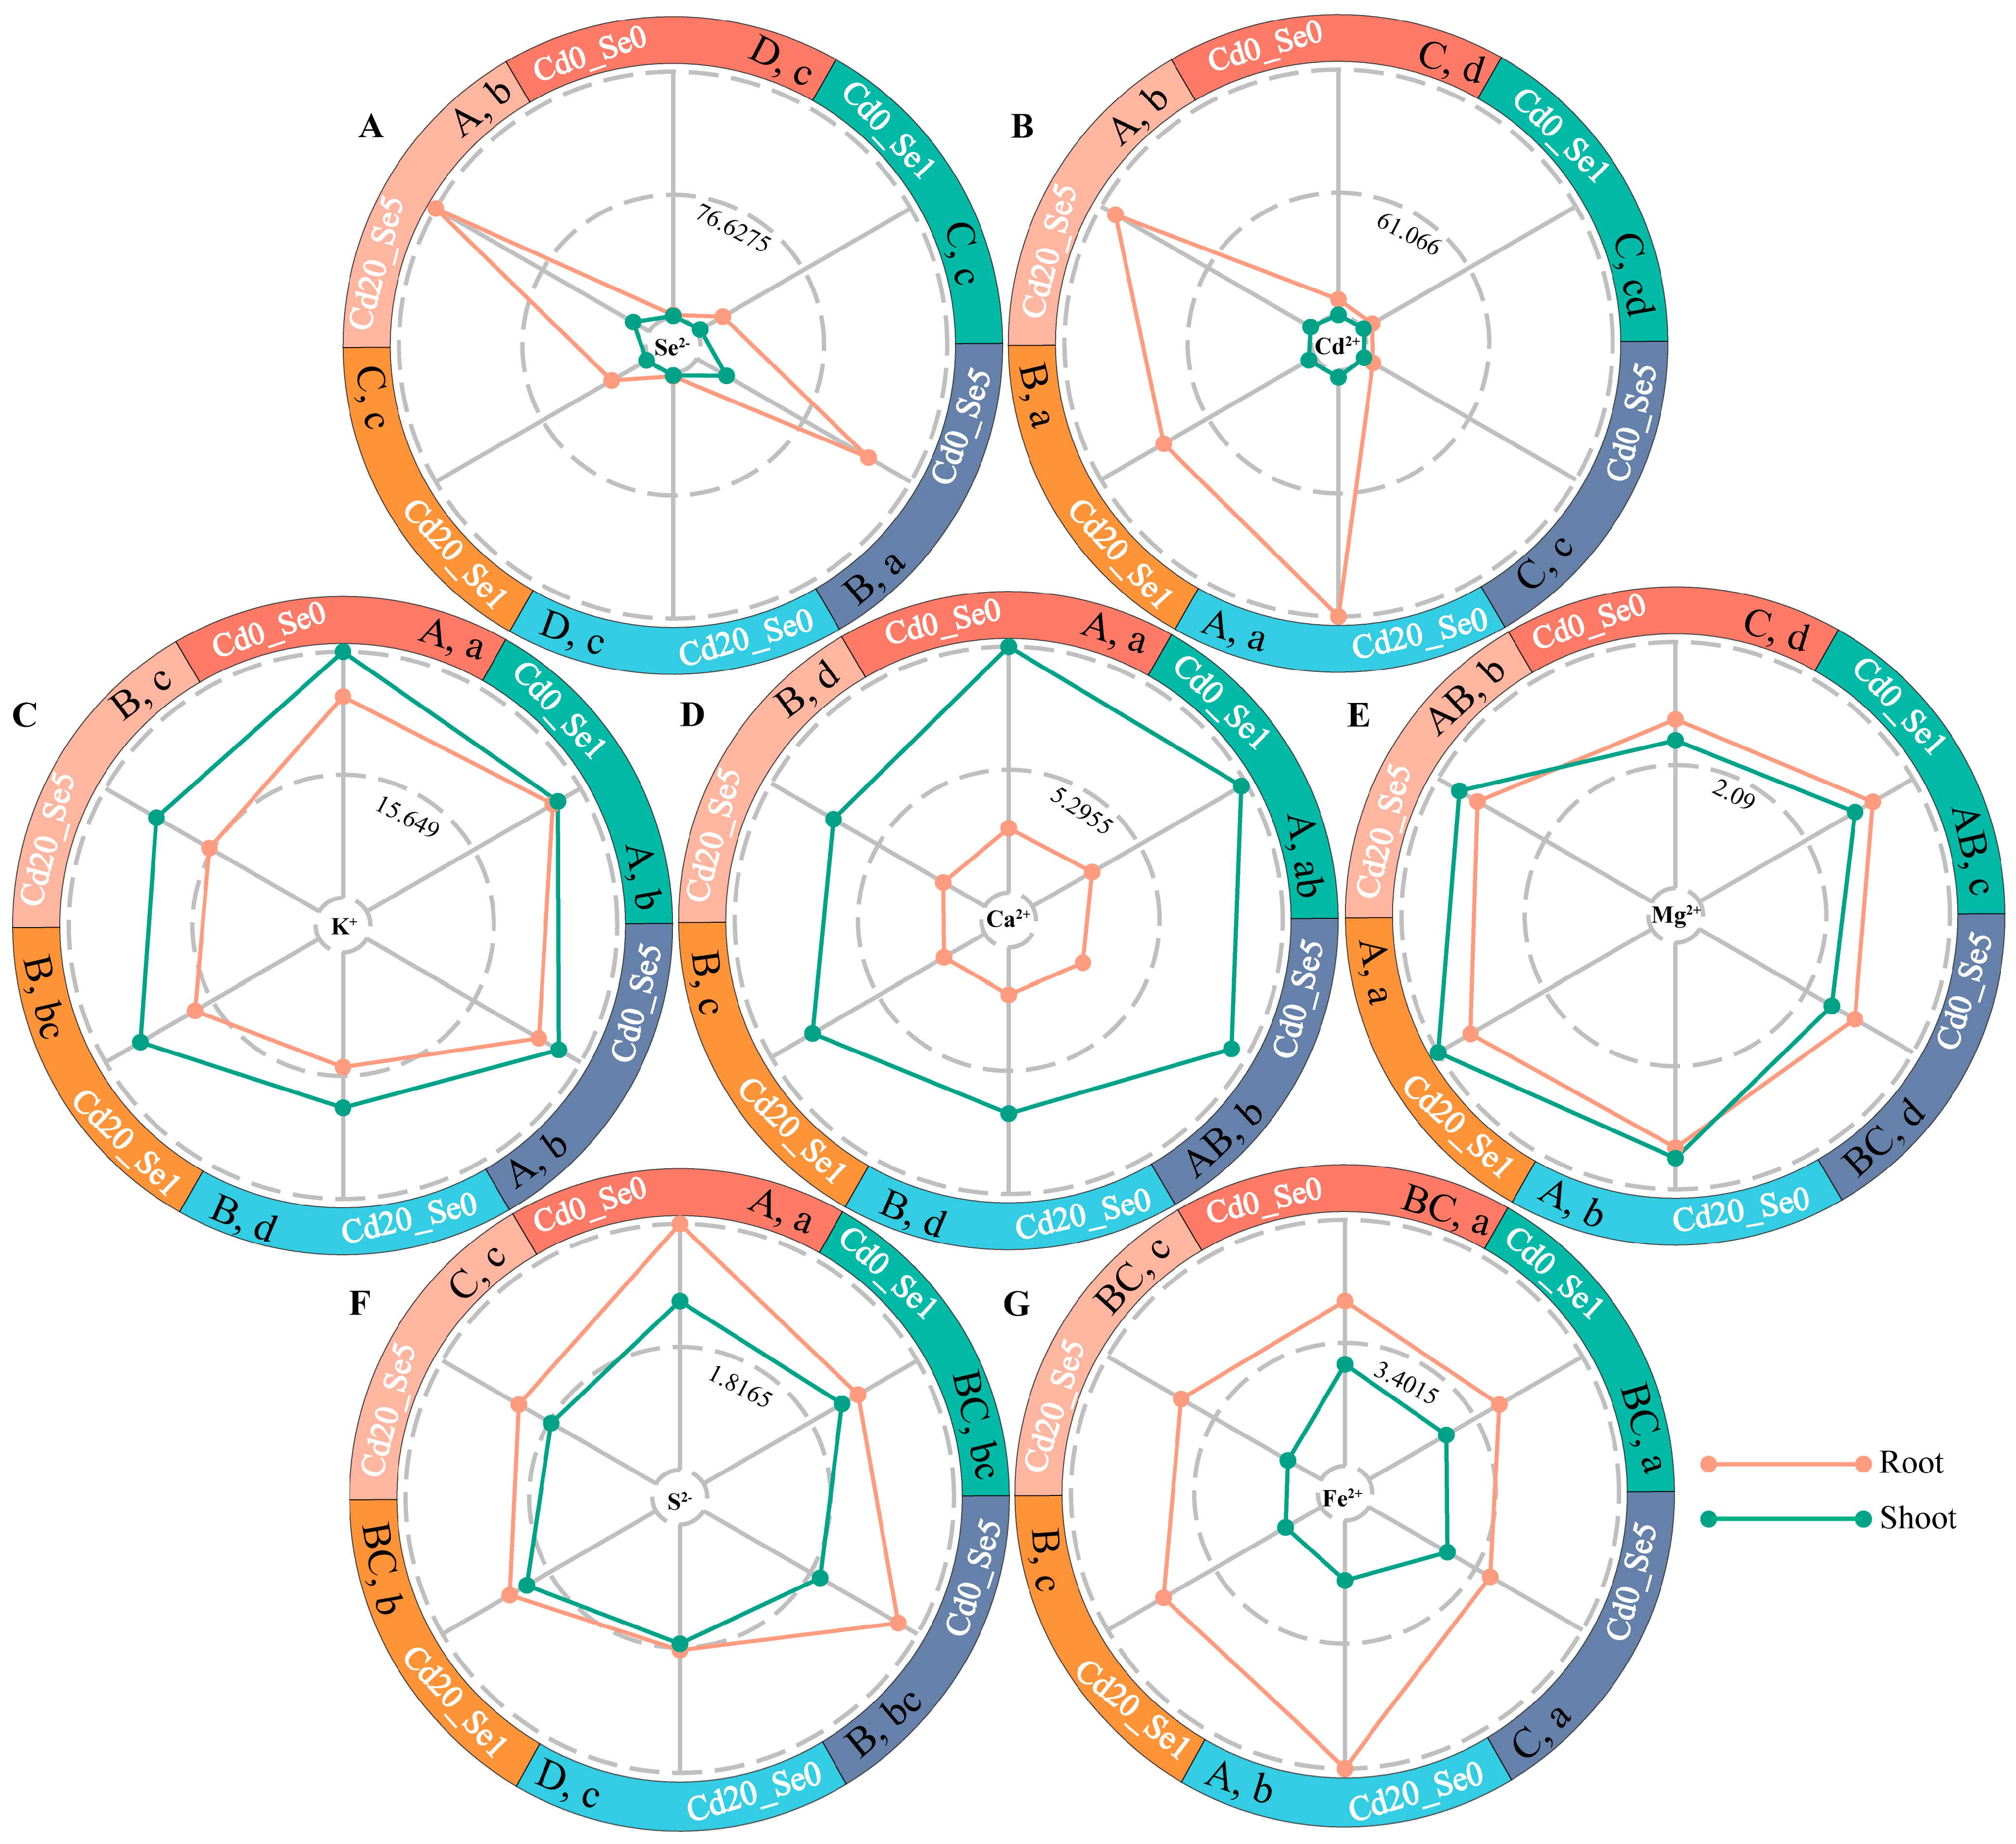
3.2. Effects of Se Application on Cd and Mineral Element Absorption of G. uralensis Seedlings Under Cd Stress
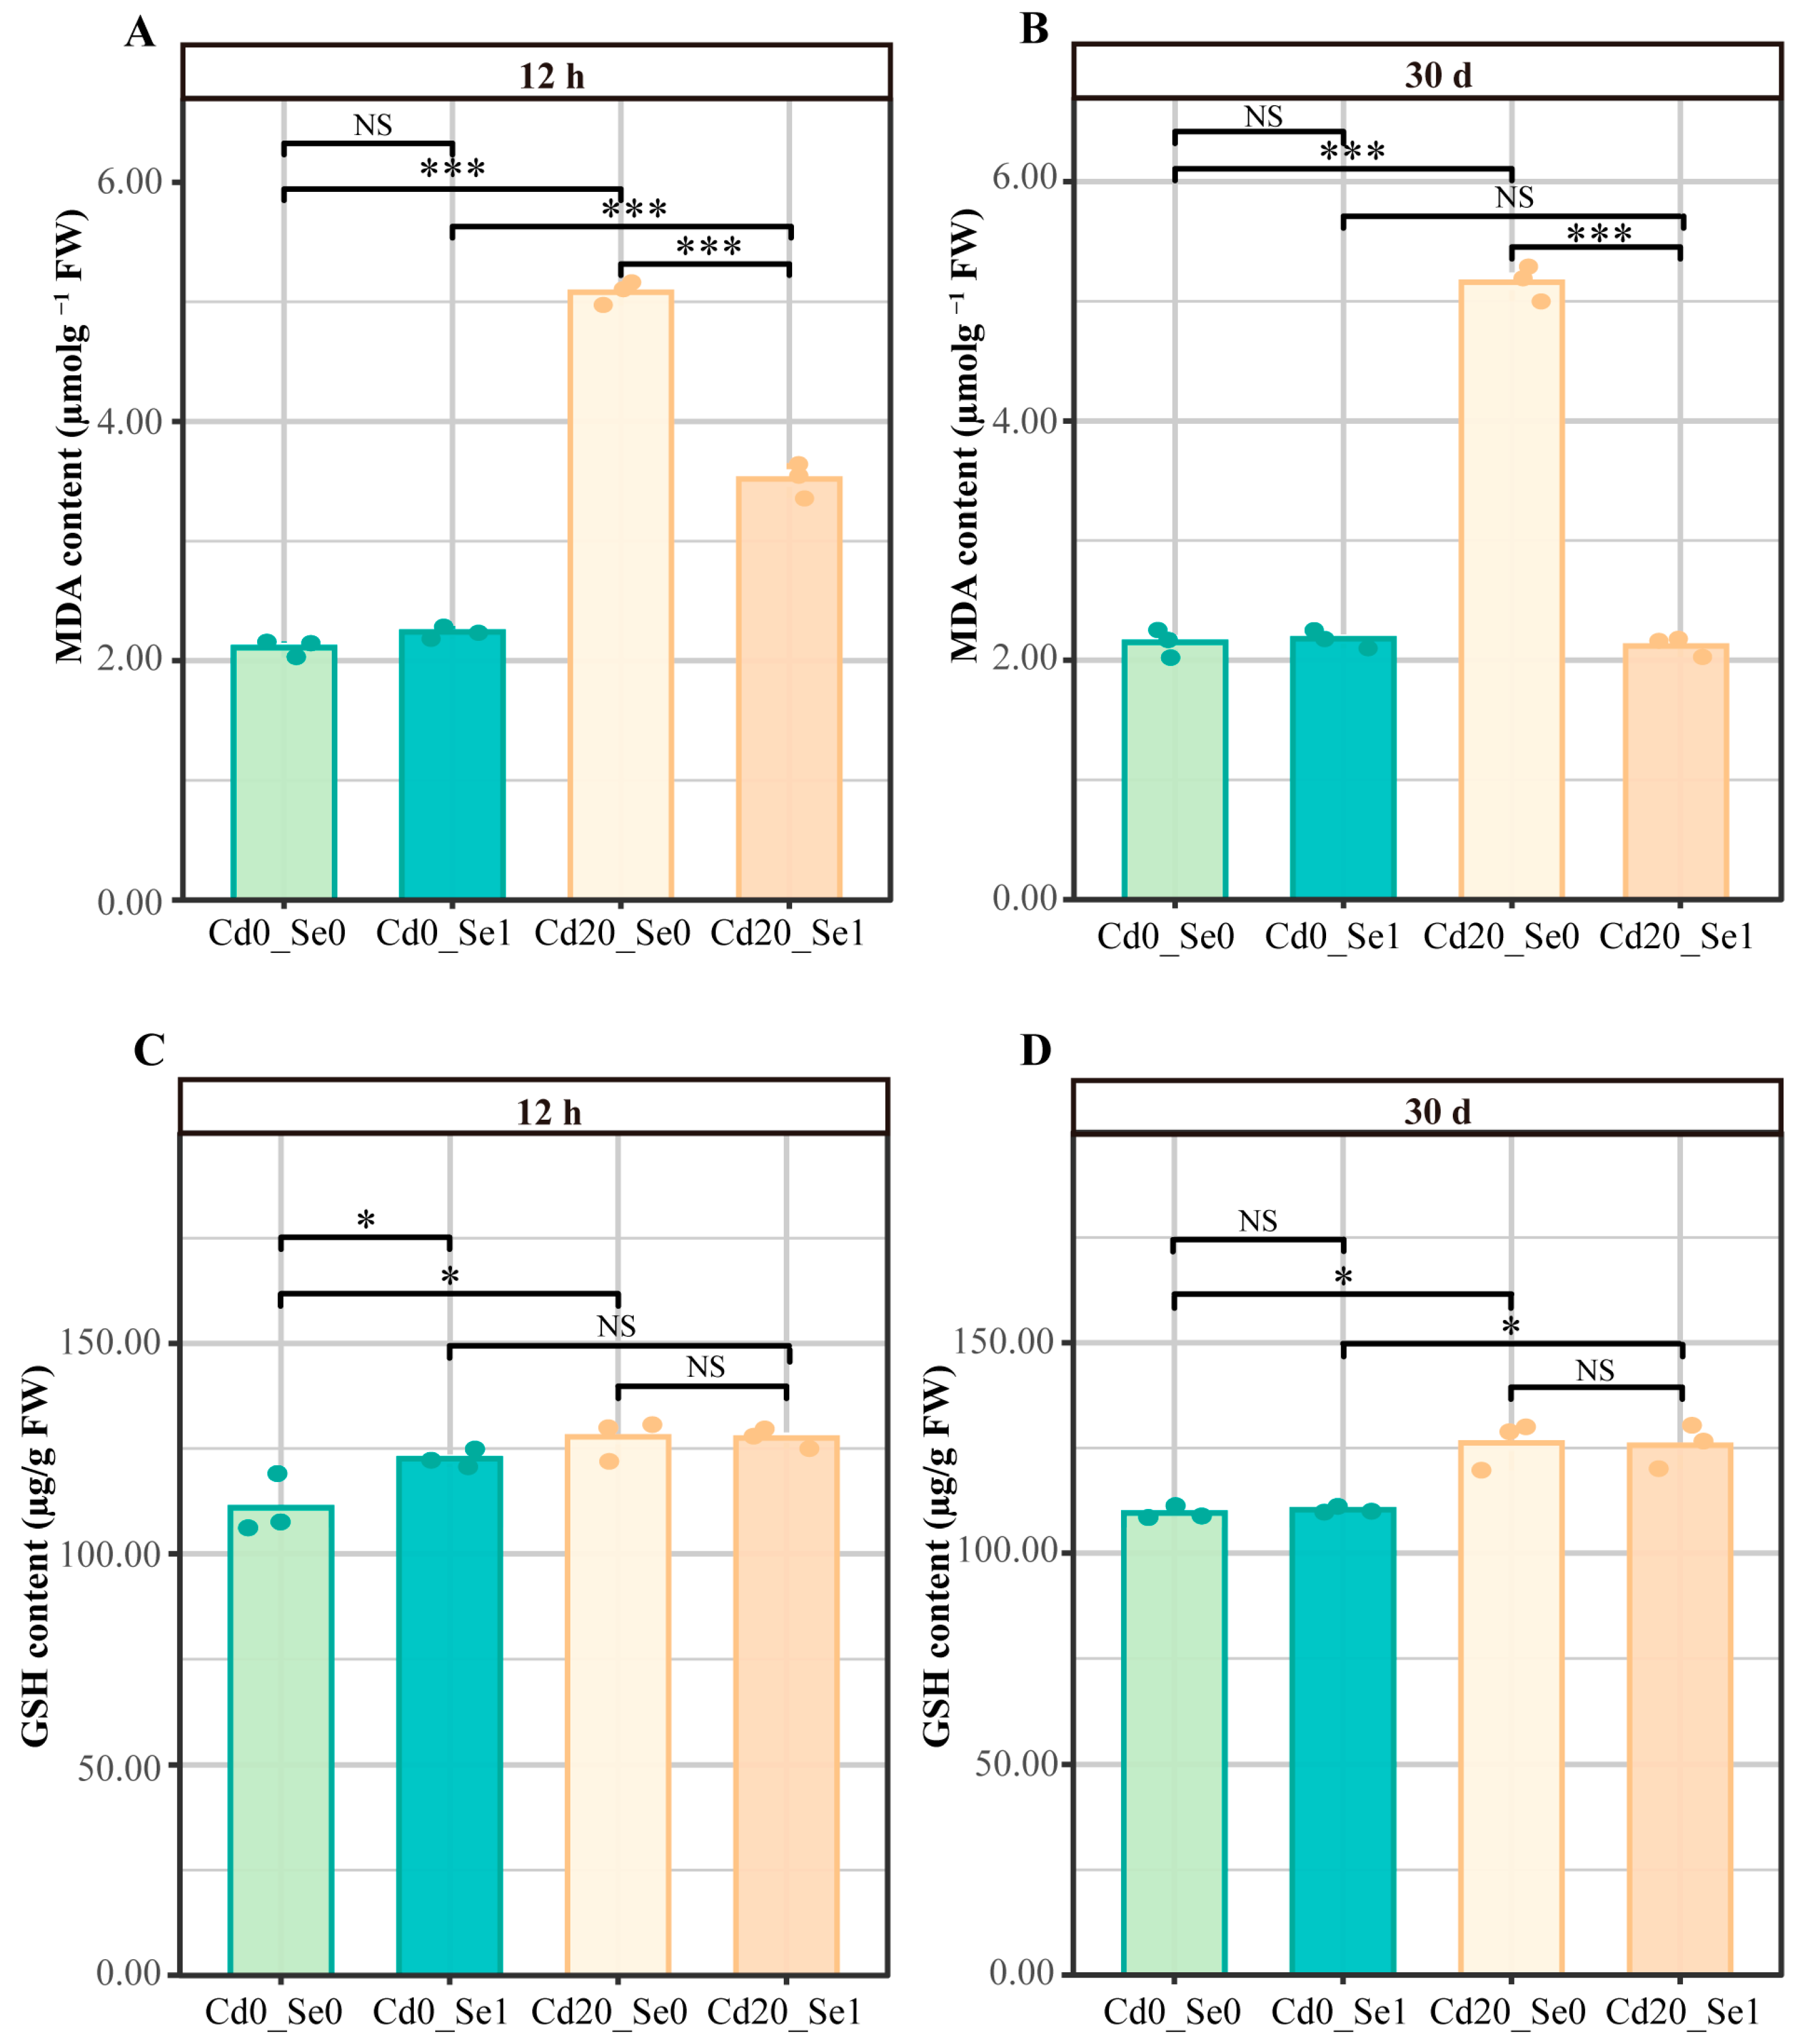
3.3. Effects of Se Application on MDA and GSH Contents in G. uralensis Seedlings Under Cd Stress
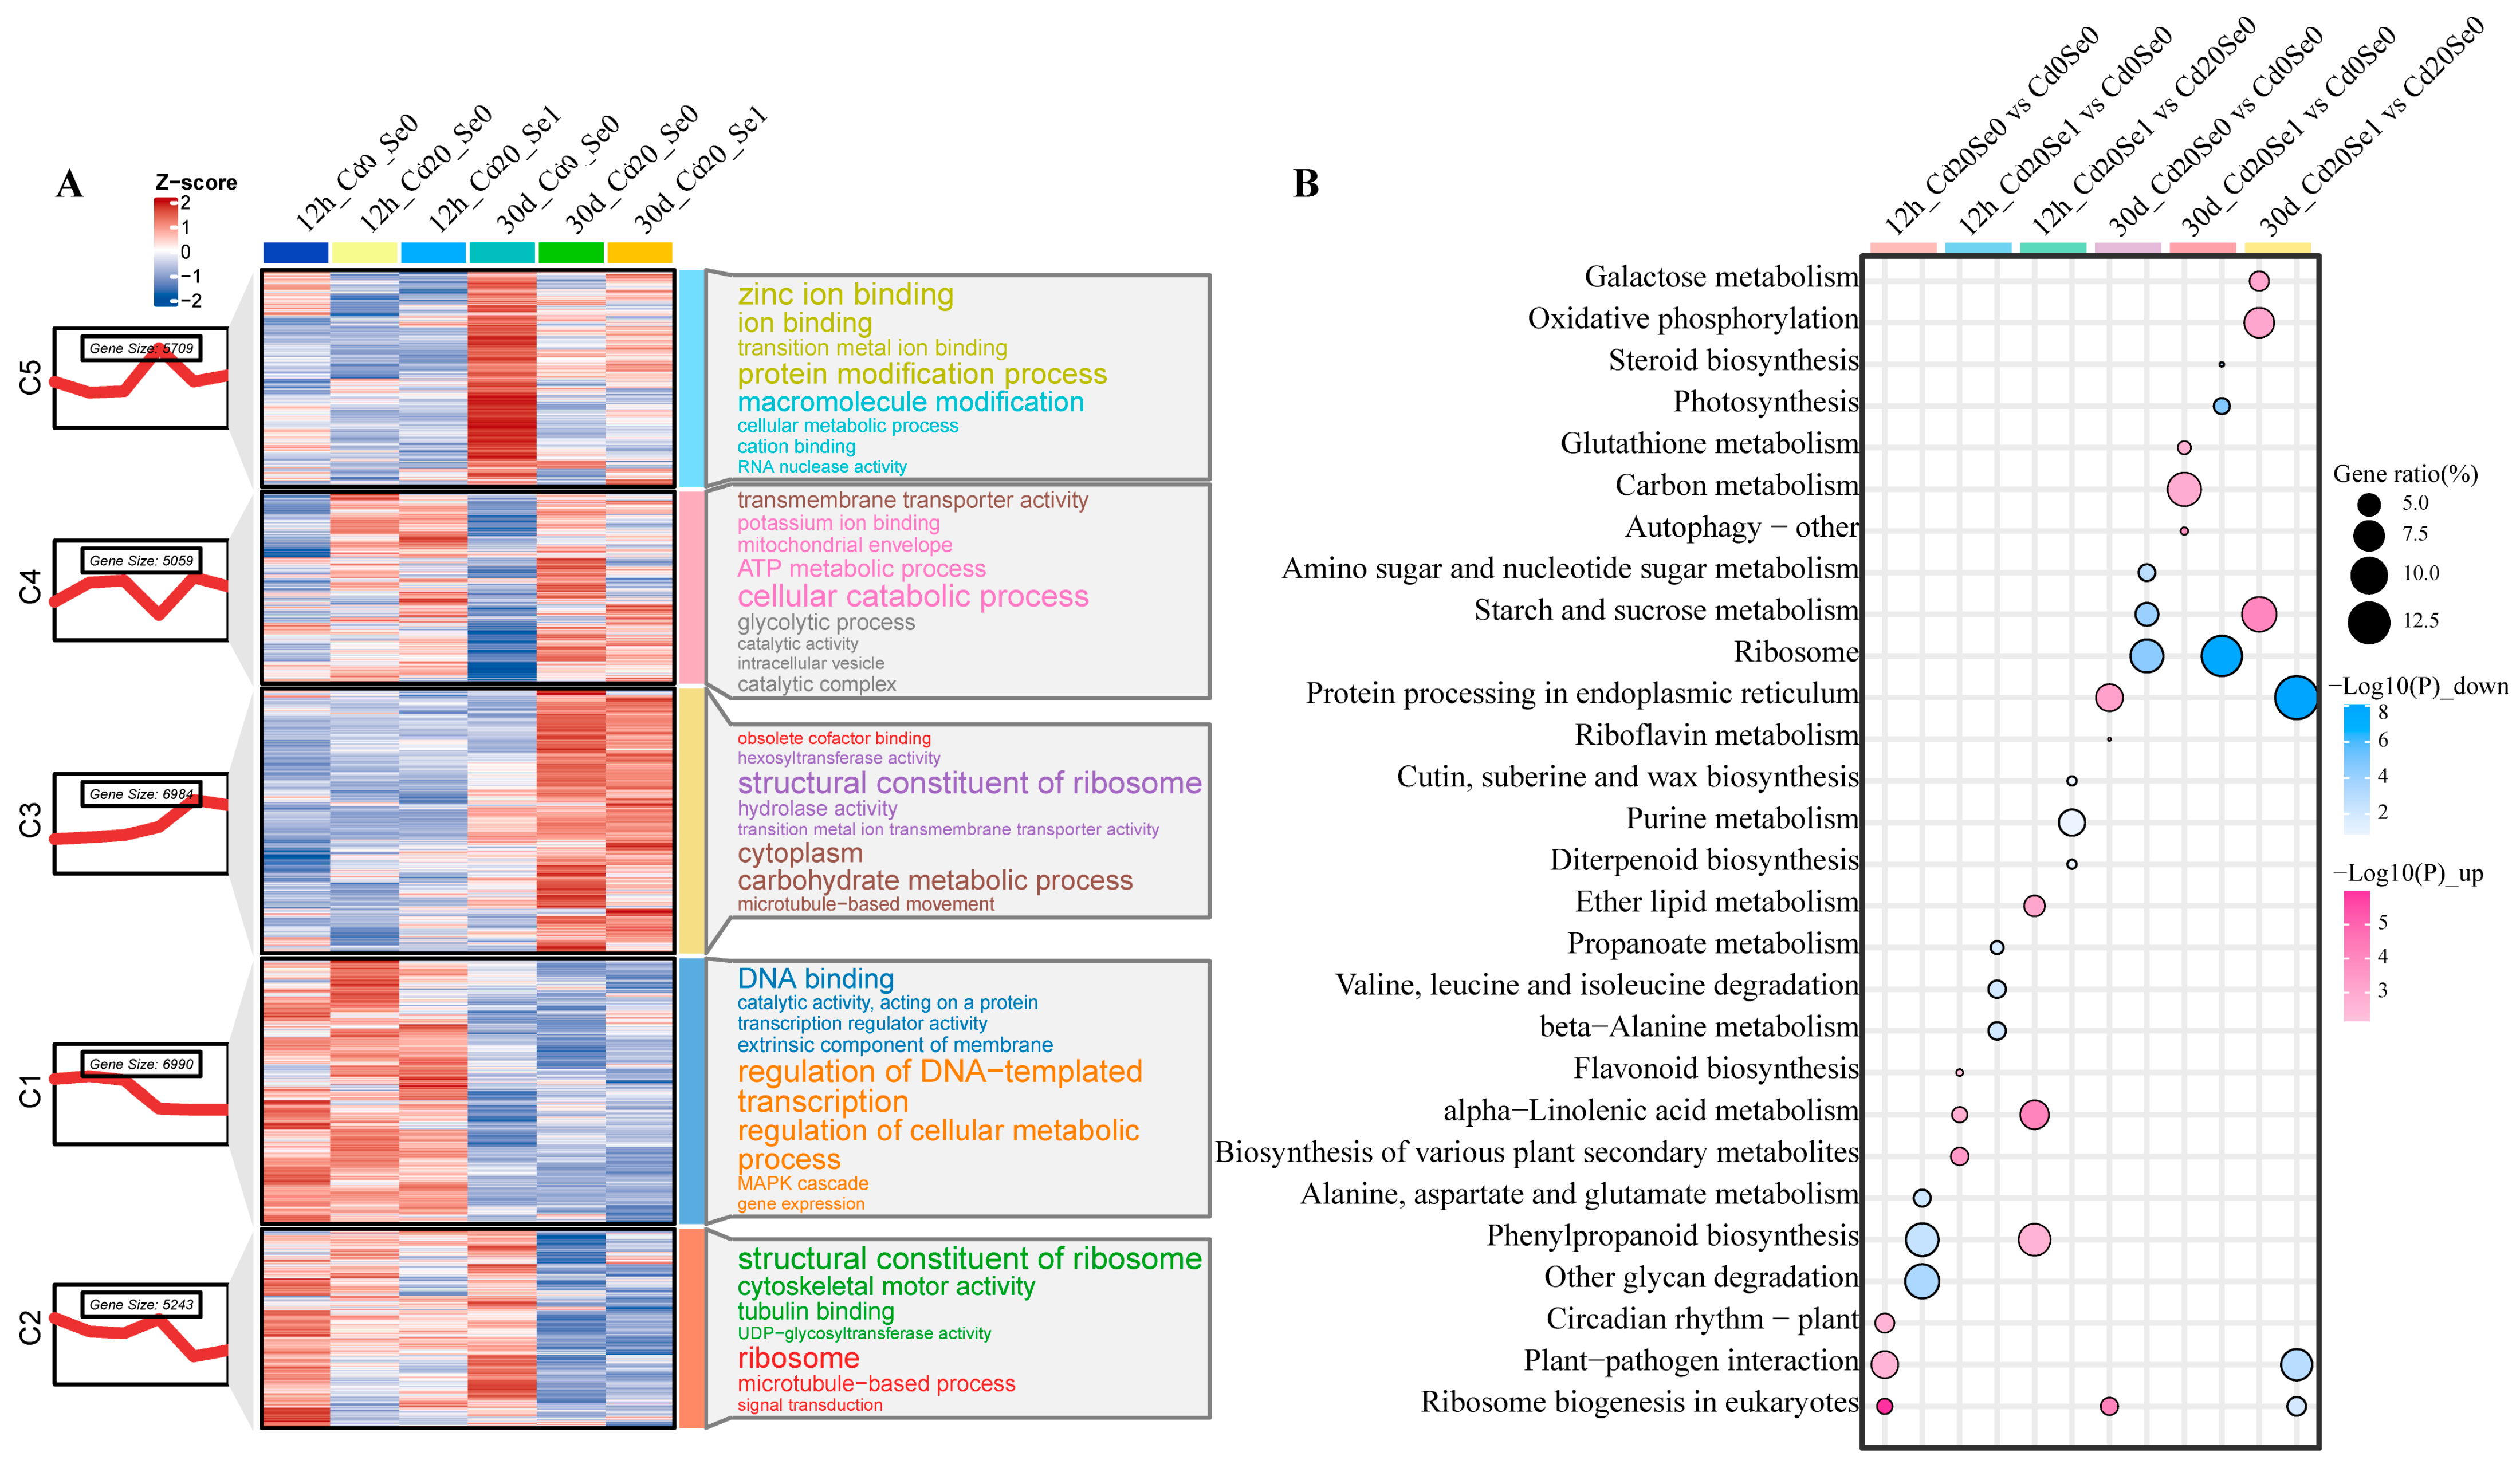
3.4. Overview of DEGs
3.5. Mfuzz Analysis
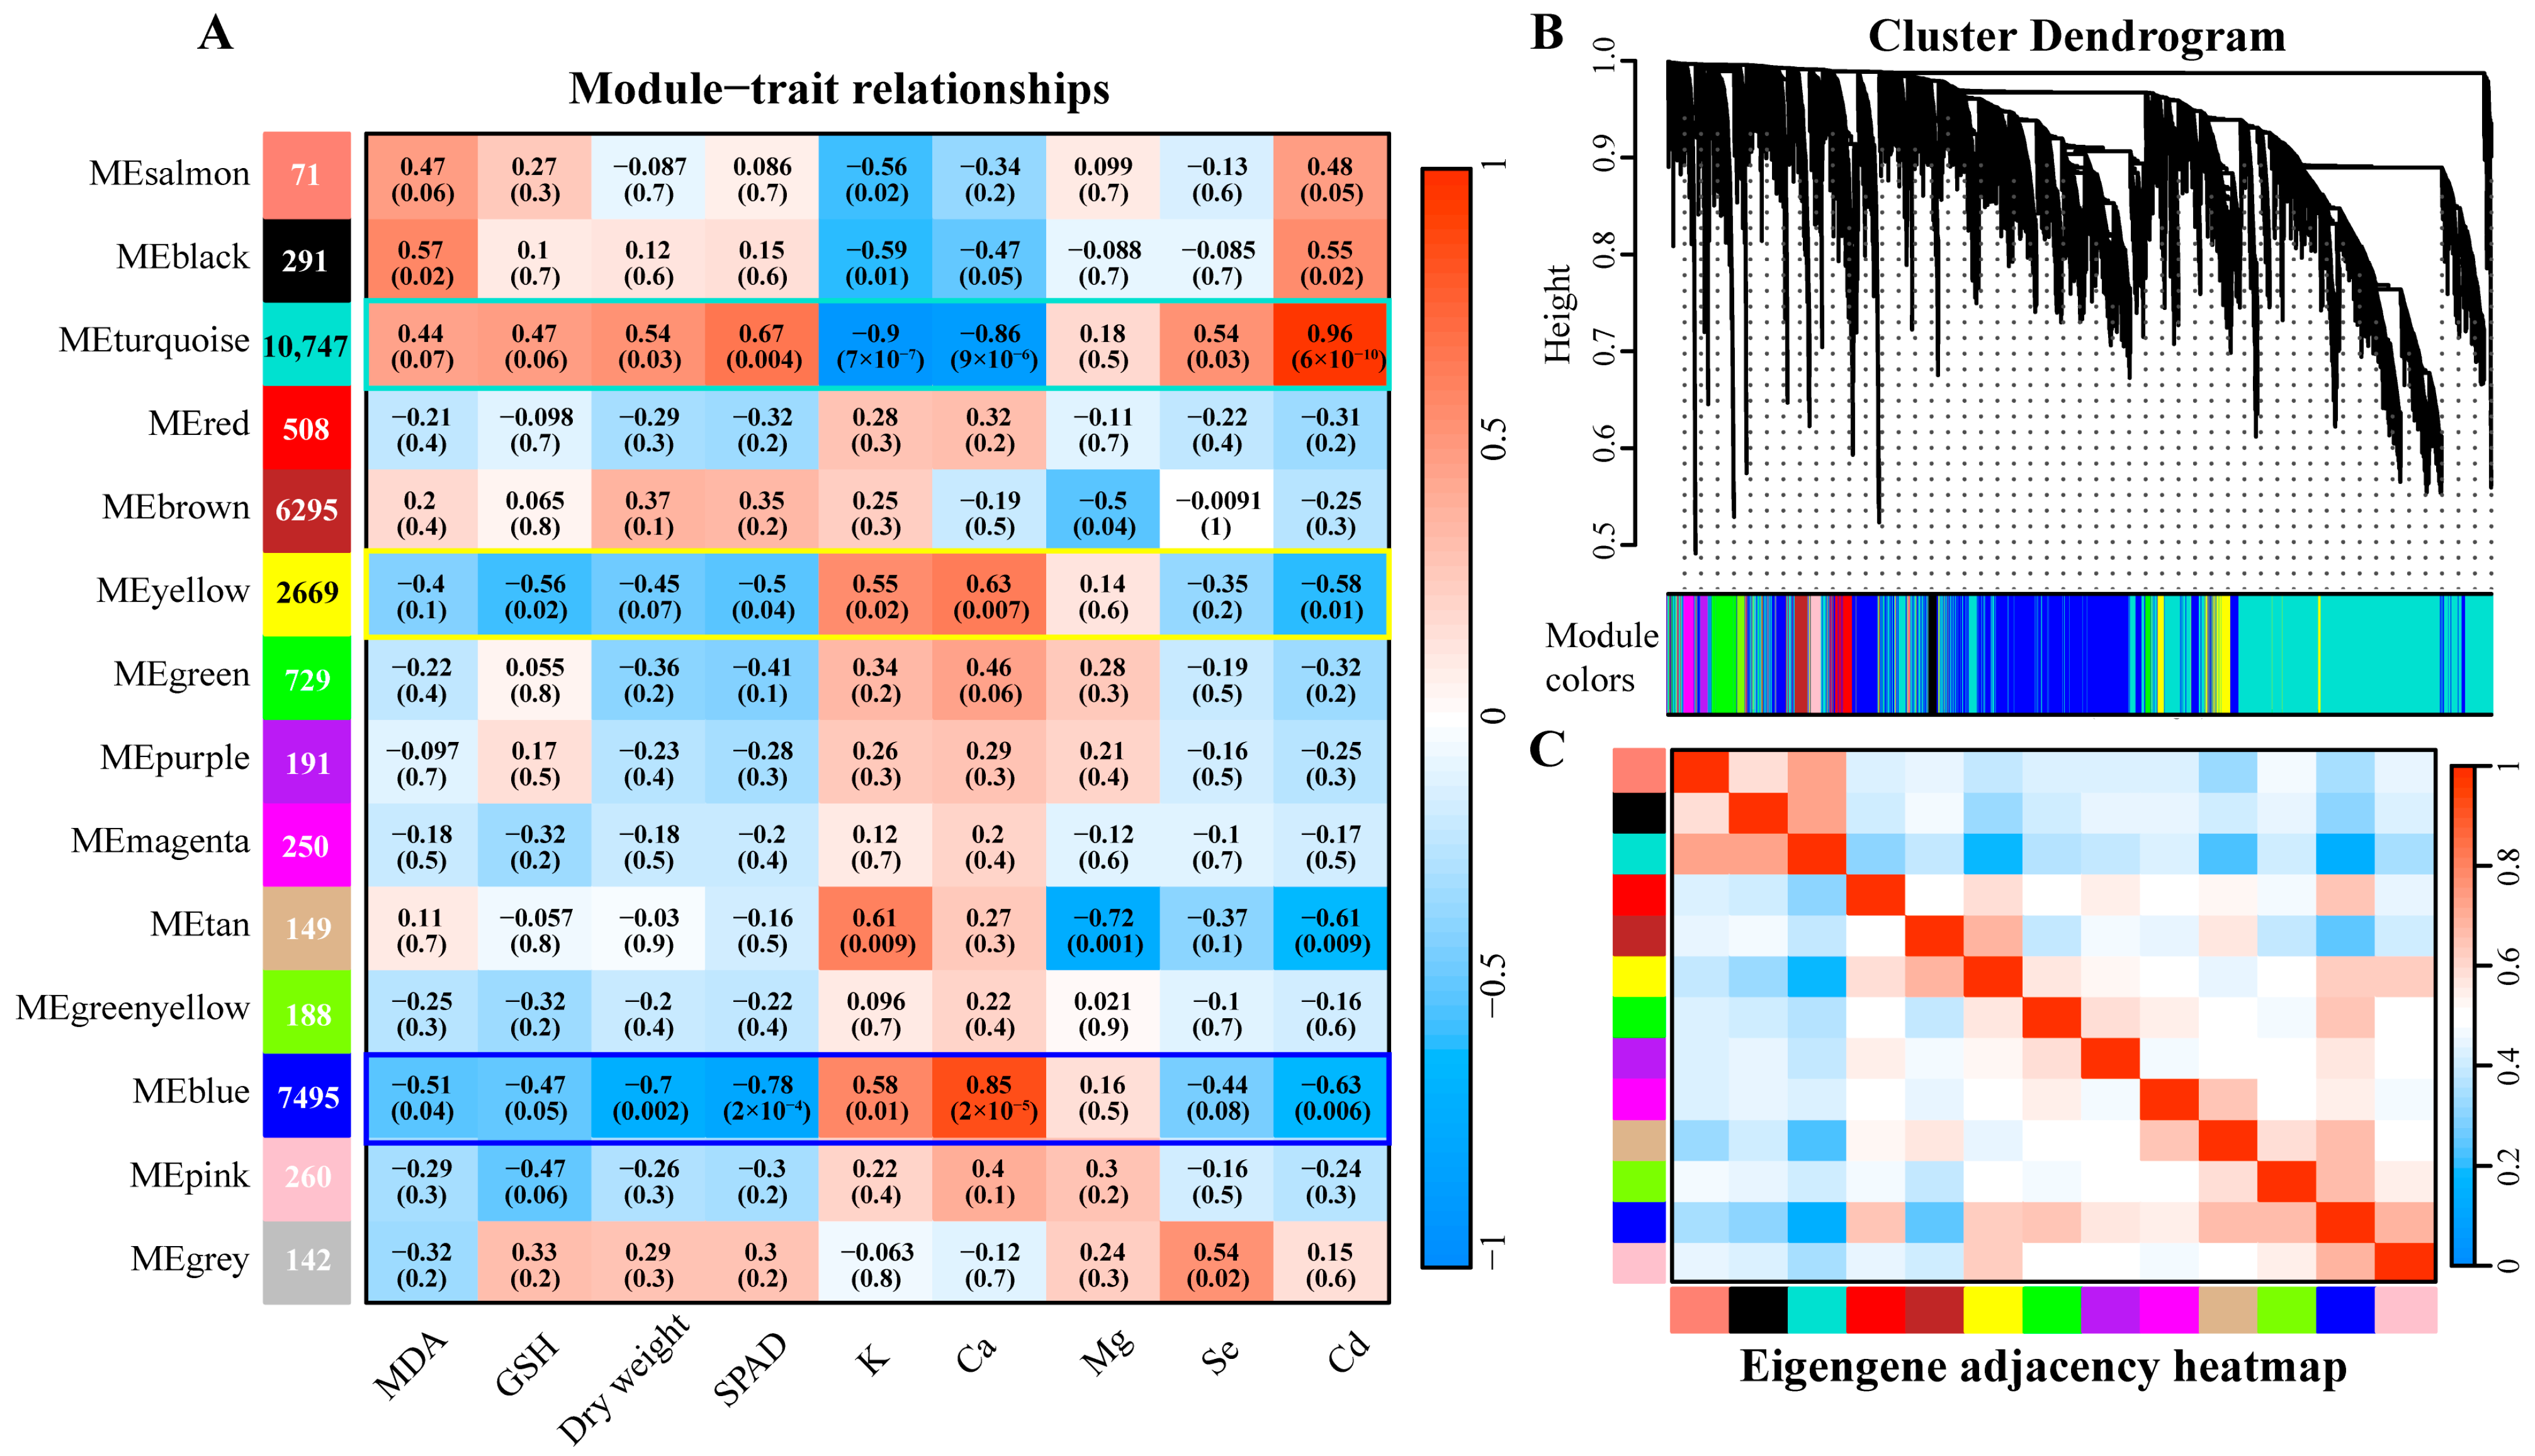
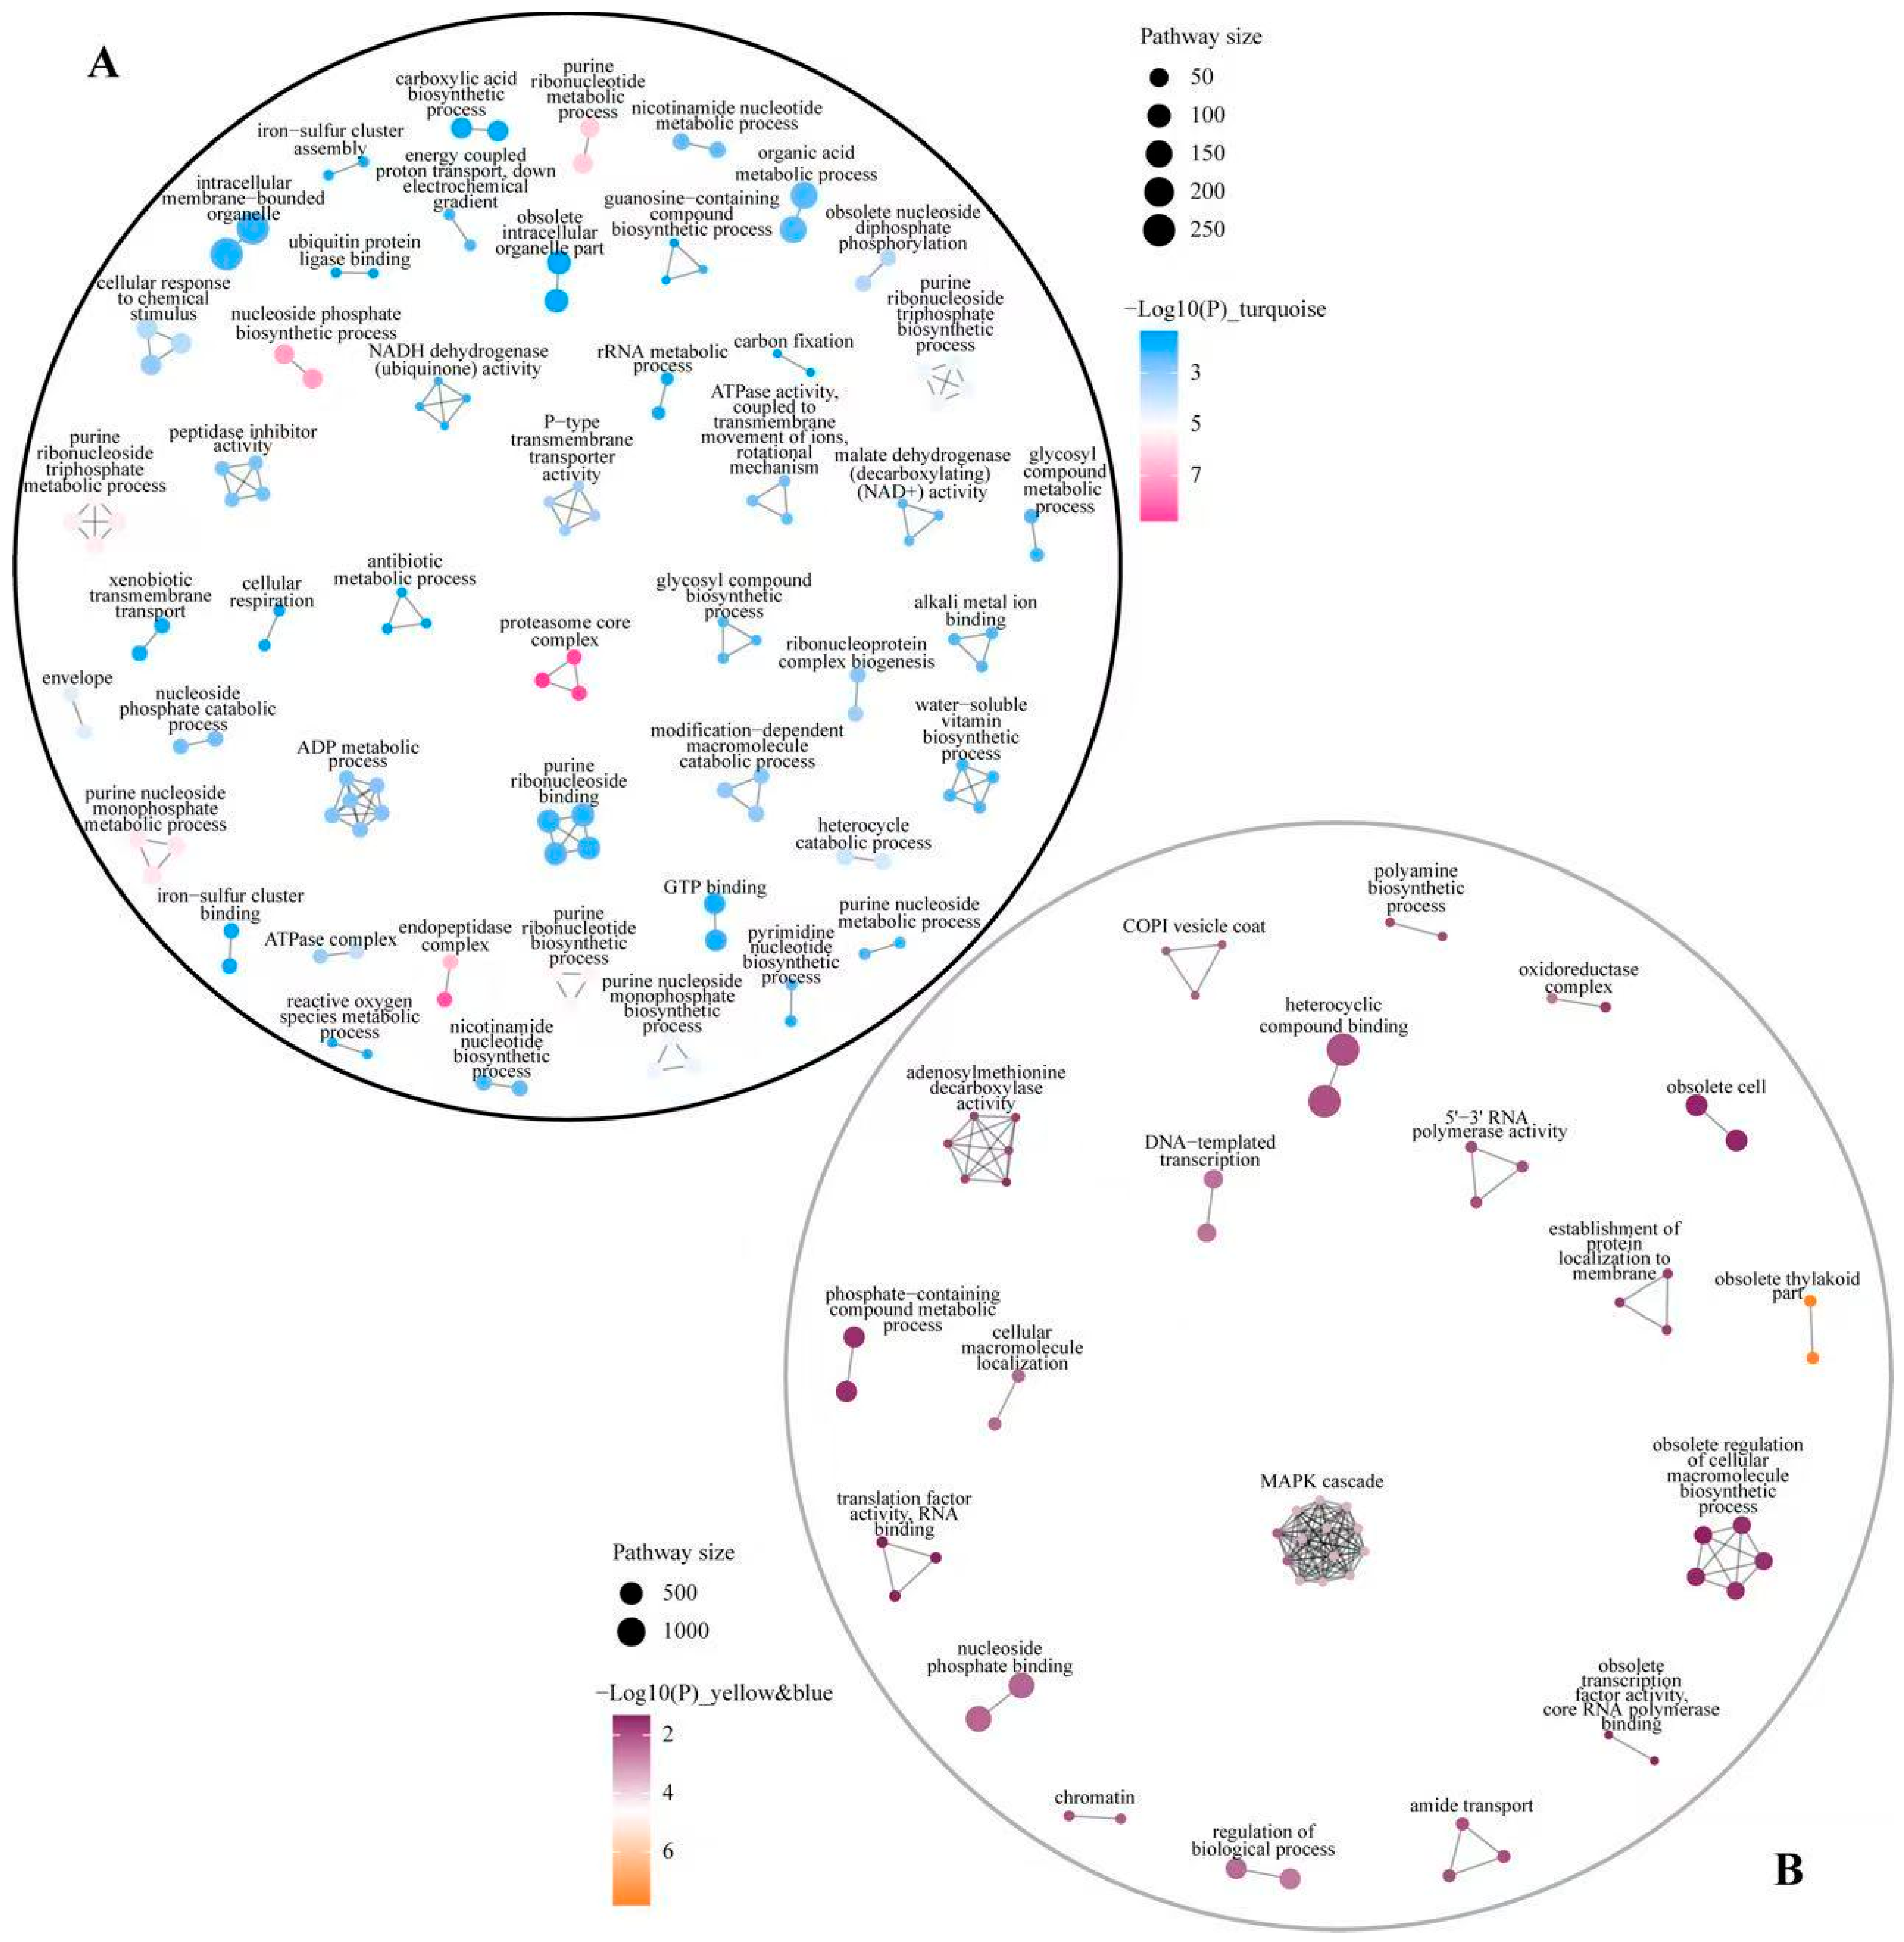
3.6. WGCNA Analysis
3.7. Analysis of Mfuzz Combined with WGCNA
3.8. Identification of Key Pathways and Genes
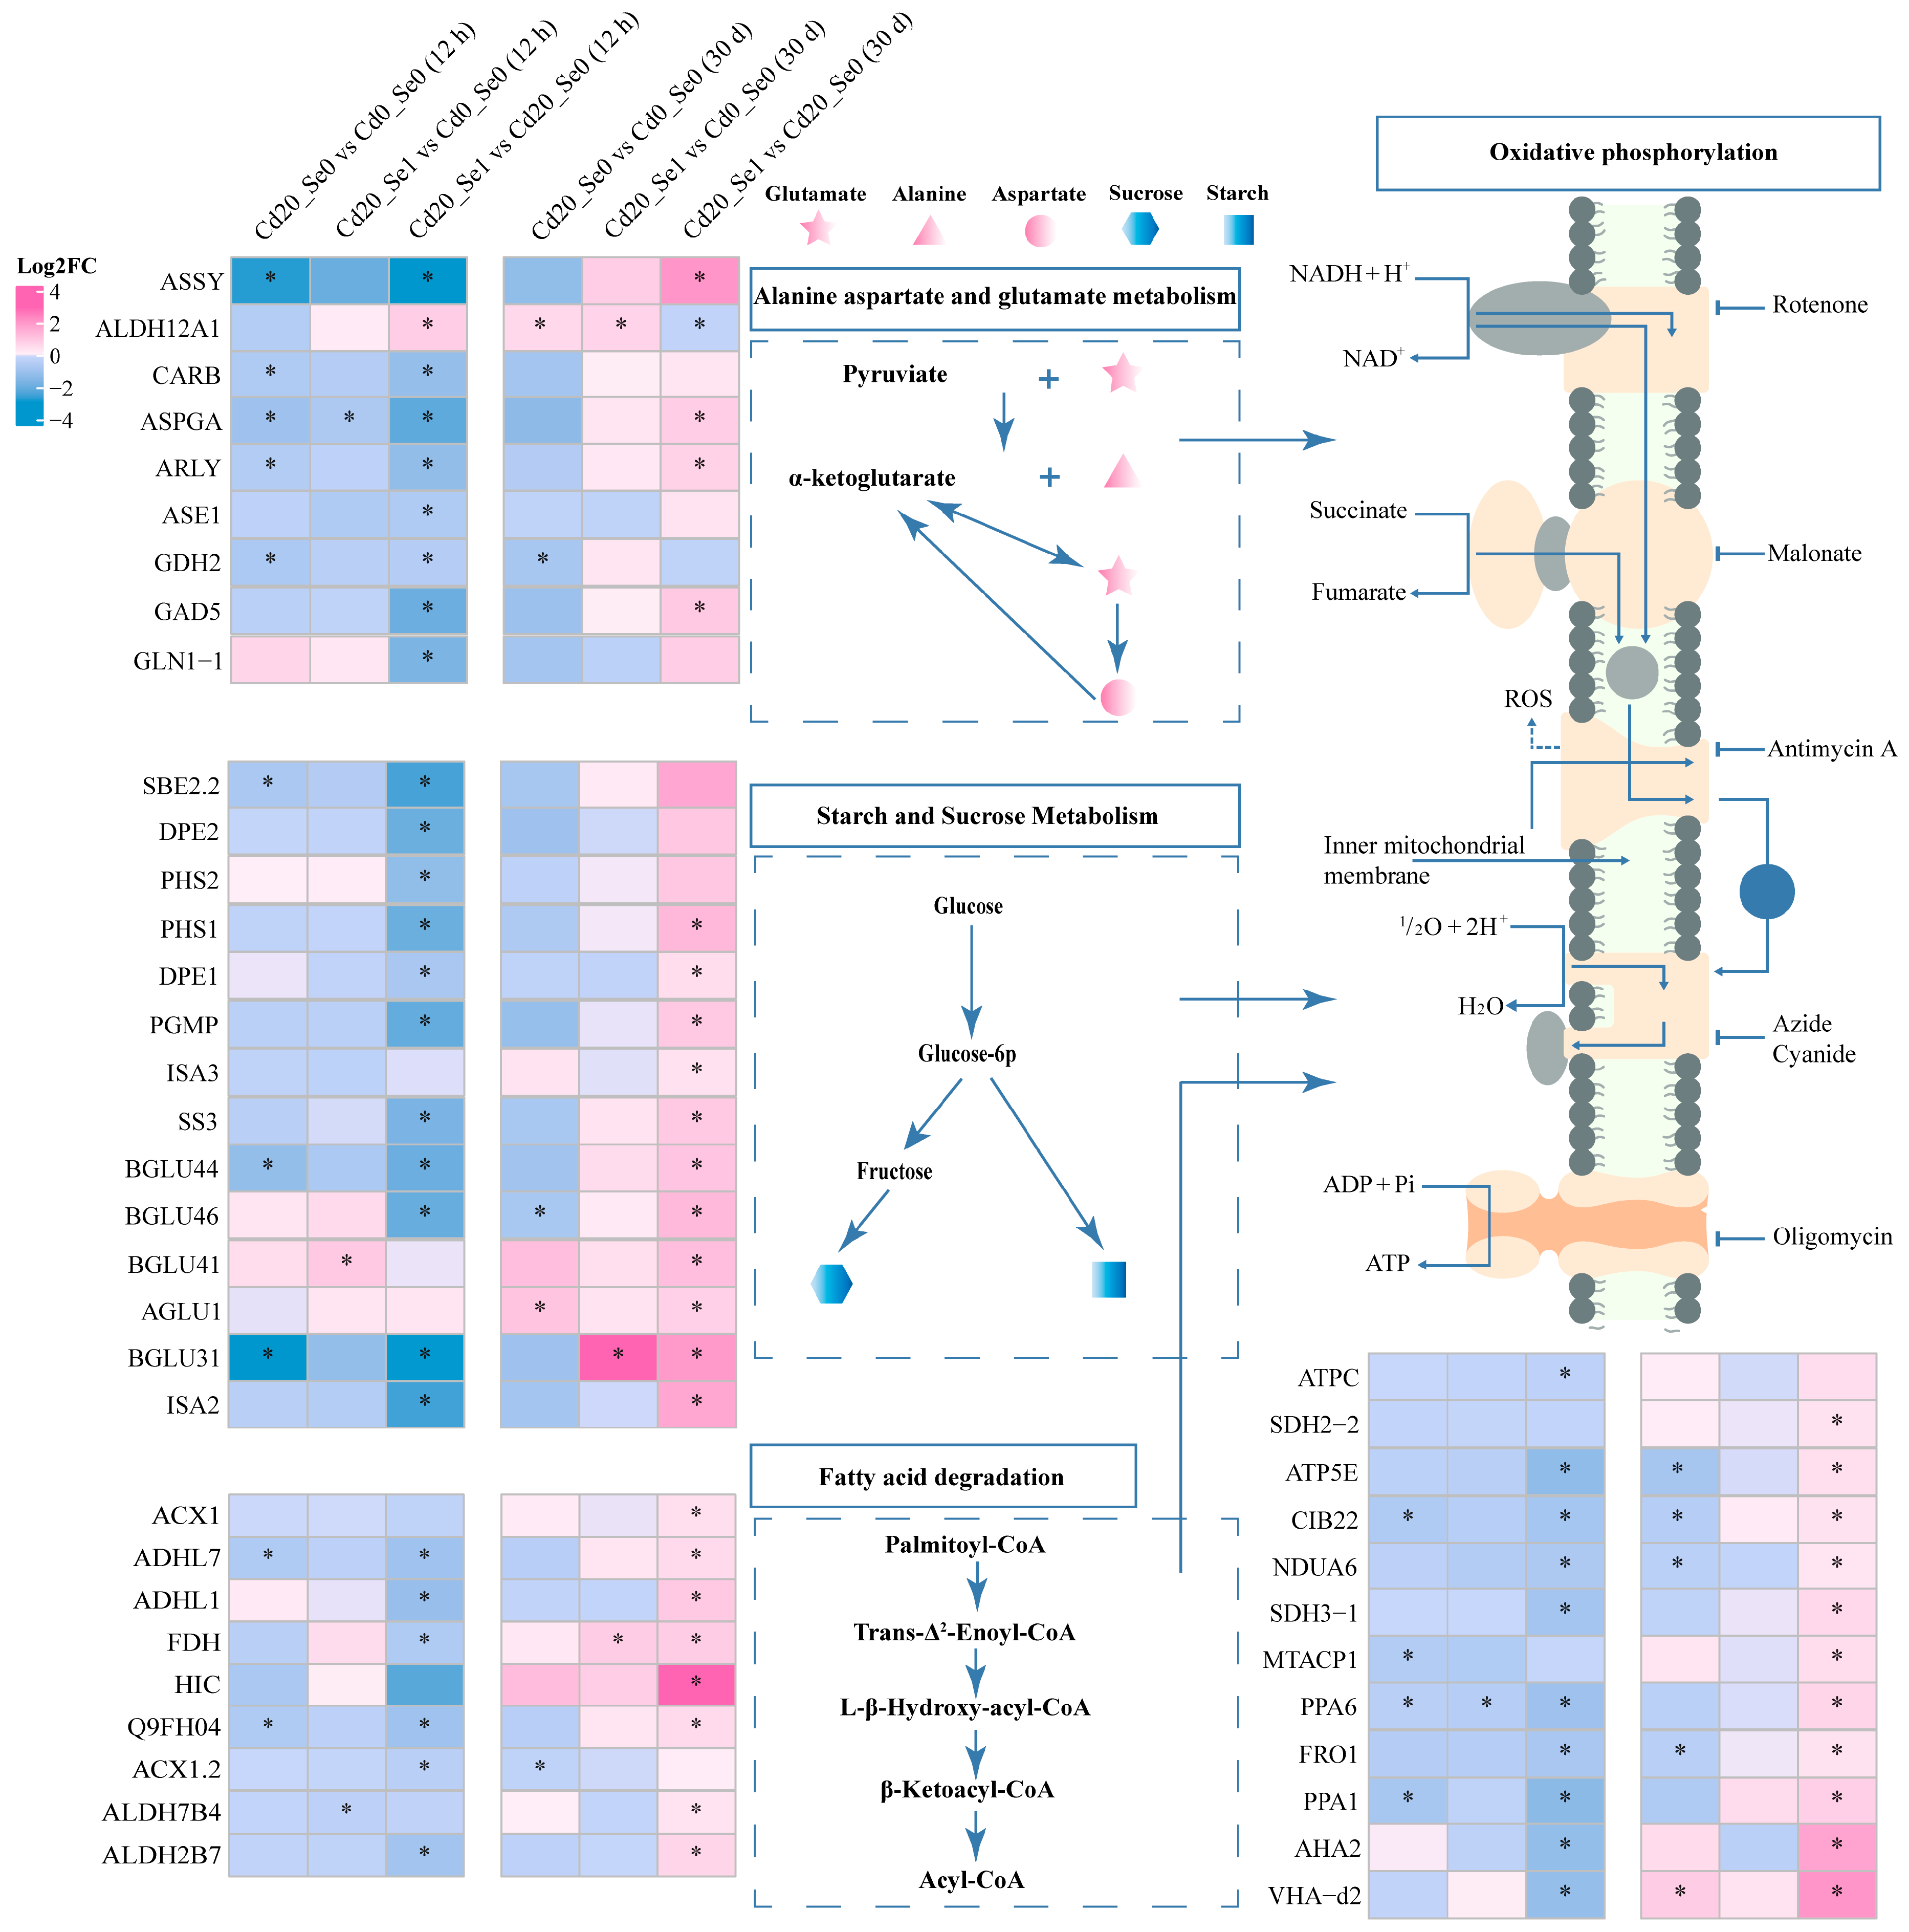
3.8.1. DEGs Involved in Carbon Metabolism
3.8.2. DEGs Involved in Cd Transport
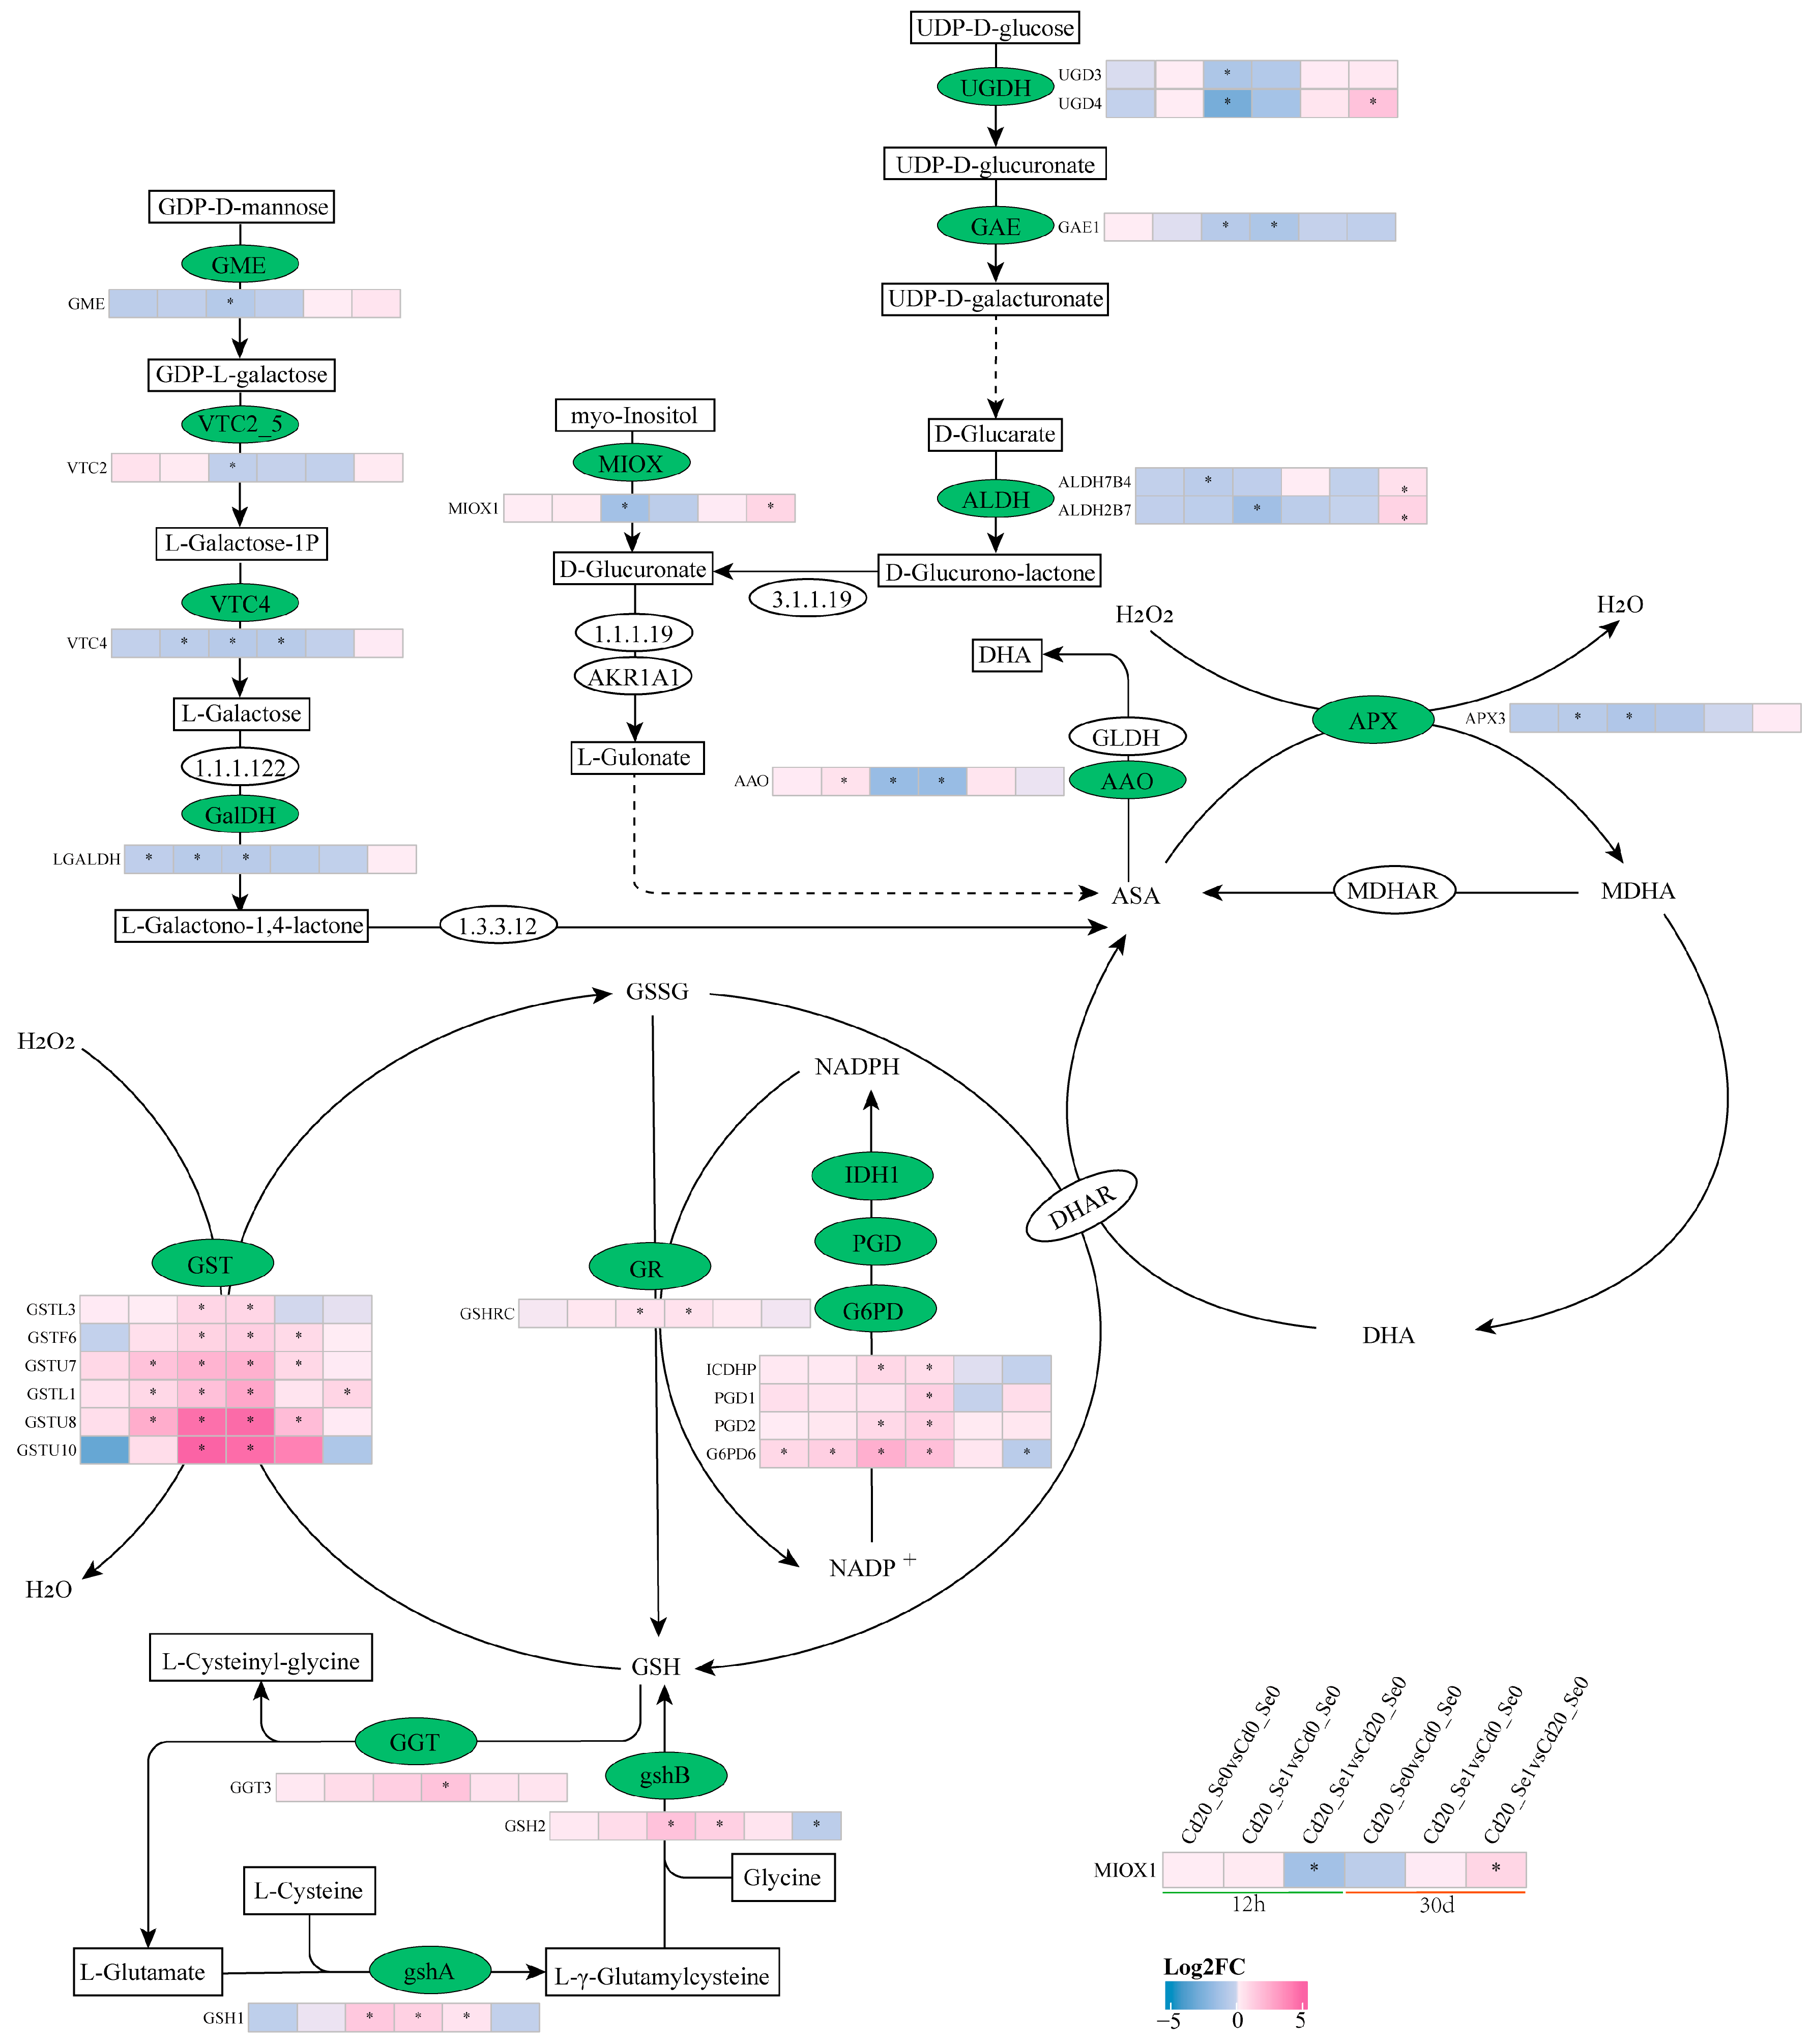
3.8.3. DEGs Involved in AsA-GSH
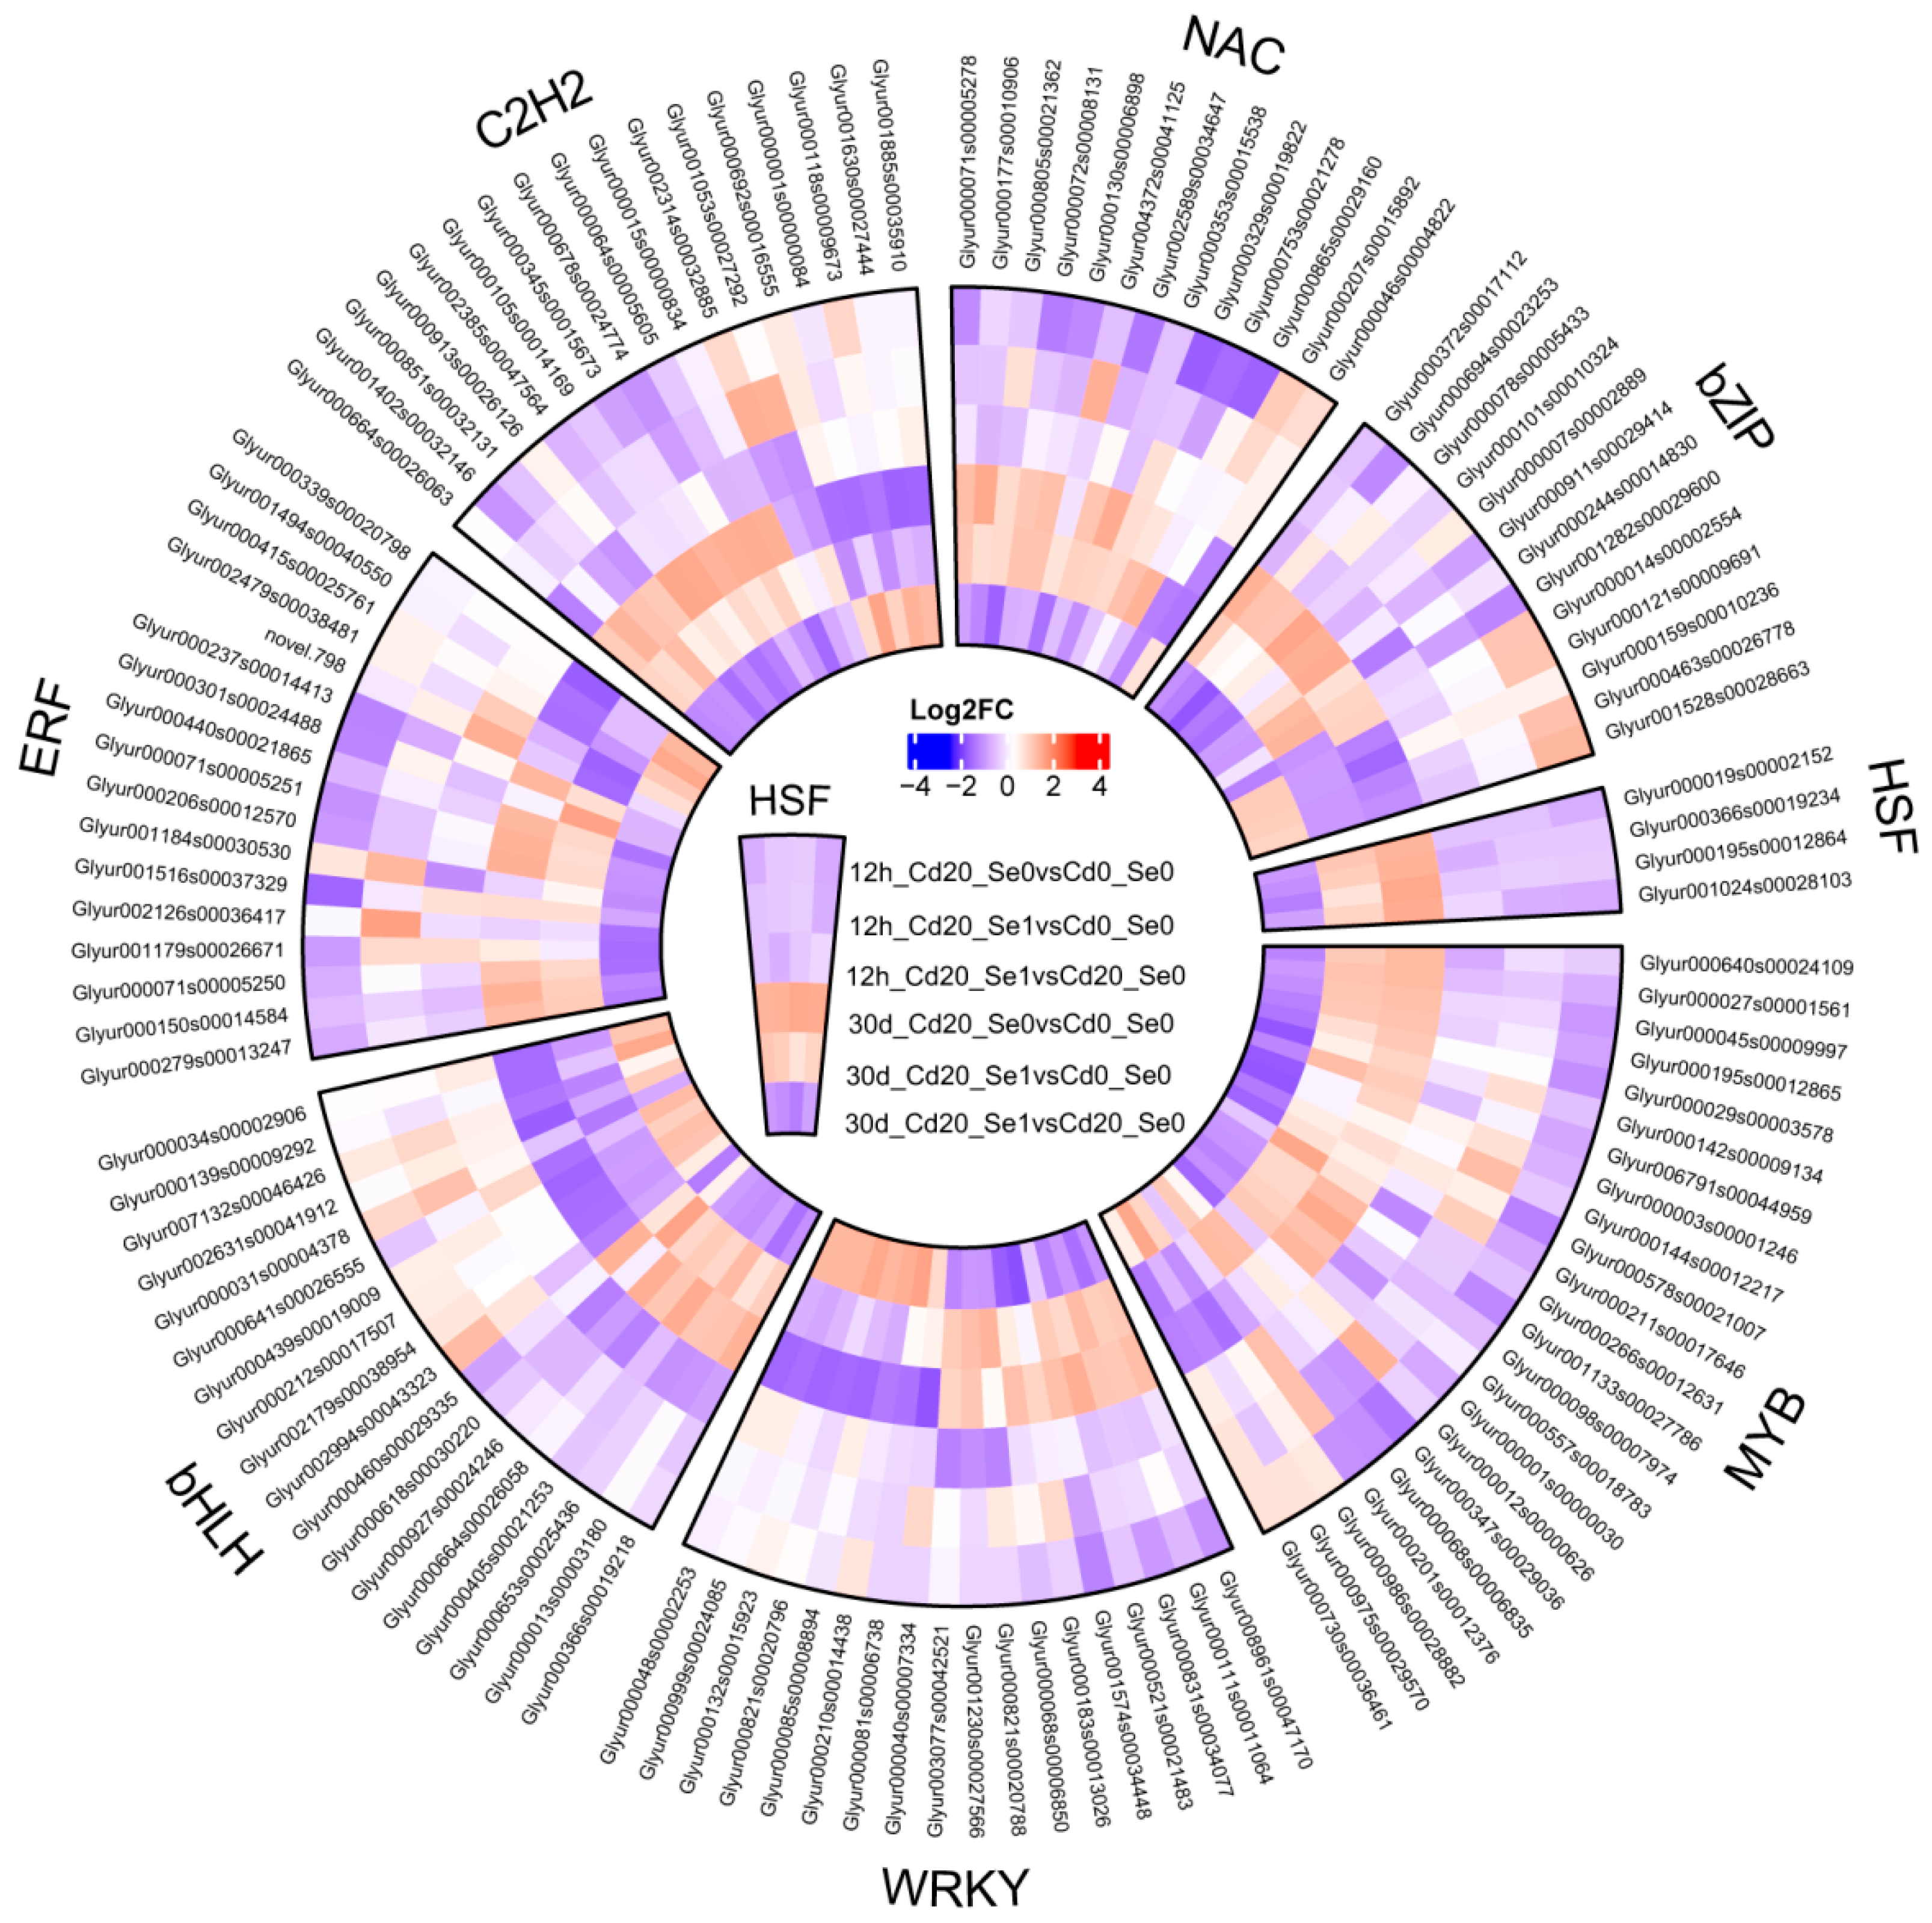
3.8.4. Expression of Transcription Factors
3.8.5. qRT-PCR Validation of DEG Results
4. Discussion
4.1. Se Promotes the Growth of G. uralensis Seedlings Under Cd Stress
4.2. Se Regulates Genes Involved in the Carbon Metabolism in G. uralensis Seedlings Under Cd Stress
4.3. Se Improves Cd Tolerance in G. uralensis Seedlings by Regulating Genes Involved in Transport Proteins
4.4. Se Regulates Genes Involved in the AsA-GSH Cycle to Reduce Oxidative Damage in G. uralensis
4.5. Se Regulates the Expression of Transcription Factors Related to Cd Tolerance
5. Conclusions
Supplementary Materials
Author Contributions
Funding
Data Availability Statement
Conflicts of Interest
References
- Fan, P.; Wu, L.; Wang, Q.; Wang, Y.; Luo, H.; Song, J.; Yang, M.; Yao, H.; Chen, S. Physiological and molecular mechanisms of medicinal plants in response to cadmium stress: Current status and future perspective. J. Hazard. Mater. 2023, 450, 131008. [Google Scholar] [CrossRef]
- Genchi, G.; Sinicropi, M.S.; Lauria, G.; Carocci, A.; Catalano, A. The Effects of Cadmium Toxicity. Int. J. Environ. Res. Public Health 2020, 17, 3782. [Google Scholar] [CrossRef] [PubMed]
- Suhani, I.; Sahab, S.; Srivastava, V.; Singh, R.P. Impact of cadmium pollution on food safety and human health. Curr. Opin. Toxicol. 2021, 27, 1–7. [Google Scholar] [CrossRef]
- Kubier, A.; Wilkin, R.T.; Pichler, T. Cadmium in soils and groundwater: A review. Appl. Geochem. 2019, 108, 104388. [Google Scholar] [CrossRef]
- Chen, L.; Zhou, M.; Wang, J.; Zhang, Z.; Duan, C.; Wang, X.; Zhao, S.; Bai, X.; Li, Z.; Li, Z. A global meta-analysis of heavy metal (loid) s pollution in soils near copper mines: Evaluation of pollution level and probabilistic health risks. Sci. Total Environ. 2022, 835, 155441. [Google Scholar] [CrossRef]
- Zuo, T.-T.; Zhang, L.; Wang, Y.; Nie, L.-X.; Shen, M.-R.; Liu, L.-N.; Yu, J.-D.; Jin, H.-Y.; Wei, F.; Ma, S.-C. Technical guidelines for risk assessment of heavy metals in traditional Chinese medicines. Chin. Med. 2023, 18, 69. [Google Scholar] [CrossRef]
- Mee, C.; Mnr, C. The Report on the National Soil Contamination Survey; Ministry of Environmental Protection: Beijing, China, 2014.
- Han, W.; Fang, D.; Li, L.; Liu, Y. Research progress on chemical constituents and biological activities of Glycyrrhiza uralensis Fisch. Chem. Eng. 2022, 36, 56–58+67. [Google Scholar] [CrossRef]
- Zhang, J.; Lu, J.; Li, X.; Liu, M.; Xu, K. Growth response, cadmium tolerance and enrichment characteristics of threemedicinal licorice species to heavy metal cadmium. J. Shihezi Univ. (Nat. Sci.) 2024, 42, 204–214. [Google Scholar] [CrossRef]
- Cheng, M.; Zhang, J.; Yang, L.; Shen, S.; Li, P.; Yao, S.; Qu, H.; Li, J.; Yao, C.; Wei, W.; et al. Recent advances in chemical analysis of licorice (Gan-Cao). Fitoterapia 2021, 149, 104803. [Google Scholar] [CrossRef]
- National Forestry and Grassland Administration. List of National Key Protected Wild Plants in China; No. 15; National Forestry and Grassland Administration: Beijing, China, 2021.
- Cui, X.; Lou, L.; Zhang, Y.; Yan, B. Study of the distribution of Glycyrrhiza uralensis production areas as well as the factors affecting yield and quality. Sci. Rep. 2023, 13, 5160. [Google Scholar] [CrossRef]
- Commission, C.P. Pharmacopoeia of the People’s Republic of China, 2020th ed.; China Pharmaceutical Science and Technology Press: Beijing, China, 2020. [Google Scholar]
- Zhong, Y.; Zhao, R.; Li, Q.; Jiang, Y.; Zeng, G. Literature Research in Contamination Index Method to Evaluate Heavy MetalContamination in Eight Kinds of Chinese Materia Medica. Chin. J. Inf. TCM 2018, 25, 101–104. [Google Scholar] [CrossRef]
- Zhao, H.; Guan, J.; Liang, Q.; Zhang, X.; Hu, H.; Zhang, J. Effects of cadmium stress on growth and physiological characteristics of sassafras seedlings. Sci. Rep. 2021, 11, 9913. [Google Scholar] [CrossRef]
- Qin, X.; Nie, Z.; Liu, H.; Zhao, P.; Qin, S.; Shi, Z. Influence of selenium on root morphology and photosynthetic characteristics of winter wheat under cadmium stress. Environ. Exp. Bot. 2018, 150, 232–239. [Google Scholar] [CrossRef]
- Hasanuzzaman, M.; Bhuyan, M.H.M.B.; Zulfiqar, F.; Raza, A.; Mohsin, S.M.; Mahmud, J.A.; Fujita, M.; Fotopoulos, V. Reactive Oxygen Species and Antioxidant Defense in Plants under Abiotic Stress: Revisiting the Crucial Role of a Universal Defense Regulator. Antioxidants 2020, 9, 681. [Google Scholar] [CrossRef]
- Aslam, M.M.; Okal, E.J.; Waseem, M. Cadmium toxicity impacts plant growth and plant remediation strategies. Plant Growth Regul. 2023, 99, 397–412. [Google Scholar] [CrossRef]
- Zhang, W.; Guan, M.; Chen, M.; Lin, X.; Xu, P.; Cao, Z. Mutation of OsNRAMP5 reduces cadmium xylem and phloem transport in rice plants and its physiological mechanism. Environ. Pollut. 2024, 341, 122928. [Google Scholar] [CrossRef]
- Nosek, M.; Kaczmarczyk, A.; Jędrzejczyk, R.J.; Supel, P.; Kaszycki, P.; Miszalski, Z. Expression of Genes Involved in Heavy Metal Trafficking in Plants Exposed to Salinity Stress and Elevated Cd Concentrations. Plants 2020, 9, 475. [Google Scholar] [CrossRef]
- Argüello, J.M.; Eren, E.; González-Guerrero, M. The structure and function of heavy metal transport P1B-ATPases. Biometals 2007, 20, 233–248. [Google Scholar] [CrossRef] [PubMed]
- Takahashi, R.; Ishimaru, Y.; Shimo, H.; Ogo, Y.; Senoura, T.; Nishizawa, N.K.; Nakanishi, H. The OsHMA2 transporter is involved in root-to-shoot translocation of Zn and Cd in rice. Plant Cell Environ. 2012, 35, 1948–1957. [Google Scholar] [CrossRef]
- Sasaki, A.; Yamaji, N.; Ma, J.F. Overexpression of OsHMA3 enhances Cd tolerance and expression of Zn transporter genes in rice. J. Exp. Bot. 2014, 65, 6013–6021. [Google Scholar] [CrossRef]
- Das, N.; Bhattacharya, S.; Maiti, M.K. Enhanced cadmium accumulation and tolerance in transgenic tobacco overexpressing rice metal tolerance protein gene OsMTP1 is promising for phytoremediation. Plant Physiol. Biochem. 2016, 105, 297–309. [Google Scholar] [CrossRef] [PubMed]
- Chen, H.; Zhang, C.; Guo, H.; Hu, Y.; He, Y.; Jiang, D. Overexpression of a Miscanthus sacchariflorus yellow stripe-like transporter MsYSL1 enhances resistance of Arabidopsis to cadmium by mediating metal ion reallocation. Plant Growth Regul. 2018, 85, 101–111. [Google Scholar] [CrossRef]
- Zhou, Q.; Guo, J.-J.; He, C.-T.; Shen, C.; Huang, Y.-Y.; Chen, J.-X.; Guo, J.-h.; Yuan, J.-G.; Yang, Z.-Y. Comparative Transcriptome Analysis between Low- and High-Cadmium-Accumulating Genotypes of Pakchoi (Brassica chinensis L.) in Response to Cadmium Stress. Environ. Sci. Technol. 2016, 50, 6485–6494. [Google Scholar] [CrossRef] [PubMed]
- Ding, Y.; Wang, Y.; Zheng, X.; Cheng, W.; Shi, R.; Feng, R. Effects of foliar dressing of selenite and silicate alone or combined with different soil ameliorants on the accumulation of As and Cd and antioxidant system in Brassica campestris. Ecotoxicol. Environ. Saf. 2017, 142, 207–215. [Google Scholar] [CrossRef]
- Wang, L.; Li, X.; Tsang, D.C.; Jin, F.; Hou, D. Green remediation of Cd and Hg contaminated soil using humic acid modified montmorillonite: Immobilization performance under accelerated ageing conditions. J. Hazard. Mater. 2020, 387, 122005. [Google Scholar] [CrossRef]
- Shi, A.; Xu, J.; Guo, Y.; Rensing, C.; Chang, J.; Zhang, T.; Zhang, L.; Xing, S.; Ni, W.; Yang, W. Jasmonic acid’s impact on Sedum alfredii growth and cadmium tolerance: A physiological and transcriptomic study. Sci. Total Environ. 2024, 914, 169939. [Google Scholar] [CrossRef]
- Khan, M.I.R.; Nazir, F.; Asgher, M.; Per, T.S.; Khan, N.A. Selenium and sulfur influence ethylene formation and alleviate cadmium-induced oxidative stress by improving proline and glutathione production in wheat. J. Plant Physiol. 2015, 173, 9–18. [Google Scholar] [CrossRef]
- Zohra, E.; Ikram, M.; Omar, A.A.; Hussain, M.; Satti, S.H.; Raja, N.I.; Mashwani, Z.-U.-R.; Ehsan, M. Potential applications of biogenic selenium nanoparticles in alleviating biotic and abiotic stresses in plants: A comprehensive insight on the mechanistic approach and future perspectives. Green Process. Synth. 2021, 10, 456–475. [Google Scholar] [CrossRef]
- Feng, R.; Wei, C.; Tu, S. The roles of selenium in protecting plants against abiotic stresses. Environ. Exp. Bot. 2013, 87, 58–68. [Google Scholar] [CrossRef]
- Liu, H.; Xiao, C.; Qiu, T.; Deng, J.; Cheng, H.; Cong, X.; Cheng, S.; Rao, S.; Zhang, Y. Selenium Regulates Antioxidant, Photosynthesis, and Cell Permeability in Plants under Various Abiotic Stresses: A Review. Plants 2023, 12, 44. [Google Scholar] [CrossRef]
- Luís Oliveira Cunha, M.; de Mello Prado, R. Synergy of Selenium and Silicon to Mitigate Abiotic Stresses: A Review. Gesunde Pflanz. 2023, 75, 1461–1474. [Google Scholar] [CrossRef] [PubMed]
- Di, X.; Jing, R.; Qin, X.; Wei, Y.; Liang, X.; Wang, L.; Xu, Y.; Sun, Y.; Huang, Q. Transcriptome analysis reveals the molecular mechanism of different forms of selenium in reducing cadmium uptake and accumulation in wheat seedlings. Chemosphere 2023, 340, 139888. [Google Scholar] [CrossRef] [PubMed]
- Xie, Y.; Su, L.; He, Z.; Zhang, J.; Tang, Y. Selenium Inhibits Cadmium Absorption and Improves Yield and Quality of Cherry Tomato (Lycopersicon esculentum) Under Cadmium Stress. J. Soil Sci. Plant Nutr. 2021, 21, 1125–1133. [Google Scholar] [CrossRef]
- Malik, J.A.; Kumar, S.; Thakur, P.; Sharma, S.; Kaur, N.; Kaur, R.; Pathania, D.; Bhandhari, K.; Kaushal, N.; Singh, K.; et al. Promotion of Growth in Mungbean (Phaseolus aureus Roxb.) by Selenium is Associated with Stimulation of Carbohydrate Metabolism. Biol. Trace Elem. Res. 2011, 143, 530–539. [Google Scholar] [CrossRef]
- Shahid, M.A.; Balal, R.M.; Khan, N.; Zotarelli, L.; Liu, G.D.; Sarkhosh, A.; Fernández-Zapata, J.C.; Martínez Nicolás, J.J.; Garcia-Sanchez, F. Selenium impedes cadmium and arsenic toxicity in potato by modulating carbohydrate and nitrogen metabolism. Ecotoxicol. Environ. Saf. 2019, 180, 588–599. [Google Scholar] [CrossRef]
- Tan, Z.; Xuan, Z.; Wu, C.; Cheng, Y.; Xu, C.; Ma, X.; Wang, D. Effects of Selenium on the AsA-GSH System and Photosynthesis of Pakchoi (Brassica chinensis L.) Under Lead Stress. J. Soil Sci. Plant Nutr. 2022, 22, 5111–5122. [Google Scholar] [CrossRef]
- Ren, M.; Qin, Z.; Li, X.; Wang, L.; Wang, Y.; Zhang, J.; Huang, Y.; Yang, S. Selenite antagonizes the phytotoxicity of Cd in the cattail Typha angustifolia. Ecotoxicol. Environ. Saf. 2020, 189, 109959. [Google Scholar] [CrossRef]
- Lanza, M.G.D.B.; Reis, A.R.d. Roles of selenium in mineral plant nutrition: ROS scavenging responses against abiotic stresses. Plant Physiol. Biochem. 2021, 164, 27–43. [Google Scholar] [CrossRef]
- Guo, Y.; Mao, K.; Cao, H.; Ali, W.; Lei, D.; Teng, D.; Chang, C.; Yang, X.; Yang, Q.; Niazi, N.K.; et al. Exogenous selenium (cadmium) inhibits the absorption and transportation of cadmium (selenium) in rice. Environ. Pollut 2021, 268, 115829. [Google Scholar] [CrossRef]
- Riaz, M.; Kamran, M.; Rizwan, M.; Ali, S.; Parveen, A.; Malik, Z.; Wang, X. Cadmium uptake and translocation: Selenium and silicon roles in Cd detoxification for the production of low Cd crops: A critical review. Chemosphere 2021, 273, 129690. [Google Scholar] [CrossRef]
- Huang, B.; Xin, J.; Dai, H.; Zhou, W. Effects of Interaction between Cadmium (Cd) and Selenium (Se) on Grain Yield and Cd and Se Accumulation in a Hybrid Rice (Oryza sativa) System. J. Agric. Food Chem. 2017, 65, 9537–9546. [Google Scholar] [CrossRef] [PubMed]
- Li, X.; Xu, Y.; Zhang, J.; Xu, K.; Zheng, X.; Luo, J.; Lu, J. Integrative physiology and transcriptome reveal salt-tolerance differences between two licorice species: Ion transport, Casparian strip formation and flavonoids biosynthesis. BMC Plant Biol. 2024, 24, 272. [Google Scholar] [CrossRef] [PubMed]
- Hodges, D.M.; DeLong, J.M.; Forney, C.F.; Prange, R.K. Improving the thiobarbituric acid-reactive-substances assay for estimating lipid peroxidation in plant tissues containing anthocyanin and other interfering compounds. Planta 1999, 207, 604–611. [Google Scholar] [CrossRef]
- Kim, D.; Langmead, B.; Salzberg, S.L. HISAT: A fast spliced aligner with low memory requirements. Nat. Methods 2015, 12, 357–360. [Google Scholar] [CrossRef]
- Love, M.I.; Huber, W.; Anders, S. Moderated estimation of fold change and dispersion for RNA-seq data with DESeq2. Genome Biol. 2014, 15, 550. [Google Scholar] [CrossRef]
- Cui, J.; Liu, T.; Li, Y.; Li, F. Selenium reduces cadmium uptake into rice suspension cells by regulating the expression of lignin synthesis and cadmium-related genes. Sci. Total Environ. 2018, 644, 602–610. [Google Scholar] [CrossRef]
- Shah, S.H.; Houborg, R.; McCabe, M.F. Response of Chlorophyll, Carotenoid and SPAD-502 Measurement to Salinity and Nutrient Stress in Wheat (Triticum aestivum L.). Agronomy 2017, 7, 61. [Google Scholar] [CrossRef]
- Li, H.; Liu, X.; Wassie, M.; Chen, L. Selenium supplementation alleviates cadmium-induced damages in tall fescue through modulating antioxidant system, photosynthesis efficiency, and gene expression. Environ. Sci. Pollut. Res. 2020, 27, 9490–9502. [Google Scholar] [CrossRef]
- Wang, H.; Zhang, Y.; Zhou, W.; Duan, Y.; He, Y. The Effects of Exogenous Selenium on Seed Germination and Seedling Physiological Characteristics of Atractylodes macrocephala. Mol. Plant Breed. 2019, 17, 7551–7558. [Google Scholar] [CrossRef]
- Liu, Y.; Ma, J.; Li, F.; Zeng, X.; Wu, Z.; Huang, Y.; Xue, Y.; Wang, Y. High Concentrations of Se Inhibited the Growth of Rice Seedlings. Plants 2024, 13, 1580. [Google Scholar] [CrossRef]
- Siddiqui, M.H.; Mukherjee, S.; Kumar, R.; Alansi, S.; Shah, A.A.; Kalaji, H.M.; Javed, T.; Raza, A. Potassium and melatonin-mediated regulation of fructose-1,6-bisphosphatase (FBPase) and sedoheptulose-1,7- bisphosphatase (SBPase) activity improve photosynthetic efficiency, carbon assimilation and modulate glyoxalase system accompanying tolerance to cadmium stress in tomato seedlings. Plant Physiol. Biochem. 2022, 171, 49–65. [Google Scholar] [CrossRef] [PubMed]
- Li, D.; Zhou, C.; Ma, J.; Wu, Y.; Kang, L.; An, Q.; Zhang, J.; Deng, K.; Li, J.-Q.; Pan, C. Nanoselenium transformation and inhibition of cadmium accumulation by regulating the lignin biosynthetic pathway and plant hormone signal transduction in pepper plants. J. Nanobiotechnol. 2021, 19, 316. [Google Scholar] [CrossRef]
- Zhang, Y.; Yang, X.; Luo, Z.-x.; Lai, J.-l.; Li, C.; Luo, X.-g. Effects of polystyrene nanoplastics (PSNPs) on the physiology and molecular metabolism of corn (Zea mays L.) seedlings. Sci. Total Environ. 2022, 806, 150895. [Google Scholar] [CrossRef]
- Kulkarni, J.; Sharma, S.; Sahoo, S.A.; Mishra, S.; Nikam, T.D.; Borde, M.; Penna, S.; Srivastava, A.K. Resilience in primary metabolism contributes to salt stress adaptation in Sesuvium portulacastrum (L.). Plant Growth Regul. 2022, 98, 385–398. [Google Scholar] [CrossRef]
- Qi, J.; Xiao, X.; Ouyang, L.; Yang, C.; Zhuang, Y.; Zhang, L. Enhancement of fatty acid degradation pathway promoted glucoamylase synthesis in Aspergillus niger. Microb. Cell Fact. 2022, 21, 238. [Google Scholar] [CrossRef] [PubMed]
- Obata, T. Metabolons in plant primary and secondary metabolism. Phytochem. Rev. 2019, 18, 1483–1507. [Google Scholar] [CrossRef]
- Haider, F.U.; Liqun, C.; Coulter, J.A.; Cheema, S.A.; Wu, J.; Zhang, R.; Wenjun, M.; Farooq, M. Cadmium toxicity in plants: Impacts and remediation strategies. Ecotoxicol. Environ. Saf. 2021, 211, 111887. [Google Scholar] [CrossRef]
- Adrees, M.; Ali, S.; Rizwan, M.; Zia-ur-Rehman, M.; Ibrahim, M.; Abbas, F.; Farid, M.; Qayyum, M.F.; Irshad, M.K. Mechanisms of silicon-mediated alleviation of heavy metal toxicity in plants: A review. Ecotoxicol. Environ. Saf. 2015, 119, 186–197. [Google Scholar] [CrossRef]
- Lin, L.; Zhou, W.; Dai, H.; Cao, F.; Zhang, G.; Wu, F. Selenium reduces cadmium uptake and mitigates cadmium toxicity in rice. J. Hazard. Mater. 2012, 235–236, 343–351. [Google Scholar] [CrossRef]
- Sasaki, A.; Yamaji, N.; Yokosho, K.; Ma, J.F. Nramp5 Is a Major Transporter Responsible for Manganese and Cadmium Uptake in Rice. Plant Cell 2012, 24, 2155–2167. [Google Scholar] [CrossRef]
- Chen, S.; Han, X.; Fang, J.; Lu, Z.; Qiu, W.; Liu, M.; Sang, J.; Jiang, J.; Zhuo, R. Sedum alfredii SaNramp6 Metal Transporter Contributes to Cadmium Accumulation in Transgenic Arabidopsis thaliana. Sci. Rep. 2017, 7, 13318. [Google Scholar] [CrossRef] [PubMed]
- Zheng, X.; Chen, L.; Li, X. Arabidopsis and rice showed a distinct pattern in ZIPs genes expression profile in response to Cd stress. Bot. Stud. 2018, 59, 22. [Google Scholar] [CrossRef] [PubMed]
- Milner, M.J.; Seamon, J.; Craft, E.; Kochian, L.V. Transport properties of members of the ZIP family in plants and their role in Zn and Mn homeostasis. J. Exp. Bot. 2013, 64, 369–381. [Google Scholar] [CrossRef]
- Spielmann, J.; Ahmadi, H.; Scheepers, M.; Weber, M.; Nitsche, S.; Carnol, M.; Bosman, B.; Kroymann, J.; Motte, P.; Clemens, S.; et al. The two copies of the zinc and cadmium ZIP6 transporter of Arabidopsis halleri have distinct effects on cadmium tolerance. Plant Cell Environ. 2020, 43, 2143–2157. [Google Scholar] [CrossRef]
- Luo, J.-S.; Zhang, Z. Mechanisms of cadmium phytoremediation and detoxification in plants. Crop J. 2021, 9, 521–529. [Google Scholar] [CrossRef]
- Teng, Y.; Yang, Y.; Wang, Z.; Guan, W.; Liu, Y.; Yu, H.; Zou, L. The cadmium tolerance enhancement through regulating glutathione conferred by vacuolar compartmentalization in Aspergillus sydowii. Chemosphere 2024, 352, 141500. [Google Scholar] [CrossRef]
- Liu, P.; Sun, L.; Zhang, Y.; Tan, Y.; Zhu, Y.; Peng, C.; Wang, J.; Yan, H.; Mao, D.; Liang, G.; et al. The metal tolerance protein OsMTP11 facilitates cadmium sequestration in the vacuoles of leaf vascular cells for restricting its translocation into rice grains. Mol. Plant 2024, 17, 1733–1752. [Google Scholar] [CrossRef] [PubMed]
- Zou, W.; Chen, J.; Meng, L.; Chen, D.; He, H.; Ye, G. The Rice Cation/H+ Exchanger Family Involved in Cd Tolerance and Transport. Int. J. Mol. Sci. 2021, 22, 8186. [Google Scholar] [CrossRef]
- Baliardini, C.; Meyer, C.-L.; Salis, P.; Saumitou-Laprade, P.; Verbruggen, N. CATION EXCHANGER1 Cosegregates with Cadmium Tolerance in the Metal Hyperaccumulator Arabidopsis halleri and Plays a Role in Limiting Oxidative Stress in Arabidopsis spp. Plant Physiol. 2015, 169, 549–559. [Google Scholar] [CrossRef]
- Zhang, X.; Yang, M.; Yang, H.; Pian, R.; Wang, J.; Wu, A.-M. The Uptake, Transfer, and Detoxification of Cadmium in Plants and Its Exogenous Effects. Cells 2024, 13, 907. [Google Scholar] [CrossRef]
- Wong, C.K.E.; Cobbett, C.S. HMA P-type ATPases are the major mechanism for root-to-shoot Cd translocation in Arabidopsis thaliana. New Phytol. 2009, 181, 71–78. [Google Scholar] [CrossRef] [PubMed]
- Zheng, P.; Cao, L.; Zhang, C.; Pan, W.; Wang, W.; Yu, X.; Li, Y.; Fan, T.; Miao, M.; Tang, X.; et al. MYB43 as a novel substrate for CRL4PRL1 E3 ligases negatively regulates cadmium tolerance through transcriptional inhibition of HMAs in Arabidopsis. New Phytol. 2022, 234, 884–901. [Google Scholar] [CrossRef]
- Deng, F.; Yamaji, N.; Xia, J.; Ma, J.F. A Member of the Heavy Metal P-Type ATPase OsHMA5 Is Involved in Xylem Loading of Copper in Rice. Plant Physiol. 2013, 163, 1353–1362. [Google Scholar] [CrossRef]
- Huang, Q.; Qiu, W.; Yu, M.; Li, S.; Lu, Z.; Zhu, Y.; Kan, X.; Zhuo, R. Genome-Wide Characterization of Sedum plumbizincicola HMA Gene Family Provides Functional Implications in Cadmium Response. Plants 2022, 11, 215. [Google Scholar] [CrossRef]
- Miyadate, H.; Adachi, S.; Hiraizumi, A.; Tezuka, K.; Nakazawa, N.; Kawamoto, T.; Katou, K.; Kodama, I.; Sakurai, K.; Takahashi, H.; et al. OsHMA3, a P1B-type of ATPase affects root-to-shoot cadmium translocation in rice by mediating efflux into vacuoles. New Phytol. 2011, 189, 190–199. [Google Scholar] [CrossRef] [PubMed]
- Liu, H.; Zhao, H.; Wu, L.; Liu, A.; Zhao, F.-J.; Xu, W. Heavy metal ATPase 3 (HMA3) confers cadmium hypertolerance on the cadmium/zinc hyperaccumulator Sedum plumbizincicola. New Phytol. 2017, 215, 687–698. [Google Scholar] [CrossRef] [PubMed]
- Verbruggen, N.; Hermans, C.; Schat, H. Molecular mechanisms of metal hyperaccumulation in plants. New Phytol. 2009, 181, 759–776. [Google Scholar] [CrossRef]
- Song, Z.; Li, S.; Li, Y.; Zhou, X.; Liu, X.; Yang, W.; Chen, R. Identification and characterization of yellow stripe-like genes in maize suggest their roles in the uptake and transport of zinc and iron. BMC Plant Biol. 2024, 24, 3. [Google Scholar] [CrossRef]
- Waters, B.M.; Chu, H.-H.; DiDonato, R.J.; Roberts, L.A.; Eisley, R.B.; Lahner, B.; Salt, D.E.; Walker, E.L. Mutations in Arabidopsis Yellow Stripe-Like1 and Yellow Stripe-Like3 Reveal Their Roles in Metal Ion Homeostasis and Loading of Metal Ions in Seeds. Plant Physiol. 2006, 141, 1446–1458. [Google Scholar] [CrossRef]
- Sun, T.; Hu, Y.; Wang, Z.; Xia, W.; Lv, Q.; Wang, Y.; Fang, P.; Xu, P. A tissue atlas of cadmium accumulation and the correlation with thiol-containing chelates in zucchini provide insights into cadmium partitioning and food safety. J. Hazard. Mater. 2022, 421, 126756. [Google Scholar] [CrossRef]
- Gendre, D.; Czernic, P.; Conéjéro, G.; Pianelli, K.; Briat, J.-F.; Lebrun, M.; Mari, S. TcYSL3, a member of the YSL gene family from the hyper-accumulator Thlaspi caerulescens, encodes a nicotianamine-Ni/Fe transporter. Plant J. 2007, 49, 1–15. [Google Scholar] [CrossRef]
- Feng, S.; Tan, J.; Zhang, Y.; Liang, S.; Xiang, S.; Wang, H.; Chai, T. Isolation and characterization of a novel cadmium-regulated Yellow Stripe-Like transporter (SnYSL3) in Solanum nigrum. Plant Cell Rep. 2017, 36, 281–296. [Google Scholar] [CrossRef] [PubMed]
- Gill, S.S.; Tuteja, N. Reactive oxygen species and antioxidant machinery in abiotic stress tolerance in crop plants. Plant Physiol. Biochem. 2010, 48, 909–930. [Google Scholar] [CrossRef] [PubMed]
- Hasanuzzaman, M.; Bhuyan, M.H.M.B.; Anee, T.I.; Parvin, K.; Nahar, K.; Mahmud, J.A.; Fujita, M. Regulation of Ascorbate-Glutathione Pathway in Mitigating Oxidative Damage in Plants under Abiotic Stress. Antioxidants 2019, 8, 384. [Google Scholar] [CrossRef]
- Rasool, A.; Hafiz Shah, W.; Padder, S.A.; Tahir, I.; Alharby, H.F.; Hakeem, K.R.; ul Rehman, R. Exogenous selenium treatment alleviates salinity stress in Proso Millet (Panicum miliaceum L.) by enhancing the antioxidant defence system and regulation of ionic channels. Plant Growth Regul. 2023, 100, 479–494. [Google Scholar] [CrossRef]
- Hasanuzzaman, M.; Hossain, M.A.; Fujita, M. Exogenous Selenium Pretreatment Protects Rapeseed Seedlings from Cadmium-Induced Oxidative Stress by Upregulating Antioxidant Defense and Methylglyoxal Detoxification Systems. Biol. Trace Elem. Res. 2012, 149, 248–261. [Google Scholar] [CrossRef]
- Kumar, S.; Trivedi, P.K. Glutathione S-Transferases: Role in Combating Abiotic Stresses Including Arsenic Detoxification in Plants. Front. Plant Sci. 2018, 9, 751. [Google Scholar] [CrossRef]
- Cummins, I.; Dixon, D.P.; Freitag-Pohl, S.; Skipsey, M.; Edwards, R. Multiple roles for plant glutathione transferases in xenobiotic detoxification. Drug Metab. Rev. 2011, 43, 266–280. [Google Scholar] [CrossRef]
- Sappl, P.G.; Carroll, A.J.; Clifton, R.; Lister, R.; Whelan, J.; Harvey Millar, A.; Singh, K.B. The Arabidopsis glutathione transferase gene family displays complex stress regulation and co-silencing multiple genes results in altered metabolic sensitivity to oxidative stress. Plant J. 2009, 58, 53–68. [Google Scholar] [CrossRef]
- Shri, M.; Kumar, S.; Chakrabarty, D.; Trivedi, P.K.; Mallick, S.; Misra, P.; Shukla, D.; Mishra, S.; Srivastava, S.; Tripathi, R.D.; et al. Effect of arsenic on growth, oxidative stress, and antioxidant system in rice seedlings. Ecotoxicol. Environ. Saf. 2009, 72, 1102–1110. [Google Scholar] [CrossRef]
- Saez-Aguayo, S.; Rautengarten, C.; Temple, H.; Sanhueza, D.; Ejsmentewicz, T.; Sandoval-Ibañez, O.; Doñas, D.; Parra-Rojas, J.P.; Ebert, B.; Lehner, A.; et al. UUAT1 Is a Golgi-Localized UDP-Uronic Acid Transporter That Modulates the Polysaccharide Composition of Arabidopsis Seed Mucilage. Plant Cell 2017, 29, 129–143. [Google Scholar] [CrossRef] [PubMed]
- Guan, Q.; Wang, Z.; Wang, X.; Takano, T.; Liu, S. A peroxisomal APX from Puccinellia tenuiflora improves the abiotic stress tolerance of transgenic Arabidopsis thaliana through decreasing of H2O2 accumulation. J. Plant Physiol. 2015, 175, 183–191. [Google Scholar] [CrossRef] [PubMed]
- Wang, J.; Zhang, H.; Allen, R.D. Overexpression of an Arabidopsis Peroxisomal Ascorbate Peroxidase Gene in Tobacco Increases Protection Against Oxidative Stress1. Plant Cell Physiol. 1999, 40, 725–732. [Google Scholar] [CrossRef] [PubMed]
- Koppaka, V.; Thompson, D.C.; Chen, Y.; Ellermann, M.; Nicolaou, K.C.; Juvonen, R.O.; Petersen, D.; Deitrich, R.A.; Hurley, T.D.; Vasiliou, V. Aldehyde dehydrogenase inhibitors: A comprehensive review of the pharmacology, mechanism of action, substrate specificity, and clinical application. Pharmacol. Rev. 2012, 64, 520–539. [Google Scholar] [CrossRef]
- Strader, L.; Weijers, D.; Wagner, D. Plant transcription factors—Being in the right place with the right company. Curr. Opin. Plant Biol. 2022, 65, 102136. [Google Scholar] [CrossRef]
- Li, G.-Z.; Zheng, Y.-X.; Liu, H.-T.; Liu, J.; Kang, G.-Z. WRKY74 regulates cadmium tolerance through glutathione-dependent pathway in wheat. Environ. Sci. Pollut. Res. 2022, 29, 68191–68201. [Google Scholar] [CrossRef]
- Zheng, T.; Lu, X.; Yang, F.; Zhang, D. Synergetic modulation of plant cadmium tolerance via MYB75-mediated ROS homeostasis and transcriptional regulation. Plant Cell Rep. 2022, 41, 1515–1530. [Google Scholar] [CrossRef]
- Lu, Z.; Qiu, W.; Jin, K.; Yu, M.; Han, X.; He, X.; Wu, L.; Wu, C.; Zhuo, R. Identification and analysis of bZIP family genes in Sedum plumbizincicola and their potential roles in response to cadmium stress. Front. Plant Sci. 2022, 13, 859386. [Google Scholar] [CrossRef]
- Yu, Y.; Zhang, L. The wheat NAC transcription factor TaNAC22 enhances cadmium stress tolerance in wheat. Cereal Res. Commun. 2023, 51, 867–877. [Google Scholar] [CrossRef]
- Xu, Z.; Liu, X.; He, X.; Xu, L.; Huang, Y.; Shao, H.; Zhang, D.; Tang, B.; Ma, H. The soybean basic helix-loop-helix transcription factor ORG3-like enhances cadmium tolerance via increased iron and reduced cadmium uptake and transport from roots to shoots. Front. Plant Sci. 2017, 8, 1098. [Google Scholar] [CrossRef]
- Lin, T.; Yang, W.; Lu, W.; Wang, Y.; Qi, X. Transcription factors PvERF15 and PvMTF-1 form a cadmium stress transcriptional pathway. Plant Physiol. 2017, 173, 1565–1573. [Google Scholar] [CrossRef] [PubMed]
- Zhang, P.; Wang, R.; Ju, Q.; Li, W.; Xu, J. The R2R3-MYB transcription factor MYB49 regulates cadmium accumulation. Plant Physiol. 2019, 180, 529–542. [Google Scholar] [CrossRef] [PubMed]
- Wang, H.; Zuo, D.; Zhu, B.; Du, X.; Gu, L. TaMYC8 regulates TaERF6 and inhibits ethylene synthesis to confer Cd tolerance in wheat. Environ. Exp. Bot. 2022, 198, 104854. [Google Scholar] [CrossRef]
- Han, Y.; Fan, T.; Zhu, X.; Wu, X.; Ouyang, J.; Jiang, L.; Cao, S. WRKY12 represses GSH1 expression to negatively regulate cadmium tolerance in Arabidopsis. Plant Mol. Biol. 2019, 99, 149–159. [Google Scholar] [CrossRef]
- Feng, Q.; Zhao, L.; Jiang, S.; Qiu, Y.; Zhai, T.; Yu, S.; Yang, W.; Zhang, S. The C2H2 family protein ZAT17 engages in the cadmium stress response by interacting with PRL1 in Arabidopsis. J. Hazard. Mater. 2024, 465, 133528. [Google Scholar] [CrossRef]


| Length of Root (cm) | Cd0_Se0 | Cd0_Se1 | Cd0_Se5 | Cd20_Se0 | Cd20_Se1 | Cd20_Se5 | |
|---|---|---|---|---|---|---|---|
| Cd0_Se0 | 13.61 ± 1.31 | 1 | |||||
| Cd0_Se1 | 14.80 ± 2.19 | 0.075 | 1 | ||||
| Cd0_Se5 | 11.78 ± 1.25 | 0.007 ** | 0.0001 ** | 1 | |||
| Cd20_Se0 | 9.22 ± 0.88 | 0.0001 ** | 0.0001 ** | 0.0001 ** | 1 | ||
| Cd20_Se1 | 10.92 ± 1.25 | 0.0001 ** | 0.0001 ** | 0.196 | 0.012 * | 1 | |
| Cd20_Se5 | 9.68 ± 1.05 | 0.0001 ** | 0.0001 ** | 0.002 ** | 0.489 | 0.063 | 1 |
| Value of SPAD | Cd0_Se0 | Cd0_Se1 | Cd0_Se5 | Cd20_Se0 | Cd20_Se1 | Cd20_Se5 | |
|---|---|---|---|---|---|---|---|
| Cd0_Se0 | 46.33 ± 2.22 | 1 | |||||
| Cd0_Se1 | 50.52 ± 2.95 | 0.001 ** | 1 | ||||
| Cd0_Se5 | 47.35 ± 3.17 | 0.4 | 0.011 * | 1 | |||
| Cd20_Se0 | 37.90 ± 1.95 | 0.0001 ** | 0.0001 ** | 0.0001 ** | 1 | ||
| Cd20_Se1 | 45.20 ± 3.40 | 0.351 | 0.0001 ** | 0.079 | 0.0001 ** | 1 | |
| Cd20_Se5 | 39.81 ± 2.05 | 0.0001 ** | 0.0001 ** | 0.0001 ** | 0.118 | 0.0001 ** | 1 |
Disclaimer/Publisher’s Note: The statements, opinions and data contained in all publications are solely those of the individual author(s) and contributor(s) and not of MDPI and/or the editor(s). MDPI and/or the editor(s) disclaim responsibility for any injury to people or property resulting from any ideas, methods, instructions or products referred to in the content. |
© 2025 by the authors. Licensee MDPI, Basel, Switzerland. This article is an open access article distributed under the terms and conditions of the Creative Commons Attribution (CC BY) license (https://creativecommons.org/licenses/by/4.0/).
Share and Cite
Zheng, X.; Luo, J.; Li, X.; Zhang, C.; Wan, G.; Xia, C.; Lu, J. Selenium Alleviates Cadmium Toxicity by Regulating Carbon Metabolism, AsA-GSH Cycle, and Cadmium Transport in Glycyrrhiza uralensis Fisch. Seedlings. Plants 2025, 14, 1736. https://doi.org/10.3390/plants14121736
Zheng X, Luo J, Li X, Zhang C, Wan G, Xia C, Lu J. Selenium Alleviates Cadmium Toxicity by Regulating Carbon Metabolism, AsA-GSH Cycle, and Cadmium Transport in Glycyrrhiza uralensis Fisch. Seedlings. Plants. 2025; 14(12):1736. https://doi.org/10.3390/plants14121736
Chicago/Turabian StyleZheng, Xuerong, Jiafen Luo, Xin Li, Chaoyue Zhang, Guigui Wan, Caixia Xia, and Jiahui Lu. 2025. "Selenium Alleviates Cadmium Toxicity by Regulating Carbon Metabolism, AsA-GSH Cycle, and Cadmium Transport in Glycyrrhiza uralensis Fisch. Seedlings" Plants 14, no. 12: 1736. https://doi.org/10.3390/plants14121736
APA StyleZheng, X., Luo, J., Li, X., Zhang, C., Wan, G., Xia, C., & Lu, J. (2025). Selenium Alleviates Cadmium Toxicity by Regulating Carbon Metabolism, AsA-GSH Cycle, and Cadmium Transport in Glycyrrhiza uralensis Fisch. Seedlings. Plants, 14(12), 1736. https://doi.org/10.3390/plants14121736