Article

Genetic Analyses, BSA-Seq, and Transcriptome Analyses Reveal Candidate Genes Controlling Leaf Plastochron in Rapeseed (Brassica napus L.)

1
College of Agronomy, Northwest A&F University, Yangling 712100, China
2
Crop Research Institute, Guangdong Academy of Agricultural Science, Guangzhou 510640, China
3
Institute of Agricultural Sciences, Xizang Academy of Agriculture and Animal Husbandry Sciences, Lhasa 850000, China
*
Authors to whom correspondence should be addressed.
These authors contributed equally to this work.
Plants 2025, 14(11), 1719; https://doi.org/10.3390/plants14111719
Submission received: 15 April 2025 / Revised: 24 May 2025 / Accepted: 2 June 2025 / Published: 5 June 2025
(This article belongs to the Special Issue Crop Functional Genomics and Biological Breeding—2nd Edition)

Abstract

:
The leaf plastochron serves as an indicator of the rate of leaf appearance, biomass accumulation, and branch number, while also impacting plant architecture and seed yield. However, research on the leaf plastochron of crops remains limited. In this study, 2116C exhibited a rapid leaf plastochron compared to ZH18 during both rosette and bud periods. There were significant positive correlations among the leaf plastochron and primary branch number of the F2 populations (r ranging from 0.395 to 0.635, p < 0.01). Genetic analyses over two years demonstrated that two equally dominant genes might govern the leaf plastochron. Through bulk segregant analysis sequencing (BSA-seq), three novel genomic intervals were identified on chromosomes A02 (9.04–9.48 Mb and 13.52–13.66 Mb) and A04 (19.84–20.14 Mb) of ZS11 and Darmor-bzh reference genomes. By gene functional annotations, single-nucleotide variation (SNV) analyses, transcriptome data from parents, genetic progeny, and natural accessions, we identified ten candidate genes within the intervals, including FLOWERING LOCUS T, RGL1, MYB-like, CYP96A8, BLH3, NIT2, ASK6, and three CLAVATA3/ESR (CLE)-related genes. These findings lay the molecular foundation for further exploration into the leaf plastochron and the implications in plastochron-related breeding in rapeseed.

1. Introduction

The leaf plastochron, defined as the temporal interval between the initiation of two successive leaf primordia at the shoot apical meristem (SAM), is a critical parameter in plant developmental studies [1,2]. The shorter the leaf plastochron indicates, the faster the rate of leaf initiation and leaf appearance. The final number of leaves depends upon the rate and pattern of leaf initiation during the growth phase [3,4]. During leaf axillary meristem development, axillary buds are regulated by diverse signals together to form into branches, e.g., polar transport of auxin, abscisic acid from buds, cytokinins from root tips, strigolactone, sugar signaling, and red light [5,6,7,8]. Consequently, the higher final leaf count corresponds to the more axillary meristems, potentially leading to enhanced branch formation. It is known that leaves and branches serve as key organs for photosynthesis and the architecture of rapeseed [8,9]. Thus, the leaf plastochron holds significance for improving biomass, plant architecture, and photosynthesis in crops.
Despite the importance of leaf plastochron pattern in the plant architecture, little is known about the genetic regulation and molecular mechanisms of the leaf plastochron. Leaf initiation originates from shoot apical meristems (SAMs), whose organization and function were maintained by the conserved WUSCHEL-CLAVATA3 (WUS-CLV3) feedback loop [10]. In rice (Oryza sativa L.), mutations in PLASTOCHRON1 (PLA1) and PLA2 accelerate leaf initiation without altering phyllotaxy [1,2,11]. PLA1 regulates the leaf plastochron by modulating meristem developmental timing, and PLA2 may mediate non-cell-autonomous signals from immature leaves to suppress new leaf initiation in the shoot apical meristem. Both of them act as the downstream of the GA signal transduction pathway [12], and PLA1 also regulates leaf inclination through the brassinolide pathway [13]. In maize (Zea mays), ZmPLA1 maintains the dividing of cells in a proliferative and undifferentiated state for a longer time, thereby stimulating the duration of leaf elongation, which could increase organ growth, seedling vigor, biomass, and seed yield [14]. In addition, the leaf plastochron will also vary according to the light and cumulative temperature, which influences the duration of nutrient growth, developmental rate, total leaf number, biomass, and seed yield of plants [15,16,17]. Although the mechanisms underlying leaf plastochron regulation remain to be elucidated in dicot crops such as rapeseed, the identified regulatory links to SAMs and hormone signaling provide a directional framework for future exploration.
Rapeseed (Brassica napus L., AACC, 2n = 38) is a globally significant oil crop with extensive cultivation areas and is one of the four largest oil crops in the world. It not only provides edible oil for humans and protein-rich feed for animals, but also provides a series of novel vegetables, such as sprouts, leaves, and shoots [18,19,20]. The rapid-plastochron varieties could grow fast with more leaves, branches, and shoots, which have certain application value for vegetable, edible oil, green manure, and oil-vegetable-dual-purpose rapeseed. Therefore, it is meaningful to explore and identify rapid plastochron germplasm and genetic resources to facilitate the utilization and improvement of leaf plastochron-related traits. In this study, two rapeseed inbred lines with various plant plastochrons were used for progeny population construction. We performed major genes plus polygenes inheritance analyses for plastochron-related traits across two years among F2 populations and constructed bulk pools using extreme F2 individuals for Bulked Segregant Analysis (BSA) sequencing to identify candidate genomic intervals. Candidate genes were then predicted by gene sequence variation and expression information within the intervals. These results will help to expand our knowledge of the genetic mechanism of leaf plastochron and provide a theoretical basis for plastochron-related breeding and molecular biology in rapeseed.

2. Results

2.1. Investigation of Plastochron for the Parents

To investigate the leaf plastochron pattern in rapeseed, the rates of leaf appearance of ZH18 (slow-plastochron line) and 2116C (rapid-plastochron line) were continuously counted before the wintering period. During the pre-winter growth process, there were two peaks of leaf plastochron in both lines, and the leaf appearance rate showed the characteristics of ‘slow-rapid’ alternation. ZH18 had the fastest leaf plastochron in the 3rd–4th and 7th–8th leaves, while 2116C had the fastest in the 5th–8th and the 10th–13th leaves. The final number of fully expanded leaves of ZH18 and 2116C were 8 leaves and 14 leaves, while their visible leaves were 13 leaves and 20 leaves, respectively (Figure 1). The average leaf appearance rate was 3.2 days/leaf in ZH18 and 5.1 days/leaf in 2116C. 2116C consistently had significantly higher leaf numbers and leaf plastochron than ZH18 at the rosette stage (Figure 1), which indicated that there was likely to be a certain mutation consistently affecting the leaf appearance and plastochron all the time.

2.2. Phenotype Investigation for the Parents and Genetic Population

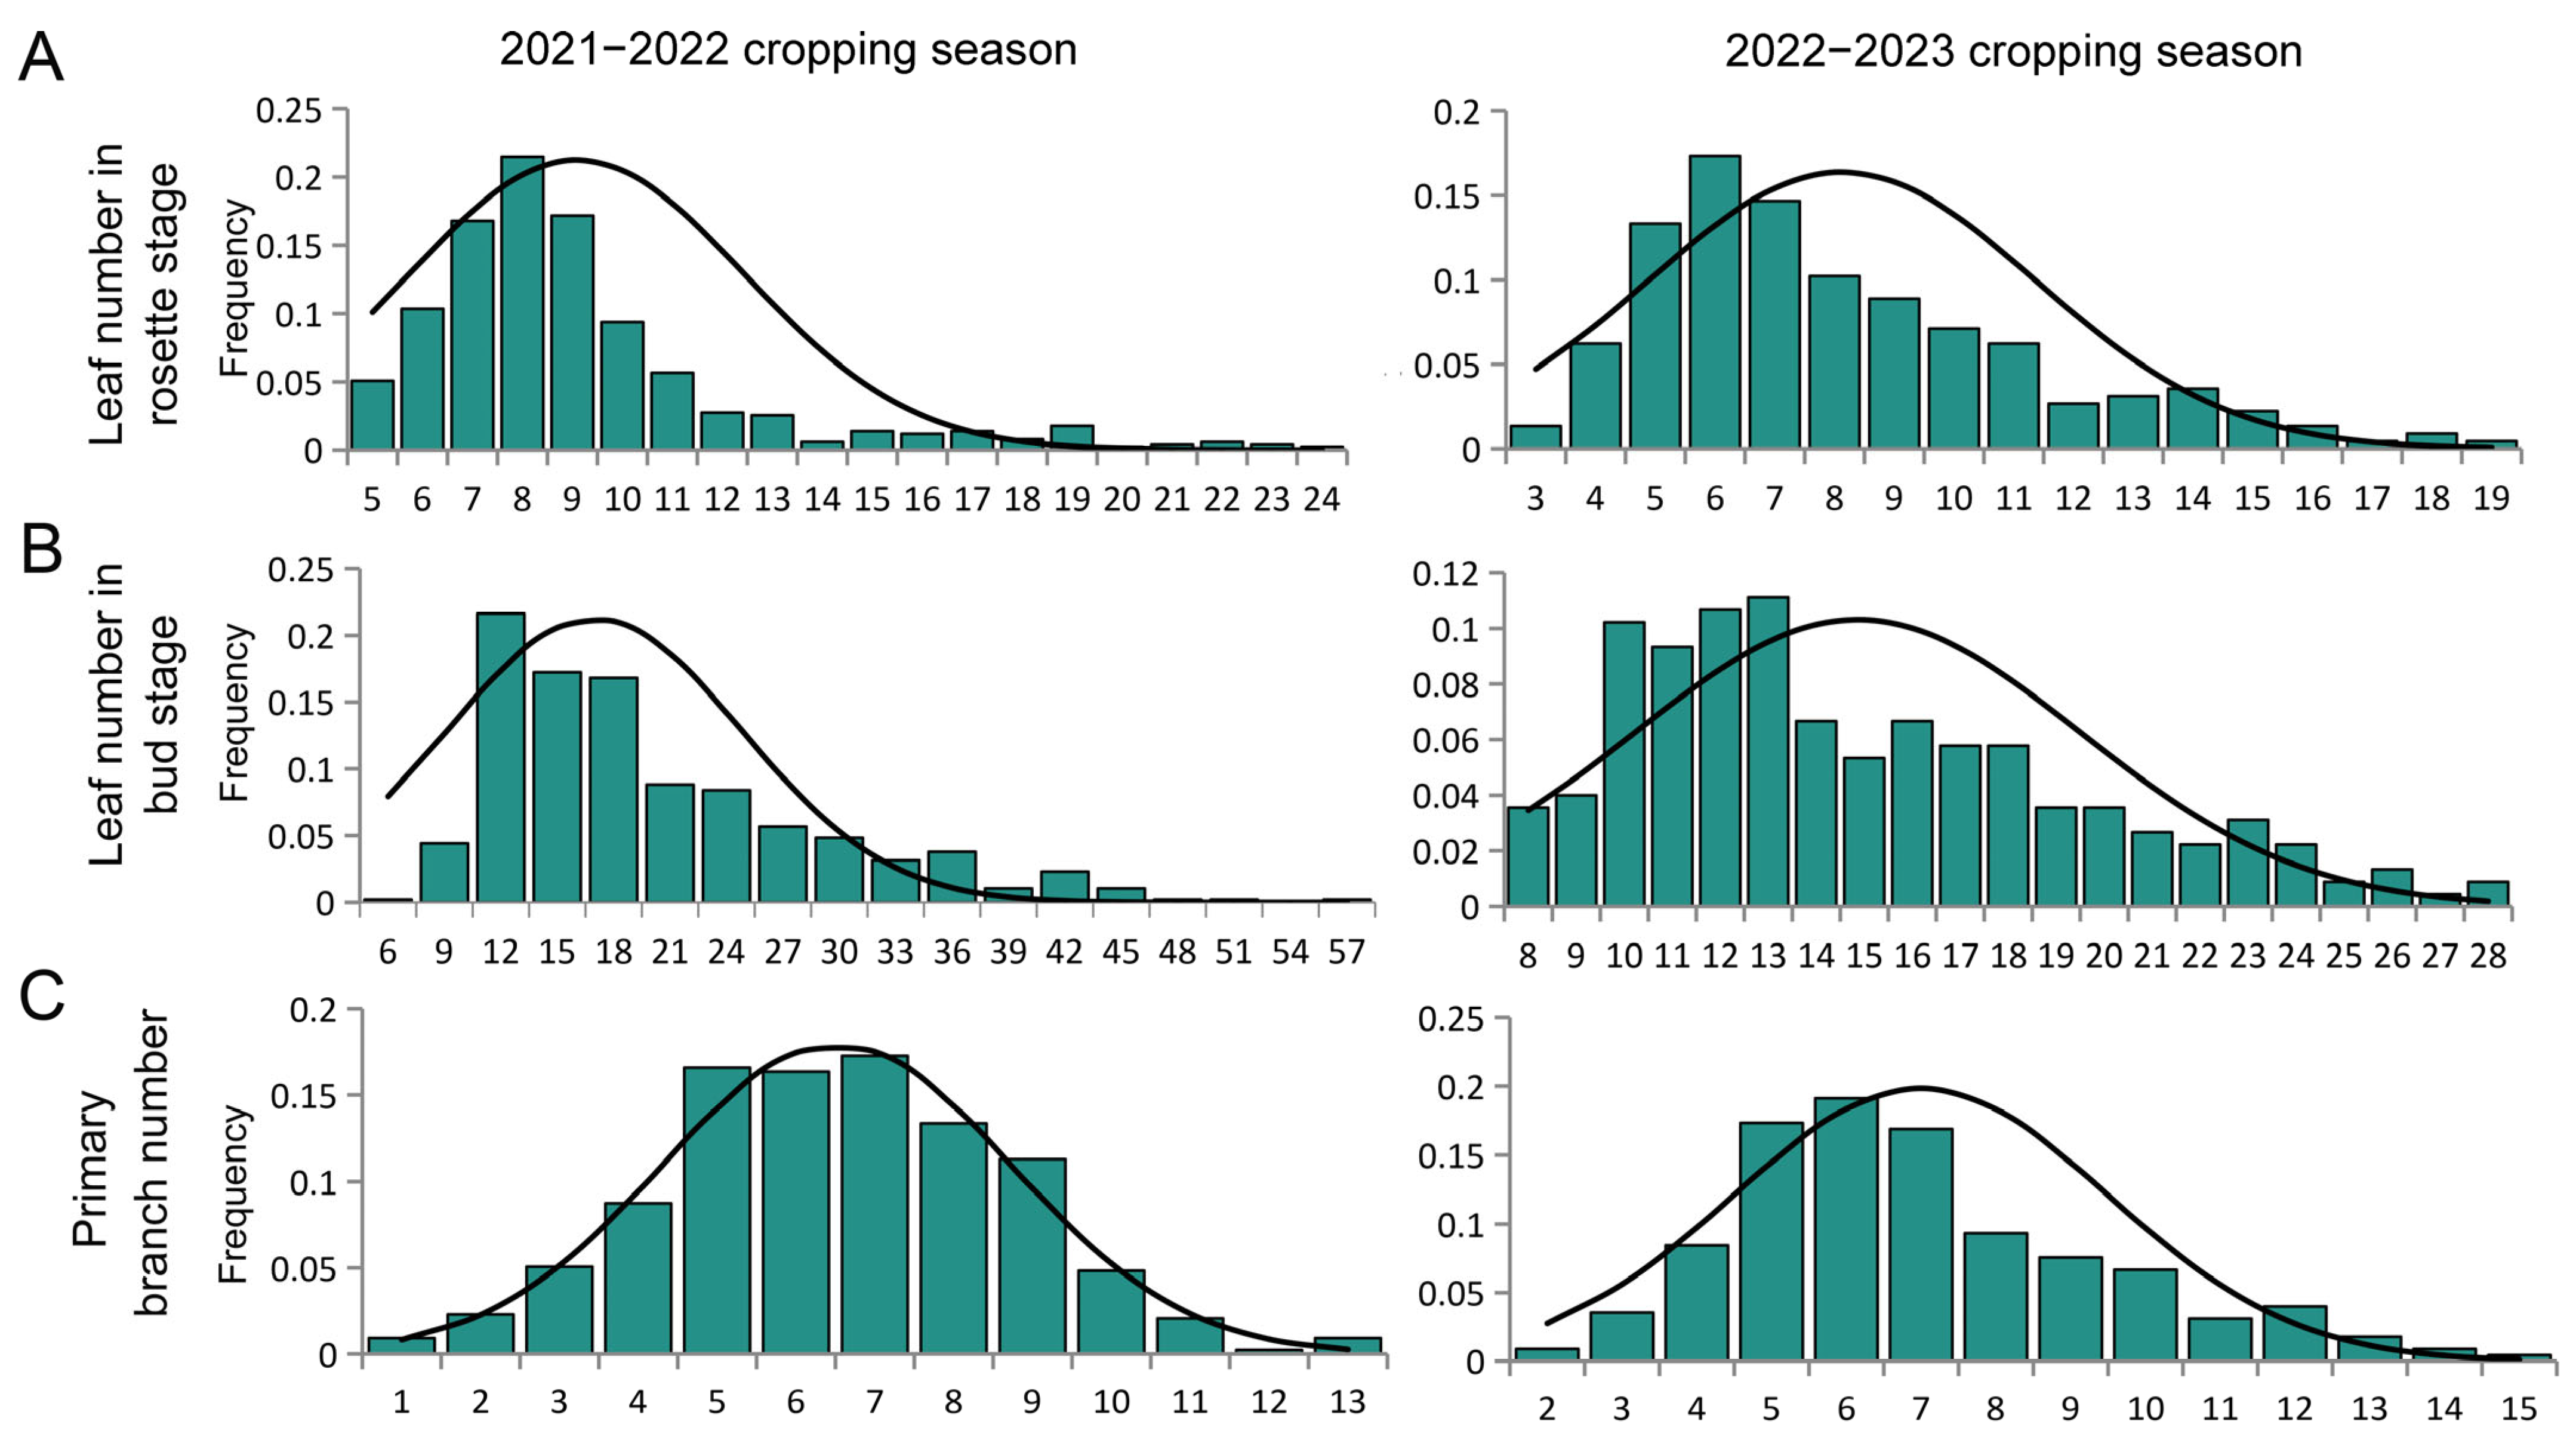
To conveniently study the genetic characteristics of the leaf plastochron, we subsequently used the leaf number at the same number of days after sowing to represent the leaf plastochron of the individual. From the phenotypic survey results of the 2021–2022 and 2022–2023 cropping seasons (Table S1), the mean values of expanded leaf number at the rosette stage were 5.3 and 7.5 in ZH18, 12.2 and 13.6 in 2116C, 9.6 and 10.1 in F1 plants, and 8.1 and 9.1 in F2 population, respectively. During the bud stage, the mean values of the number of leaves were 7.6 and 10.6 in ZH18, 23.1 and 18.4 for 2116C, 14.9 and 15.5 in the F1 plants, and 17 and 14.9 in the F2 population, respectively. The number of leaves in F1 was intermediate between the two parents, and the leaf number of the F2 population showed a unimodal distribution (Figure 2). Therefore, the leaf plastochron at the rosette-bud stages of rapeseed has a quantitative trait genetic character. The correlation analysis showed that there were highly significant correlations among leaf plastochron at the rosette stage and the bud stage (p < 0.01) with the primary branch number (p < 0.01) (Table S2). These results indicated that there might be an intrinsic positive correlation between the leaf plastochron and the primary branch number.

2.3. Genetic Analysis of Leaf Plastochron in Rapeseed

To predict the mixed major genes plus polygenes inheritance of leaf plastochron in rapeseed, we utilized the leaf number of ZH18, 2116C, F1, and F2 in the 2021–2022 and 2022–2023 cropping seasons for genetic model prediction. Based on the principle of minimum Akaike’s information criterion (AIC) value, the alternative models for leaf plastochron at the rosette stage were one major gene with equal additive-dominance (1MG-EAD) and two major genes with equal additive-dominance (2MG-EAD), and those for leaf plastochron at the bud stage were 2MG-EAD and two major genes plus polygenes with completely dominance and additive-dominance (MX2-CD-AD) across the two cropping seasons (Table 1). Similarly, the most appropriate genetic models for primary branch numbers were 2MG-EA and 2MG-EAD. In the fitness test, the models with more counts of significant p-values (p < 0.05) were selected as the optimal genetic models (Table S3). Taken together, the 2MG-EAD genetic model was the most appropriate model for leaf plastochron after the fitness test.
Using the 2MG-EAD model, we predicted the genetic parameters for leaf-related traits. The additive effects of major genes were consistently negative, with heritability exceeding 86.4% (Table S4). It was evident that leaf plastochron was mainly controlled by two equally dominant effect genes with high heritability and negative additive-dominant effects. These results could provide cues for the exploration of leaf plastochron in rapeseed.

2.4. Primary QTL Identification Based on BSA Analyses

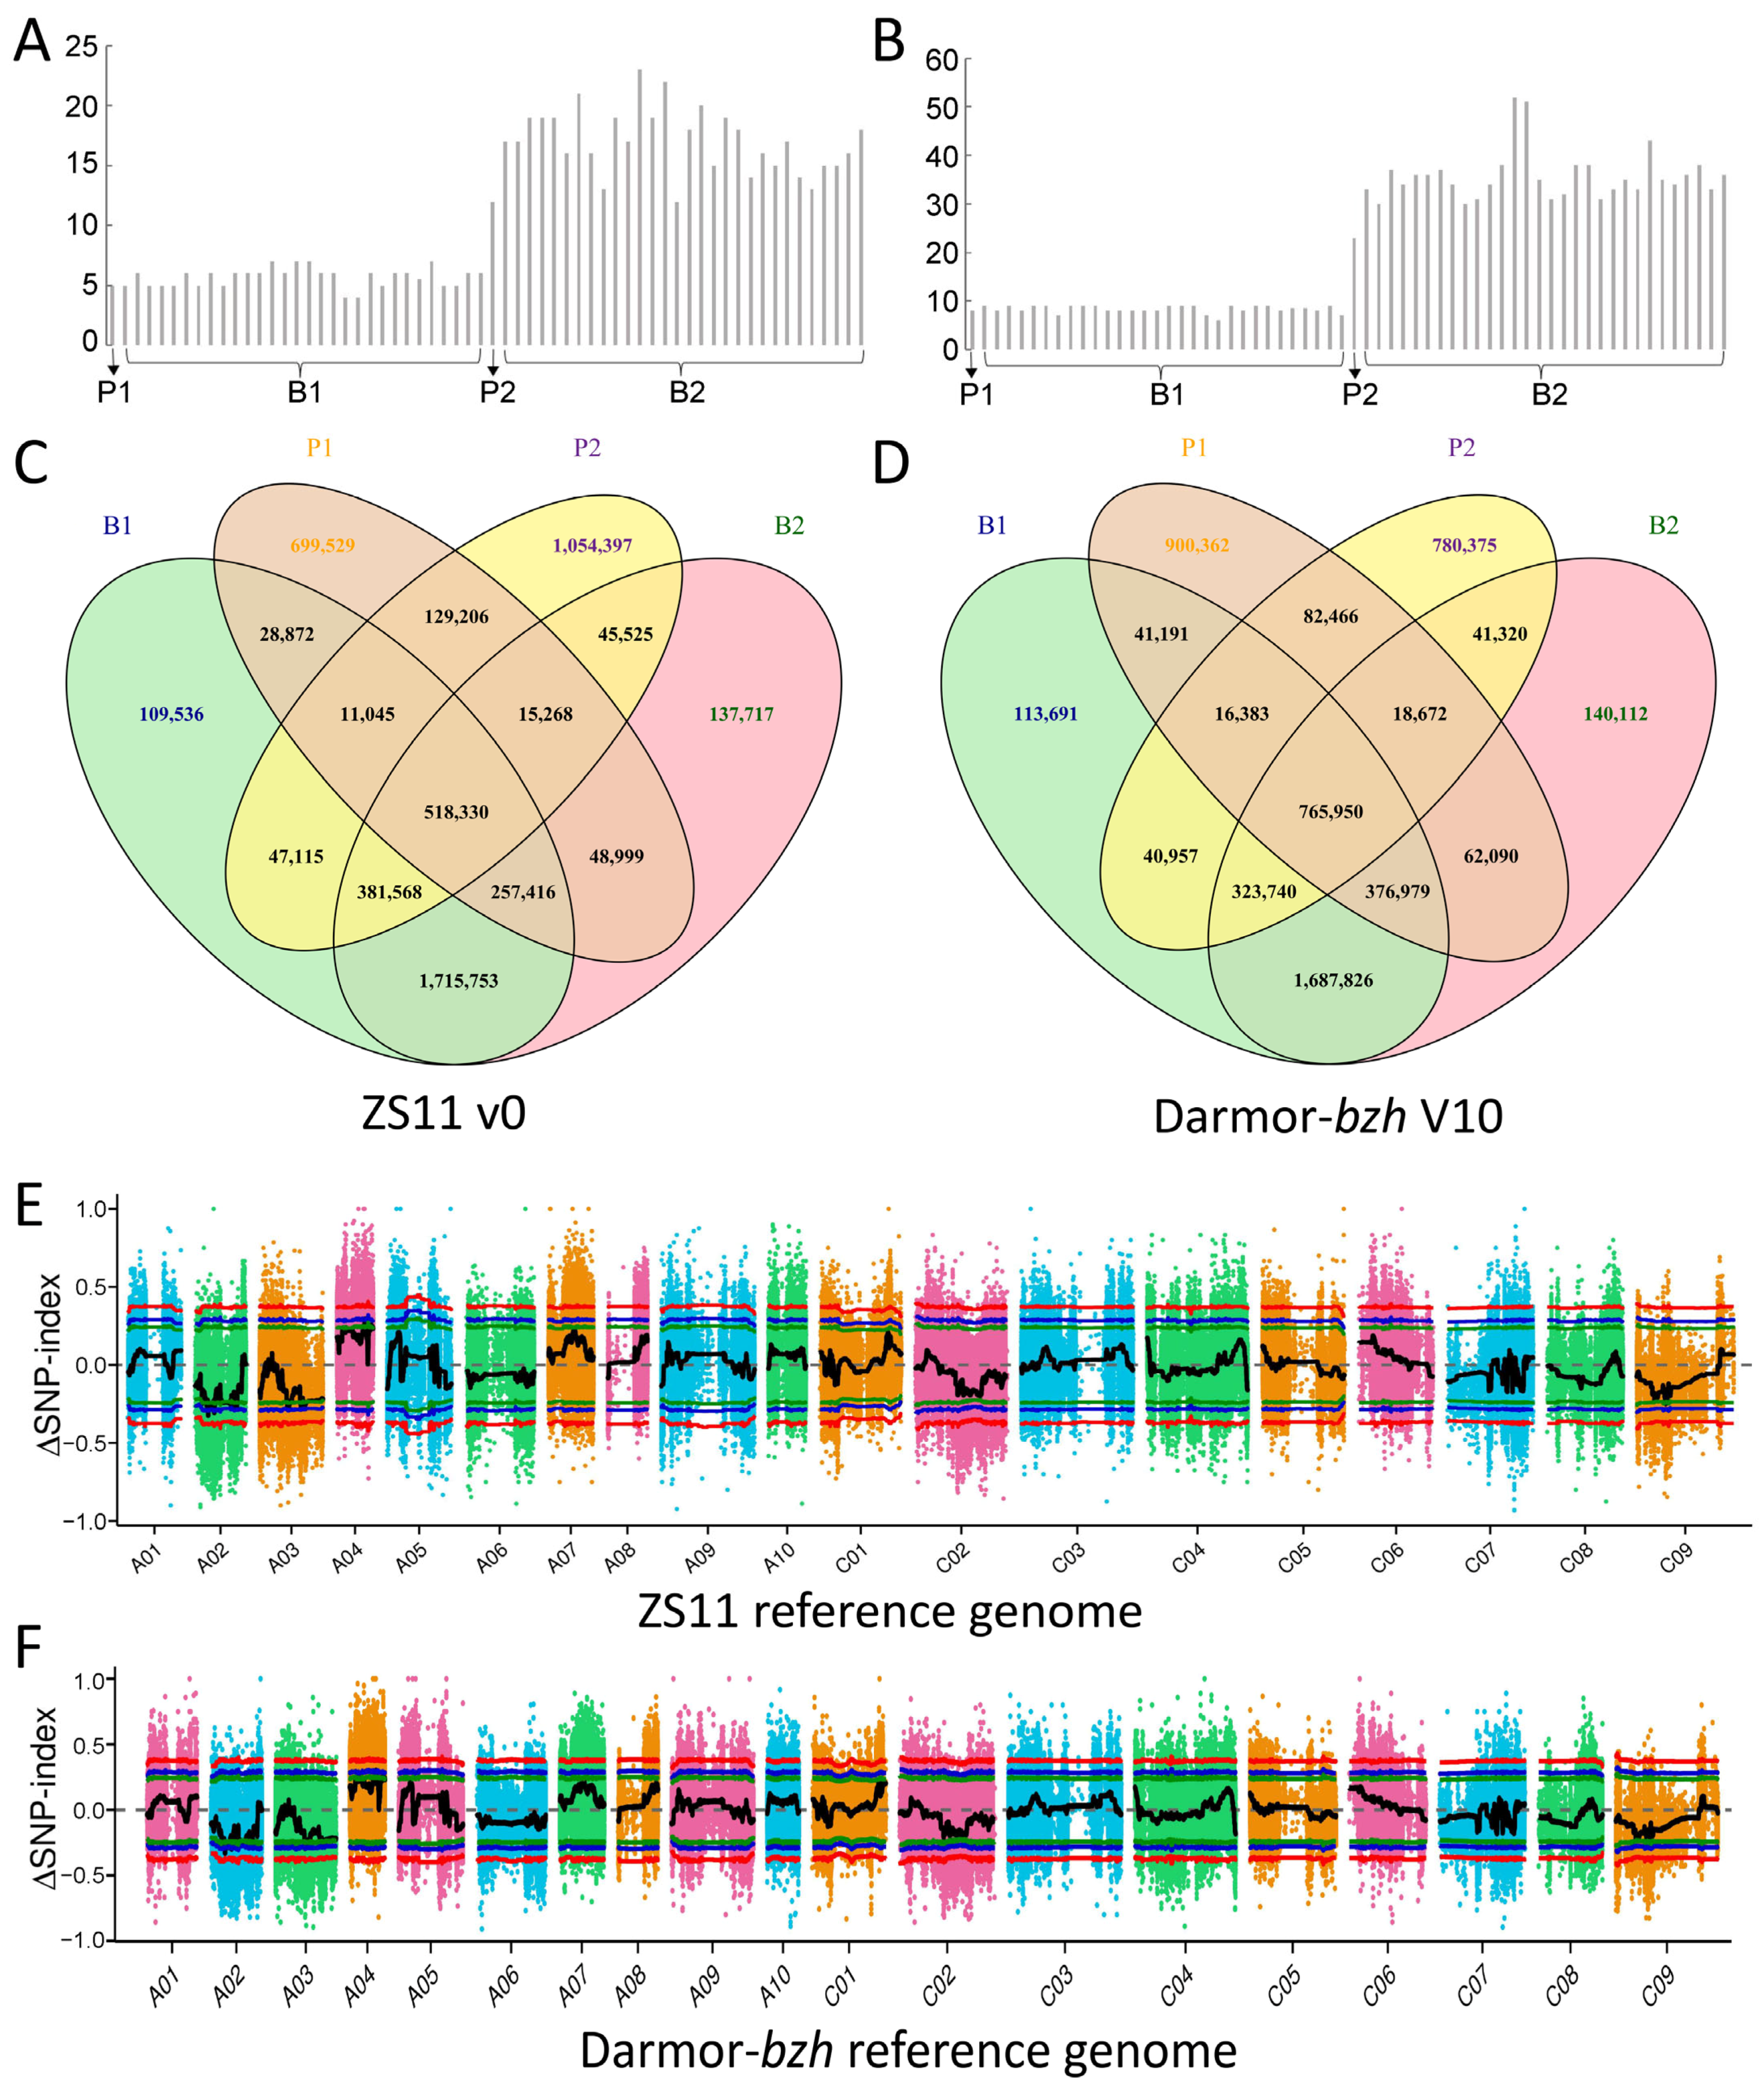
To gain further access to the genome intervals controlling leaf plastochron, BSA sequencing for the parents and F2 population was approached. During the 2021–2022 cropping season, the two parents, along with two bulked pools B1 (slow plastochron bulk pool with 30 plants from 600 F2 individuals) and B2 (rapid-plastochron bulk pool with 30 plants from 600 F2 individuals) were selected for whole-genome resequencing (Figure 3). The number of leaves at the rosette stage and the bud stage was counted (Figure 2A,B). The reference genome alignment and read coverage statistics for resequencing of four samples were stated, and sequencing coverage at least 1X was >89.9% for the parents and F2 bulked pools (Table S5).
For the ZS11 v0 genome assembly, alignment of the reads from ZH18 and 2116C to the reference genome revealed a total of 2,264,093 and 2,069,863 SNPs, respectively. There were 3,366,717 and 3,416,689 SNPs determined from the B1 and B2 bulked pools, and 51,833 SNPs were shared among P1, P2, B1, and B2 (Figure 3C). In addition, 610,689, 583,140, 901,648, and 610,689 small InDels were detected from ZH18, 2116C, B1, and B2, respectively (Figure S1 and Table S5). Twenty genomic regions with a total length of 0.89 Mb were identified based on SNPs with a confidence interval of 95 on chromosomes A02, A03, and A04 (Figure 3E and Table S6). Twenty-eight regions on chromosomes A02 and A04 with a confidence interval of only 90 were obtained from 1,073,929 small InDels (Figure S2 and Table S6).
For the Darmor-bzh V10 genome assembly, a total of 765,950 SNPs and 207,694 InDels were shared among P1, P2, B1, and B2 (Figure 3D and Figure S1). A total of 28 genomic regions associated with SNPs were identified with a confidence interval of 95 on chromosomes A02 and A04 (Figure 3F and Table S7), while 17 regions for InDels with a confidence interval of only 90 were on chromosomes A02, A03, and A04 (Figure S3 and Table S7). Overall, the QTL outcomes of SNPs were preferred due to genetic density and the higher confidence interval, and 107 and 113 genes were located in the intervals from ZS11 and Darmor-bzh, respectively (Table 2).
The intervals between ZS11 and Darmor-bzh showed high genome collinearity, and 90 genes of ZS11 have more than 30% protein identity with that of Darmor-bzh (Figure S4 and Table S8), suggesting that the QTL intervals were conserved in rapeseed. Taken together, the candidate intervals controlling plant plastochron might be located in A02:9.04−9.48 Mb (labeled as qPLA.A02-1), A02:13.52−13.66 Mb (labeled as qPLA.A02-2), and A04:19.84−20.14 Mb (labeled as qPLA.A04) of the ZS11 genome.

2.5. Gene Annotations and Sequence Variants Analyses in Candidate Genes

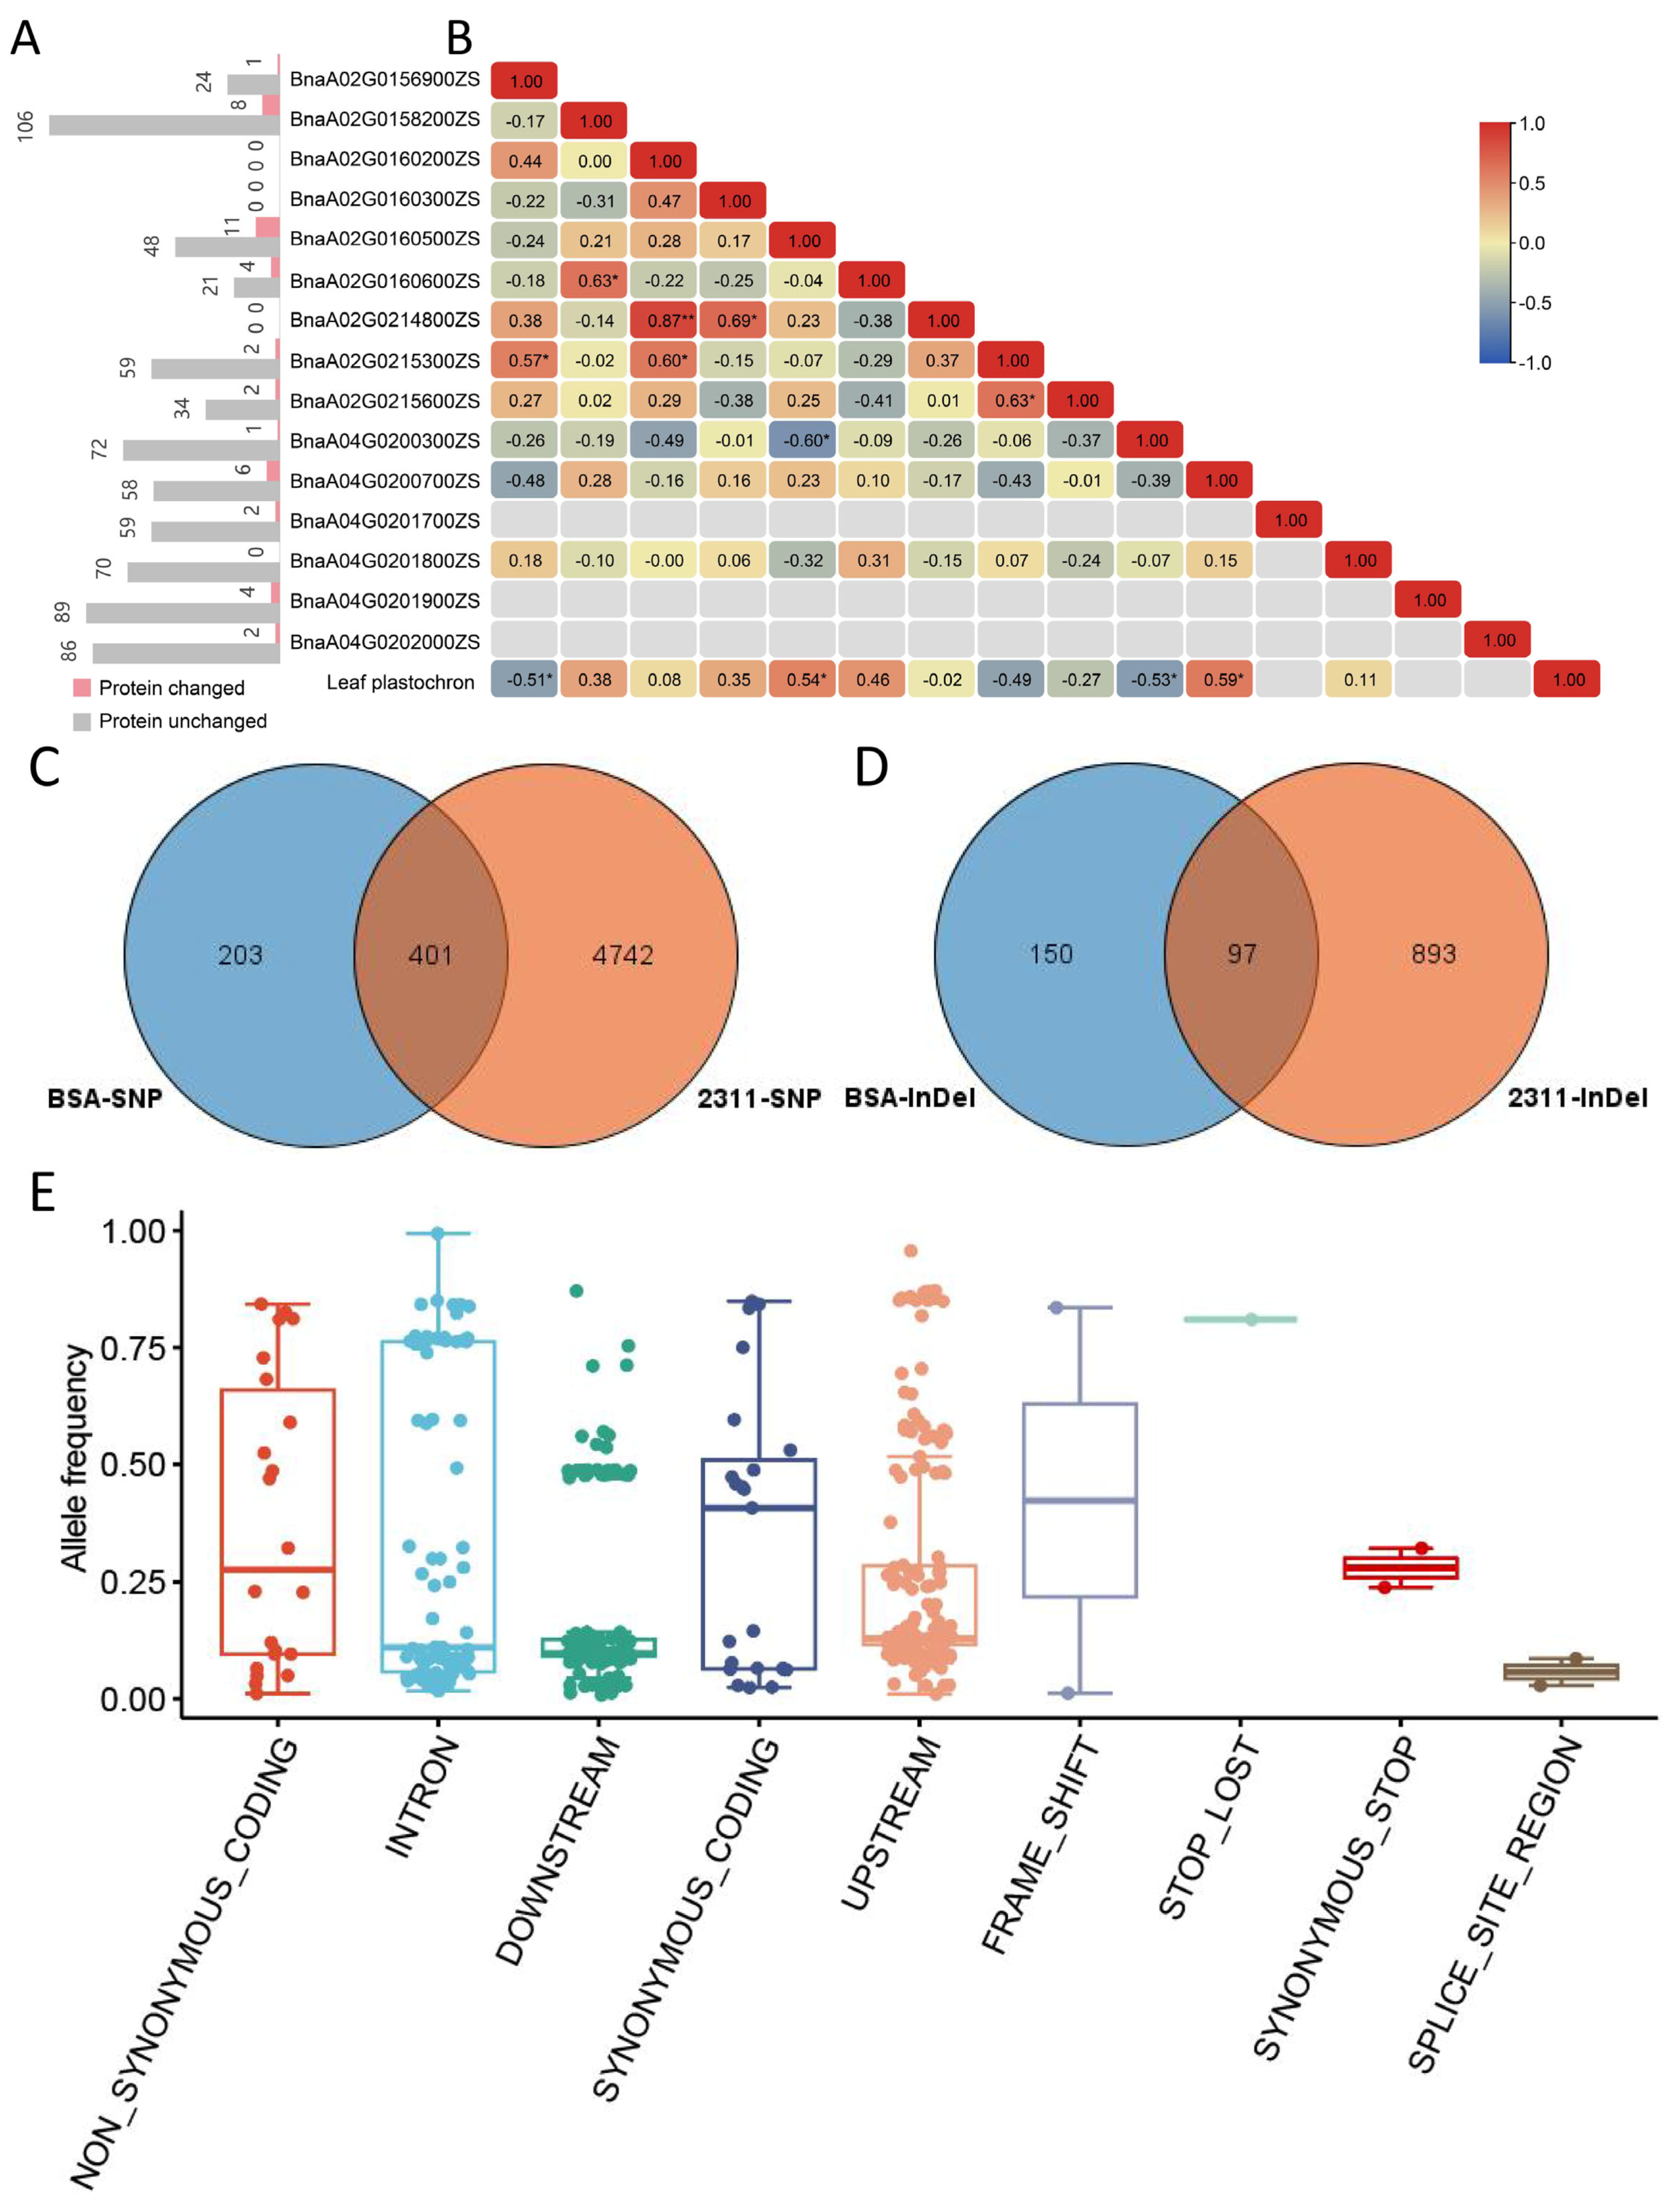
Within the three QTL intervals, a total of 90 genome genes were identified in the ZS11 genome (Table 2). Among these genes, 15 genes might be the causal genes that annotated as FLOWERING LOCUS T (BnaA02G0156900ZS), DELLA protein (BnaA02G0158200ZS and BnaA02G0160500ZS), Senescence-associated protein (BnaA02G0160200ZS), ACCELERATED CELL DEATH 6 (BnaA02G0160300ZS), MYB-like (BnaA02G0160600ZS), bifunctional nuclease 1 (BnaA02G0214800ZS), CYP96A8 (BnaA02G0215600ZS), BLH3 (BnaA02G0215300ZS), Nitrilase 2 (BnaA04G0200300ZS), GSK3-like protein kinase (BnaA04G0200700ZS), G-protein coupled receptor (BnaA04G0201800ZS), and CLAVATA3/ESR (CLE)-related protein (BnaA04G0201700ZS, BnaA04G0201900ZS, and BnaA04G0202000ZS). According to SNP and InDel annotations, there were 604 and 247 variants identified among 12 of the 15 genes, including 312 in upstream, 325 in downstream, 142 in intron, 1 in 5’ UTR, 1 in 3’ UTR, 29 leading to synonymous coding, and 41 leading to non-synonymous coding (Figure 4A and Table S9). BnaA04G0201700ZS and BnaA04G0201800ZS only showed 143 and 70 variants in upstream, downstream, and synonymous coding.
Variation information of 2311 rapeseed accessions extracted 5143 SNPs and 990 small InDels from the 15 genes mentioned above, and 203 SNPs and 150 InDels from BSA sequencing were not detected in the database (Figure 4C,D), which were unique to the variations between the parents in this study. Among the parental-specific variants, they were distributed over 12 genes (Table S10), resulting in four altered protein sequences of them (BnaA02G0215300ZS, BnaA02G0160600ZS, BnaA04G0200700ZS, and BnaA04G0201900ZS). Among the 498 common variants, 27 variants were distributed in nine genes (BnaA02G0156900ZS, BnaA02G0158200ZS, BnaA02G0160500ZS, BnaA02G0160600ZS, BnaA02G0215600ZS, BnaA04G0200300ZS, BnaA04G0200700ZS, BnaA04G0201900ZS, and BnaA04G0202000ZS) and caused alterations of the encoded proteins (Table S10). The allele frequency of these variants ranged between 0.01 and 0.85 (Figure 4E), and those with low allele frequency variants were more likely to be the candidate loci.

2.6. Gene Expression Analyses in Candidate Genes

Given that the results of the phenotypic analyses suggest that plant plastochron might be controlled by continuous regulation, the candidate genes should be consistently expressed, whether at the stem tip or in leaf-associated tissues. For genes with protein sequence alterations, the expression of candidate genes may not correlate with leaf plastochron. For genes with unaltered protein sequences, the expression should correlate with leaf plastochron, and there were SNPs/InDel in their upstream, downstream, or UTR regions.
The principal components analysis (PCA) based on FPKM of the 15 candidate genes showed that the 12 RNA-seq samples were effectively divided into slow-plastochron and rapid-plastochron groups (Figure S5). For the gene expression among the parents and F2:3 families, only four genes (BnaA02G0158200ZS, BnaA04G0201700ZS, BnaA04G0201900ZS, and BnaA04G0202000ZS) did not show detected expression abundances, and the other genes showed different expression trends (Figure S6). The expressions of BnaA02G0160500ZS and BnaA04G0200700ZS displayed significantly positive correlations to leaf plastochron (p < 0.05, r = 0.54 and 0.59, respectively), while BnaA02G0156900ZS and BnaA04G0200300ZS showed negative correlations to leaf plastochron (p < 0.05, r = −0.51 and −0.53, respectively) (Figure 4B). In the public gene expression data, three genes (BnaA04G0201700ZS, BnaA04G0201900ZS, and BnaA04G0202000ZS) did not express, and three genes (BnaA02G0158200ZS, BnaA02G0160600ZS, and BnaA04G0201800ZS) showed low expression in all of these tissues (Table S11). BnaA02G0156900ZS was not expressed in cotyledons and roots but was highly expressed in different-period leaves (Table S11). In addition, we observed that there were three tandem repeats of CLE genes within the qPLA.A04 interval, and although they were not detected to be expressed in this study, since WUS-CLV was an essential feedback regulatory loop for maintaining the stability of the shoot apical meristem, we considered them as potential candidate genes as well.
Taken together, we regarded BnaA02G0156900ZS (FT), BnaA02G0160500ZS (RGL1), and BnaA02G0160600ZS (MYB-like) as potential candidate genes for qPLA.A02-1, BnaA02G0215600ZS (CYP96A8) and BnaA02G0215300ZS (BLH3) for qPLA.A02-2, and BnaA04G0200300ZS (NIT2), BnaA04G0200700ZS (ASK6), BnaA04G0201700ZS (CLE4), BnaA04G0201900ZS (CLE6), and BnaA04G0202000ZS (CLE7) for qPLA.A04 (Table 3).

3. Discussion

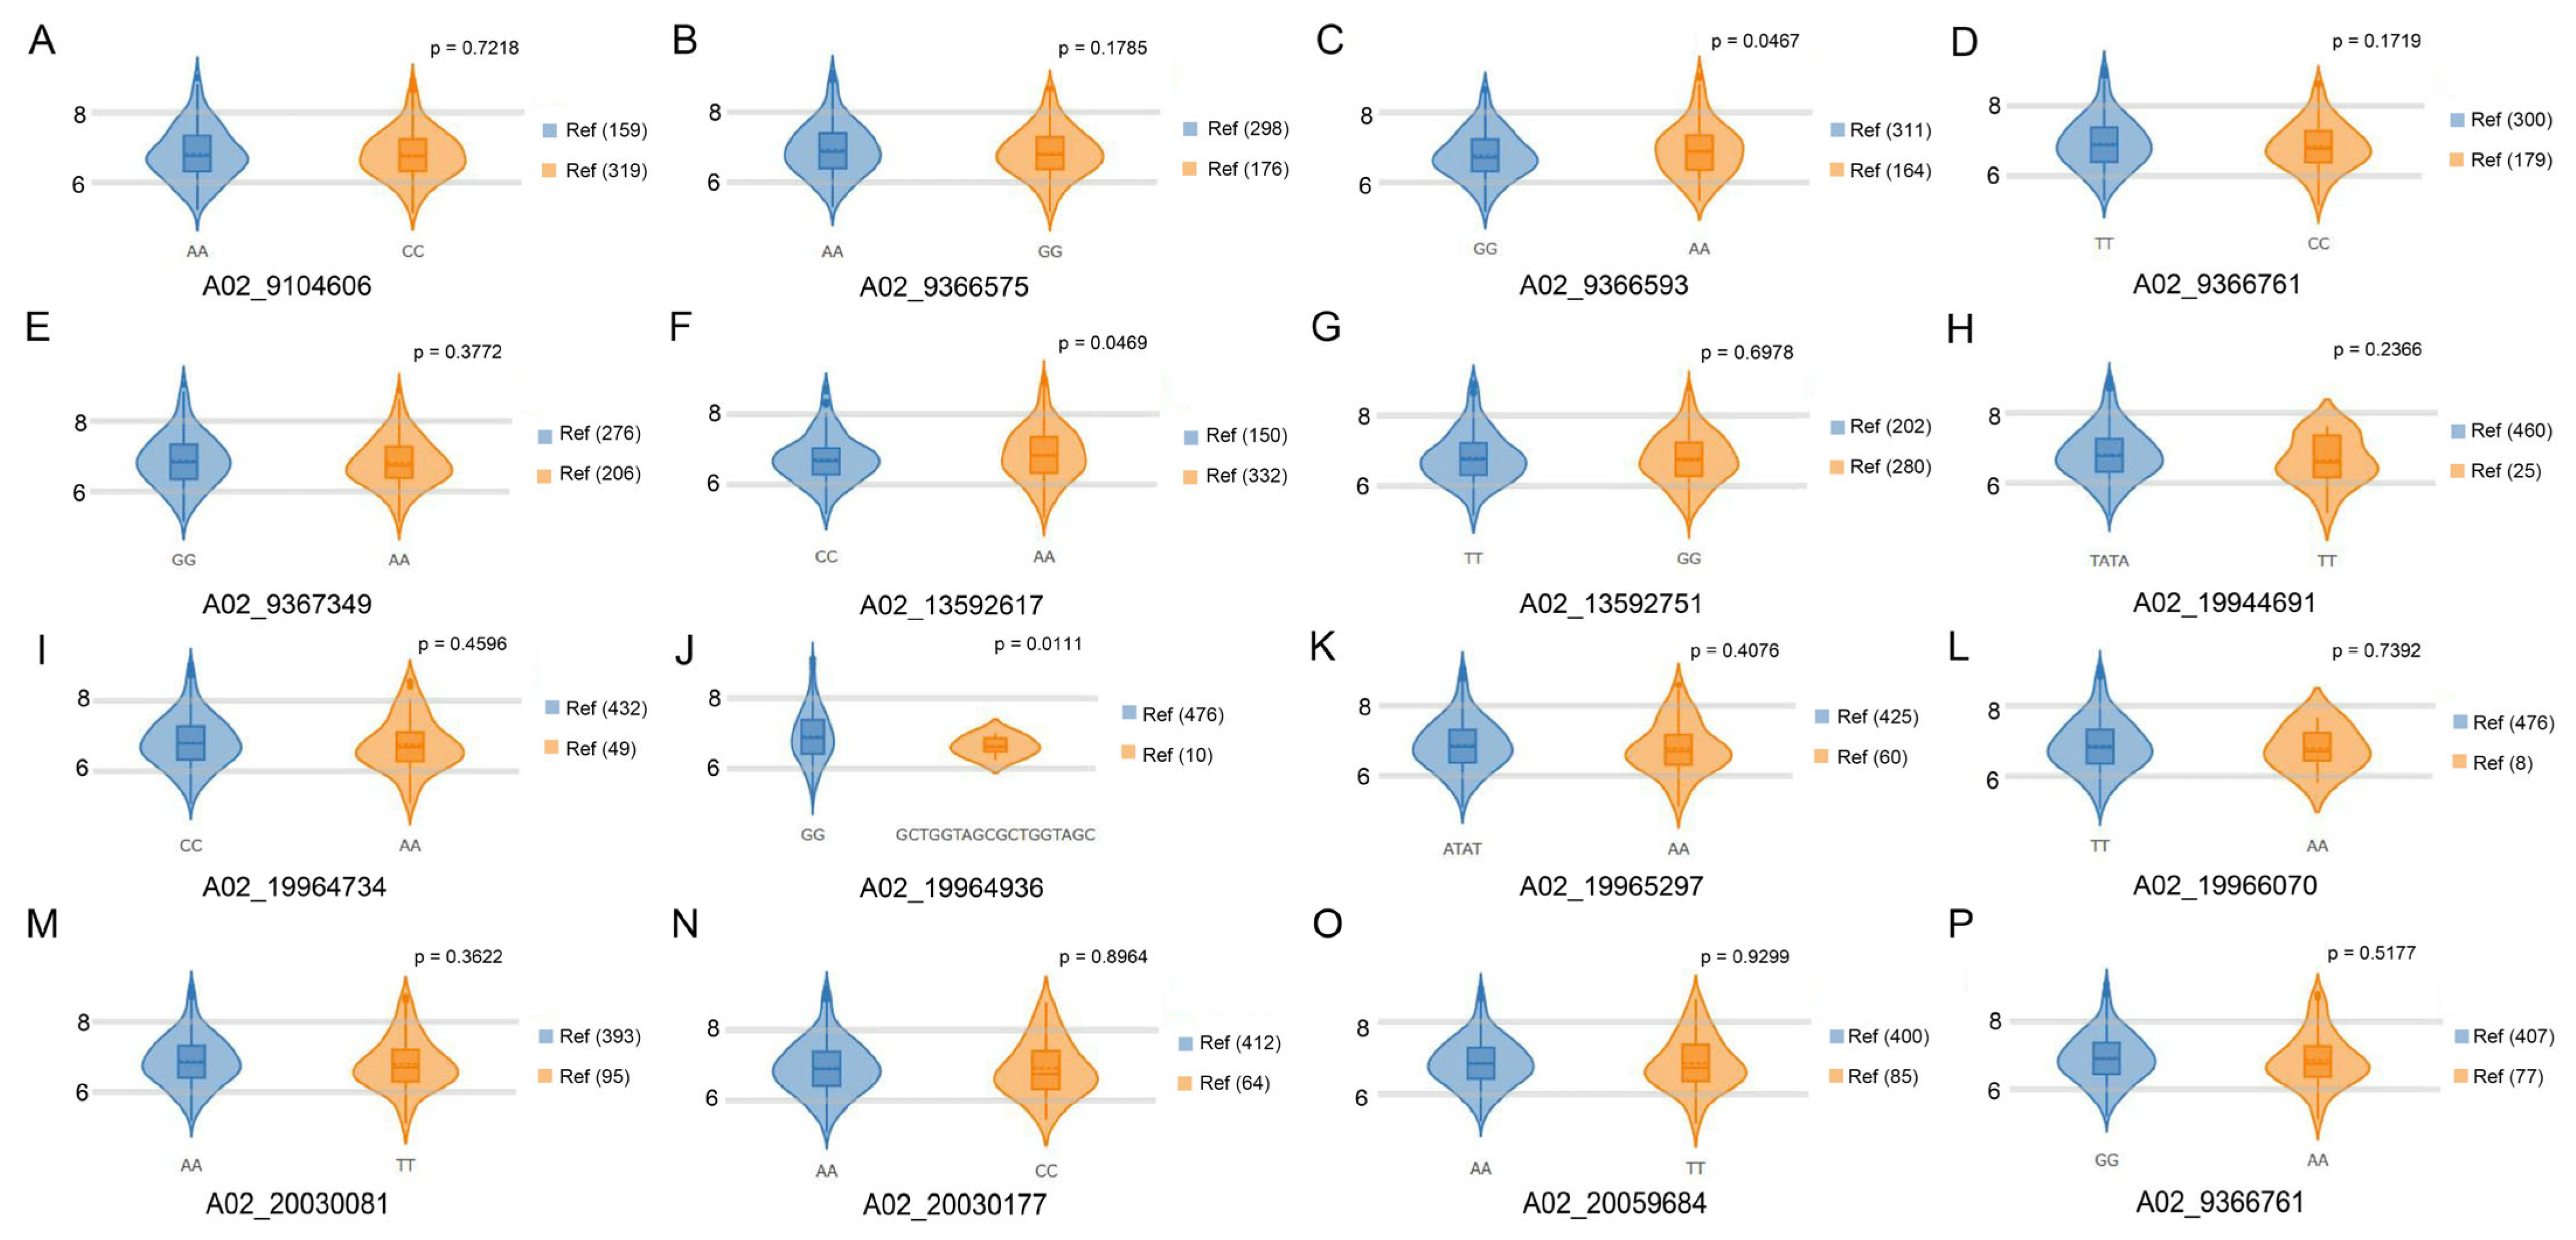
Leaves are essential photosynthetic organs, and the leaf plastochron can affect the number of leaves, number of branches, biomass, and yield directly or indirectly, which is an important indicator of plant biology. In rice and wheat, the shorter the leaf plastochron, the less time tillers can be produced, which is important for yield and uniformity in grains [21]. In this study, significant positive correlations were found among the leaf plastochron, primary branch number, biomass, and seed yields (Table S2). Branches originated from axillary buds, and the leaves in the main stem, along with environmental factors, affected the number of branches and plant morphology [8,22], and multiple studies have reported positive correlations between branch number and biomass/seed yield [23,24,25]. These results are consistent with previous studies on the relationship between branch number and yield [26,27,28], i.e., the more branches, the higher the individuals’ biomass and seed yield. A branch number QTL was previously mapped via GWAS to a 22.0 Mb position on chromosome A03 [23], near which a QTL was also identified on the ZS11 v0 genome in this study (Table S7). Some allelic SNPs within the candidate genes exhibited significant effects on branch number (Figure 5), suggesting a potential intrinsic linkage among leaf plastochron, branch development, and biomass/seed yield. However, additional approaches are required to validate whether the observed associations represent causal relationships, genetic linkage, or coincidental occurrences.
To date, there are no genetic studies reported on leaf plastochron in rapeseed, and three novel QTL intervals were identified in this study. Notably, among the 10 leaf plastochron related candidate genes investigated in this study (including FLOWERING LOCUS T, RGL1, MYB-like, CYP96A8, NIT2, ASK6, and CLE4/6/7), 16 single-nucleotide variations (SNVs) were identified in natural populations. Of these, 3 allelic SNVs exhibited significant associations with branch number (Figure 5), while 13 SNVs showed correlations with flowering time (Figure S7), with allele frequencies ranging from 0.01 to 0.72. These results suggest that these candidate genes may participate in the regulation of both branch number and flowering time, extending their functional roles beyond leaf plastochron modulation. Consequently, superior haplotypes or genetic engineering targeting these leaf plastochron-related genes could be strategically employed in breeding programs to optimize plant architecture, early flowering, and yield-related traits, even breeding novel vegetables.
Three candidate genes, BnaA02G0156900ZS (FT), BnaA02G0160500ZS (RGL1), and BnaA02G0160600ZS (MYB-like), were identified in the qPLA.A02-1 interval. BnaA02G0156900ZS encoded an FT mobile signaling protein, whose mRNA was expressed in the leaves and responded to long-day conditions, but the protein was required by the shoot apical meristem [29,30]. The ft-10 mutant had 36 leaves, while wild-type plants developed 15 rosette leaves at flowering [31]. There was one SNP that caused the protein change Ile49Leu located in the phosphatidyl ethanolamine-binding protein (PEBP) domain, which might be the functional site of BnaA02G0156900ZS. BnaA02G0160500ZS (RGL1), encoding a DELLA protein, negatively regulated GA responses and restrained the cell proliferation and expansion that drove plant growth [32,33]. There was no significant difference in gene expression between slow-plastochron lines and rapid-plastochron lines, but one InDel led to a frameshift, one SNP stop loss, and nine SNP non-synonymous coding (Table S9). Compared with the wild type, leaf senescence occurred earlier in the mutant rgl1-1, whose DELLA repression was removed, and overexpression of RGL1 resulted in significantly increased leaf longevity in age-triggered senescence [34,35]. BnaA02G0160600ZS encoded a putative MYB domain containing a transcription factor that participated in several developmental processes. R2R3-Myb genes controlled a very early step of axillary meristem initiation, which impacted the axillary meristem formation [36], and overexpression of Cymbidium CcMYB24 increased the number of leaves in Arabidopsis [37], suggesting that MYB members also functioned in the establishment of leaf primordia and branches.
In the qPLA.A02-1 interval, BnaA02G0215300ZS encoded a BEL1-like homeodomain protein, which was found ubiquitously in plants and played important roles in regulating the meristem. In Arabidopsis thaliana, three BELL-family proteins, ATH1, PNY, and PNF, were combined to keep the initiation and maintenance of the SAM [38]. BLH proteins interact with KNOX genes to regulate early internode patterning events, while PNY-STM heterodimers are critical for SAM function [38,39]. BnaA02G0215600ZS, a cytochrome P450 family member, had two SNP missense variants between the parents that caused protein changes Phe10Leu and Leu55Arg. PLA1, encoding cytochrome P450 CYP78A11, acts as a developmental timekeeper for leaf initiation in rice, orchestrating leaf number, tiller number, primary branch development, leaf inclination, leaf elongation, and leaf maturation through GA and brassinosteroid signaling pathways [1,2,11,12,13,40]. Deleting the P450 family member MAX1 led to more branches via the strigolactone synthesis pathway, and overexpression of BnaMAX1 could restore the multi-branch phenotype [27,41].
BnaA04G0200300ZS was homologous with AtNIT2, and mutants of AtNIT2 reduced sensitivity to 3-Indoleacetonitrile (IAN), increased sensitivity to IAA, showing more rosette leaves in short days in Arabidopsis [42,43]. The gene BnaA04G0200700ZS encoded the apoptosis signal-regulating kinase (ASK) protein, also known as BRZ-INSENSITIVE-LONG HYPOCOTYL 1 (BIL1), BRASSINAZOLE-RESISTANT 1 (BZR1), and BRASSINOSTEROID INSENSITIVE 2 (BIN2). Phosphorylation of BRI1 EMS SUPPRESSOR 1 (BES1) and BZR1 by BIN2 facilitated their interaction with 14-3-3 proteins, leading to their translocation from the nucleus to the cytoplasm, thereby impeding their nuclear activities as transcription factors in Arabidopsis [44,45]. BIL1/AtSK23 also phosphorylated MONOPTEROS/AUXIN RESPONSE FACTOR 5 at threonine 163 and serine 647, which could integrate PHLOEM INTERCALATED WITH XYLEM and cytokinin signaling in secondary growth [46]. CLE peptides played a role in controlling the growth and maturation of different tissues in Arabidopsis, including the apical and vascular meristems. Notably, CLV3 and CLE40 were recognized as CLE peptides that modulated the WUS-CLV feedback loop within SAM [47]. However, three members of CLE peptides were identified in qPLA.A04 without expression in the shoot tips, implying that they may not participate in leaf plastochron controlling.

4. Materials and Methods

4.1. Plant Plantation and Phenotype Collection

The winter rapeseed inbred lines ZH18 (slow-plastochron line) and 2116C (rapid-plastochron line) were provided by the rapeseed germplasm resource lab of Northwest A&F University, from which F1 and F2 populations were constructed. ZH18, 2116C, F1, and F2 were planted in the Caoxinzhuang experimental base (34°30′ N, 108°09′ E) of Northwest A&F University in Yangling during the 2021–2022 and 2022–2023 cropping seasons (experimental design was displayed in Figure S8). The F2 populations contained 600 and 225 individuals in the two cropping seasons, respectively. The plants during the 2021–2022 season were used for the analyses of the leaf plastochron pattern and inheritance, and those during the 2022–2023 cropping season were utilized for studying the inheritance aspects of leaf plastochron. Row length, row spacing, and plant spacing were set to 2 m, 35 cm, and 10 cm, respectively. Drill sowing was used, and thinning out of seedlings was performed before the two-leaf stage. Other field management was kept in alignment with local agronomic protocols.
Leaf plastochron variation patterns in the two parental lines were investigated every 3 days starting from 15 days after sowing, with one row examined during each observation. The numbers of fully expanded leaves and visible leaves were recorded, with five representative plants assessed per survey and two replicates. The F2 plants were investigated one by one, and border row plants were excluded from evaluations to avoid marginal effects. The leaf numbers were investigated in the rosette stage and the bud stage, representing the leaf plastochron of the plants. The effective primary branch numbers were in the final flowering period. Biomass and seed yields were obtained from 40 F2 plants exhibiting extreme leaf plastochron phenotypes, including 20 individuals each from fast-plastochron and slow-plastochron plants. The mature aboveground biomass was placed into net bags, and both the sun-dried plant weight and seed weight were measured.
The extreme 10 F2:3 families were selected from the F2 population during the 2021–2022 cropping season, and 30 individuals for each family were planted in the chamber with condition settings (24 °C day/16 °C night temperatures and 14 h/10 h light/dark cycle). Given the trait segregation in F2:3 families, plant individuals with higher leaf numbers were selected from fast-plastochron families, and low-leaf-number lines were chosen from slow-plastochron families. The stem apexes of five plants were selected from each F2:3 family. A total of 12 samples, including two parental lines, were used for RNA sequencing.

4.2. Segregation Analysis for Leaf Plastochron-Related Traits

During the 2021–2022 and 2022–2023 cropping seasons, ZH18, 2116C, F1, and F2 populations were used for segregation analysis by using G4F2 (P1, P2, F1, and F2) of the SEA v2.0.1 R package [48]. According to the AIC minimum criterion, 4 models with the minimum AIC values were selected as candidate models from the 24 models [48]. Then, the fitness test was conducted for each candidate model separately, and the module with the minimum p-value (p < 0.05) was taken into consideration as the best model [48].

4.3. DNA Isolation and BSA-Sequencing

The two parents (ZH18 and 2116C) and two extremely bulked pools (B1 and B2) from the 600 F2 individuals were used for BSA-seq. The F2 bulked pools were constructed by the top 30 slow-/rapid-plastochron individuals, respectively. Genomic DNA was isolated from the fresh leaves using the cetyl trimethyl ammonium bromide (CTAB) protocol [49]. DNA was randomly broken into 350 bp fragments by ultrasonic waves, and the DNA fragments were used for sequencing library construction and Illumina HiSeq sequencing. Whole-genome re-sequencing in 20X and 30X coverage was performed on the parents and the bulked pools, respectively. Whole-genome sequences were generated using paired-end sequencing on the Illumina Hiseq platform. BSA (bulked segregant analysis) sequencing library preparation and sequencing were conducted at Biomarker Technologies Corporation (Beijing, China).
Raw reads were filtered by fastp v0.21.0 [50], then clean reads were obtained for subsequent analysis. The reads were mapped to the reference genome ZS11 v0 and Darmor-bzh V10 using Burrows-Wheeler-Alignment software (BWA) v2.2 [51,52]. Duplicate reads were sorted and removed with SAMtools v1.9 [53]. SNP and small InDel variant detections were performed by the HaplotypeCaller algorithm of GATK v3.8 [54], and the variants were annotated using SnpEff v3.6c software with the default parameters [55].

4.4. SNP-Index Calculation and QTL Detection

Before association analysis, variants were filtered with the criteria: filter out variants with (I) multiple genotypes, (II) with coverage less than 4X in the bulked pools, (III) that were homozygous and consistent between the two bulked pools or between the two parents, and (IV) that were inconsistent between the pool and parent with the same trait. Calculating the SNP-index is an association analysis method to find the significant differences in genotype frequency between the pools, and the ΔSNP(InDel)-index was obtained [56]. To determine and obtain the association threshold, the DISTANCE/SNPNUM method was used, and the regions higher than the threshold were considered trait-related candidate regions [57].

4.5. RNA Isolation and RNA-Seq Analyses

The stem apexes of ZH18, 2116C, and extremely F2:3 families were sampled for RNA isolation. The RNA isolation protocol followed the manufacturer’s instructions for the RNAprep kit, and the first strand of cDNA synthesis was performed using the FastKing Premix Kit (Tiangen, Beijing, China). The cDNA library preparations and sequencing experiments were conducted by the sequencing cooperation of Grandomics company (Wuhan, China), and the libraries were sequenced on an MGI platform. The fastp v0.21.0 was employed to obtain clean data from raw data [50], and the clean reads were mapped to the reference genome ZS11 v0 using Hisat 2.0 with default parameters [51]. Novel transcripts were identified by the Stringtie v2.1.7. Gene expression levels were determined using the fragments per kilobase of exon per million fragments mapped (FPKM).

4.6. Gene Prediction in the Mapping Interval

All genes within the targeted mapping intervals were identified from the Brassica napus ZS11 v0 genome [51]. Gene annotations were performed by BLAST in Nr (NCBI non-redundant protein sequences, https://ftp.ncbi.nlm.nih.gov/blast/db/, accessed on 20 April 2024.), Pfam (Protein family, http://pfam-legacy.xfam.org/https://ftp.ncbi.nlm.nih.gov/blast/db/, accessed on 27 January 2025.), KOG/COG (Clusters of Orthologous Groups of proteins, https://www.ncbi.nlm.nih.gov/research/cog/, accessed on 28 January 2024.), Swiss-Prot (https://www.expasy.org/resources/UniProtKB-swiss-prot, accessed on 20 January 2024.), KO (KEGG Ortholog database, https://www.genome.jp/kegg/ko.html, accessed on 20 January 2024.), and GO (Gene Ontology, https://geneontology.org/, accessed on 20 January 2024.) databases.

4.7. Candidate Gene Expression and Variants in the Public Database

The TPM value of target genes in the public transcriptome was extracted from the BnIR database [58], including cotyledon, vegetative rosette, leaves, root, seed, silique, and stem peel. The SNP and InDel information of 2311 rapeseed accessions were obtained from the BnIR database as well [58]. The single-nucleotide variations (SNVs), flowering time, and branch number of natural accessions were from the public data [59,60].

4.8. Data Analyses and Visualization

The phenotypic data were analyzed and visualized by Excel 2016 and R 4.0.2 (https://www.r-project.org/, accessed on 20 January 2024.). Significant differences were evaluated using the t-test method, and the p-value < 0.05 was considered to be significant. Data were means ± SD (standard deviation) of the biological samples. The visualizations of the BSA results were performed using BMKCloud v2024 (www.biocloud.net, accessed on 28 January 2024.).

5. Conclusions

In the present study, morphology, genetics, genomics, and transcriptomics were integrated to analyze the genetic mechanisms of leaf plastochron in rapeseed. Leaf expansion of the rapid-plastochron line 2116C was consistently faster than that of the slow-plastochron line ZH18, and the leaf plastochron showed a significant positive correlation with primary branch number. Genetic analyses demonstrated that leaf plastochron was mainly controlled by two equally dominant effect genes (2MG-EAD) via segregation analysis, and three novel associated intervals were detected in chromosome A02 (9.04–9.48 Mb and 13.52–13.66 Mb) and A04 (19.84–20.14 Mb) by BSA sequencing. A total of 10 candidate genes were identified in the intervals, including FT (BnaA02G0156900ZS), RGL1 (BnaA02G0160500ZS), MYB-like (BnaA02G0160600ZS), CYP96A8 (BnaA02G0215600ZS), BLH3 (BnaA02G0215300ZS), NIT2 (BnaA04G0200300ZS), ASK6 (BnaA04G0200700ZS), and CLEs (BnaA04G0201700ZS, BnaA04G0201900ZS, and BnaA04G0202000ZS). These results could provide a foundation for exploring the leaf plastochron of 2116C and plastochron-related breeding in rapeseed.

Supplementary Materials

The following supporting information can be downloaded at: https://www.mdpi.com/article/10.3390/plants14111719/s1, Figure S1 Venn diagrams of InDels indentifed in the samples; Figure S2 ΔInDel-index calculated based on the ZS11 v0 reference genome; Figure S3 ΔInDel-index calculated based on the Darmor-bzh V10 reference genome; Figure S4 Genome collinearity analyses between the intervals of ZS11 and Darmor-bzh; Figure S5 Principal components analysis (PCA) for the 12 RNA-seq samples based on the candidate gene expression; Figure S6 Boxplots of candidate gene expression and leaf number in the RNA-seq samples; Figure S7 The relationships between flowering time and 24 SNVs shared with natural accessions; Figure S8 Experimental design; Table S1 Statistics of leaf plastochron-related traits in the four-generation population; Table S2 Pearson correlation coefficients among leaf plastochron, primary branch number, biomass, and seed yield; Table S3: Fitness tests of candidate models for ZH18 × 2116 C hybrid combinations; Table S4 Estimates of genetic parameters of leaf plastochron-related traits; Table S5 Statistics of the sequencing data for the four samples; Table S6 Statistical table of candidate genomic intervals on the ZS11 genome; Table S7: Statistics of candidate genomic intervals on the Darmor-bzh genome; Table S8: Results of protein sequence alignment between Darmor-bzh and ZS11; Table S9: Annotation of SNP and InDel in the candidate genes; Table S10: Statistics of variants detected between BSA sequencing and 2311 accessions; Table S11: Candidate gene expression patterns in different tissues of ZS11.

Author Contributions

Conceptualization, Z.H. and A.X.; Data curation, X.L. and J.S.; Formal analysis, M.Q., X.L., J.S. and W.L.; Funding acquisition, M.Q. and S.L.; Investigation, X.L., J.S., F.Z., Y.S., Y.X., Z.G., T.Z., J.W. (Jiapeng Wu), J.W. (Jinxiong Wang) and K.L.; Resources, A.X.; Supervision, M.Q., W.L., S.L., Z.H. and A.X.; Validation, X.L.; Visualization, M.Q.; Writing—original draft, M.Q. and J.S.; Writing—review and editing, Z.H. and A.X. All authors have read and agreed to the published version of the manuscript.

Funding

This research was supported by the National Natural Science Foundation of China (32401932), the China Postdoctoral Science Foundation (2024M750587), the Open Fund of Guangdong Provincial Key Laboratory of Crop Genetic Improvement (202504), and the Lhasa Key Science and Technology Planning Project (LSKJ202430).

Data Availability Statement

The raw sequencing data generated in this study are available in SRA (https://www.ncbi.nlm.nih.gov/sra, accessed on 24 January 2025.) of NCBI with the accession numbers PRJNA1055329 and PRJNA1207201.

Conflicts of Interest

The authors declare no conflicts of interest.

References

  1. Kawakatsu, T.; Itoh, J.-I.; Miyoshi, K.; Kurata, N.; Alvarez, N.; Veit, B.; Nagato, Y. PLASTOCHRON2 Regulates Leaf Initiation and Maturation in Rice. Plant Cell 2006, 18, 612–625. [Google Scholar] [CrossRef] [PubMed]
  2. Miyoshi, K.; Ahn, B.-O.; Kawakatsu, T.; Ito, Y.; Itoh, J.-I.; Nagato, Y.; Kurata, N. PLASTOCHRON1, a timekeeper of leaf initiation in rice, encodes cytochrome P450. Proc. Natl. Acad. Sci. USA 2004, 101, 875–880. [Google Scholar] [CrossRef]
  3. Padilla, J.M.; Otegui, M.E. Co-ordination between Leaf Initiation and Leaf Appearance in Field-grown Maize (Zea mays): Genotypic Differences in Response of Rates to Temperature. Ann. Bot. 2005, 96, 997–1007. [Google Scholar] [CrossRef]
  4. Strable, J.; Nelissen, H. The dynamics of maize leaf development: Patterned to grow while growing a pattern. Curr. Opin. Plant Biol. 2021, 63, 102038. [Google Scholar] [CrossRef] [PubMed]
  5. Prusinkiewicz, P.; Crawfordb, S.; Smitha, R.S.; Ljungc, K.; Bennett, T.; Ongaro, V.; Leyser, O. Control of bud activation by an auxin transport switch. Proc. Natl. Acad. Sci. USA 2009, 106, 17431–17436. [Google Scholar] [CrossRef]
  6. Li, Z.; Ding, Y.; Xie, L.; Jian, H.; Gao, Y.; Yin, J.; Li, J.; Liu, L. Regulation by sugar and hormone signaling of the growth of Brassica napus L. axillary buds at the transcriptome level. Plant Growth Regul. 2020, 90, 571–584. [Google Scholar] [CrossRef]
  7. Chen, Z.; Chen, Y.; Shi, L.; Wang, L.; Li, W. Interaction of Phytohormones and External Environmental Factors in the Regulation of the Bud Dormancy in Woody Plants. Int. J. Mol. Sci. 2023, 24, 17200. [Google Scholar] [CrossRef] [PubMed]
  8. Zhu, Y.; Wagner, D. Plant Inflorescence Architecture: The Formation, Activity, and Fate of Axillary Meristems. Cold Spring Harb. Perspect. Biol. 2020, 12, a034652. [Google Scholar] [CrossRef]
  9. Wang, C.; Yang, J.; Chen, W.; Zhao, X.; Wang, Z. Contribution of the leaf and silique photosynthesis to the seeds yield and quality of oilseed rape (Brassica napus L.) in reproductive stage. Sci. Rep. 2023, 13, 4721. [Google Scholar] [CrossRef]
  10. Somssich, M.; Je, B.I.; Simon, R.; Jackson, D. CLAVATA-WUSCHEL signaling in the shoot meristem. Development 2016, 143, 3238–3248. [Google Scholar] [CrossRef]
  11. Ahn, B.; Miyoshi, K.; Itoh, J.-I.; Nagato, Y.; Kurata, N. A Recessive Heterochronic Mutation, plastochron1, Shortens the Plastochron and Elongates the Vegetative Phase in Rice. Plant Cell 2002, 105, 654–659. [Google Scholar] [CrossRef]
  12. Mimura, M.; Nagato, Y.; Itoh, J. Rice PLASTOCHRON genes regulate leaf maturation downstream of the gibberellin signal transduction pathway. Planta 2012, 235, 1081–1089. [Google Scholar] [CrossRef]
  13. Xiong, Y.; Xie, J.; Zhang, X.; Li, Y.; Tian, W.; Ni, J.; Zhu, Z.; Wang, Y.; Wen, X.; Sang, X. PLASTOCHRON1 regulates leaf inclination through Brassinolide pathway in Oryza sativa. Crop Sci. 2021, 61, 1280–1288. [Google Scholar] [CrossRef]
  14. Sun, X.; Cahill, J.; Van Hautegem, T.; Feys, K.; Whipple, C.; Novak, O.; Delbare, S.; Versteele, C.; Demuynck, K.; De Block, J.; et al. Altered expression of maize PLASTOCHRON1 enhances biomass and seed yield by extending cell division duration. Nat. Commun. 2017, 8, 14752. [Google Scholar] [CrossRef]
  15. Dhami, N.; Cazzonelli, C.I. Short photoperiod attenuates CO2 fertilization effect on shoot biomass in Arabidopsis thaliana. Physiol. Mol. Biol. Plants 2021, 27, 825–834. [Google Scholar] [CrossRef]
  16. Duan, T.; Chapman, S.C.; Holland, E.; Rebetzke, G.J.; Guo, Y.; Zheng, B. Dynamic quantification of canopy structure to characterize early plant vigour in wheat genotypes. J. Exp. Bot. 2016, 67, 4523–4534. [Google Scholar] [CrossRef] [PubMed]
  17. Zhang, Z.; Christensen, M.; Nan, Z.; Whish, J.P.M.; Bell, L.W.; Wang, J.; Wang, Z.; Sim, R. Plant development and solar radiation interception of four annual forage plants in response to sowing date in a semi-arid environment. Ind. Crops Prod. 2019, 131, 41–53. [Google Scholar] [CrossRef]
  18. Banaś, K.; Piwowar, A.; Harasym, J. The potential of rapeseed (canola) oil nutritional benefits wide spreading via oleogelation. Food Biosci. 2023, 56, 103162. [Google Scholar] [CrossRef]
  19. Liu, G.; Yan, L.; Wang, S.; Yuan, H.; Zhu, Y.; Xie, C.; Wang, P.; Yang, R. A novel type of sprout food development: Effects of germination on phytic acid, glucosinolates, and lipid profiles in rapeseed. Food Biosci. 2023, 55, 102893. [Google Scholar] [CrossRef]
  20. Huang, H.; Shi, Y.; Liu, T.; Zhou, Y. Oilseed-Vegetable-Dual-Purpose Rape Key Technology Research and Its Application Prospect Analysis. Agric. Sci. 2014, 5, 1291–1295. [Google Scholar] [CrossRef]
  21. McMASTER, G.S. Phytomers, phyllochrons, phenology and temperate cereal development. J. Agric. Sci. 2005, 143, 137–150. [Google Scholar] [CrossRef]
  22. Wang, B.; Smith, S.M.; Li, J. Genetic Regulation of Shoot Architecture. Annu. Rev. Plant Biol. 2018, 69, 437–468. [Google Scholar] [CrossRef]
  23. Luo, X.; Ma, C.; Yue, Y.; Hu, K.; Li, Y.; Duan, Z.; Wu, M.; Tu, J.; Shen, J.; Yi, B.; et al. Unravelling the complex trait of harvest index in rapeseed (Brassica napus L.) with association mapping. BMC Genomics 2015, 16, 379. [Google Scholar] [CrossRef]
  24. Lu, K.; Xiao, Z.; Jian, H.; Peng, L.; Qu, C.; Fu, M.; He, B.; Tie, L.; Liang, Y.; Xu, X.; et al. A combination of genome-wide association and transcriptome analysis reveals candidate genes controlling harvest index-related traits in Brassica napus. Sci. Rep. 2016, 6, 36452. [Google Scholar] [CrossRef]
  25. Hu, J.; Chen, B.; Zhao, J.; Zhang, F.; Xie, T.; Xu, K.; Gao, G.; Yan, G.; Li, H.; Li, L.; et al. Genomic selection and genetic architecture of agronomic traits during modern rapeseed breeding. Nat. Genet. 2022, 54, 694–704. [Google Scholar] [CrossRef] [PubMed]
  26. Qin, M.; Song, J.; Guo, N.; Zhang, M.; Zhu, Y.; Huang, Z.; Xu, A. Genome-Wide Association Analyses Reveal Candidate Genes Controlling Harvest Index and Related Agronomic Traits in Brassica napus L. Agronomy 2022, 12, 814. Agronomy 2022, 12, 814. [Google Scholar] [CrossRef]
  27. Zheng, M.; Zhang, L.; Tang, M.; Liu, J.; Liu, H.; Yang, H.; Fan, S.; Terzaghi, W.; Wang, H.; Hua, W. Knockout of two BnaMAX1 homologs by CRISPR/Cas9 targeted mutagenesis improves plant architecture and increases yield in rapeseed (Brassica napus L.). Plant Biotechnol. J. 2020, 18, 644–654. [Google Scholar] [CrossRef]
  28. Zhang, C.; Gong, R.; Zhong, H.; Dai, C.; Zhang, R.; Dong, J.; Li, Y.; Liu, S.; Hu, J. Integrated multi-locus genome-wide association studies and transcriptome analysis for seed yield and yield-related traits in Brassica napus. Front. Plant Sci. 2023, 14, 1153000. [Google Scholar] [CrossRef]
  29. Jaeger, K.E.; Wigge, P.A. FT protein acts as a long-range signal in Arabidopsis. Curr. Biol. 2007, 17, 1050–1054. [Google Scholar] [CrossRef] [PubMed]
  30. Jackson, S.D.; Hong, Y. Systemic movement of FT mRNA and a possible role in floral induction. Front. Plant Sci. 2012, 3, 127. [Google Scholar] [CrossRef]
  31. Mao, Y.; Sun, J.; Cao, P.; Zhang, R.; Fu, Q.; Chen, S.; Chen, F.; Jiang, J. Functional analysis of alternative splicing of the FLOWERING LOCUS T orthologous gene in Chrysanthemum morifolium. Hortic. Res. 2016, 3, 16058. [Google Scholar] [CrossRef]
  32. Nelissen, H.; Rymen, B.; Jikumaru, Y.; Demuynck, K.; Van Lijsebettens, M.; Kamiya, Y.; Inzé, D.; Beemster, G.T.S. A Local Maximum in Gibberellin Levels Regulates Maize Leaf Growth by Spatial Control of Cell Division. Curr. Biol. 2012, 22, 1183–1187. [Google Scholar] [CrossRef]
  33. Wen, C.K.; Chang, C. Arabidopsis RGL1 encodes a negative regulator of gibberellin responses. Plant Cell 2002, 14, 87–100. [Google Scholar] [CrossRef]
  34. Chen, L.; Xiang, S.; Chen, Y.; Li, D.; Yu, D. Arabidopsis WRKY45 Interacts with the DELLA Protein RGL1 to Positively Regulate Age-Triggered Leaf Senescence. Mol. Plant 2017, 10, 1174–1189. [Google Scholar] [CrossRef] [PubMed]
  35. Chen, M.; Maodzeka, A.; Zhou, L.; Ali, E.; Wang, Z.; Jiang, L. Removal of DELLA repression promotes leaf senescence in Arabidopsis. Plant Sci. 2014, 219–220, 26–34. [Google Scholar] [CrossRef]
  36. Muller, D.; Schmitz, G.; Theres, K. Blind homologous R2R3 Myb genes control the pattern of lateral meristem initiation in Arabidopsis. Plant Cell 2006, 18, 586–597. [Google Scholar] [CrossRef] [PubMed]
  37. Li, G.; Cheng, L.; Li, Z.; Zhao, Y.; Wang, Y. Over-expression of CcMYB24, encoding a R2R3-MYB transcription factor from a high-leaf-number mutant of Cymbidium, increases the number of leaves in Arabidopsis. PeerJ 2023, 11, e15490. [Google Scholar] [CrossRef] [PubMed]
  38. Rutjens, B.; Bao, D.; van Eck-Stouten, E.; Brand, M.; Smeekens, S.; Proveniers, M. Shoot apical meristem function in Arabidopsis requires the combined activities of three BEL1-like homeodomain proteins. Plant J. 2009, 58, 641–654. [Google Scholar] [CrossRef]
  39. Smith, H.M.; Hake, S. The interaction of two homeobox genes, BREVIPEDICELLUS and PENNYWISE, regulates internode patterning in the Arabidopsis inflorescence. Plant Cell 2003, 15, 1717–1727. [Google Scholar] [CrossRef]
  40. Wang, L.; Ming, L.; Liao, K.; Xia, C.; Sun, S.; Chang, Y.; Wang, H.; Fu, D.; Xu, C.; Wang, Z.; et al. Bract suppression regulated by the miR156/529-SPLs-NL1-PLA1 module is required for the transition from vegetative to reproductive branching in rice. Mol. Plant 2021, 14, 1168–1184. [Google Scholar] [CrossRef]
  41. Booker, J.; Sieberer, T.; Wright, W.; Williamson, L.; Willett, B.; Stirnberg, P.; Turnbull, C.; Srinivasan, M.; Goddard, P.; Leyser, O. MAX1 encodes a cytochrome P450 family member that acts downstream of MAX3/4 to produce a carotenoid-derived branch-inhibiting hormone. Dev. Cell 2005, 8, 443–449. [Google Scholar] [CrossRef] [PubMed]
  42. Normanly, J.; Grisafi, P.; Fink, G.R.; Bartel, B. Arabidopsis mutants resistant to the auxin effects of indole-3-acetonitrile are defective in the nitrilase encoded by the NIT1 gene. Plant Cell 1997, 9, 1781–1790. [Google Scholar] [CrossRef] [PubMed]
  43. Yang, S.; Zhang, T.; Wang, Z.; Zhao, X.; Li, R.; Li, J. Nitrilases NIT1/2/3 Positively Regulate Flowering by Inhibiting MAF4 Expression in Arabidopsis. Front. Plant Sci. 2022, 13, 889460. [Google Scholar] [CrossRef] [PubMed]
  44. Han, S.; Cho, H.; Noh, J.; Qi, J.; Jung, H.-J.; Nam, H.; Lee, S.; Hwang, D.; Greb, T.; Hwang, I. BIL1-mediated MP phosphorylation integrates PXY and cytokinin signalling in secondary growth. Nat. Plants 2018, 4, 605–614. [Google Scholar] [CrossRef]
  45. Yin, Y.; Wang, Z.Y.; Mora-Garcia, S.; Li, J.; Yoshida, S.; Asami, T.; Chory, J. BES1 accumulates in the nucleus in response to brassinosteroids to regulate gene expression and promote stem elongation. Cell 2002, 109, 181–191. [Google Scholar] [CrossRef]
  46. Gampala, S.S.; Kim, T.W.; He, J.X.; Tang, W.; Deng, Z.; Bai, M.Y.; Guan, S.; Lalonde, S.; Sun, Y.; Gendron, J.M.; et al. An essential role for 14-3-3 proteins in brassinosteroid signal transduction in Arabidopsis. Dev. Cell 2007, 13, 177–189. [Google Scholar] [CrossRef]
  47. Leibfried, A.; To, J.P.C.; Busch, W.; Stehling, S.; Kehle, A.; Demar, M.; Kieber, J.J.; Lohmann, J.U. WUSCHEL controls meristem function by direct regulation of cytokinin-inducible response regulators. Nature 2005, 438, 1172–1175. [Google Scholar] [CrossRef]
  48. Wang, J.-T.; Zhang, Y.-W.; Du, Y.-W.; Ren, W.-L.; Li, H.-F.; Sun, W.-X.; Ge, C.; Zhang, Y.-M. SEA v2.0: An R software package for mixed major genes plus polygenes inheritance analysis of quantitative traits. Acta Agron. Sin. 2022, 48, 1416–1424. [Google Scholar] [CrossRef]
  49. Doyle, J.J. Isolation of plant DNA from fresh tissue. Focus 1990, 12, 13–15. [Google Scholar]
  50. Chen, S.; Zhou, Y.; Chen, Y.; Gu, J. fastp: An ultra-fast all-in-one FASTQ preprocessor. Bioinformatics 2018, 34, i884–i890. [Google Scholar] [CrossRef]
  51. Song, J.M.; Guan, Z.; Hu, J.; Guo, C.; Yang, Z.; Wang, S.; Liu, D.; Wang, B.; Lu, S.; Zhou, R.; et al. Eight high-quality genomes reveal pan-genome architecture and ecotype differentiation of Brassica napus. Nat. Plants 2020, 6, 34–45. [Google Scholar] [CrossRef] [PubMed]
  52. Rousseau-Gueutin, M.; Belser, C.; Da Silva, C.; Richard, G.; Istace, B.; Cruaud, C.; Falentin, C.; Boideau, F.; Boutte, J.; Delourme, R.; et al. Long-read assembly of the Brassica napus reference genome Darmor-bzh. Gigascience 2020, 9, giaa137. [Google Scholar] [CrossRef]
  53. Li, H.; Handsaker, B.; Wysoker, A.; Fennell, T.; Ruan, J.; Homer, N.; Marth, G.; Abecasis, G.; Durbin, R.; Subgroup, G.P.D.P. The Sequence Alignment/Map format and SAMtools. Bioinformatics 2009, 25, 2078–2079. [Google Scholar] [CrossRef] [PubMed]
  54. McKenna, A.; Hanna, M.; Banks, E.; Sivachenko, A.; Cibulskis, K.; Kernytsky, A.; Garimella, K.; Altshuler, D.; Gabriel, S.; Daly, M.; et al. The Genome Analysis Toolkit: A MapReduce framework for analyzing next-generation DNA sequencing data. Genome Res. 2010, 20, 1297–1303. [Google Scholar] [CrossRef] [PubMed]
  55. Cingolani, P.; Platts, A.; Wang, L.L.; Coon, M.; Nguyen, T.; Wang, L.; Land, S.J.; Lu, X.; Ruden, D.M. A program for annotating and predicting the effects of single nucleotide polymorphisms, SnpEff. Fly 2014, 6, 80–92. [Google Scholar] [CrossRef]
  56. Takagi, H.; Abe, A.; Yoshida, K.; Kosugi, S.; Natsume, S.; Mitsuoka, C.; Uemura, A.; Utsushi, H.; Tamiru, M.; Takuno, S.; et al. QTL-seq: Rapid mapping of quantitative trait loci in rice by whole genome resequencing of DNA from two bulked populations. Plant J. 2013, 74, 174–183. [Google Scholar] [CrossRef]
  57. Abe, A.; Kosugi, S.; Yoshida, K.; Natsume, S.; Takagi, H.; Kanzaki, H.; Matsumura, H.; Yoshida, K.; Mitsuoka, C.; Tamiru, M.; et al. Genome sequencing reveals agronomically important loci in rice using MutMap. Nat. Biotechnol. 2012, 30, 174–178. [Google Scholar] [CrossRef] [PubMed]
  58. Yang, Z.; Wang, S.; Wei, L.; Huang, Y.; Liu, D.; Jia, Y.; Luo, C.; Lin, Y.; Liang, C.; Hu, Y.; et al. BnIR: A multi-omics database with various tools for Brassica napus research and breeding. Mol. Plant 2023, 16, 775–789. [Google Scholar] [CrossRef]
  59. Li, F.; Chen, B.; Xu, K.; Gao, G.; Yan, G.; Qiao, J.; Li, J.; Li, H.; Li, L.; Xiao, X.; et al. A genome-wide association study of plant height and primary branch number in rapeseed (Brassica napus). Plant Sci. 2016, 242, 169–177. [Google Scholar] [CrossRef]
  60. Zhang, G.; Peng, Y.; Zhou, J.; Tan, Z.; Jin, C.; Fang, S.; Zhong, S.; Jin, C.; Wang, R.; Wen, X.; et al. Genome-Wide Association Studies of Salt-Alkali Tolerance at Seedling and Mature Stages in Brassica napus. Front. Plant Sci. 2022, 13, 857149. [Google Scholar] [CrossRef]
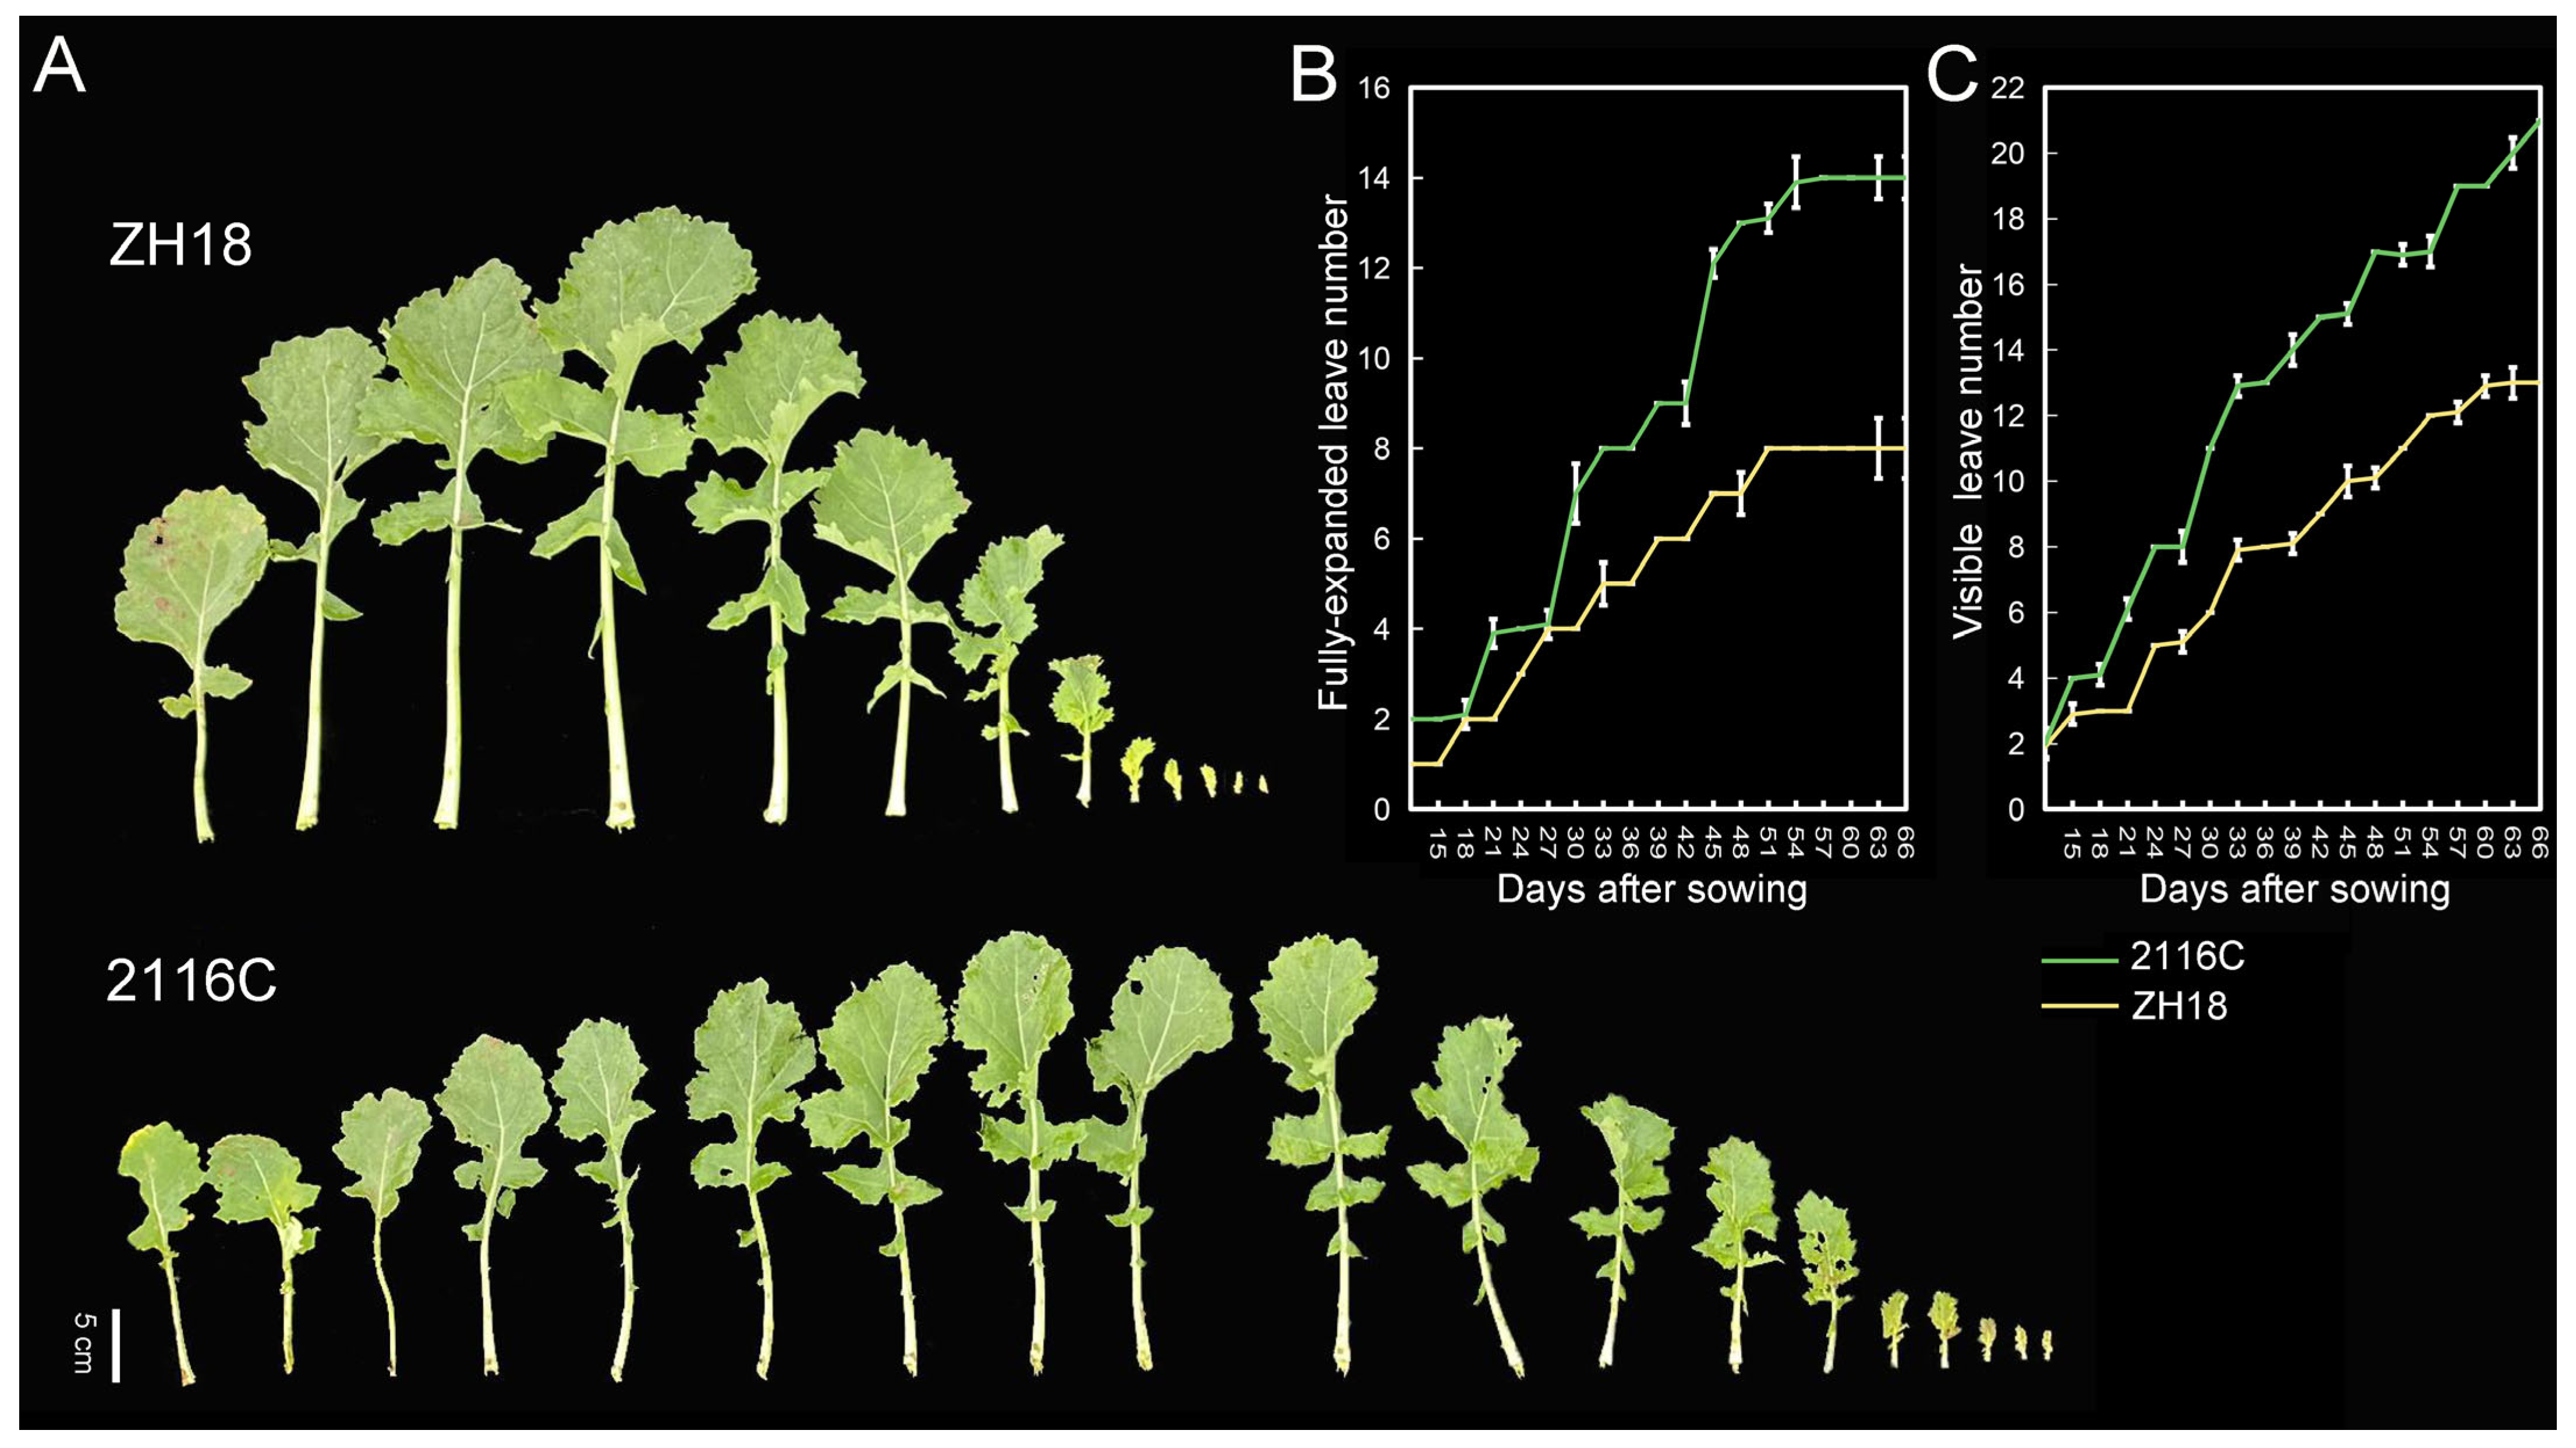
Figure 1. Leaf appearance rate at the rosette stage of ZH18 and 2116C. (A) Final leaf number of ZH18 and 2116C on the 69th day after sowing; (B) fully expanded leaves; and (C) visible leaves during the rosette stage. The x-axis is the number of days after sowing, and the y-axis is the leaf number. The green and yellow lines indicate 2116C and ZH18, respectively.
Plants 14 01719 g001
Figure 2. Statistical analyses of leaf plastochron-related traits among the F2 populations. Frequency distribution of (A) leaf number in the rosette stage, (B) leaf number in the bud stage, and (C) primary branch number across 2021–2022 and 2022–2023 cropping seasons.
Plants 14 01719 g002
Figure 3. Leaf plastochron QTL identification based on BSA-seq. Leaf number in (A) the rosette stage and (B) the bud stage; Venn diagrams of SNPs identified in the samples aligned to (C) ZS11 v0 and (D) Darmor-bzh reference genome; and ΔSNP-index based on (E) the ZS11 v0 and (F) the Darmor-bzh V10 reference genome. The red, blue, and green lines represent confidence thresholds of 0.99, 0.95, and 0.90, respectively. Different colors are used to distinguish the axes representing the different chromosomes.
Plants 14 01719 g003
Figure 4. SNP/InDel variation and gene expression analyses of candidate genes. (A) Number of SNP/InDel in candidate genes leading to protein sequence change; (B) heatmap of correlation between candidate gene expression and leaf plastochron; The asterisk * represents a significance p < 0.05 and ** represents a significance p < 0.01. (C) SNP and (D) InDel Venn plots from BSA versus that from the 2311 accessions in BnIR database; and (E) allele frequency distribution of the common variants among the 2311 accessions.
Plants 14 01719 g004
Figure 5. The relationships of branch numbers for 16 SNVs shared with natural accessions. (AP) Violin diagrams of branch numbers of different genotypes. The individual numbers of the genotype are listed in the braces. The p-value was calculated by t-test.
Plants 14 01719 g005
Table 1. Candidate genetic models for leaf plastochron-related traits.
TraitModel of (2021–2022)AIC ValueLog Max Likelihood ValueModel (2022–2023)AIC ValueLog Max Likelihood Value
Leaf number in the rosette stage1MG-EAD2516.879−1253.442MG-EAD1210.203−601.102
1MG-AD2518.637−1253.3191MG-AD1212.56−600.28
2MG-EAD2525.118−1258.559MX2-CD-AD1217.865−605.933
2MG-EA2534.13−1263.0652MG-A1218.415−604.208
MX2-ADI-ADI2546.923−1261.4611MG-EAD1218.642−604.321
Leaf number in the bud stage2MG-EAD2936.697−1464.349MX2-CD-AD1352.254−673.127
2MG-EA2942.665−1467.333MX2-EAD-AD1352.505−674.253
1MG-AD2946.55−1467.2752MG-EAD1353.224−672.612
MX2-ADI-AD2969.929−1475.965MX2-AD-AD1354.104−672.052
MX2-ADI-ADI2975.617−1475.8081MG-AD1357.429−672.715
Primary branch number2MG-EA1959.893−975.94672MG-EAD1089.852−540.926
2MG-EAD1962.112−977.05621MG-EAD1091.632−540.816
1MG-EAD1964.117−977.05831MG-AD1093.476−540.738
1MG-NCD1964.168−977.08421MG-NCD1098.71−544.355
1MG-AD1966.149−977.07472MG-A1099.805−544.902
MG: major genes; MX: major genes plus polygenes; A: additive; AD: additive-dominant; ADI: additive-dominance-epistasis; CD: completely dominance; NCD: negatively CD; EA: equal additive; EAD: equal additive-dominance.
Table 2. Candidate genomic intervals for leaf plastochron-related traits.
QTL LabelChrStartEndInterval Length (Mb)No. of GeneReference Genome
qPLA.A02-1A029,045,4899,478,4100.4353ZS11 v0
qPLA.A02-2A0213,517,52513,661,1210.1419ZS11 v0
qPLA.A04A0419,839,46920,142,4780.3035ZS11 v0
qPLA.A02-1A029,066,9169,477,1020.4146Darmor-bzh V10
qPLA.A02-2A0213,609,22713,728,6410.1214Darmor-bzh V10
qPLA.A04A0417,128,40417,432,2090.3053Darmor-bzh V10
Table 3. Candidate gene information for controlling leaf plastochron in the genomic intervals.
Gene IDGenomic PositionBest Hit to A. thalianaFunction Description
BnaA02G0156900ZSA02:9104462−9107270AT1G65480Protein FLOWERING LOCUS T
BnaA02G0160500ZSA02:9357771−9367517AT1G66350DELLA protein RGL1
BnaA02G0160600ZSA02:9375716−9377422AT1G56650MYB-like, a putative MYB domain-containing transcription factor
BnaA02G0215300ZSA02:13571765−13573401AT1G75410BLH3, BEL1-like homeodomain protein 3
BnaA02G0215600ZSA02:13592588−13594117AT1G47620CYP96A8, a member of CYP96A
BnaA04G0200300ZSA04:19944280−19946261AT3G44300NIT2, nitrilase 2
BnaA04G0200700ZSA04:19964345−19967629AT2G30980ASK6, a shaggy-related protein kinase
BnaA04G0201700ZSA04:20020034−20020282AT2G31081CLAVATA3/ESR (CLE)-related protein 4
BnaA04G0201900ZSA04:20029992−20030249AT2G31082CLAVATA3/ESR (CLE)-related protein 7
BnaA04G0202000ZSA04:20059635−20059880AT2G31085CLAVATA3/ESR (CLE)-related protein 6
Disclaimer/Publisher’s Note: The statements, opinions and data contained in all publications are solely those of the individual author(s) and contributor(s) and not of MDPI and/or the editor(s). MDPI and/or the editor(s) disclaim responsibility for any injury to people or property resulting from any ideas, methods, instructions or products referred to in the content.