
Distribution Pattern of Endangered Cycas taiwaniana Carruth. in China Under Climate-Change Scenarios Using the MaxEnt Model


Abstract
1. Introduction
2. Results
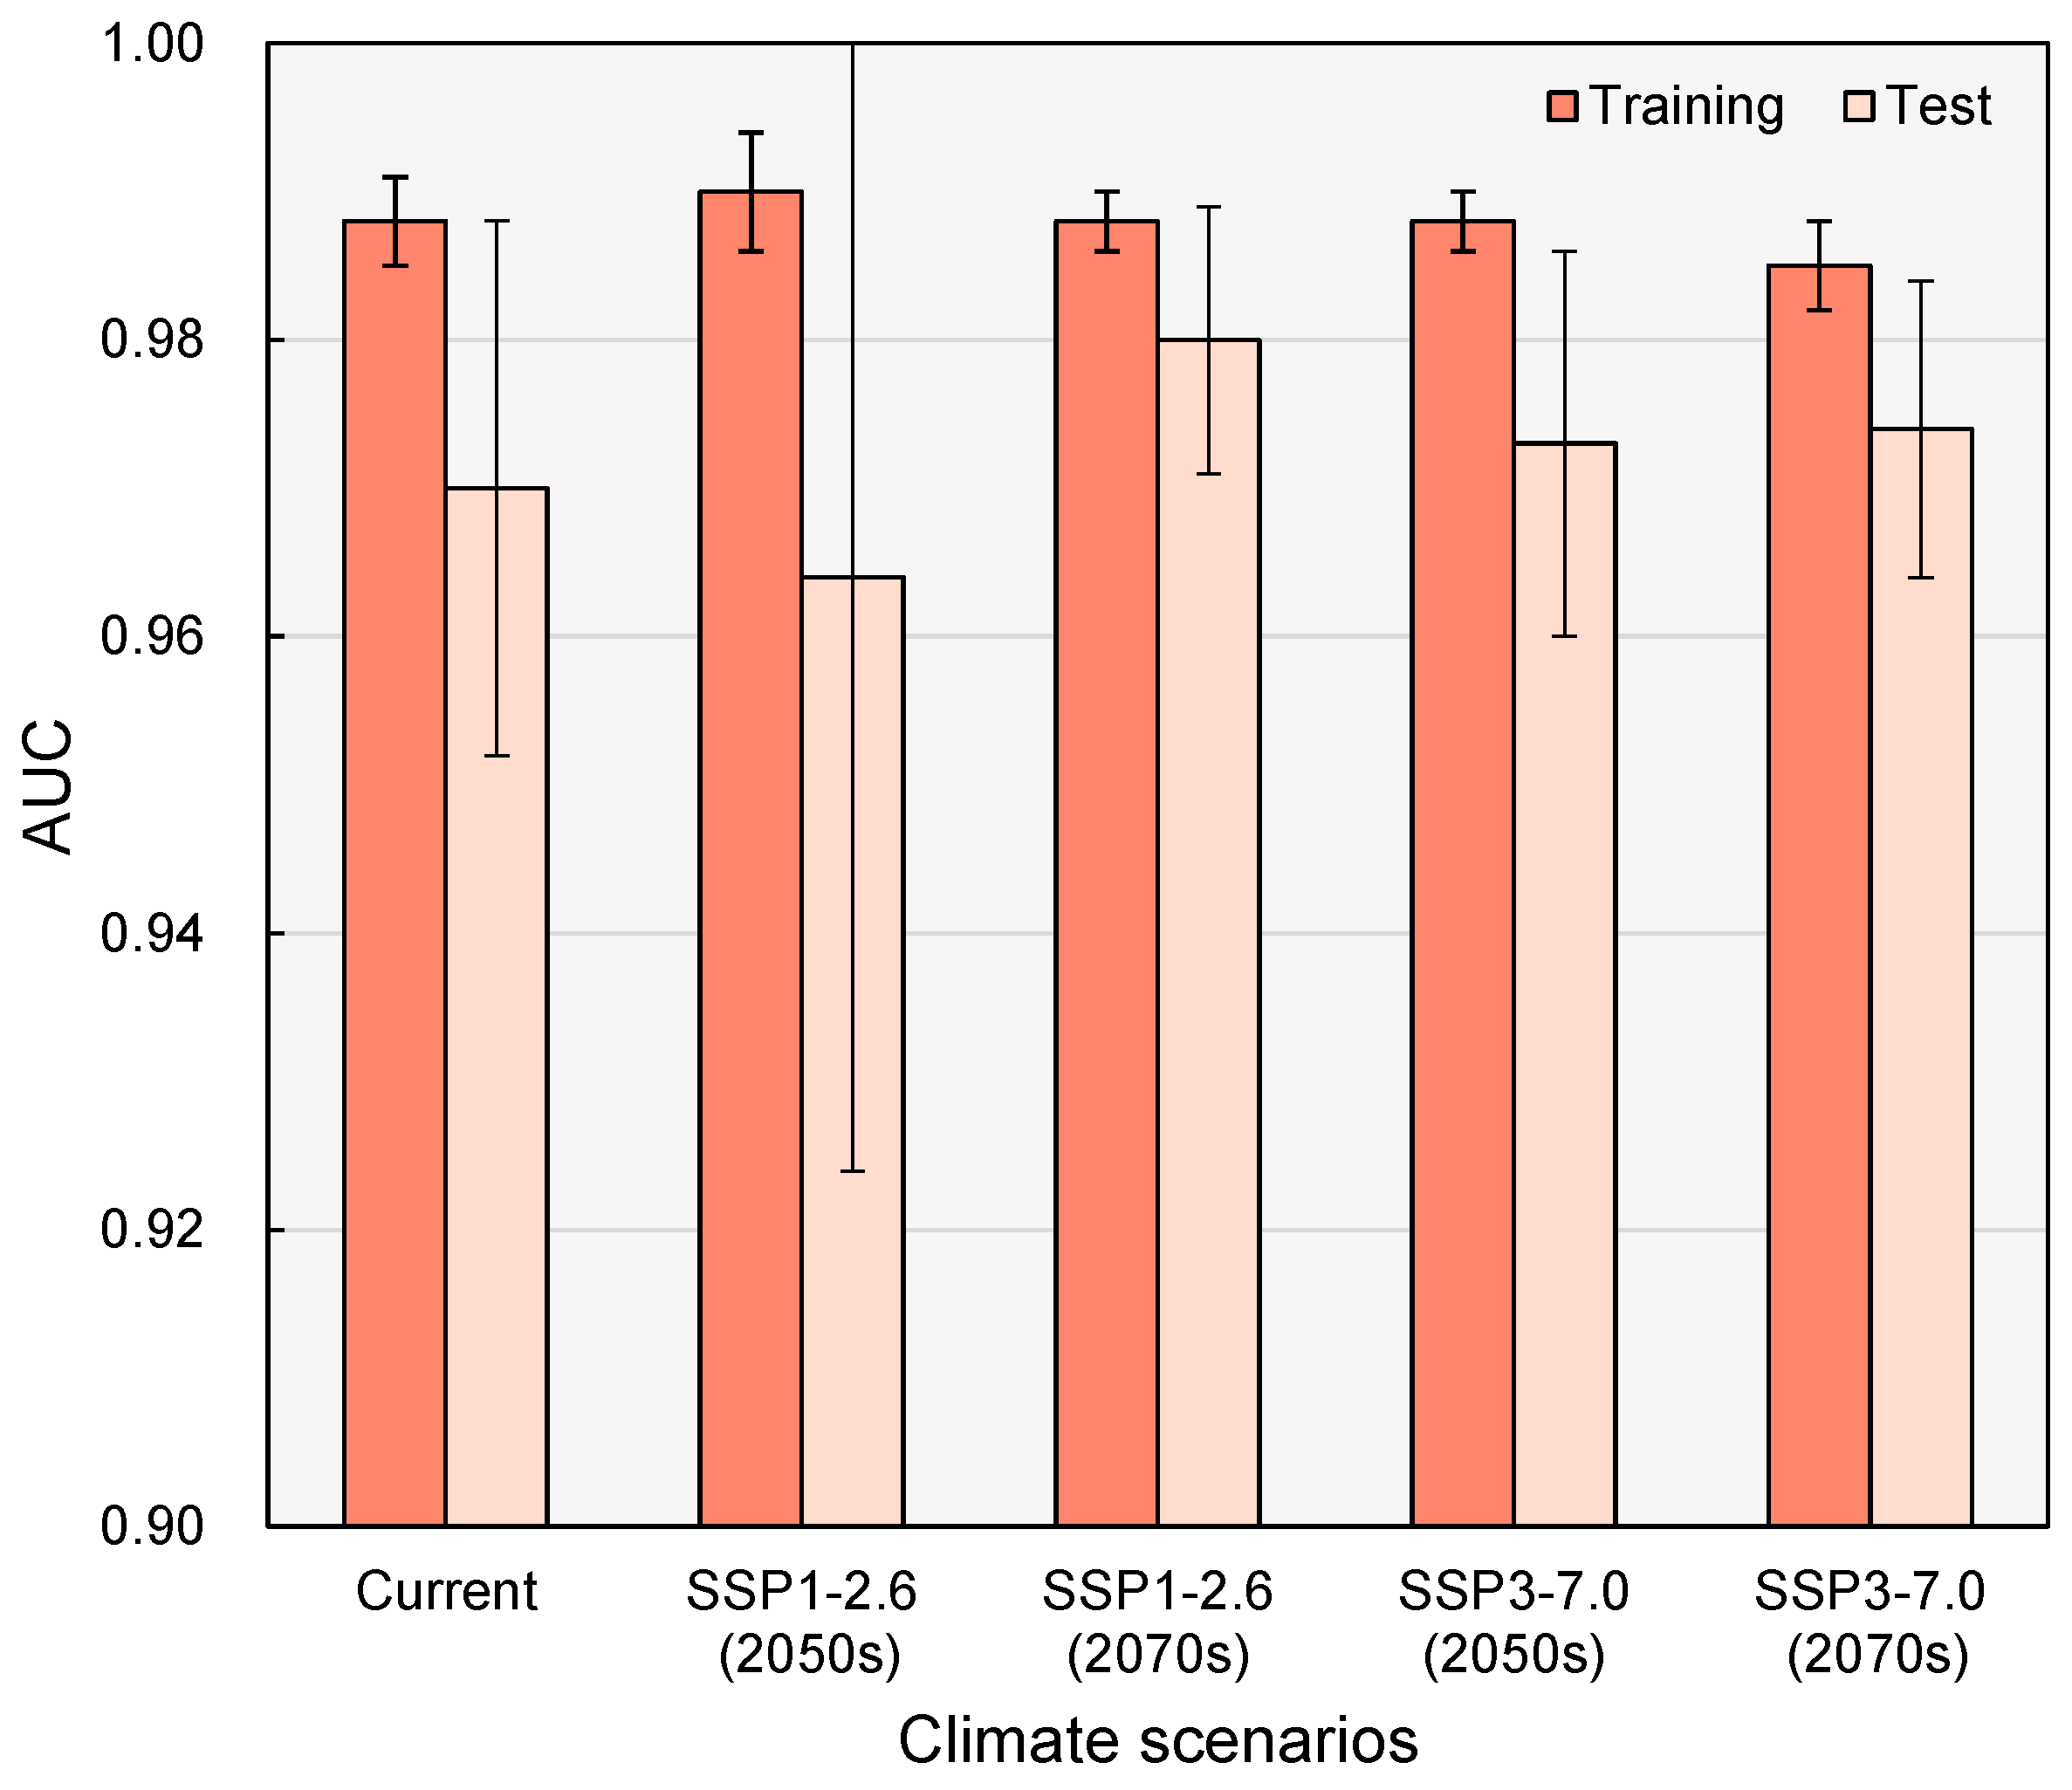
2.1. Model Accuracy
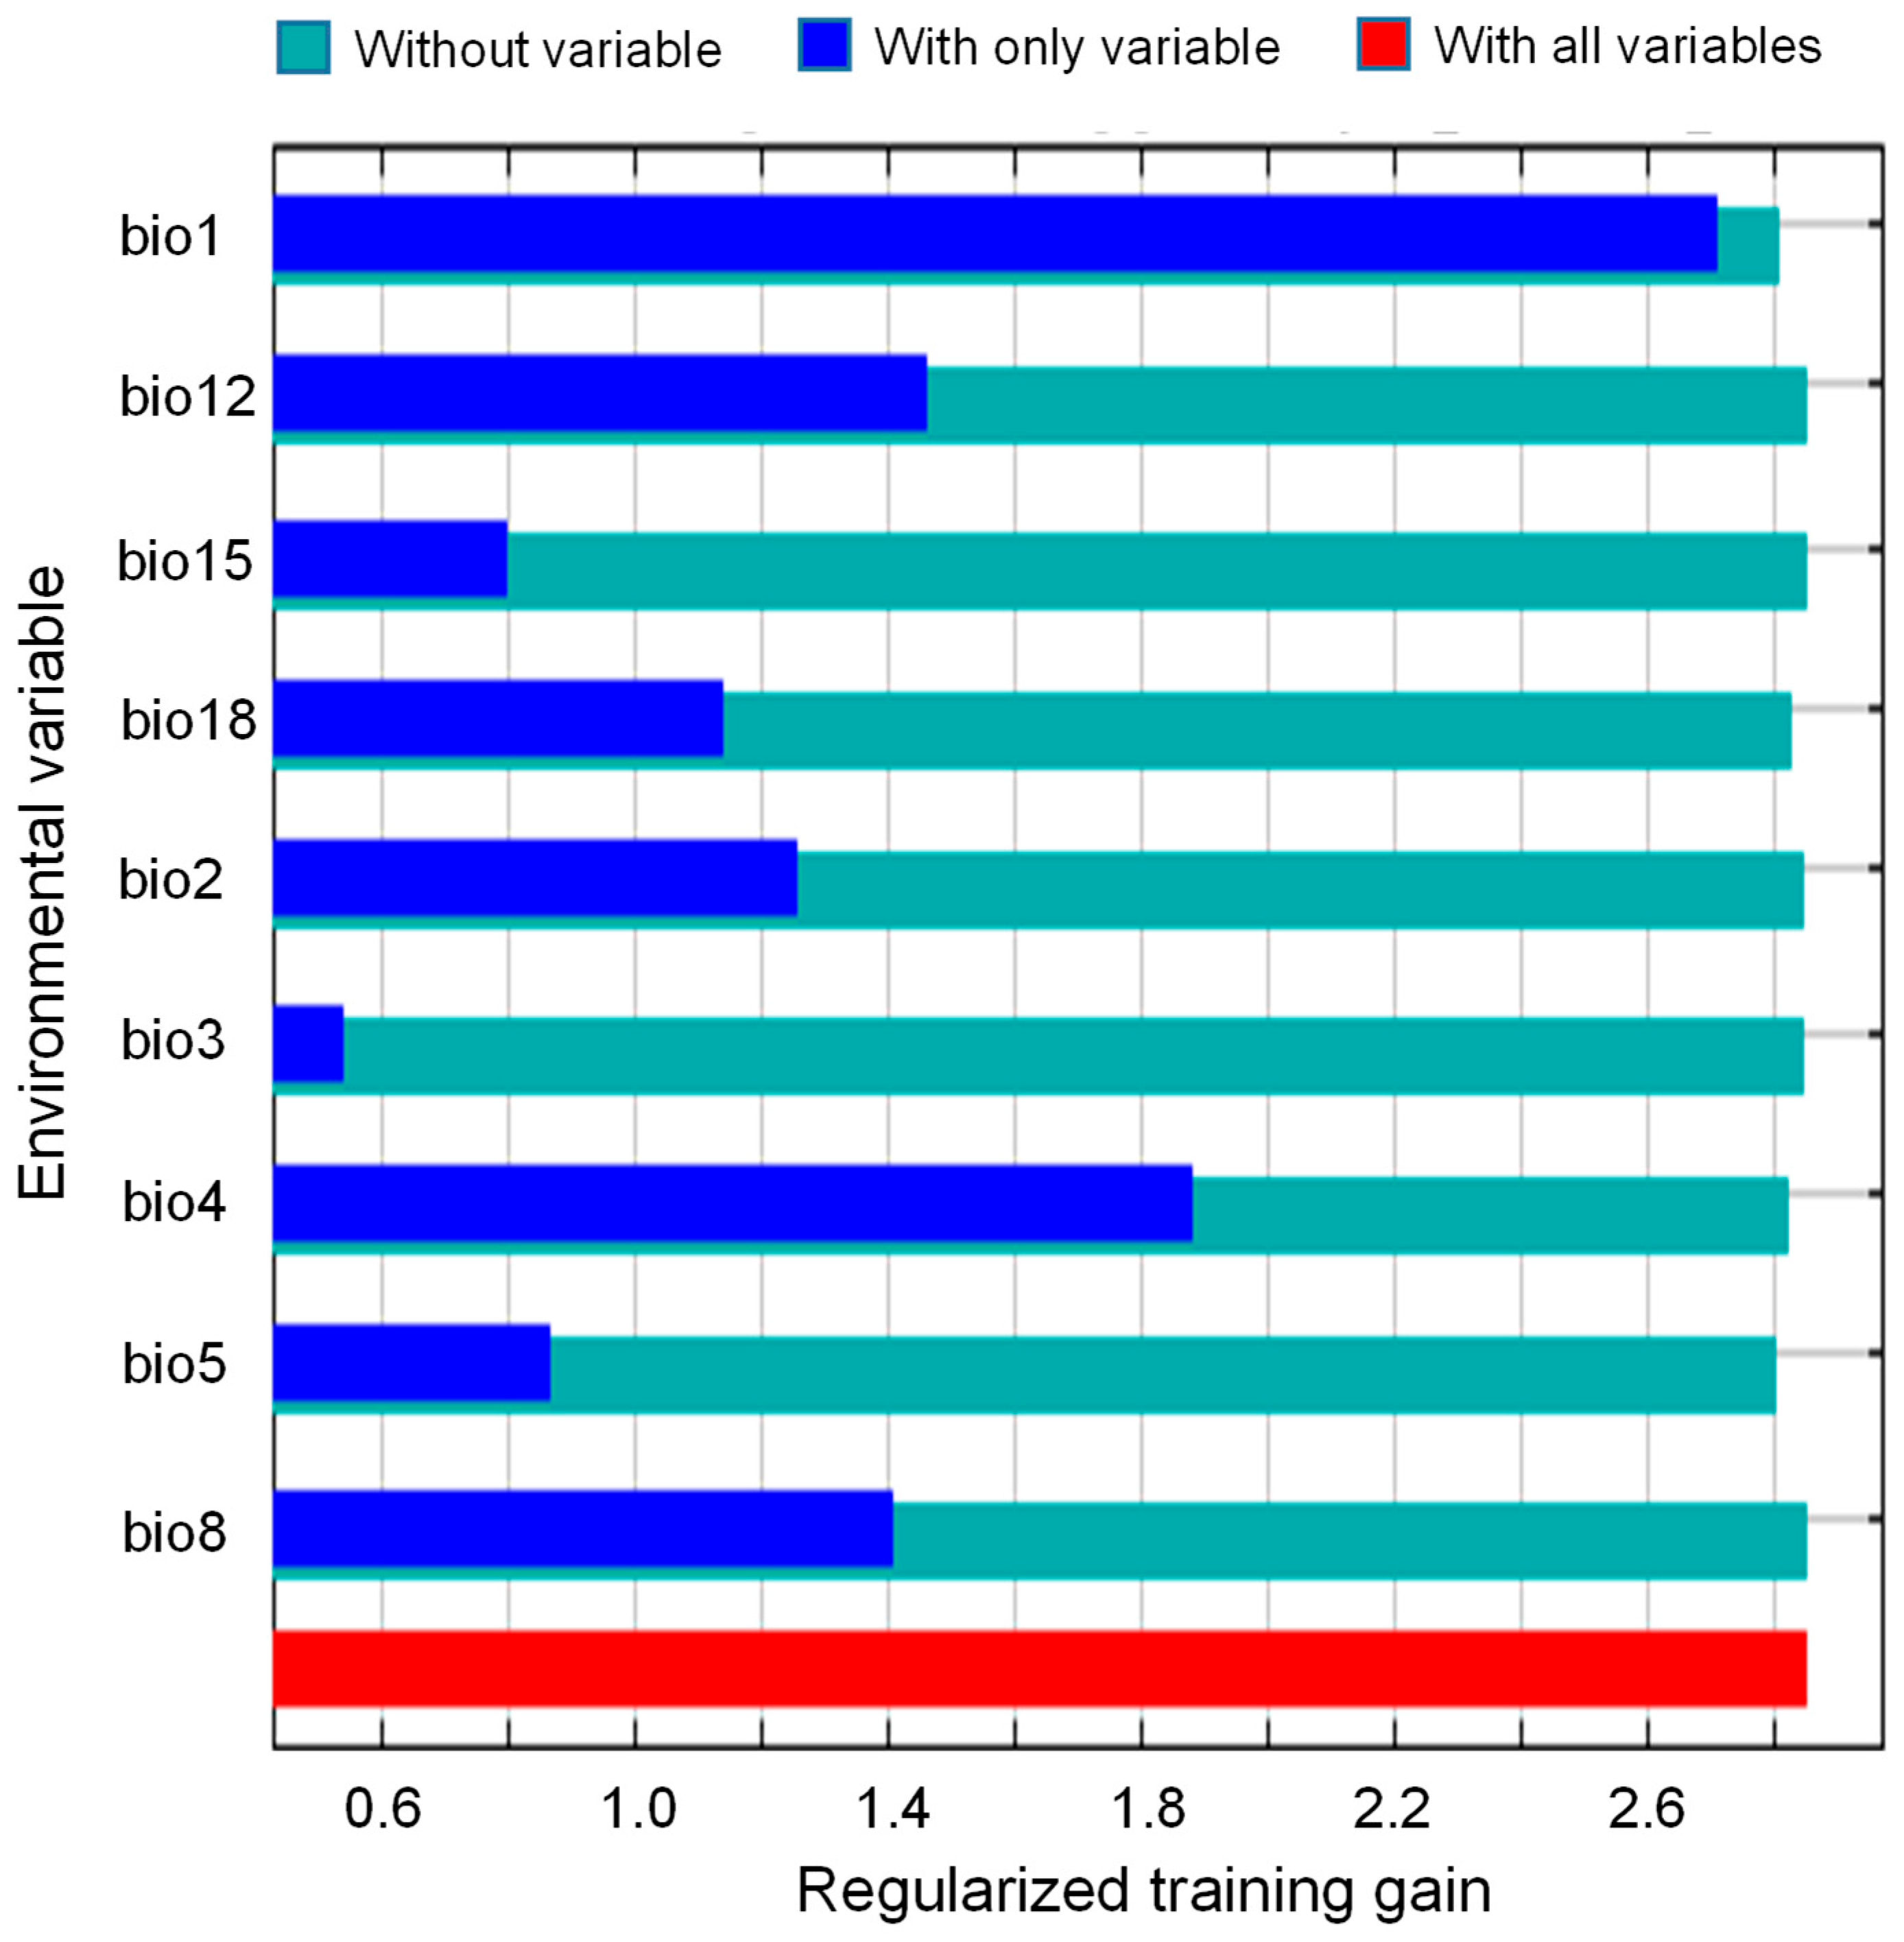
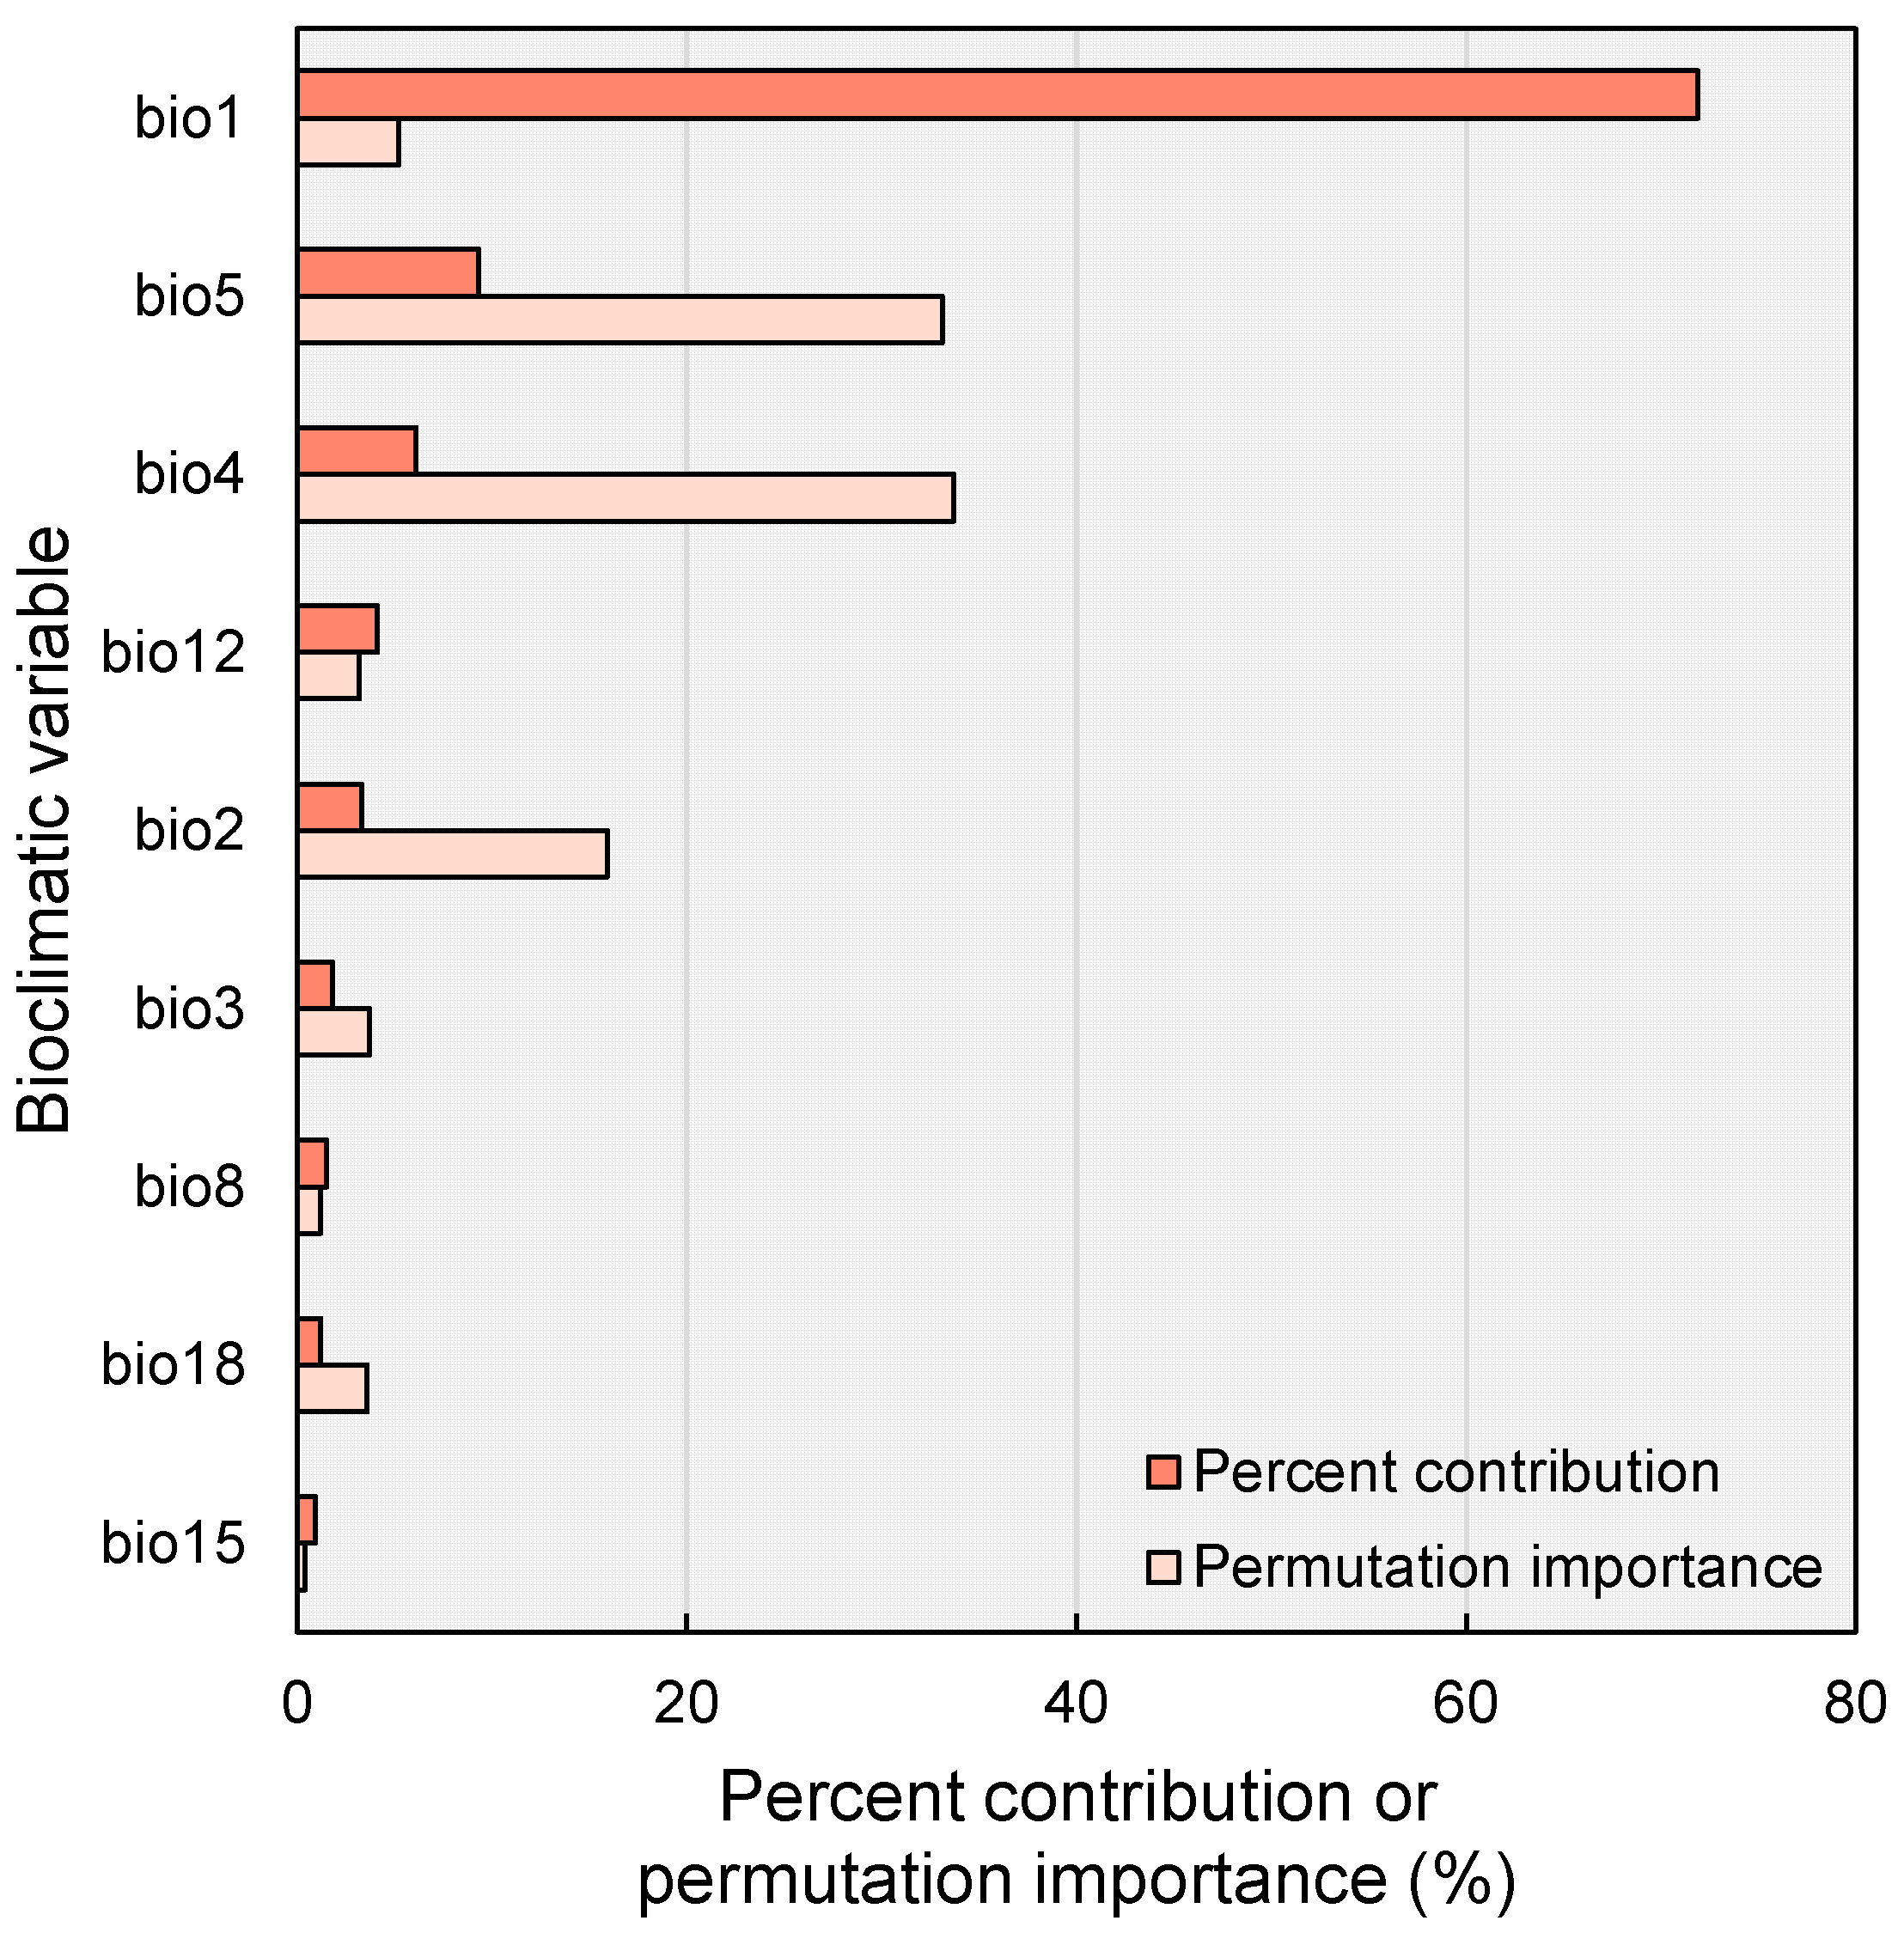
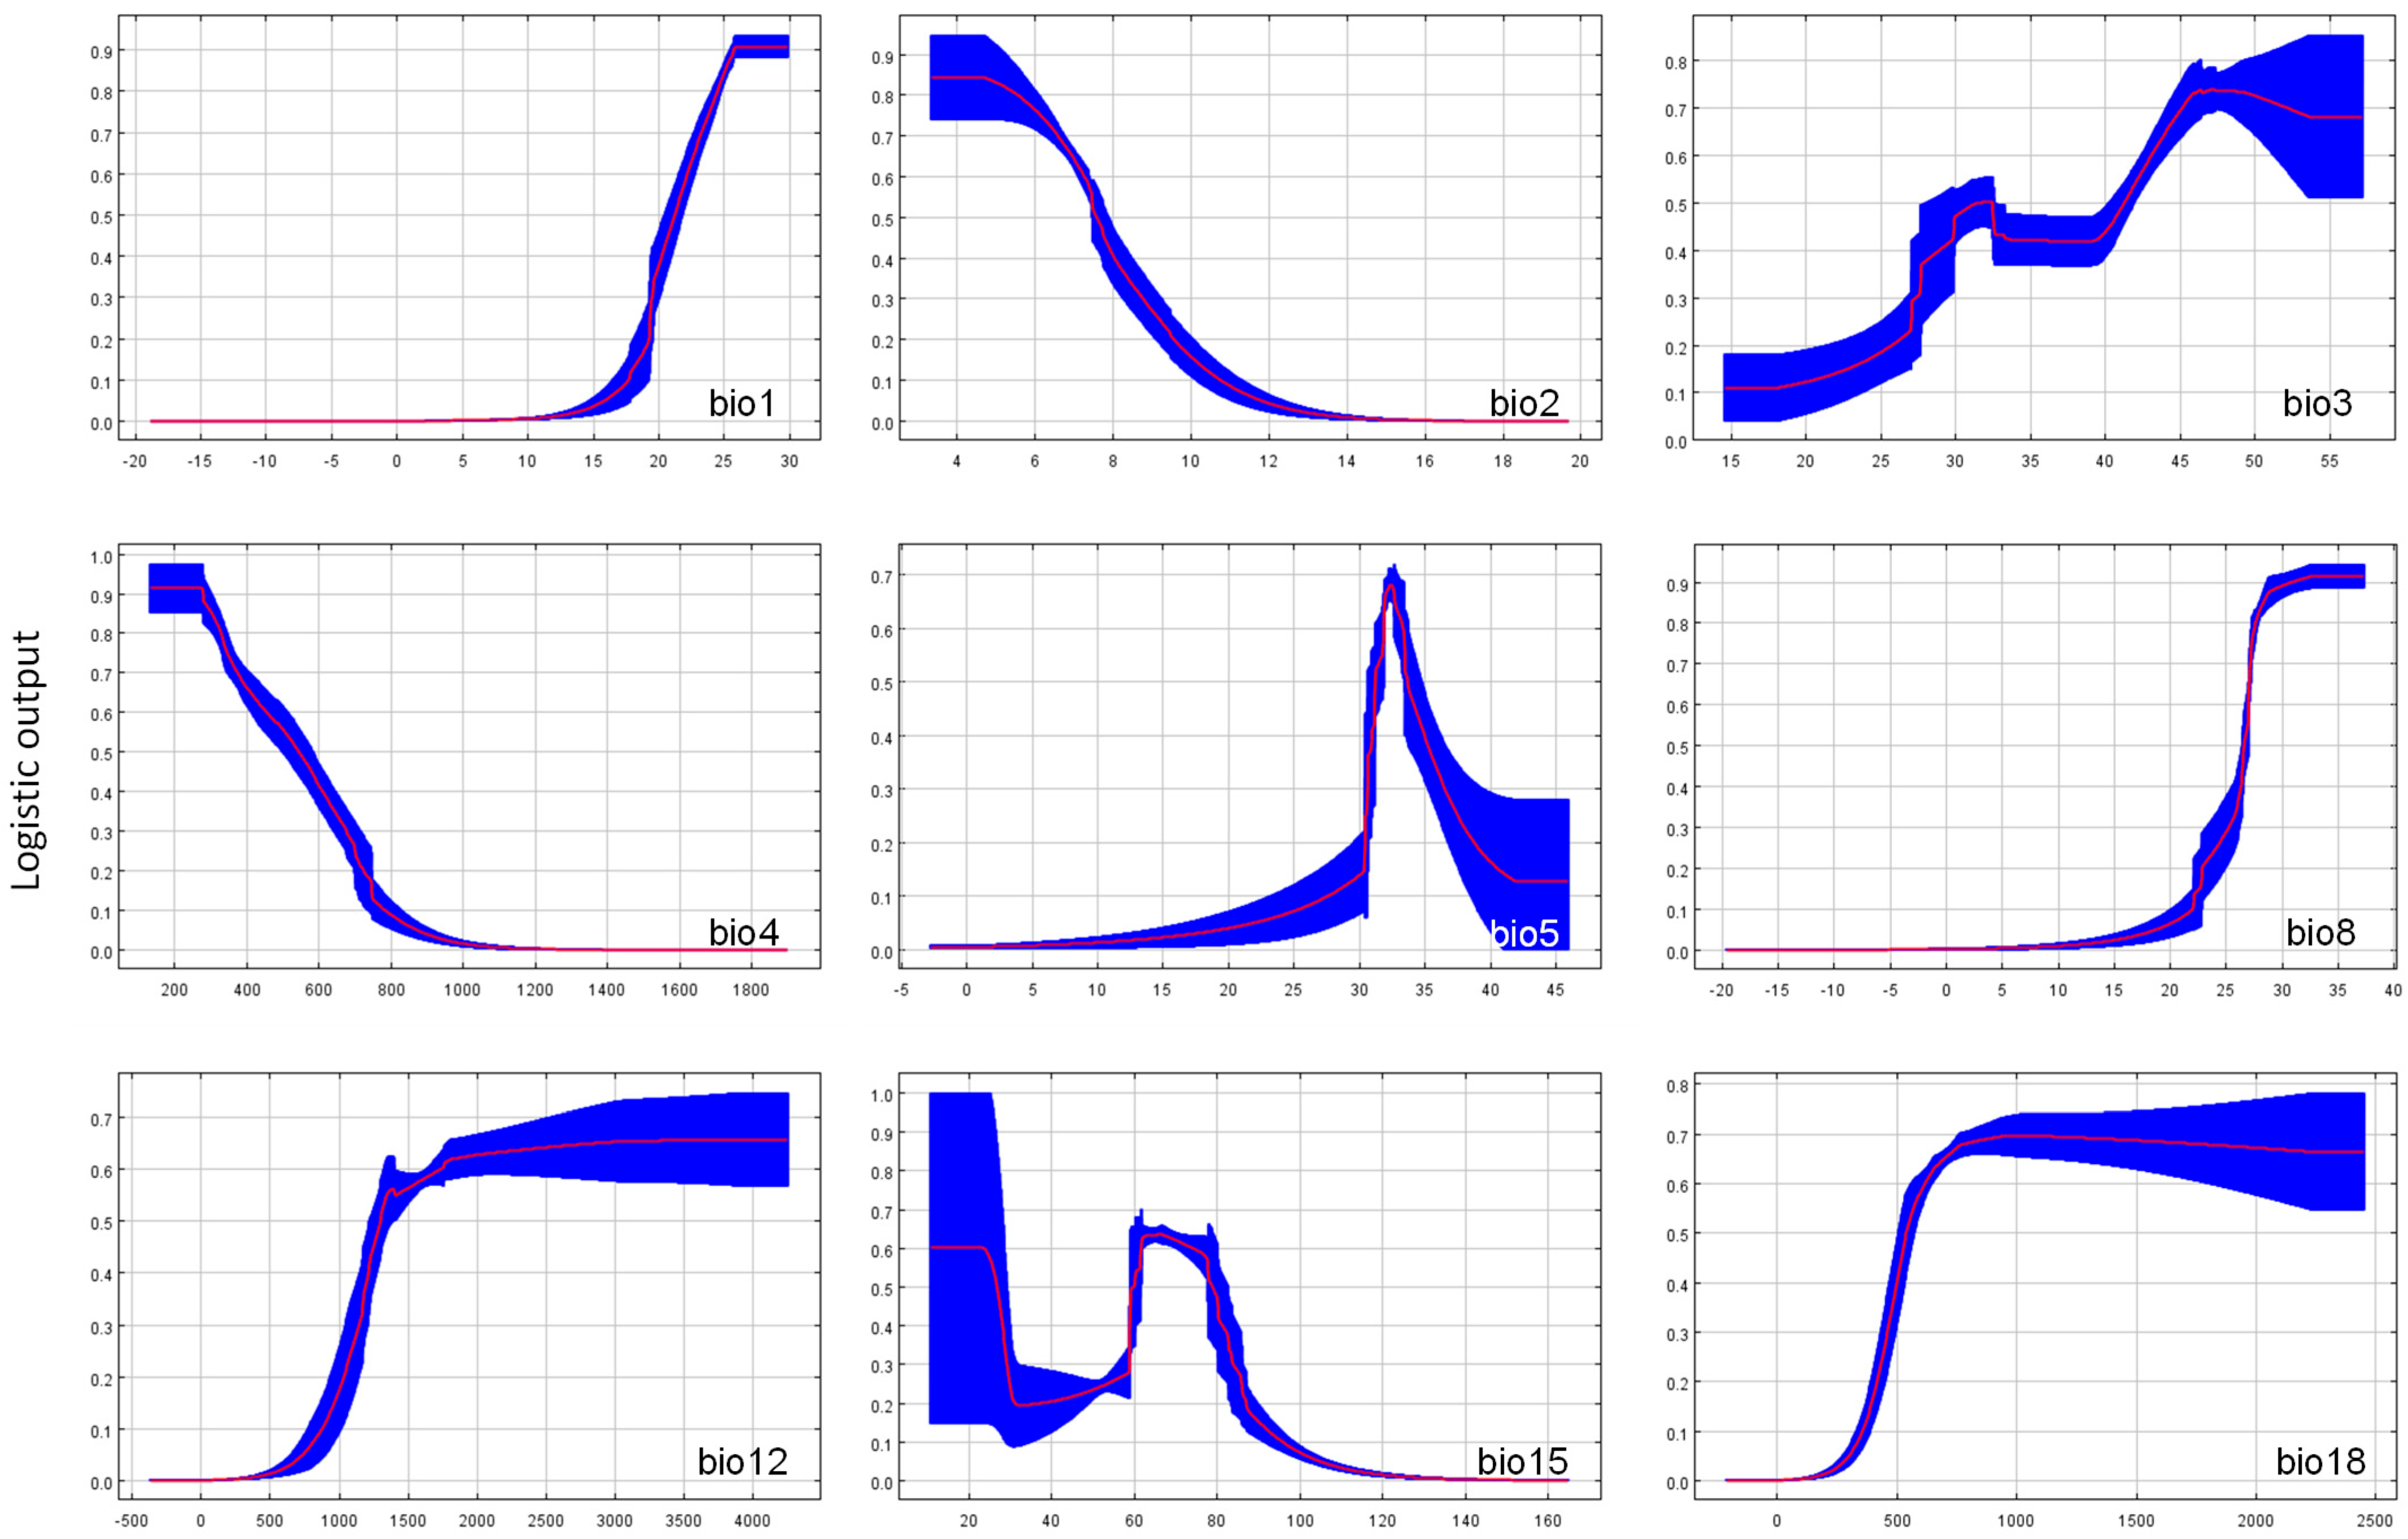
2.2. Main Climatic Factors Shaping Distribution Pattern
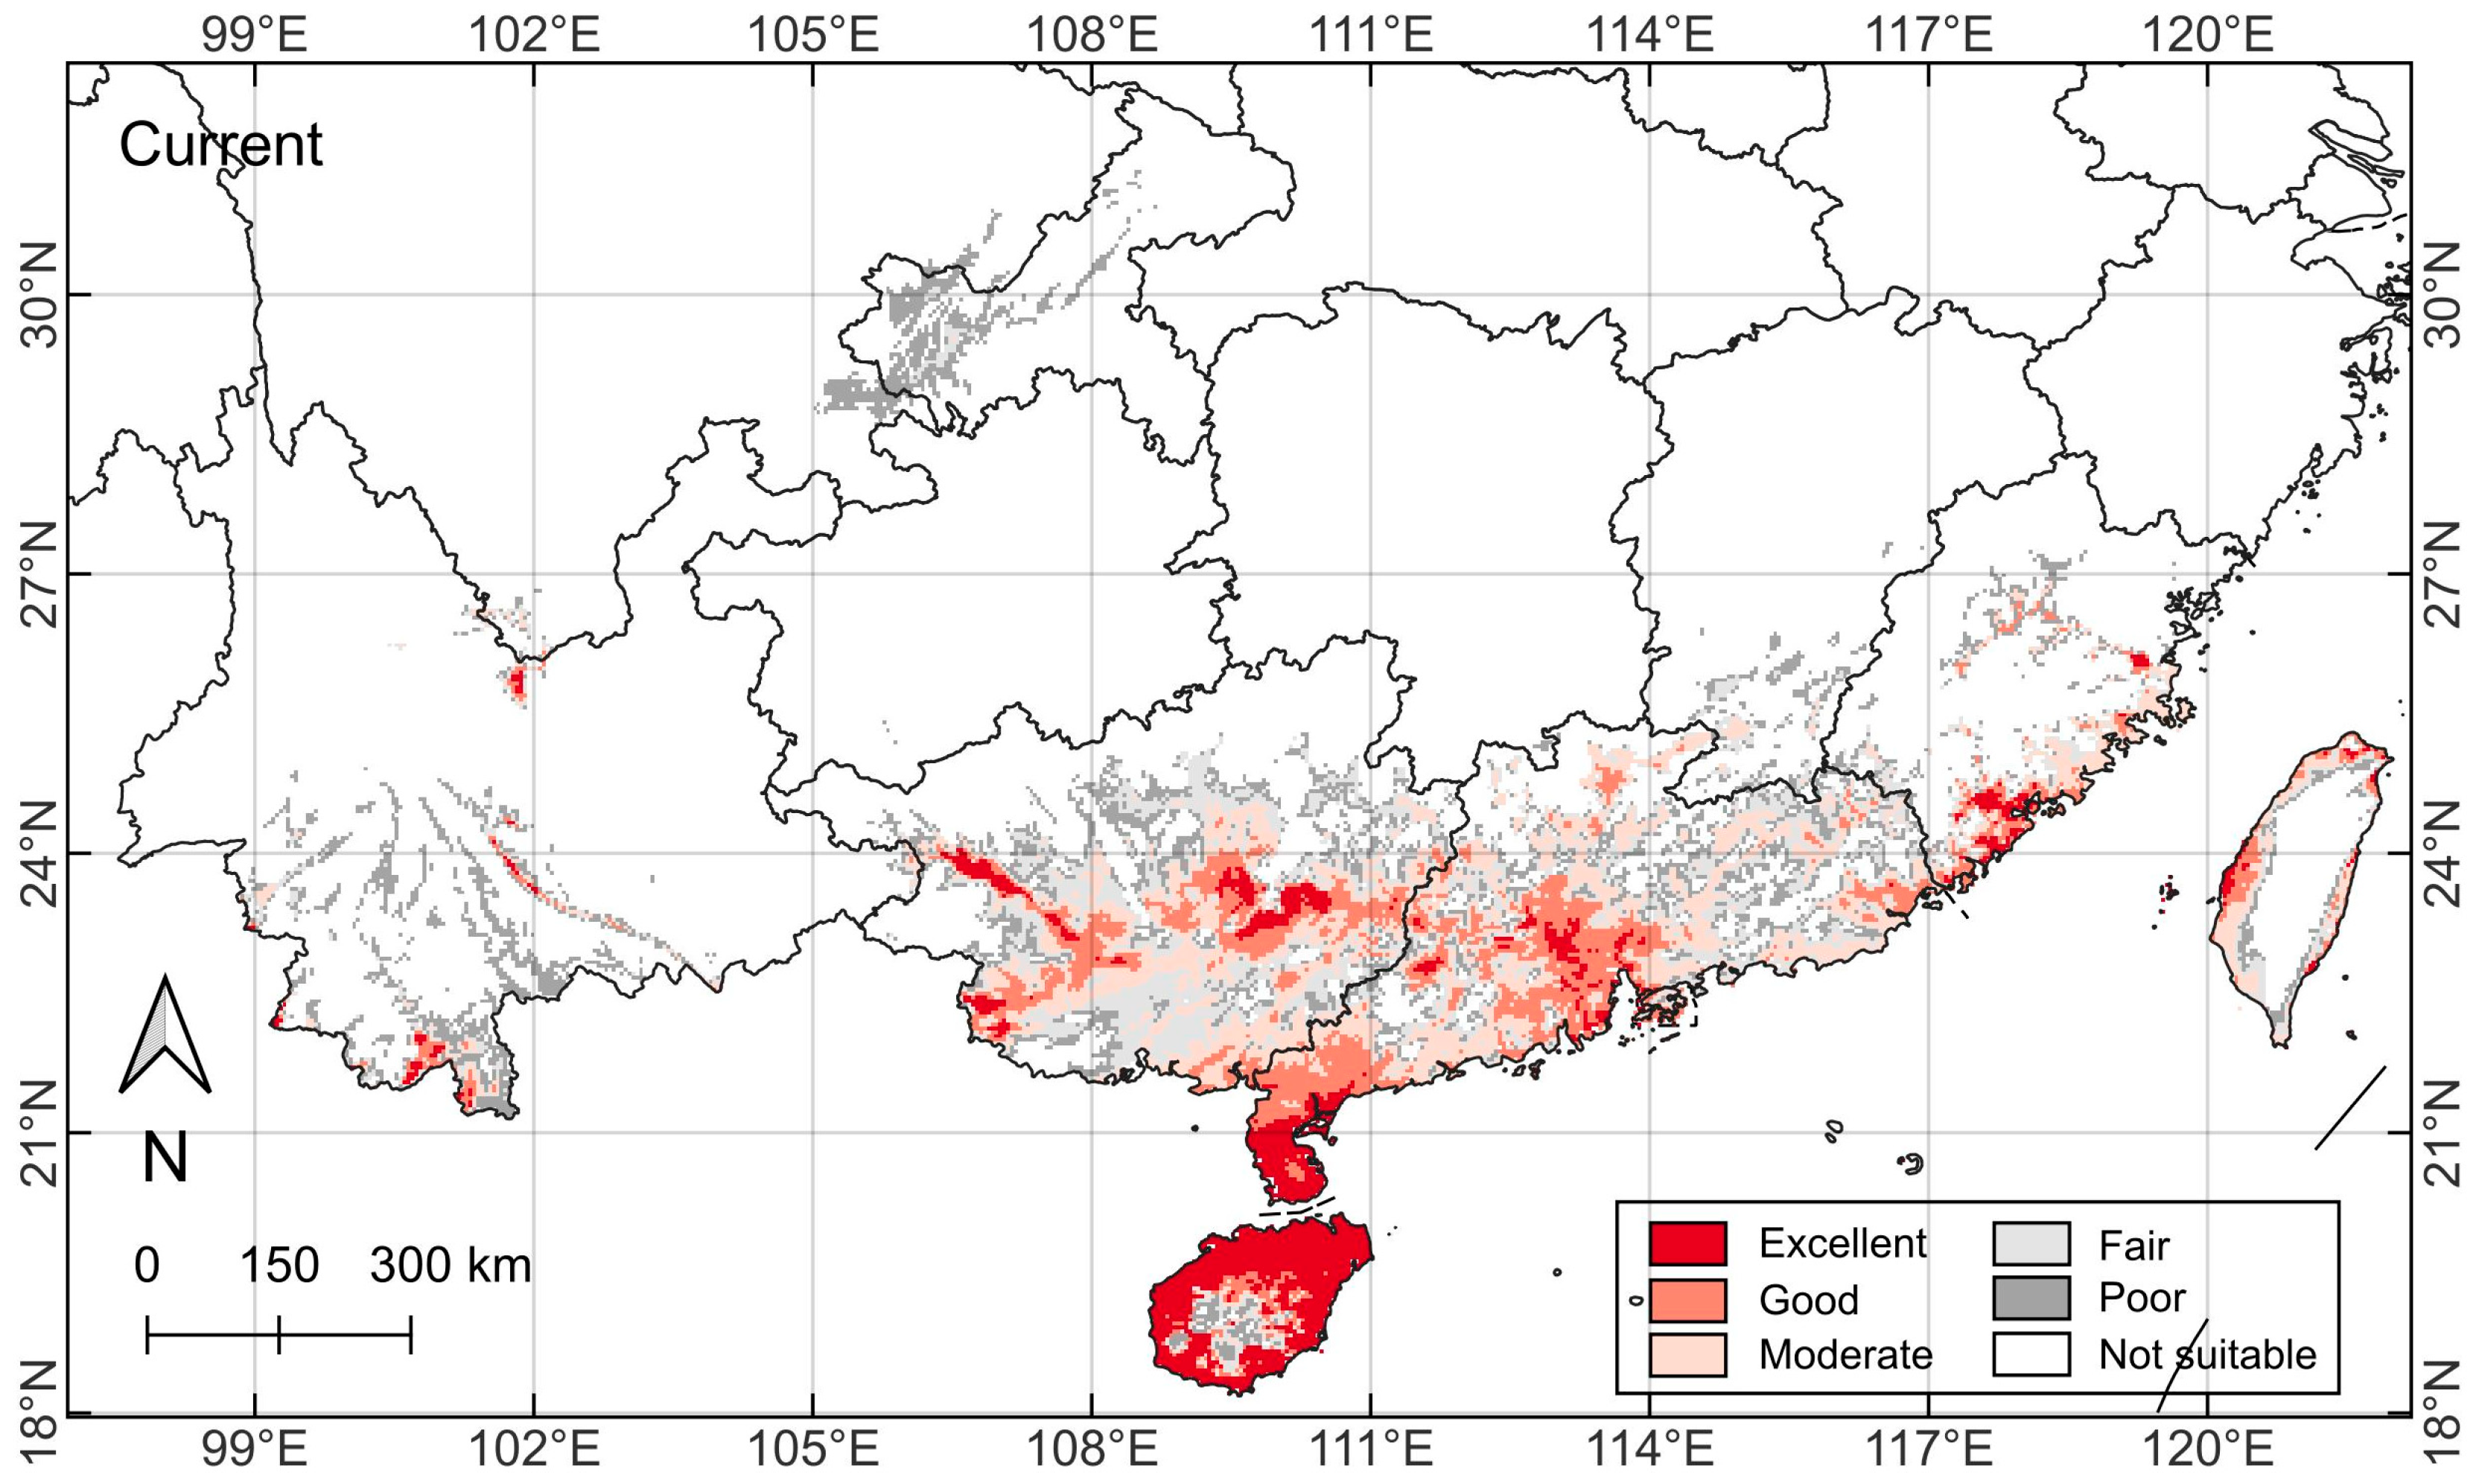
2.3. Current Species Range Distribution Pattern
2.4. Current Habitat Suitability Pattern
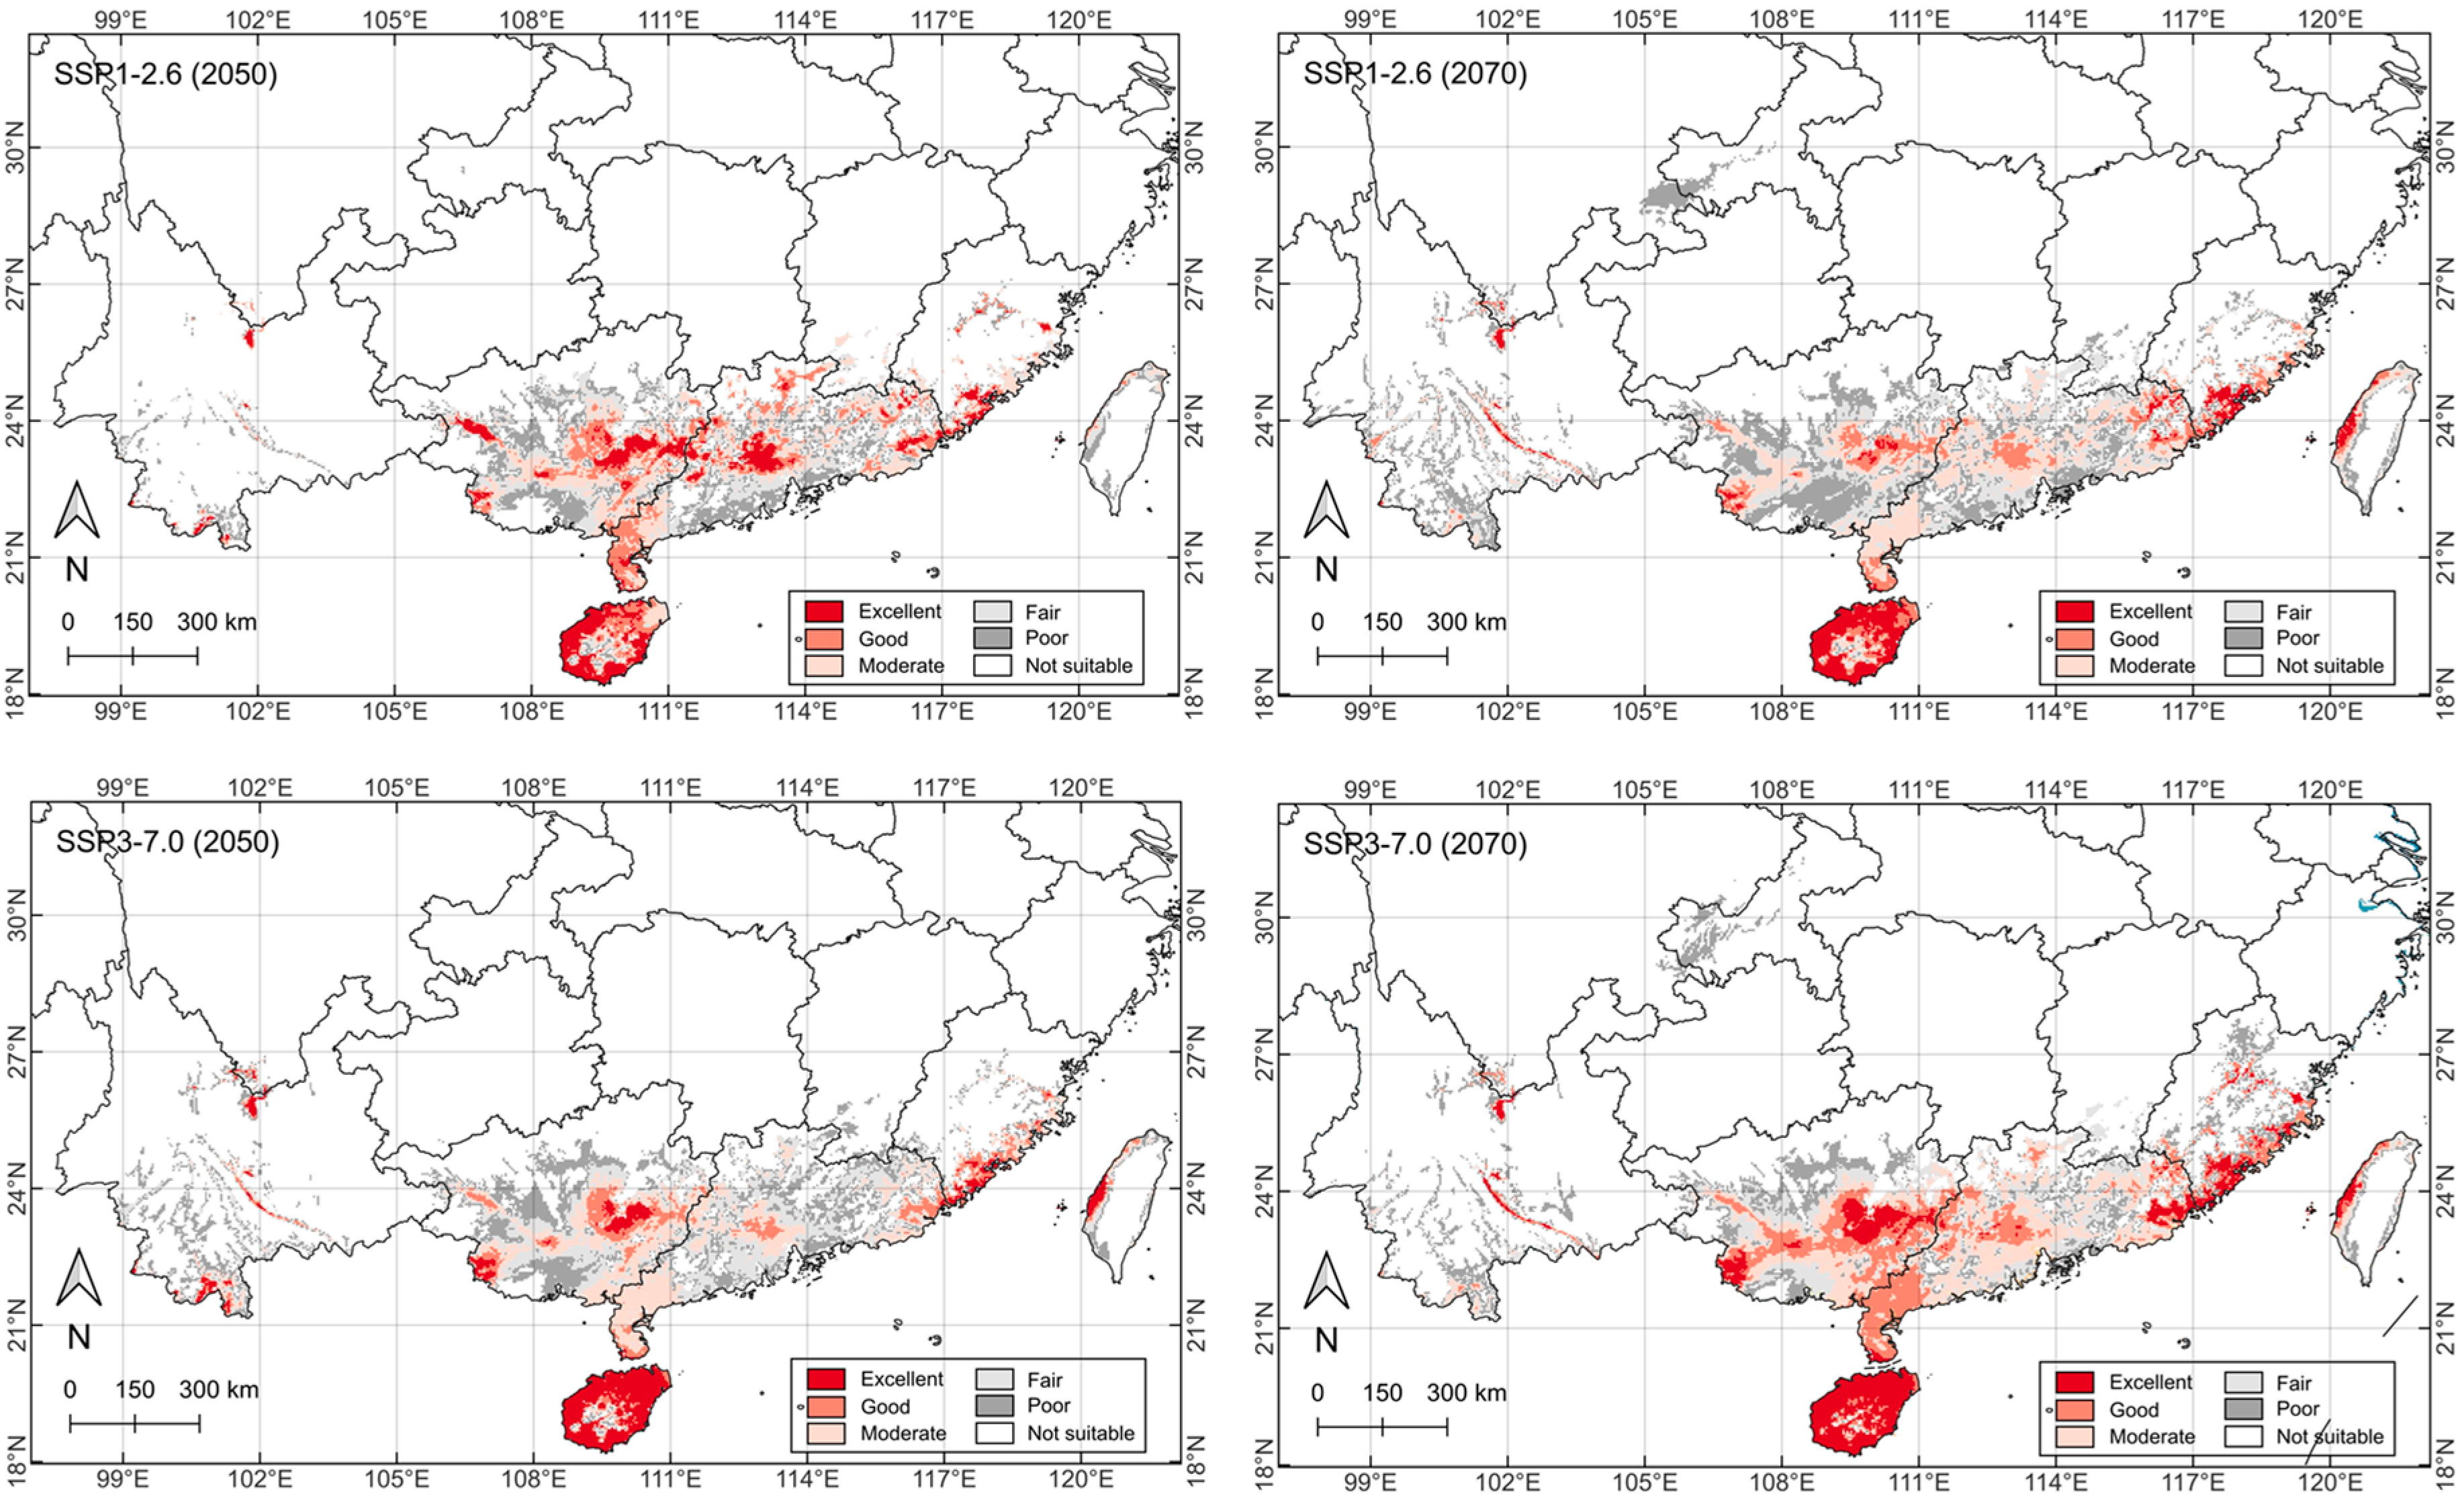
2.5. Future Potential Distribution
3. Discussion
3.1. Current Potential Suitability Habitats and Key Bioclimatic Variables
3.2. Spatial Distribution Under Future Climate Change Scenarios
3.3. Model Assessment
3.4. Implication for Conservation
3.5. Limitations of the Study
4. Materials and Methods
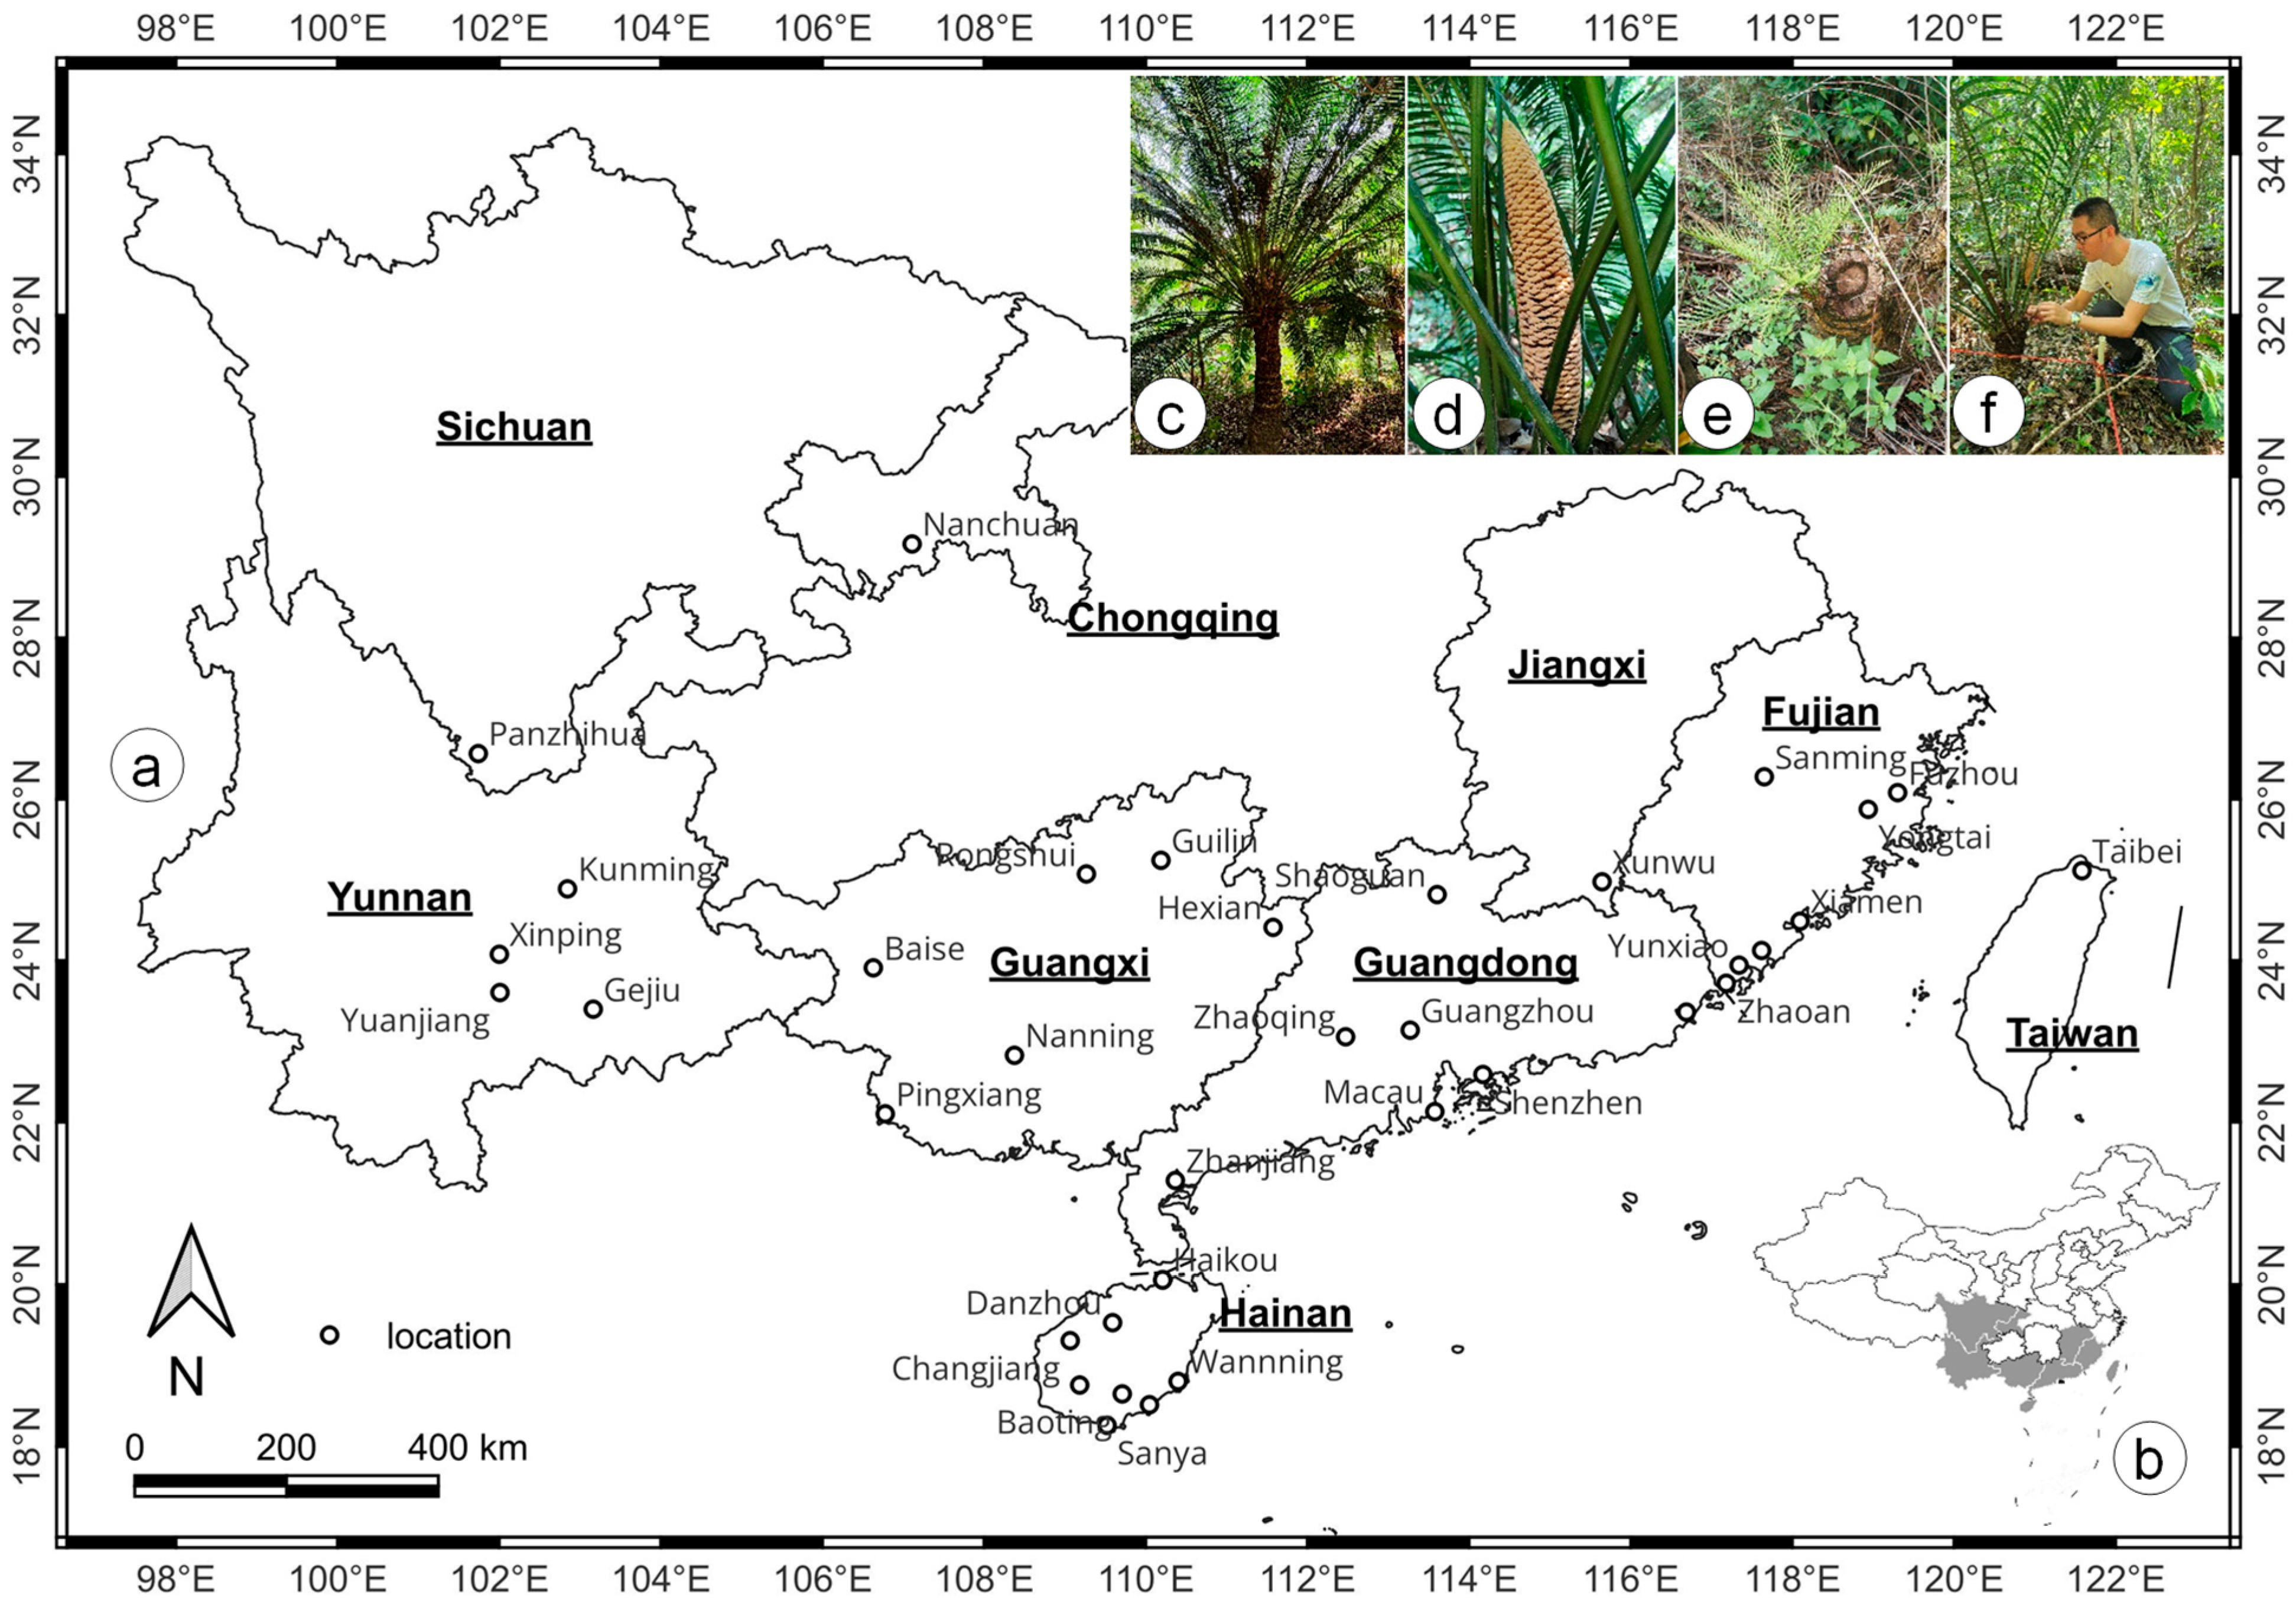
4.1. Collecting Current C. taiwaniana Distribution Data
4.2. Selecting Climate Scenarios and Environmental Variables
4.3. Spatiotemporal Mapping of Suitable Habitats
5. Conclusions
Author Contributions
Funding
Data Availability Statement
Acknowledgments
Conflicts of Interest
Appendix A

| Bioclimatic Variable | Unit | Bioclimatic Variable | Unit |
|---|---|---|---|
| bio1: Annual mean temperature | °C | bio11: Mean temperature of the coldest quarter | °C |
| bio2: Mean diurnal range | °C | bio12: Annual precipitation | mm |
| bio3: Isothermality | Index | bio13: Precipitation of the wettest month | mm |
| bio4: Temperature seasonality | Index | bio14: Precipitation of the driest month | mm |
| bio5: Max temperature of the warmest month | °C | bio15: Precipitation seasonality | Index |
| bio6: Min temperature of the coldest month | °C | bio16: Precipitation of the wettest quarter | mm |
| bio7: Temperature annual range | °C | bio17: Precipitation of the driest quarter | mm |
| bio8: Mean temperature of the wettest quarter | °C | bio18: Precipitation of the warmest quarter | mm |
| bio9: Mean temperature of the driest quarter | °C | bio19: Precipitation of the coldest quarter | mm |
| bio10: Mean temperature of the warmest quarter | °C |
| bio1 | bio2 | bio3 | bio4 | bio5 | bio6 | bio7 | bio8 | bio9 | bio10 | bio11 | bio12 | bio13 | bio14 | bio15 | bio16 | bio17 | bio18 | bio19 | |
|---|---|---|---|---|---|---|---|---|---|---|---|---|---|---|---|---|---|---|---|
| bio1 | 1 | ||||||||||||||||||
| bio2 | −0.337 * | 1 | |||||||||||||||||
| bio3 | 0.255 | 0.628 ** | 1 | ||||||||||||||||
| bio4 | −0.567 ** | −0.043 | −0.793 ** | 1 | |||||||||||||||
| bio5 | 0.545 ** | −0.195 | −0.337 * | 0.330 * | 1 | ||||||||||||||
| bio6 | 0.934 ** | −0.513 ** | 0.244 | −0.695 ** | 0.297 | 1 | |||||||||||||
| bio7 | −0.668 ** | 0.421 * | −0.427 ** | 0.884 ** | 0.221 | −0.865 ** | 1 | ||||||||||||
| bio8 | 0.752 ** | −0.31 | −0.056 | −0.153 | 0.621 ** | 0.621 ** | −0.308 | 1 | |||||||||||
| bio9 | 0.889 ** | −0.375 * | 0.276 | −0.639 ** | 0.334 * | 0.907 ** | −0.751 ** | 0.586 ** | 1 | ||||||||||
| bio10 | 0.742 ** | −0.498 ** | −0.367 * | 0.125 | 0.916 ** | 0.581 ** | −0.113 | 0.760 ** | 0.573 ** | 1 | |||||||||
| bio11 | 0.931 ** | −0.247 | 0.498 ** | −0.825 ** | 0.221 | 0.955 ** | −0.859 ** | 0.575 ** | 0.904 ** | 0.456 ** | 1 | ||||||||
| bio12 | 0.111 | −0.381 * | −0.286 | 0.076 | 0.136 | 0.17 | −0.103 | −0.058 | 0.103 | 0.213 | 0.056 | 1 | |||||||
| bio13 | 0.193 | −0.263 | −0.067 | −0.08 | 0.064 | 0.228 | −0.2 | 0.019 | 0.125 | 0.163 | 0.168 | 0.834 ** | 1 | ||||||
| bio14 | −0.14 | −0.252 | −0.346 * | 0.226 | 0.042 | −0.067 | 0.091 | −0.271 | −0.079 | 0.04 | −0.175 | 0.833 ** | 0.456 ** | 1 | |||||
| bio15 | 0.096 | 0.509 ** | 0.706 ** | −0.501 ** | −0.336 * | 0.053 | −0.231 | 0.096 | 0.028 | −0.333* | 0.258 | −0.595 ** | −0.149 | −0.787 ** | 1 | ||||
| bio16 | 0.184 | −0.158 | 0.011 | −0.099 | 0.055 | 0.191 | −0.166 | 0.023 | 0.096 | 0.13 | 0.164 | 0.831 ** | 0.973 ** | 0.445 ** | −0.1 | 1 | |||
| bio17 | −0.128 | −0.264 | −0.354 * | 0.224 | 0.051 | −0.055 | 0.083 | −0.261 | −0.074 | 0.053 | −0.166 | 0.836 ** | 0.457 ** | 0.999 ** | −0.796 ** | 0.444 ** | 1 | ||
| bio18 | −0.116 | −0.032 | −0.113 | 0.1 | −0.126 | −0.113 | 0.049 | 0.04 | −0.175 | −0.089 | −0.13 | 0.679 ** | 0.725 ** | 0.402 * | −0.08 | 0.787 ** | 0.400 * | 1 | |
| bio19 | −0.174 | −0.302 | −0.460 ** | 0.332 * | 0.101 | −0.111 | 0.167 | −0.258 | −0.064 | 0.092 | −0.24 | 0.785 ** | 0.382 * | 0.971 ** | −0.863 ** | 0.359 * | 0.970 ** | 0.321 | 1 |
References
- Huang, E.; Chen, Y.; Fang, M.; Zheng, Y.; Yu, S. Environmental drivers of plant distributions at global and regional scales. Glob. Ecol. Biogeogr. 2021, 30, 697–709. [Google Scholar] [CrossRef]
- Silva, K.J.P.; Souza, A.F. Common species distribution and environmental determinants in South American coastal plains. Ecosphere 2018, 9, e02224. [Google Scholar] [CrossRef]
- Zhao, Y.; Cao, H.; Xu, W.; Chen, G.; Lian, J.; Du, Y.; Ma, K. Contributions of precipitation and temperature to the large scale geographic distribution of fleshy-fruited plant species: Growth form matters. Sci. Rep. 2018, 8, 17017. [Google Scholar] [CrossRef]
- Waldock, C.; Dornelas, M.; Bates, A.E. Temperature-driven biodiversity change: Disentangling space and time. BioScience 2018, 68, 873–884. [Google Scholar] [CrossRef]
- Fang, J.; Lechowicz, M.J. Climatic limits for the present distribution of beech (Fagus L.) species in the world. J. Biogeogr. 2006, 33, 1804–1819. [Google Scholar] [CrossRef]
- Yang, Y.; Xu, B.; Yu, Q.; Fan, L.; Guo, T.; Fu, D.; Chen, H.; Yan, H.; Shao, F.; Li, X. Distribution pattern and factors influencing spontaneous plant diversity in different wetland habitats. Forests 2022, 13, 1678. [Google Scholar] [CrossRef]
- Huang, L.; Jin, C.; Zhen, M.; Zhou, L.; Qian, S.; Jim, C.Y.; Lin, D.; Zhao, L.; Minor, J.; Coggins, C.; et al. Biogeographic and anthropogenic factors shaping the distribution and species assemblage of heritage trees in China. Urban For. Urban Green. 2020, 50, 126652. [Google Scholar] [CrossRef]
- Oyebanji, O.O.; Onditi, K.O.; Azevedo, J.A.R.; Rahaingoson, F.R.; Nneji, L.M.; Adeleye, M.A.; Stull, G.W.; Zhang, R.; Yi, T.-S. Biogeographic patterns and environmental drivers of species richness in the globally distributed Millettioid/Phaseoloid clade (Fabaceae, subfamily Papilionoideae). Front. Ecol. Evol. 2023, 11, 1231553. [Google Scholar] [CrossRef]
- Crain, B.J.; Fernández, M. Biogeographical analyses to facilitate targeted conservation of orchid diversity hotspots in Costa Rica. Divers. Distrib. 2020, 26, 853–866. [Google Scholar] [CrossRef]
- Bellard, C.; Bertelsmeier, C.; Leadley, P.; Thuiller, W.; Courchamp, F. Impacts of climate change on the future of biodiversity. Ecol. Lett. 2012, 15, 365–377. [Google Scholar] [CrossRef]
- Franco, A.M.A.; Hill, J.K.; Kitschke, C.; Collingham, Y.C.; Roy, D.B.; Fox, R.; Huntley, B.; Thomas, C.D. Impacts of climate warming and habitat loss on extinctions at species’ low-latitude range boundaries. Glob. Change Biol. 2006, 12, 1545–1553. [Google Scholar] [CrossRef]
- Meza-Joya, F.L.; Morgan-Richards, M.; Koot, E.M.; Trewick, S.A. Global warming leads to habitat loss and genetic erosion of alpine biodiversity. J. Biogeogr. 2023, 50, 961–975. [Google Scholar] [CrossRef]
- Chandora, R.; Paul, S.; Rc, K.; Kumar, P.; Singh, B.; Kumar, P.; Sharma, A.; Kumar, A.; Singh, D.; Negi, N.; et al. Ecological survey, population assessment and habitat distribution modelling for conserving Fritillaria roylei—A critically endangered Himalayan medicinal herb. S. Afr. J. Bot. 2023, 160, 75–87. [Google Scholar] [CrossRef]
- Gomes, V.H.F.; Ijff, S.D.; Raes, N.; Amaral, I.L.; Salomão, R.P.; de Souza Coelho, L.; de Almeida Matos, F.D.; Castilho, C.V.; de Andrade Lima Filho, D.; López, D.C.; et al. Species distribution modelling: Contrasting presence-only models with plot abundance data. Sci. Rep. 2018, 8, 1003. [Google Scholar] [CrossRef]
- Harrison, S.; Spasojevic, M.J.; Li, D. Climate and plant community diversity in space and time. Proc. Natl. Acad. Sci. USA 2020, 117, 4464–4470. [Google Scholar] [CrossRef]
- Lavergne, S.; Mouquet, N.; Thuiller, W.; Ronce, O. Biodiversity and climate change: Integrating evolutionary and ecological responses of species and communities. Annu. Rev. Ecol. Evol. Syst. 2010, 41, 321–350. [Google Scholar] [CrossRef]
- Abdelaal, M.; Fois, M.; Fenu, G.; Bacchetta, G. Using MaxEnt modeling to predict the potential distribution of the endemic plant Rosa arabica Crép. in Egypt. Ecol. Inform. 2019, 50, 68–75. [Google Scholar] [CrossRef]
- Xie, C.P.; Wu, C.K.; Fu, G.; Lai, S.F.; Fang, Y.; Wang, H.C. Population structure characteristics and dynamics of Cycas hainanensis in Wuzhi Mountains, Hainan Province. J. Cent. South Univ. For. Technol. 2019, 39, 77–85. [Google Scholar] [CrossRef]
- Harper, E.B.; Stella, J.C.; Fremier, A.K. Global sensitivity analysis for complex ecological models: A case study of riparian cottonwood population dynamics. Ecol. Appl. 2011, 21, 1225–1240. [Google Scholar] [CrossRef]
- Malhi, Y.; Franklin, J.; Seddon, N.; Solan, M.; Turner, M.G.; Field, C.B.; Knowlton, N. Climate change and ecosystems: Threats, opportunities and solutions. Philos. Trans. R. Soc. B Biol. Sci. 2020, 375, 20190104. [Google Scholar] [CrossRef]
- Trew, B.T.; Maclean, I.M.D. Vulnerability of global biodiversity hotspots to climate change. Glob. Ecol. Biogeogr. 2021, 30, 768–783. [Google Scholar] [CrossRef]
- Lissovsky, A.A.; Dudov, S.V. Species-distribution modeling: Advantages and limitations of its application. 2. MaxEnt. Biol. Bull. Rev. 2021, 11, 265–275. [Google Scholar] [CrossRef]
- Gobeyn, S.; Mouton, A.M.; Cord, A.F.; Kaim, A.; Volk, M.; Goethals, P.L.M. Evolutionary algorithms for species distribution modelling: A review in the context of machine learning. Ecol. Model. 2019, 392, 179–195. [Google Scholar] [CrossRef]
- Booth, T.H.; Nix, H.A.; Busby, J.R.; Hutchinson, M.F. Bioclim: The first species distribution modelling package, its early applications and relevance to most current MaxEnt studies. Divers. Distrib. 2014, 20, 1–9. [Google Scholar] [CrossRef]
- Ramirez-Cabral, N.Y.Z.; Kumar, L.; Shabani, F. Global alterations in areas of suitability for maize production from climate change and using a mechanistic species distribution model (CLIMEX). Sci. Rep. 2017, 7, 5910. [Google Scholar] [CrossRef]
- Tourinho, L.; Vale, M.M. Choosing among correlative, mechanistic, and hybrid models of species’ niche and distribution. Integr. Zool. 2023, 18, 93–109. [Google Scholar] [CrossRef]
- Sabat-Tomala, A.; Raczko, E.; Zagajewski, B. Comparison of support vector machine and random forest algorithms for invasive and expansive species classification using airborne hyperspectral data. Remote Sens. 2020, 12, 516. [Google Scholar] [CrossRef]
- Merow, C.; Smith, M.J.; Silander Jr, J.A. A practical guide to MaxEnt for modeling species’ distributions: What it does, and why inputs and settings matter. Ecography 2013, 36, 1058–1069. [Google Scholar] [CrossRef]
- Elith, J.; Leathwick, J. The contribution of species distribution modelling to conservation prioritization. In Spatial Conservation Prioritization: Quantitative Methods & Computational Tools; Moilanen, A., Wilson, A.K., Possingham, H.P., Eds.; Oxford University Press Inc.: New York, NY, USA, 2009; pp. 70–93. [Google Scholar]
- Wu, L.-X.; Xu, H.-Y.; Jian, S.-G.; Gong, X.; Feng, X.-Y. Geographic factors and climatic fluctuation drive the genetic structure and demographic history of Cycas taiwaniana (Cycadaceae), an endemic endangered species to Hainan Island in China. Ecol. Evol. 2022, 12, e9508. [Google Scholar] [CrossRef]
- Mankga, L.T.; Yessoufou, K. Factors driving the global decline of cycad diversity. AoB Plants 2017, 9, plx022. [Google Scholar] [CrossRef]
- Yessoufou, K.; Daru, B.H.; Tafirei, R.; Elansary, H.O.; Rampedi, I. Integrating biogeography, threat and evolutionary data to explore extinction crisis in the taxonomic group of cycads. Ecol. Evol. 2017, 7, 2735–2746. [Google Scholar] [CrossRef] [PubMed]
- Zheng, Y.; Chiang, T.-Y.; Huang, C.-L.; Gong, X. Highly diverse endophytes in roots of Cycas bifida (Cycadaceae), an ancient but endangered gymnosperm. J. Microbiol. 2018, 56, 337–345. [Google Scholar] [CrossRef] [PubMed]
- Gutiérrez-García, K.; Bustos-Díaz, E.D.; Corona-Gómez, J.A.; Ramos-Aboites, H.E.; Sélem-Mojica, N.; Cruz-Morales, P.; Pérez-Farrera, M.A.; Barona-Gómez, F.; Cibrián-Jaramillo, A. Cycad coralloid roots contain bacterial communities including Cyanobacteria and Caulobacter spp. That encode niche-specific biosynthetic gene clusters. Genome Biol. Evol. 2019, 11, 319–334. [Google Scholar] [CrossRef]
- Marler, T.E.; Calonje, M. Two cycad species affect the carbon, nitrogen, and phosphorus content of soils. Horticulturae 2020, 6, 24. [Google Scholar] [CrossRef]
- Zheng, Y.; Gong, X. Niche differentiation rather than biogeography shapes the diversity and composition of microbiome of Cycas panzhihuaensis. Microbiome 2019, 7, 152. [Google Scholar] [CrossRef]
- Zheng, Y.; Liu, J.; Feng, X.; Gong, X. The distribution, diversity, and conservation status of Cycas in China. Ecol. Evol. 2017, 7, 3212–3224. [Google Scholar] [CrossRef]
- Bösenberg, J.D. Cycas taiwaniana. In The IUCN Red List of Threatened Species; IUCN: Cambridge, UK, 2023. [Google Scholar] [CrossRef]
- Xi, H.; Wang, Y.; Pan, Y.; Xu, T.; Zhan, Q.; Liu, J.; Feng, X.; Gong, X. Resources and protection of Cycas plants in China. Biodivers. Sci. 2022, 30, 21495. [Google Scholar] [CrossRef]
- Gao, Z. Protection of wild Cycas taiwaniana in Fujian. Chin. Wild Plant Resour. 2003, 22, 36–37. [Google Scholar] [CrossRef]
- Huang, H. Plant diversity and conservation in China: Planning a strategic bioresource for a sustainable future. Bot. J. Linn. Soc. 2011, 166, 282–300. [Google Scholar] [CrossRef]
- Feng, X.-Y.; Wang, X.-H.; Chiang, Y.-C.; Jian, S.-G.; Gong, X. Species delimitation with distinct methods based on molecular data to elucidate species boundaries in the complex (Cycadaceae). Taxon 2021, 70, 477–491. [Google Scholar] [CrossRef]
- Wang, X.-H.; Wu, W.; Jian, S.-G. Transcriptome analysis of two radiated Cycas species and the subsequent species delimitation of the Cycas taiwaniana complex. Appl. Plant Sci. 2019, 7, e11292. [Google Scholar] [CrossRef] [PubMed]
- Wang, X.-H.; Li, J.; Zhang, L.-M.; He, Z.-W.; Mei, Q.-M.; Gong, X.; Jian, S.-G. Population differentiation and demographic history of the Cycas taiwaniana complex (Cycadaceae) endemic to south China as indicated by DNA sequences and microsatellite markers. Front. Genet. 2019, 10, 1238. [Google Scholar] [CrossRef] [PubMed]
- Domrös, M.; Peng, G. The climate of China; Springer Science & Business Media: Berlin, Germany, 2012. [Google Scholar]
- Xu, Q.; Dong, Y.; Wang, Y.; Yang, R.; Xu, C. Determinants and identification of the northern boundary of China’s tropical zone. J. Geogr. Sci. 2018, 28, 31–45. [Google Scholar] [CrossRef]
- Kearney, M.; Porter, W. Mechanistic niche modelling: Combining physiological and spatial data to predict species’ ranges. Ecol. Lett. 2009, 12, 334–350. [Google Scholar] [CrossRef]
- Zhu, Z.-X.; Nizamani, M.M.; Harris, A.J.; Wang, H.-F. Anthropogenic factors are stronger drivers of patterns of endemic plant diversity on Hainan Island of China than natural environmental factors. PLoS ONE 2021, 16, e0257575. [Google Scholar] [CrossRef]
- Wei, L.; Wang, G.; Liang, H.; Pan, Y.; Chen, X.; Huang, Q. Predicting the potential suitable habitat for China’s endangered plant Cycas sexseminifera based on the MaxEnt model. Pak. J. Bot. 2025, 57, 163–171. [Google Scholar] [CrossRef]
- Gutiérrez-Ortega, J.S.; Pérez-Farrera, M.A.; Matsuo, A.; Sato, M.P.; Suyama, Y.; Calonje, M.; Vovides, A.P.; Kajita, T.; Watano, Y. The phylogenetic reconstruction of the Neotropical cycad genus Ceratozamia (Zamiaceae) reveals disparate patterns of niche evolution. Mol. Phylogenetics Evol. 2024, 190, 107960. [Google Scholar] [CrossRef] [PubMed]
- Wang, Y.; Chen, L.; Song, Z.; Huang, Z.; Ge, E.; Lin, L.; Luo, M. Human-perceived temperature changes over South China: Long-term trends and urbanization effects. Atmos. Res. 2019, 215, 116–127. [Google Scholar] [CrossRef]
- Cai, C.; Zhang, X.; Zha, J.; Li, J.; Li, J. Predicting climate change impacts on the rare and endangered Horsfieldia tetratepala in China. Forests 2022, 13, 1051. [Google Scholar] [CrossRef]
- Xie, C.; Huang, B.; Jim, C.Y.; Han, W.; Liu, D. Predicting differential habitat suitability of Rhodomyrtus tomentosa under current and future climate scenarios in China. For. Ecol. Manag. 2021, 501, 119696. [Google Scholar] [CrossRef]
- Polovina, J.J.; Dunne, J.P.; Woodworth, P.A.; Howell, E.A. Projected expansion of the subtropical biome and contraction of the temperate and equatorial upwelling biomes in the North Pacific under global warming. ICES J. Mar. Sci. 2011, 68, 986–995. [Google Scholar] [CrossRef]
- Stott, P. How climate change affects extreme weather events. Science 2016, 352, 1517–1518. [Google Scholar] [CrossRef]
- Menezes-Silva, P.E.; Loram-Lourenço, L.; Alves, R.D.F.B.; Sousa, L.F.; Almeida, S.E.d.S.; Farnese, F.S. Different ways to die in a changing world: Consequences of climate change for tree species performance and survival through an ecophysiological perspective. Ecol. Evol. 2019, 9, 11979–11999. [Google Scholar] [CrossRef] [PubMed]
- Blois, J.L.; Zarnetske, P.L.; Fitzpatrick, M.C.; Finnegan, S. Climate Change and the Past, Present, and Future of Biotic Interactions. Science 2013, 341, 499–504. [Google Scholar] [CrossRef] [PubMed]
- Giannakopoulos, C.; Le Sager, P.; Bindi, M.; Moriondo, M.; Kostopoulou, E.; Goodess, C.M. Climatic changes and associated impacts in the Mediterranean resulting from a 2°C global warming. Glob. Planet. Change 2009, 68, 209–224. [Google Scholar] [CrossRef]
- Delach, A.; Caldas, A.; Edson, K.M.; Krehbiel, R.; Murray, S.; Theoharides, K.A.; Vorhees, L.J.; Malcom, J.W.; Salvo, M.N.; Miller, J.R.B. Agency plans are inadequate to conserve US endangered species under climate change. Nat. Clim. Change 2019, 9, 999–1004. [Google Scholar] [CrossRef]
- Fox, R.J.; Donelson, J.M.; Schunter, C.; Ravasi, T.; Gaitán-Espitia, J.D. Beyond buying time: The role of plasticity in phenotypic adaptation to rapid environmental change. Philos. Trans. R. Soc. B Biol. Sci. 2019, 374, 20180174. [Google Scholar] [CrossRef]
- Cameron, D.R.; Schloss, C.A.; Theobald, D.M.; Morrison, S.A. A framework to select strategies for conserving and restoring habitat connectivity in complex landscapes. Conserv. Sci. Pract. 2022, 4, e12698. [Google Scholar] [CrossRef]
- James, H.E.; Forster, P.I.; Lamont, R.W.; Shapcott, A. Conservation genetics and demographic analysis of the endangered cycad species Cycas megacarpa and the impacts of past habitat fragmentation. Aust. J. Bot. 2018, 66, 173–189. [Google Scholar] [CrossRef]
- Wisz, M.S.; Hijmans, R.J.; Li, J.; Peterson, A.T.; Graham, C.H.; Guisan, A.; Group, N.P.S.D.W. Effects of sample size on the performance of species distribution models. Divers. Distrib. 2008, 14, 763–773. [Google Scholar] [CrossRef]
- Xu, N.; Meng, F.; Zhou, G.; Li, Y.; Wang, B.; Lu, H. Assessing the suitable cultivation areas for Scutellaria baicalensis in China using the MaxEnt model and multiple linear regression. Biochem. Syst. Ecol. 2020, 90, 104052. [Google Scholar] [CrossRef]
- Phillips, S.J.; Anderson, R.P.; Schapire, R.E. Maximum entropy modeling of species geographic distributions. Ecol. Model. 2006, 190, 231–259. [Google Scholar] [CrossRef]
- Hernandez, P.A.; Graham, C.H.; Master, L.L.; Albert, D.L. The effect of sample size and species characteristics on performance of different species distribution modeling methods. Ecography 2006, 29, 773–785. [Google Scholar] [CrossRef]
- Elith, J.; Graham, C.H.; Anderson, R.P.; Dudík, M.; Ferrier, S.; Guisan, A.; Hijmans, R.J.; Huettmann, F.; Leathwick, J.R.; Lehmann, A.; et al. Novel methods improve prediction of species’ distributions from occurrence data. Ecography 2006, 29, 129–151. [Google Scholar] [CrossRef]
- Kumar, S.; Stohlgren, T.J. Maxent modeling for predicting suitable habitat for threatened and endangered tree Canacomyrica monticola in New Caledonia. J. Ecol. Nat. Environ. 2009, 1, 94–98. [Google Scholar]
- Muscarella, R.; Galante, P.J.; Soley-Guardia, M.; Boria, R.A.; Kass, J.M.; Uriarte, M.; Anderson, R.P. ENMeval: An R package for conducting spatially independent evaluations and estimating optimal model complexity for Maxent ecological niche models. Methods Ecol. Evol. 2014, 5, 1198–1205. [Google Scholar] [CrossRef]
- Pradhan, A.; Chettri, A. Identifying protected areas suitable for conservation of Cycas pectinata Buch. Ham. in southeast Asia under climate change scenario. Int. J. Ecol. Environ. Sci. 2017, 43, 129–141. [Google Scholar]
- Hossain, M.K.; Hossain, M.A.; Hossain, S.; Rahman, M.R.; Hossain, M.I.; Nath, S.K.; Siddiqui, M.B.N. Status and conservation needs of Cycas pectinata Buch.-Ham. in its natural habitat at Baroiyadhala National Park, Bangladesh. J. Threat. Taxa 2021, 13, 19070–19078. [Google Scholar] [CrossRef]
- Griffith, M.P.; Calonje, M.; Meerow, A.W.; Tut, F.; Kramer, A.T.; Hird, A.; Magellan, T.M.; Husby, C.E. Can a botanic garden cycad collection capture the genetic diversity in a wild population? Int. J. Plant Sci. 2015, 176, 1–10. [Google Scholar] [CrossRef]
- Breman, E.; Ballesteros, D.; Castillo-Lorenzo, E.; Cockel, C.; Dickie, J.; Faruk, A.; O’Donnell, K.; Offord, C.A.; Pironon, S.; Sharrock, S.; et al. Plant diversity conservation challenges and prospects—The perspective of botanic gardens and the millennium seed bank. Plants 2021, 10, 2371. [Google Scholar] [CrossRef]
- Denney, D.A.; Jameel, M.I.; Bemmels, J.B.; Rochford, M.E.; Anderson, J.T. Small spaces, big impacts: Contributions of micro-environmental variation to population persistence under climate change. AoB Plants 2020, 12, plaa005. [Google Scholar] [CrossRef] [PubMed]
- Kavaliauskas, D.; Fussi, B.; Westergren, M.; Aravanopoulos, F.; Finzgar, D.; Baier, R.; Alizoti, P.; Bozic, G.; Avramidou, E.; Konnert, M.; et al. The interplay between forest management practices, genetic monitoring, and other long-term monitoring systems. Forests 2018, 9, 133. [Google Scholar] [CrossRef]
- Kainer, K.A.; DiGiano, M.L.; Duchelle, A.E.; Wadt, L.H.O.; Bruna, E.; Dain, J.L. Partnering for greater success: Local stakeholders and research in tropical biology and conservation. Biotropica 2009, 41, 555–562. [Google Scholar] [CrossRef]
- Tsiftsis, S.; Štípková, Z.; Rejmánek, M.; Kindlmann, P. Predictions of species distributions based only on models estimating future climate change are not reliable. Sci. Rep. 2024, 14, 25778. [Google Scholar] [CrossRef] [PubMed]
- Yang, S.; Wang, H.; Tong, J.; Bai, Y.; Alatalo, J.M.; Liu, G.; Fang, Z.; Zhang, F. Impacts of environment and human activity on grid-scale land cropping suitability and optimization of planting structure, measured based on the MaxEnt model. Sci. Total Environ. 2022, 836, 155356. [Google Scholar] [CrossRef]
- Velazco, S.J.E.; Ribeiro, B.R.; Laureto, L.M.O.; De Marco Júnior, P. Overprediction of species distribution models in conservation planning: A still neglected issue with strong effects. Biol. Conserv. 2020, 252, 108822. [Google Scholar] [CrossRef]
- Li, M.; Zhou, Y.; Yang, Y. Catalogue of Chinese gymnosperms based on the most recent gymnosperm classification system. J. Nanjing For. Univ. (Nat. Sci. Ed.) 2024, 48, 49–56. [Google Scholar] [CrossRef]
- Fick, S.E.; Hijmans, R.J. WorldClim 2: New 1-km spatial resolution climate surfaces for global land areas. Int. J. Climatol. 2017, 37, 4302–4315. [Google Scholar] [CrossRef]
- Wu, T.; Lu, Y.; Fang, Y.; Xin, X.; Li, L.; Li, W.; Jie, W.; Zhang, J.; Liu, Y.; Zhang, L.; et al. The Beijing Climate Center Climate System Model (BCC-CSM): The main progress from CMIP5 to CMIP6. Geosci. Model Dev. 2019, 12, 1573–1600. [Google Scholar] [CrossRef]
- Salehie, O.; Hamed, M.M.; Ismail, T.b.; Shahid, S. Projection of droughts in Amu River basin for shared socioeconomic pathways CMIP6. Theor. Appl. Climatol. 2022, 149, 1009–1027. [Google Scholar] [CrossRef]
- Zhang, H.; Zhou, Y.; Zhang, S.; Wang, Z.; Liu, Z. Adaptive distribution and priority protection of endangered species Cycas balansae. Plants 2025, 14, 815. [Google Scholar] [CrossRef] [PubMed]
- Phillips, S.J.; Anderson, R.P.; Dudík, M.; Schapire, R.E.; Blair, M.E. Opening the black box: An open-source release of Maxent. Ecography 2017, 40, 887–893. [Google Scholar] [CrossRef]
- Xie, C.; Tian, E.; Jim, C.Y.; Liu, D.; Hu, Z. Effects of climate-change scenarios on the distribution patterns of Castanea henryi. Ecol. Evol. 2022, 12, e9597. [Google Scholar] [CrossRef] [PubMed]
- Ab Lah, N.Z.; Yusop, Z.; Hashim, M.; Mohd Salim, J.; Numata, S. Predicting the habitat suitability of Melaleuca cajuputi based on the MaxEnt species distribution model. Forests 2021, 12, 1449. [Google Scholar] [CrossRef]
- Fois, M.; Cuena-Lombraña, A.; Fenu, G.; Bacchetta, G. Using species distribution models at local scale to guide the search of poorly known species: Review, methodological issues and future directions. Ecol. Model. 2018, 385, 124–132. [Google Scholar] [CrossRef]
| Bioclimatic Variable | Bioclimatic Attribute | Mean ± SD | Minimum | Maximum | 95% Confidence Interval | Coefficient of Variation (%) |
|---|---|---|---|---|---|---|
| bio1 | Annual mean temperature | 21.7 ± 2.5 | 15.4 | 25.8 | 20.8–22.5 | 11.62 |
| bio2 | Mean diurnal range (Mean of monthly (max temp-min temp)) | 7.8 ± 1.7 | 5.1 | 12.4 | 7.3–8. 4 | 22.11 |
| bio3 | Isothermality (bio2/bio7) (×100) | 36.1 ± 7.9 | 24.8 | 49.5 | 33.5–38.7 | 21.91 |
| bio4 | Temperature seasonality | 528.5 ± 134.9 | 279.2 | 756.9 | 484.4–572.5 | 25.52 |
| bio5 | Max temperature of warmest month | 31.8 ± 2.1 | 24.5 | 34.4 | 31.1–32.5 | 6.55 |
| bio8 | Mean temperature of wettest quarter | 26.1 ± 2.3 | 20.2 | 29.3 | 25.3–26.8 | 9.01 |
| bio12 | Annual precipitation | 1449.2 ± 410.2 | 862.0 | 3207.0 | 1315.2–1583.2 | 28.31 |
| bio15 | Precipitation seasonality | 71.0 ± 14.3 | 19.2 | 99.2 | 66.4–75.7 | 20.12 |
| bio18 | Precipitation of warmest quarter | 585.6 ± 158.1 | 391.0 | 1128.0 | 534.0–637.2 | 26.99 |
| Climate Scenario | Current | SSP1-2.6 (2050s) | SSP1-2.6 (2070s) | SSP3-7.0 (2050s) | SSP3-7.0 (2070s) | Average a | Change b |
|---|---|---|---|---|---|---|---|
| Excellent | 4.0 | 3.5 | 2.9 | 3.4 | 5.0 | 3.7 | −8.5 |
| Good | 6.0 | 5.1 | 3.9 | 3.3 | 7.4 | 4.9 | −18.4 |
| Moderate | 8.5 | 6.9 | 7.8 | 7.2 | 8.4 | 7.6 | −11.0 |
| Fair | 8.2 | 7.3 | 10.1 | 9.0 | 8.1 | 8.6 | 5.2 |
| Poor | 9.3 | 7.6 | 13.3 | 10.6 | 9.9 | 10.4 | 10.8 |
| Not suitable | 925.6 | 931.4 | 923.8 | 928.2 | 922.9 | 926.6 | 0.1 |
Disclaimer/Publisher’s Note: The statements, opinions and data contained in all publications are solely those of the individual author(s) and contributor(s) and not of MDPI and/or the editor(s). MDPI and/or the editor(s) disclaim responsibility for any injury to people or property resulting from any ideas, methods, instructions or products referred to in the content. |
© 2025 by the authors. Licensee MDPI, Basel, Switzerland. This article is an open access article distributed under the terms and conditions of the Creative Commons Attribution (CC BY) license (https://creativecommons.org/licenses/by/4.0/).
Share and Cite
Xie, C.; Li, M.; Jim, C.Y.; Chen, R. Distribution Pattern of Endangered Cycas taiwaniana Carruth. in China Under Climate-Change Scenarios Using the MaxEnt Model. Plants 2025, 14, 1600. https://doi.org/10.3390/plants14111600
Xie C, Li M, Jim CY, Chen R. Distribution Pattern of Endangered Cycas taiwaniana Carruth. in China Under Climate-Change Scenarios Using the MaxEnt Model. Plants. 2025; 14(11):1600. https://doi.org/10.3390/plants14111600
Chicago/Turabian StyleXie, Chunping, Meng Li, C. Y. Jim, and Ruonan Chen. 2025. "Distribution Pattern of Endangered Cycas taiwaniana Carruth. in China Under Climate-Change Scenarios Using the MaxEnt Model" Plants 14, no. 11: 1600. https://doi.org/10.3390/plants14111600
APA StyleXie, C., Li, M., Jim, C. Y., & Chen, R. (2025). Distribution Pattern of Endangered Cycas taiwaniana Carruth. in China Under Climate-Change Scenarios Using the MaxEnt Model. Plants, 14(11), 1600. https://doi.org/10.3390/plants14111600